

Crypto World
85% Rally Possible Despite Criticism
The ASTER price has fallen nearly 70% from its post-launch highs, reflecting fading hype and rising criticism. User activity and trading volume seem to have collapsed even faster, raising doubts about its recovery.
Yet beneath this weakness, technical patterns and whale accumulation show a different picture. These signals suggest Aster may still attempt a major breakout despite the sharp decline in participation.
Aster User Activity and Trading Volume Collapse After Post-Launch Frenzy
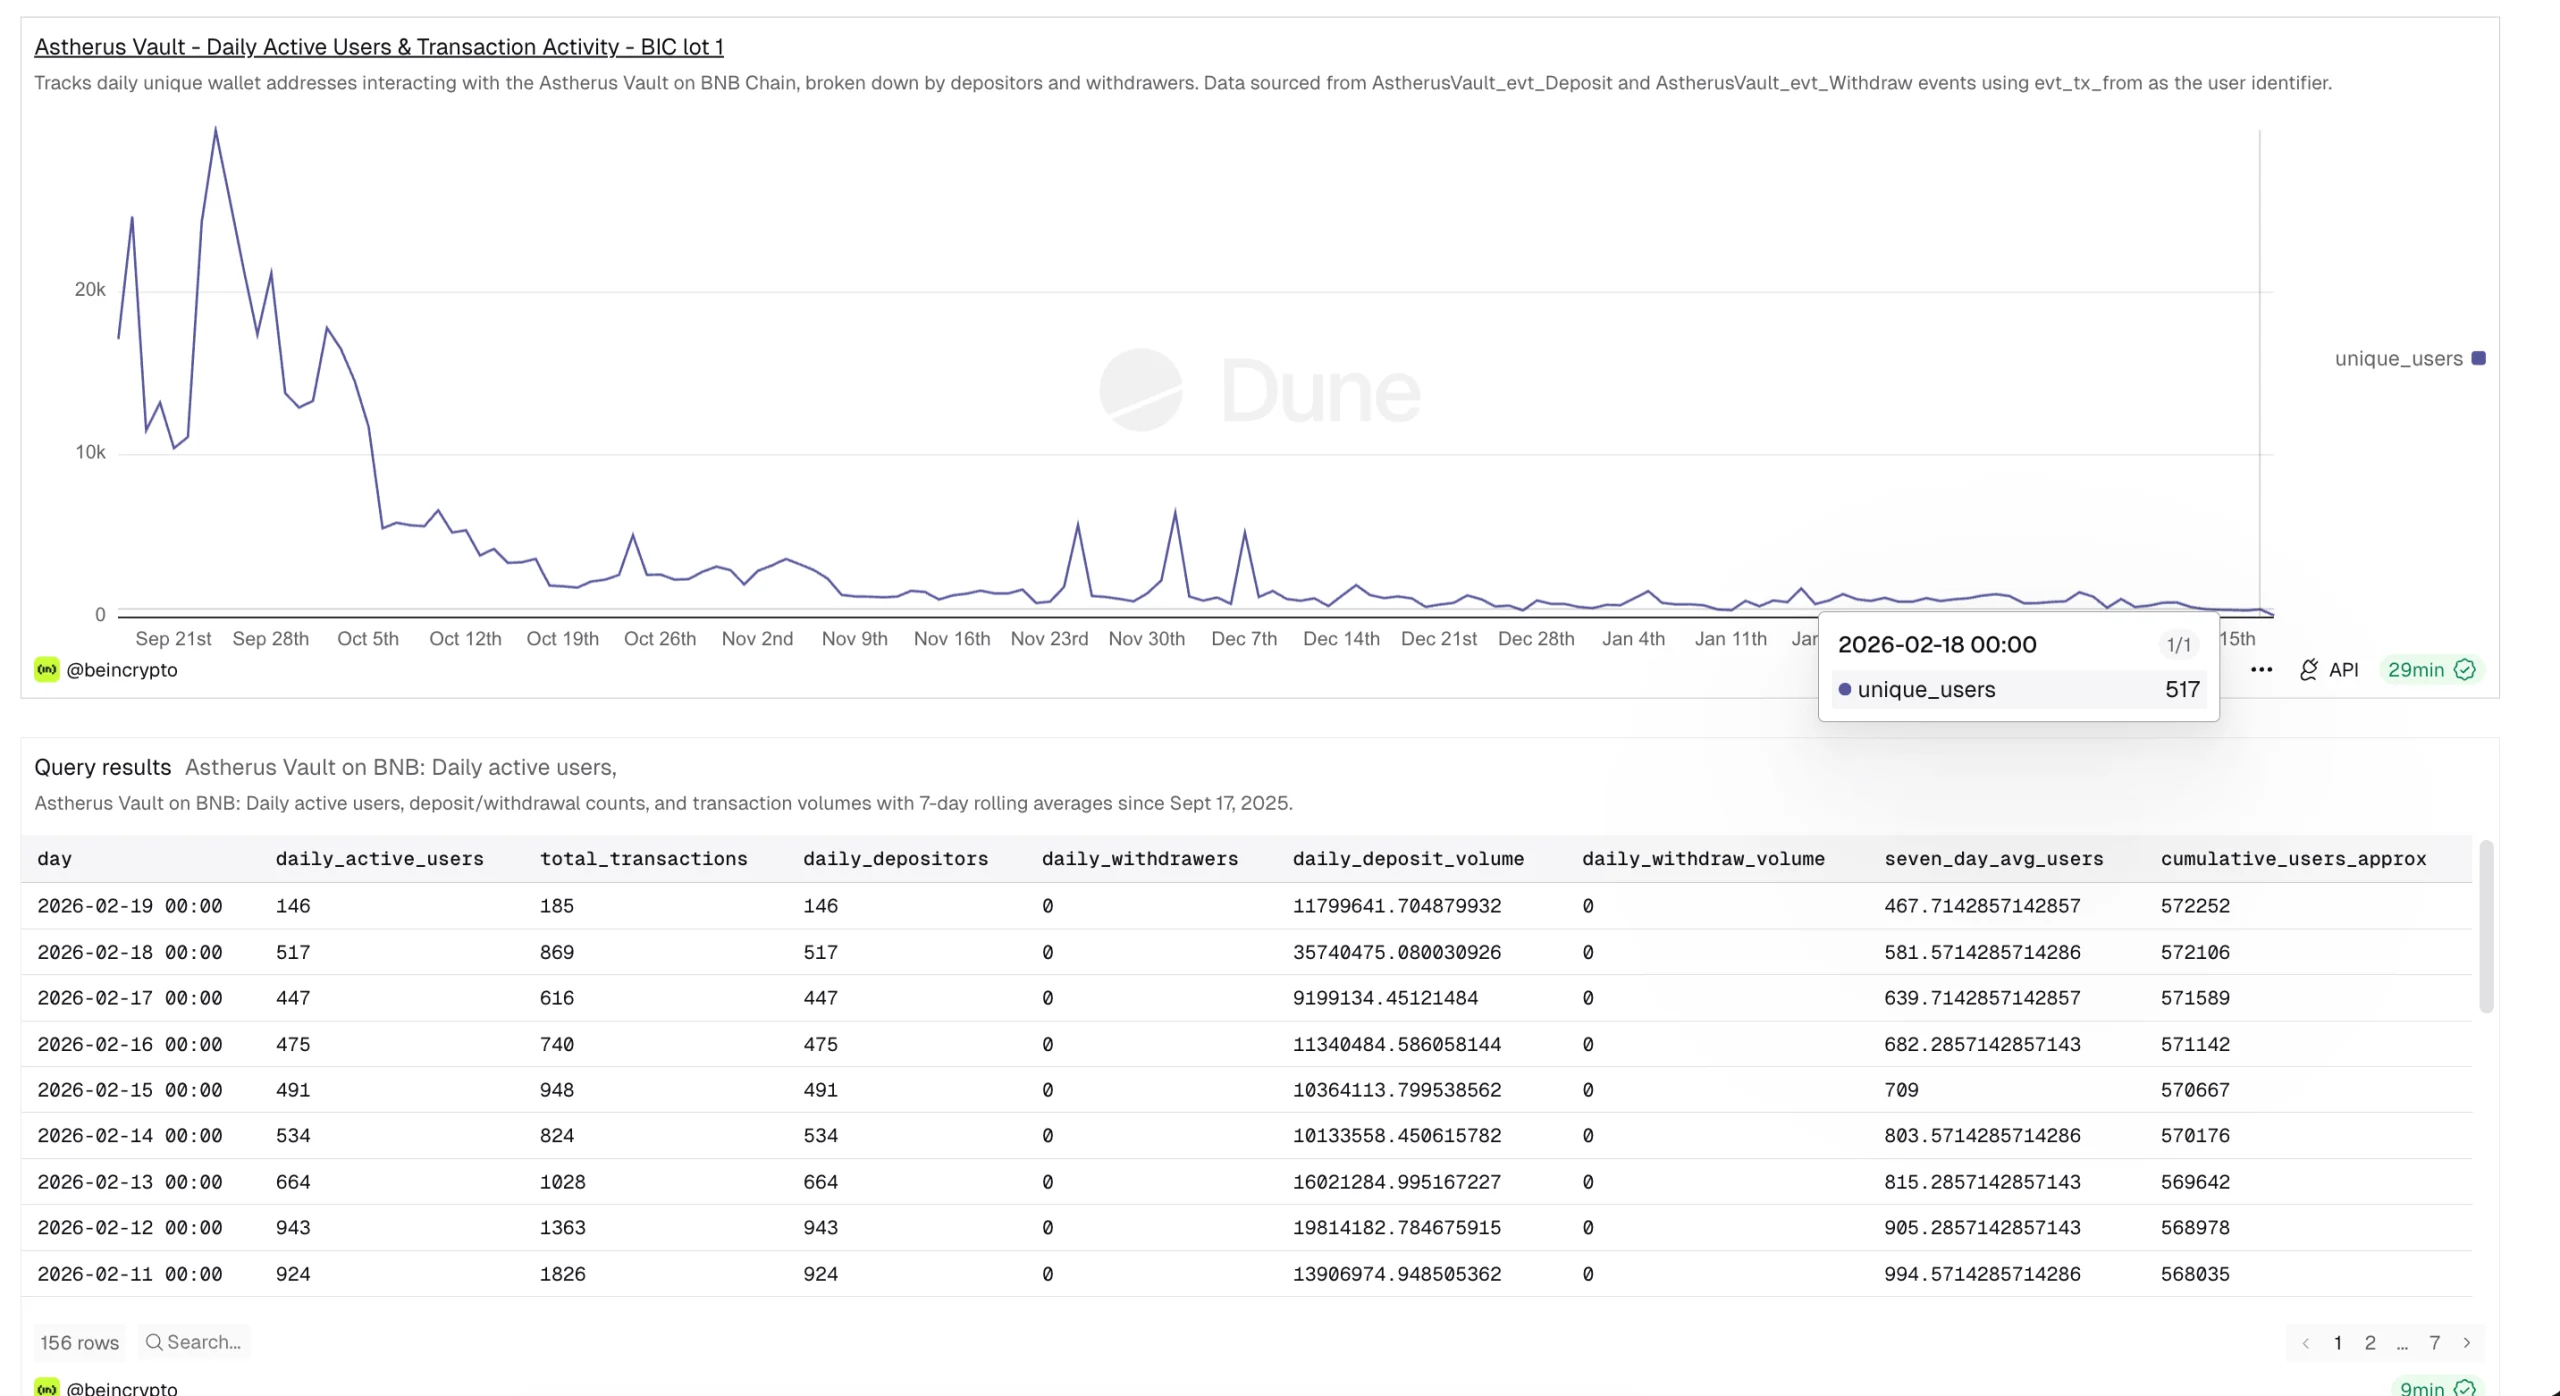
ASTER (formerly Astherus) has seen a dramatic collapse in user participation since its September 2025 token launch.
Daily active addresses interacting with the Astherus Vault on BNB Chain peaked at 29,062 on September 24. As of February 19, that number has fallen to just 146. This represents a 99.5% drop in daily active users.
Disclaimer: These figures reflect Astherus Vault deposit and withdrawal activity on BNB Chain specifically. Aster operates across BNB Chain, Ethereum, Solana, and Arbitrum, and total platform-wide trader activity — including perpetual and spot trading — is likely significantly higher than vault-only metrics suggest.
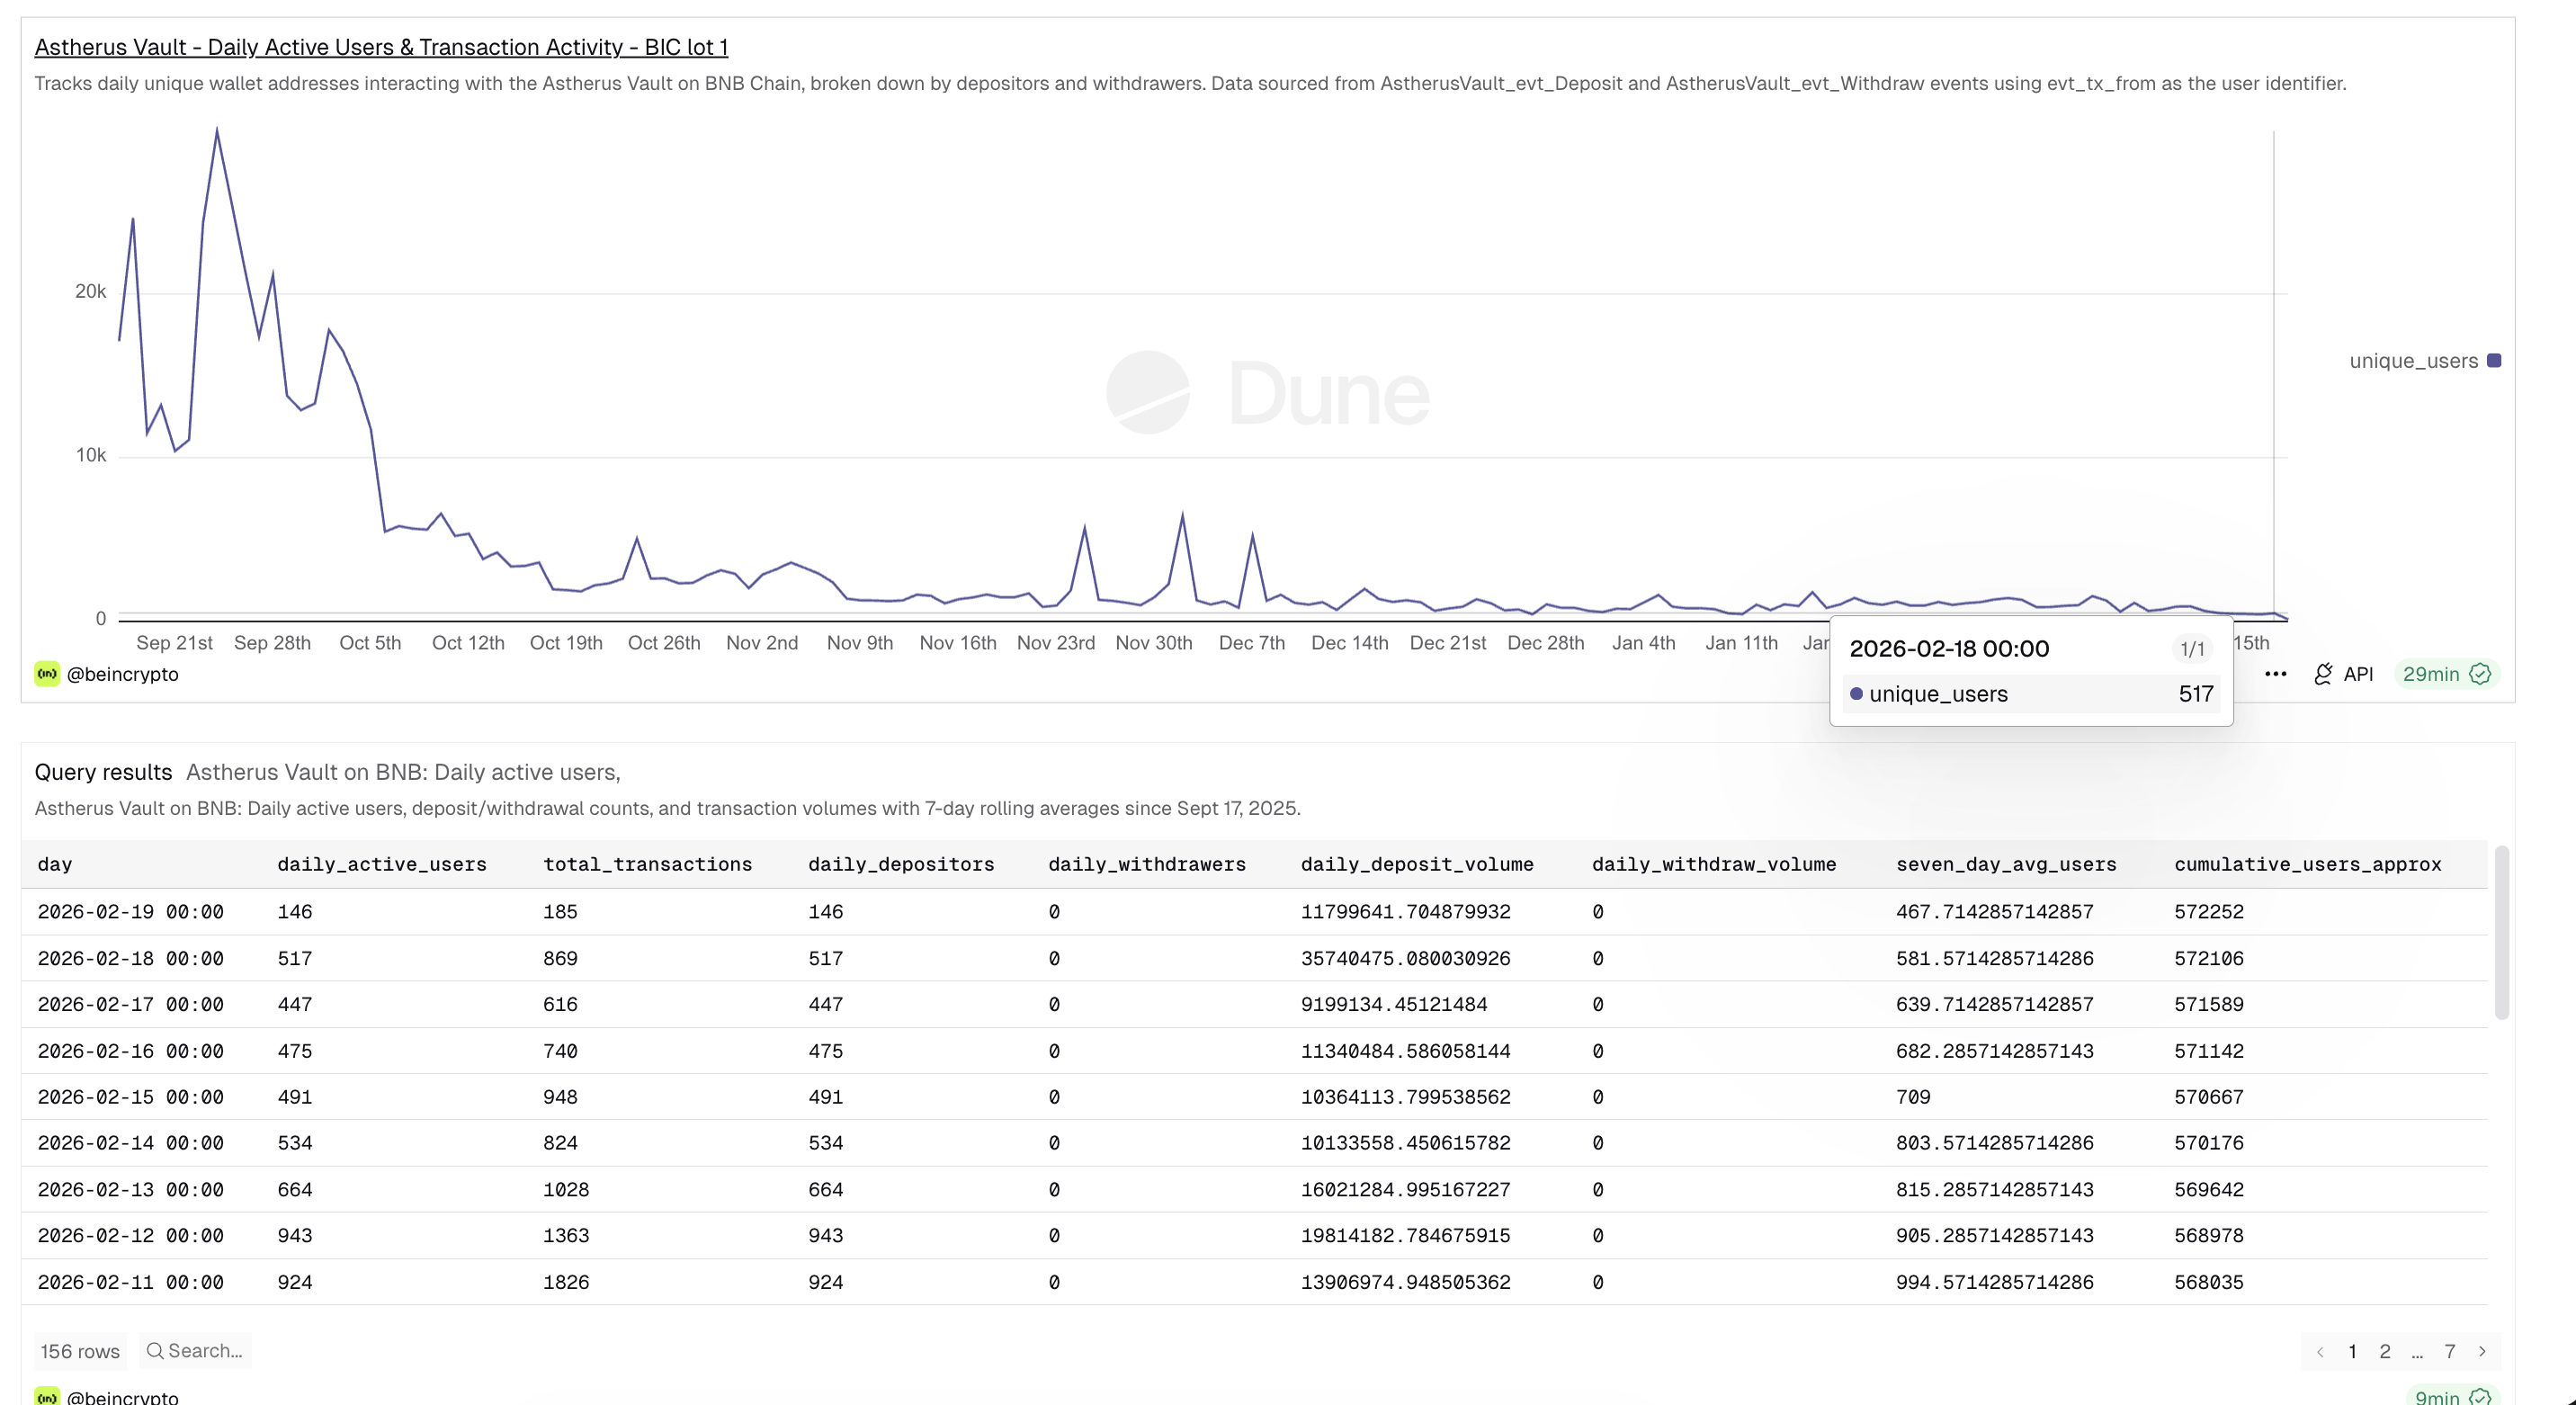
Trading activity has followed the same trend. Daily decentralized exchange volume on BNB Chain, per data pulled via Dune, has declined from a peak of $327.75 million to just $17.31 million.
This marks a 94.7% drop in trading volume. On-chain trading volume reflects real buying and selling happening on the blockchain. When it falls sharply, it shows reduced participation and weaker demand.
This collapse aligns with Aster’s price decline. The token is down about 70% from its $2.41 high reached shortly after launch. The drop reflects the end of a possible hype-driven phase.
However, the full picture is more complex. Cumulative unique addresses interacting with the protocol have continued rising, reaching 572,252. This shows new users are still entering the ecosystem, even as daily activity declines.
More importantly, the remaining users are committing large capital. On February 19, total deposits reached $11.8 million from just 146 wallets. This equals an average of about $80,000 per wallet. This shows that while retail participation has dropped, high-value investors remain active.
Additionally, daily withdrawals from the vault have remained at zero consistently since the TGE, indicating that while fewer users are depositing new capital, existing capital is not exiting the system.
Bullish Divergence and EMA Setup Show Early Reversal Signs
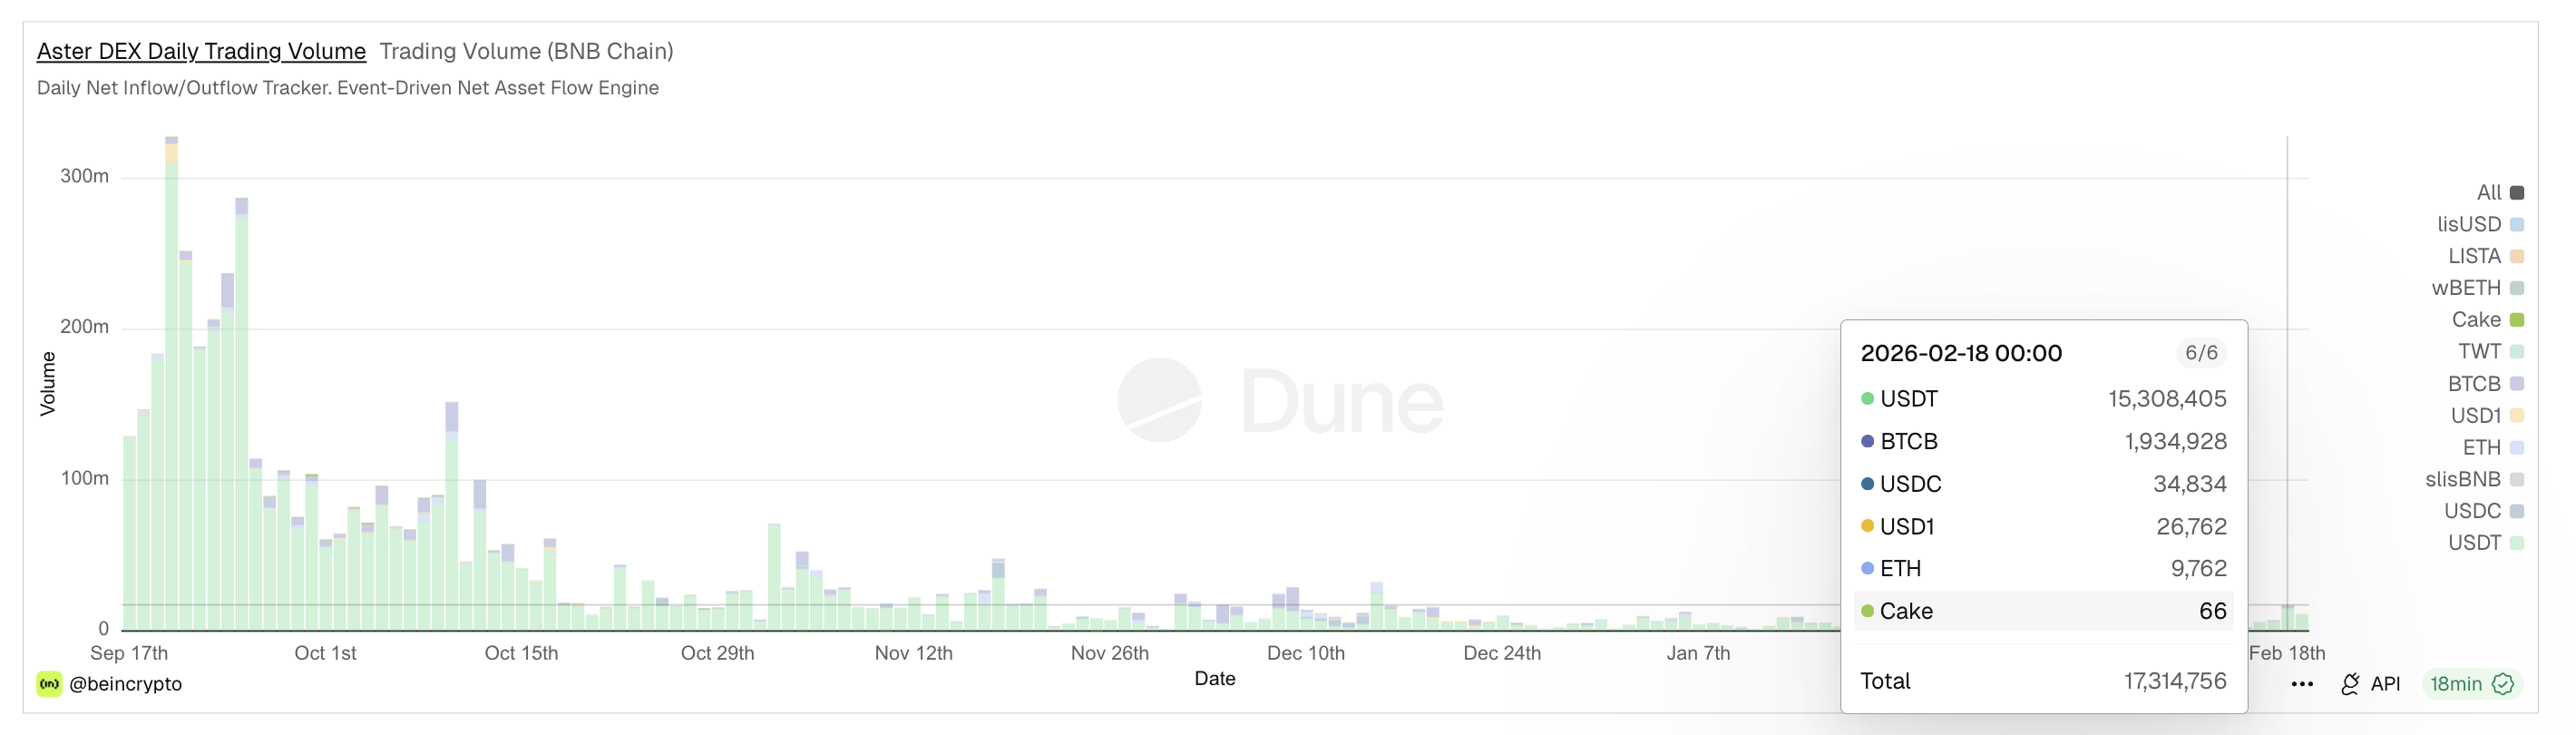
Despite the fundamental weakness, technical indicators show early signs of recovery. On the 12-hour chart, ASTER has formed a bullish divergence between December 7 and February 14. During this period, the price made a lower low. But the Relative Strength Index, or RSI, made a higher low.
RSI measures buying and selling strength on a scale from 0 to 100. When the price falls while the RSI rises, it indicates that selling pressure is weakening. This pattern often appears before a price recovery begins. Aster has not yet fully responded to this signal. This suggests the bullish pressure may still be building.
At the same time, the 20-period exponential moving average, or EMA, is approaching a bullish crossover above the 100-period EMA. EMA tracks the average price over time, giving more weight to recent prices. When shorter EMAs cross above longer ones, it signals strengthening momentum and a possible trend reversal.
The price is also forming an inverse head-and-shoulders pattern.
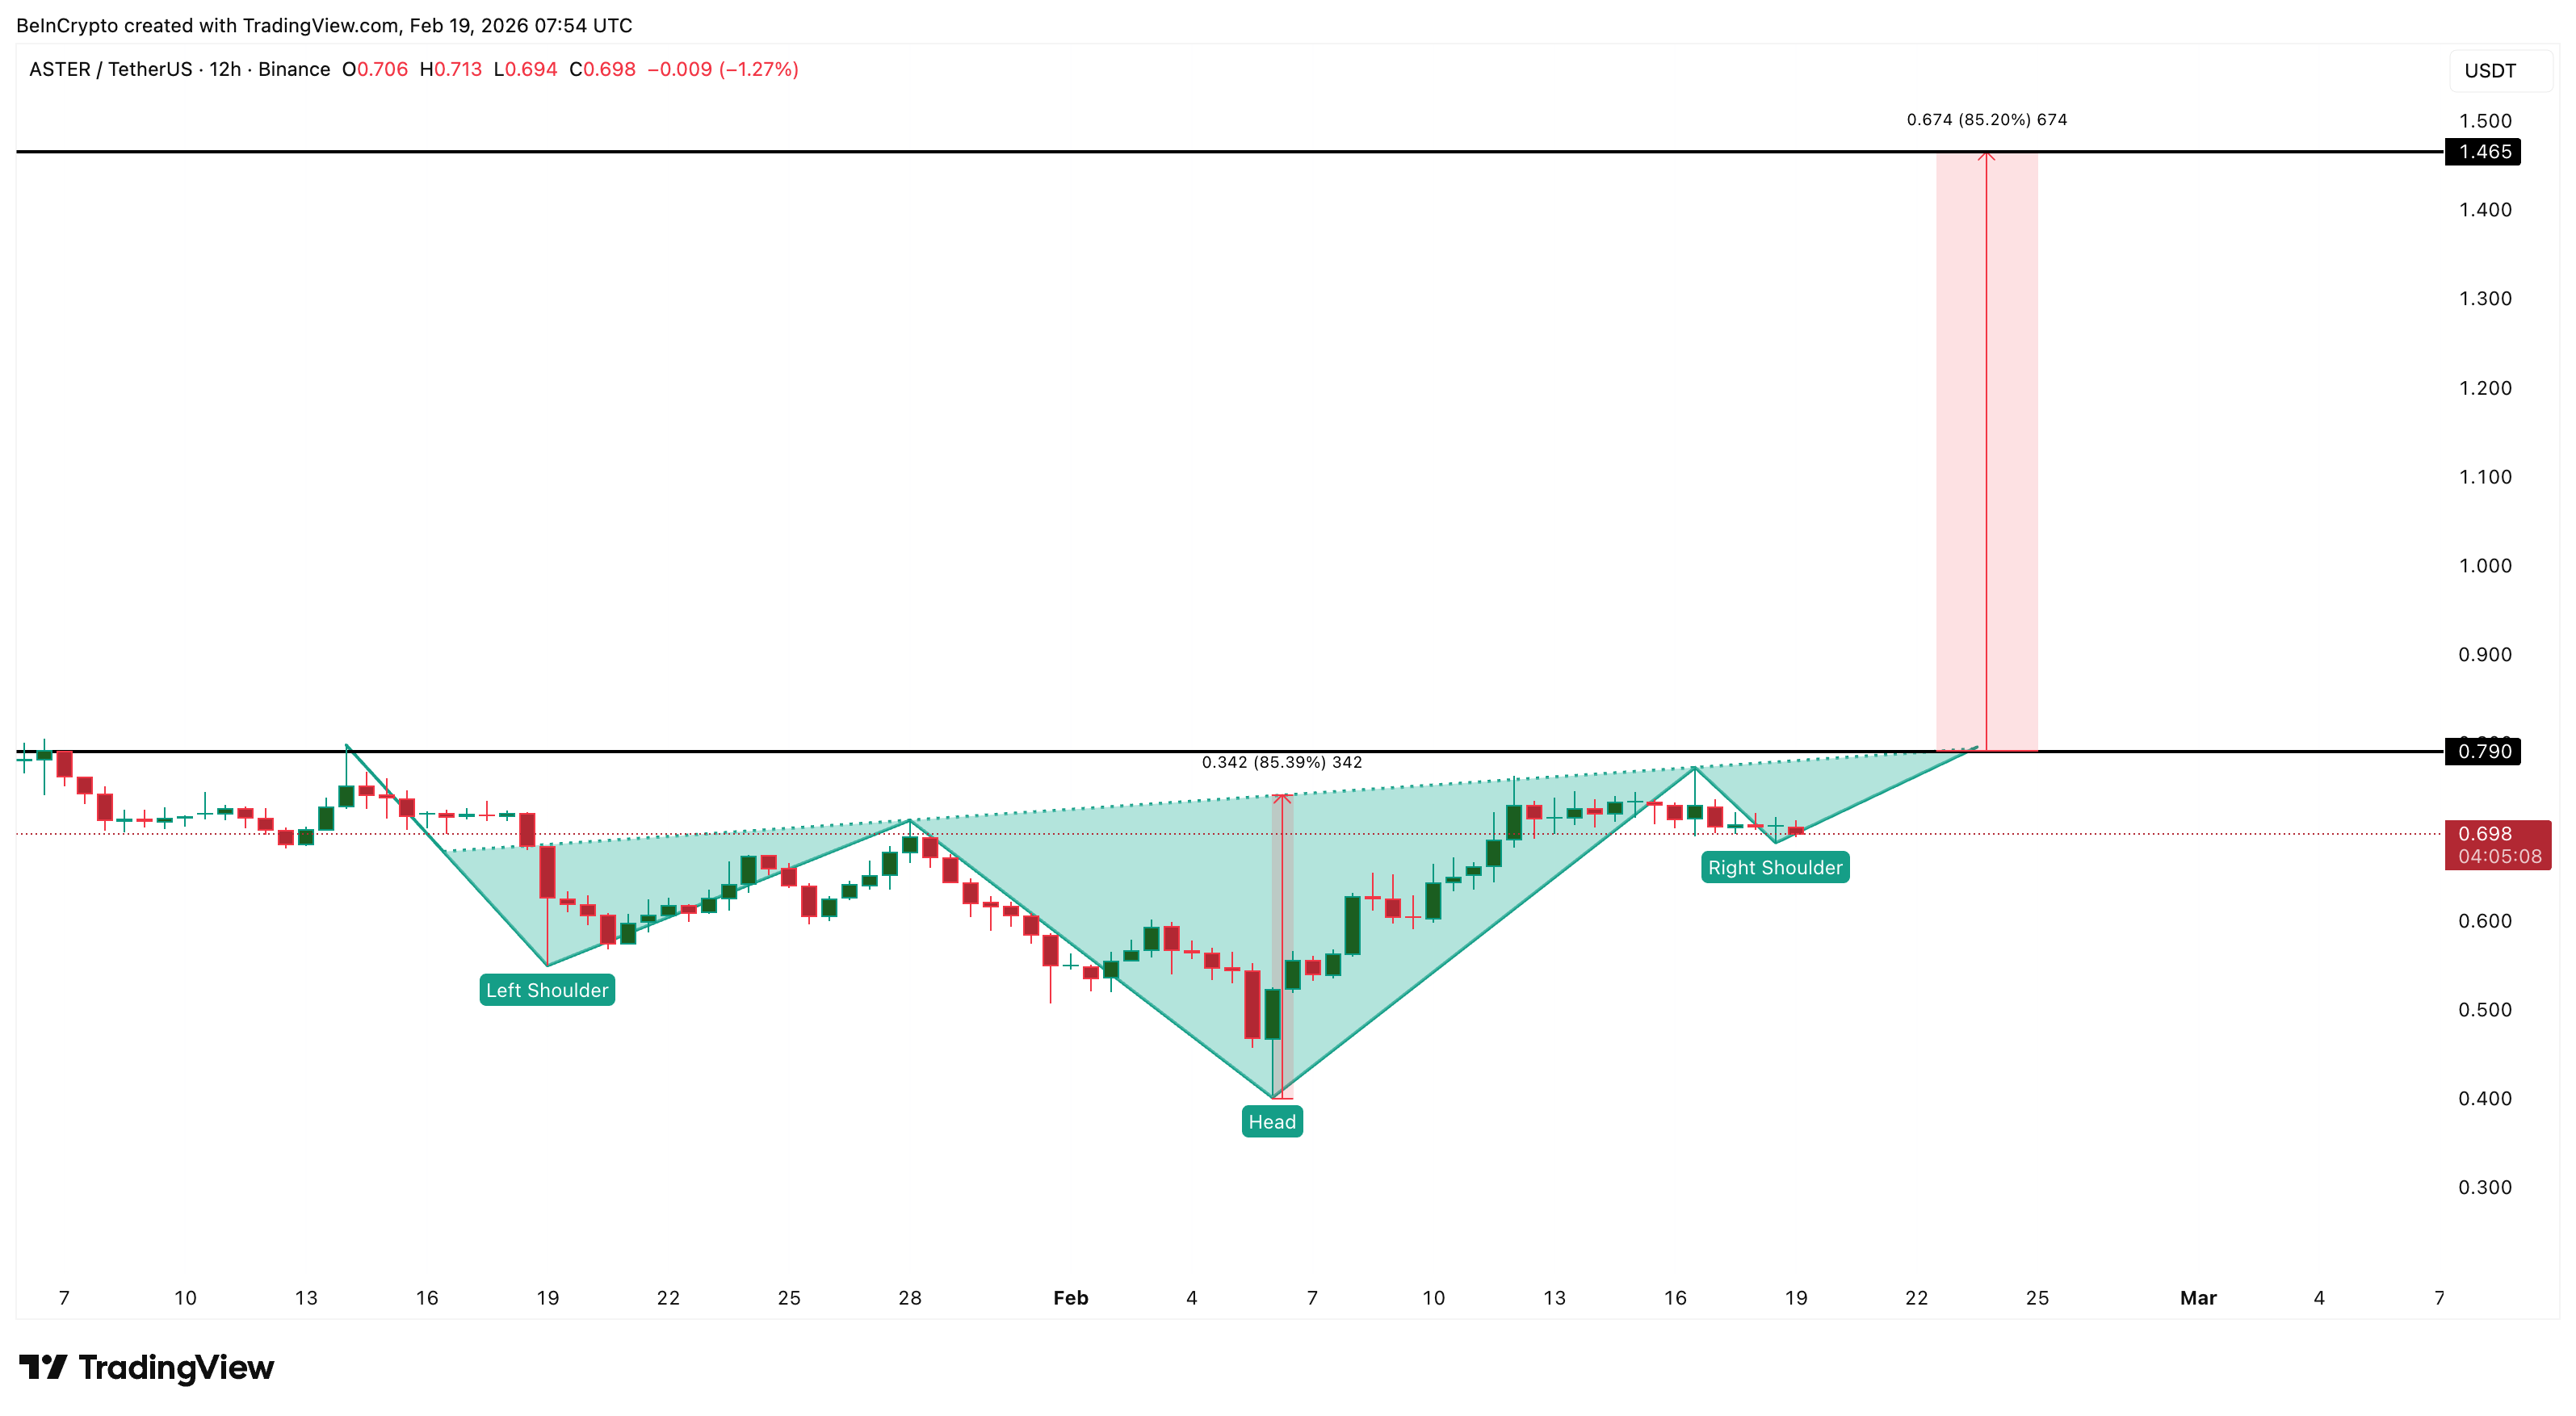
This is a bullish reversal structure showing buyers slowly gaining control. The neckline of this pattern sits near $0.79. A breakout above this level would confirm the recovery.
Whale Accumulation and Sentiment Collapse Create Opposing Forces
Large investors continue accumulating ASTER despite weak public sentiment. Wallets holding between 100 million and 1 billion ASTER have increased their holdings from 2.75 billion to 2.96 billion ASTER since early February. This steady increase shows strong confidence from the largest holders.
Mid-sized whales holding between 1 million and 10 million ASTER have also increased their holdings from 262.48 million to 278.96 million ASTER.
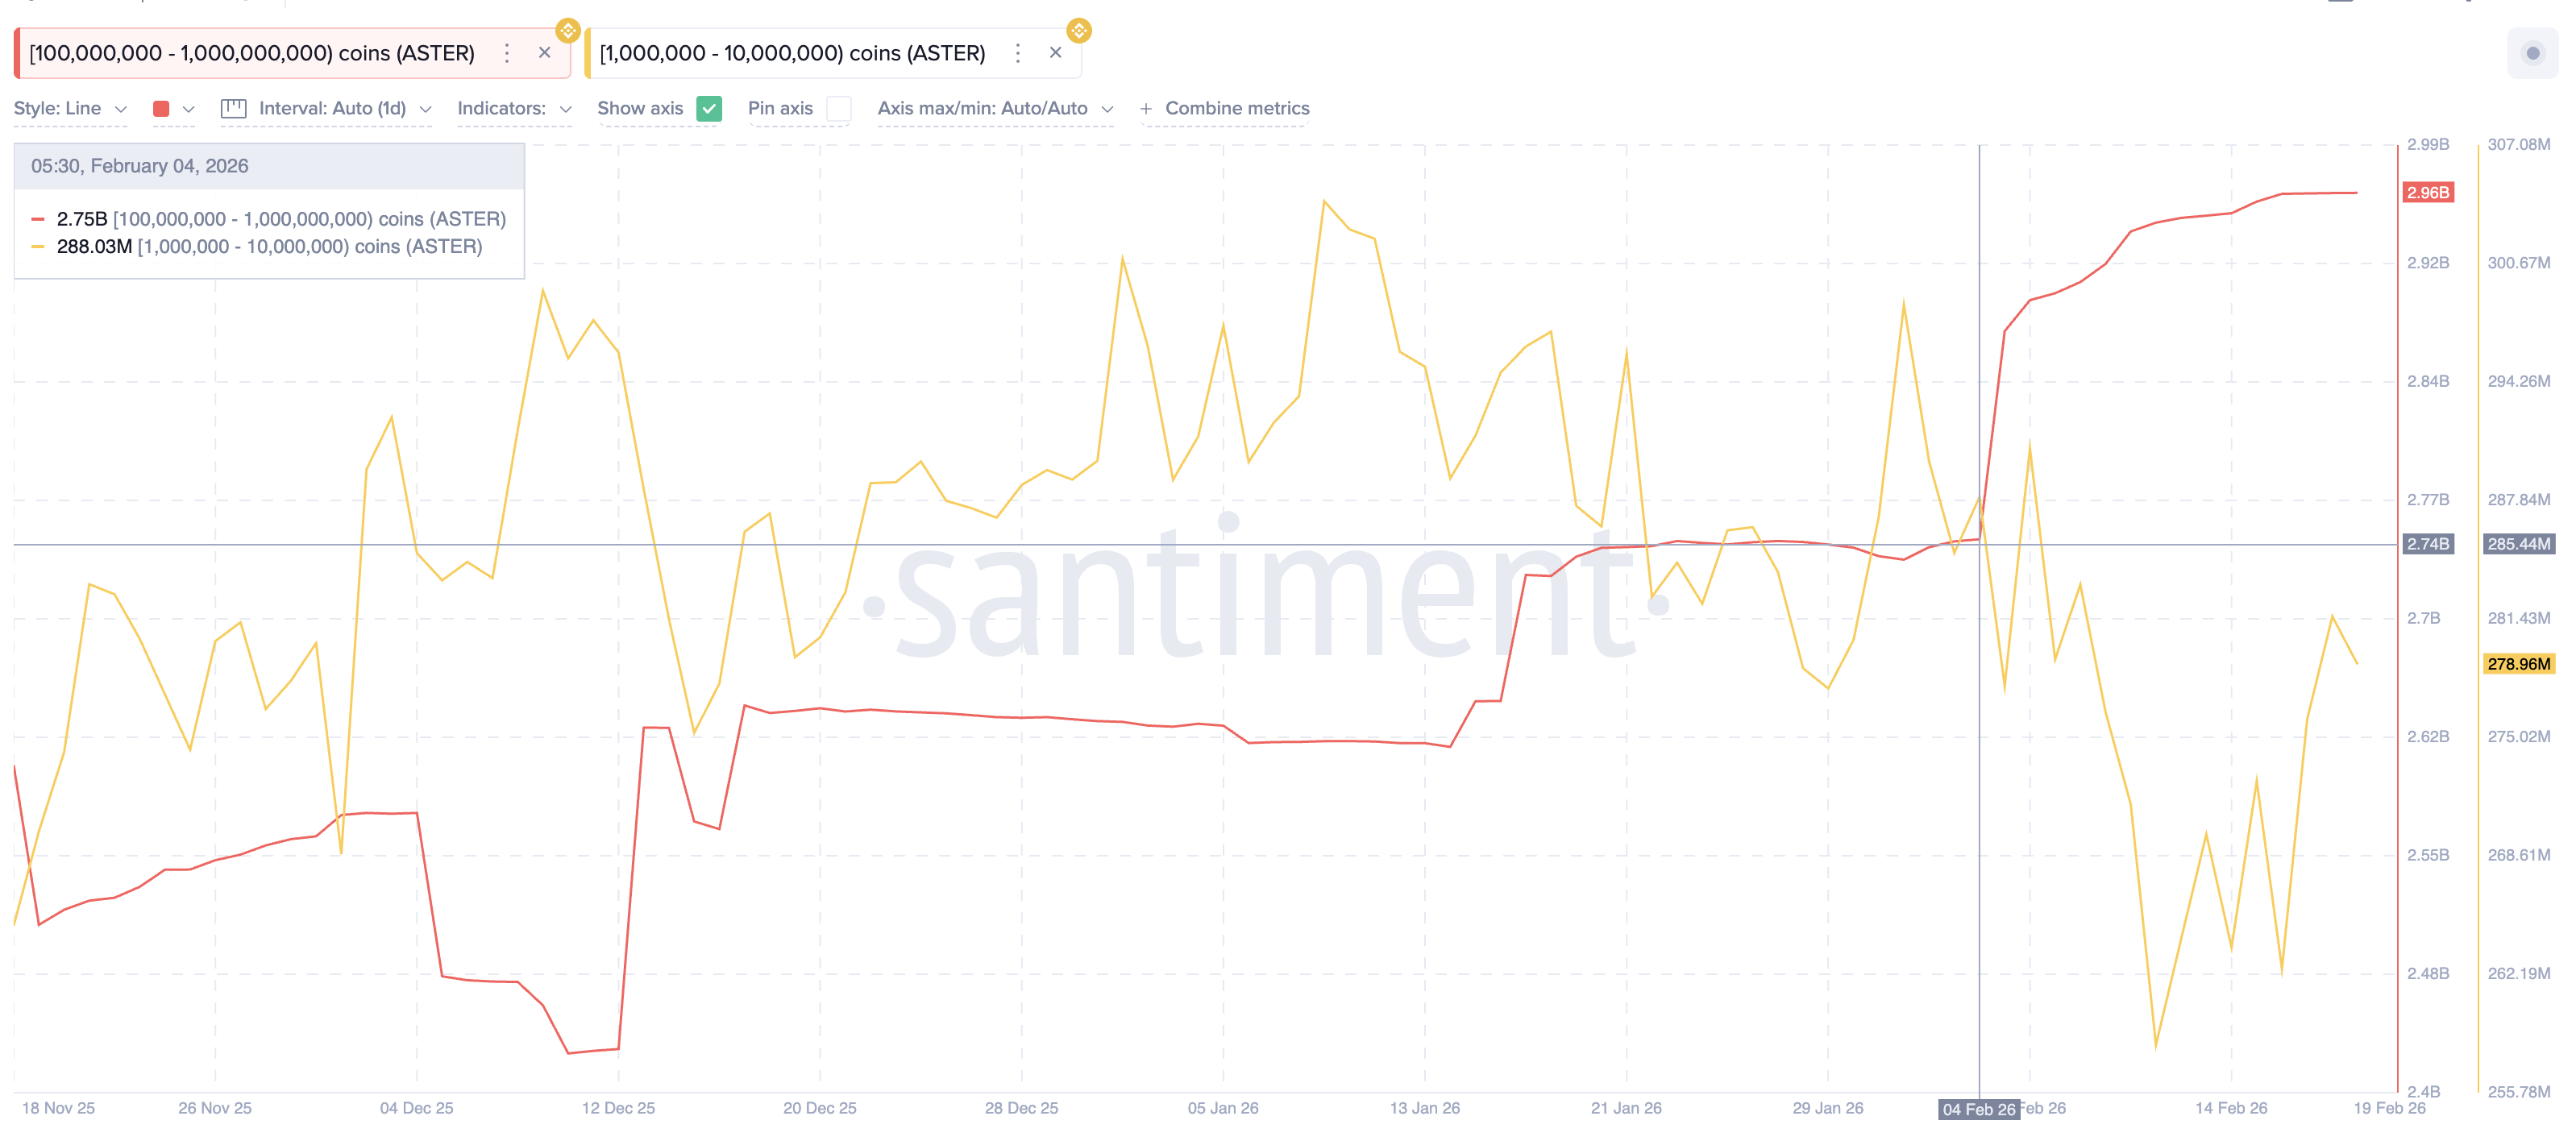
However, some of these smaller whales have recently started reducing positions slightly. This decline appears to be linked to the recent collapse in positive sentiment.
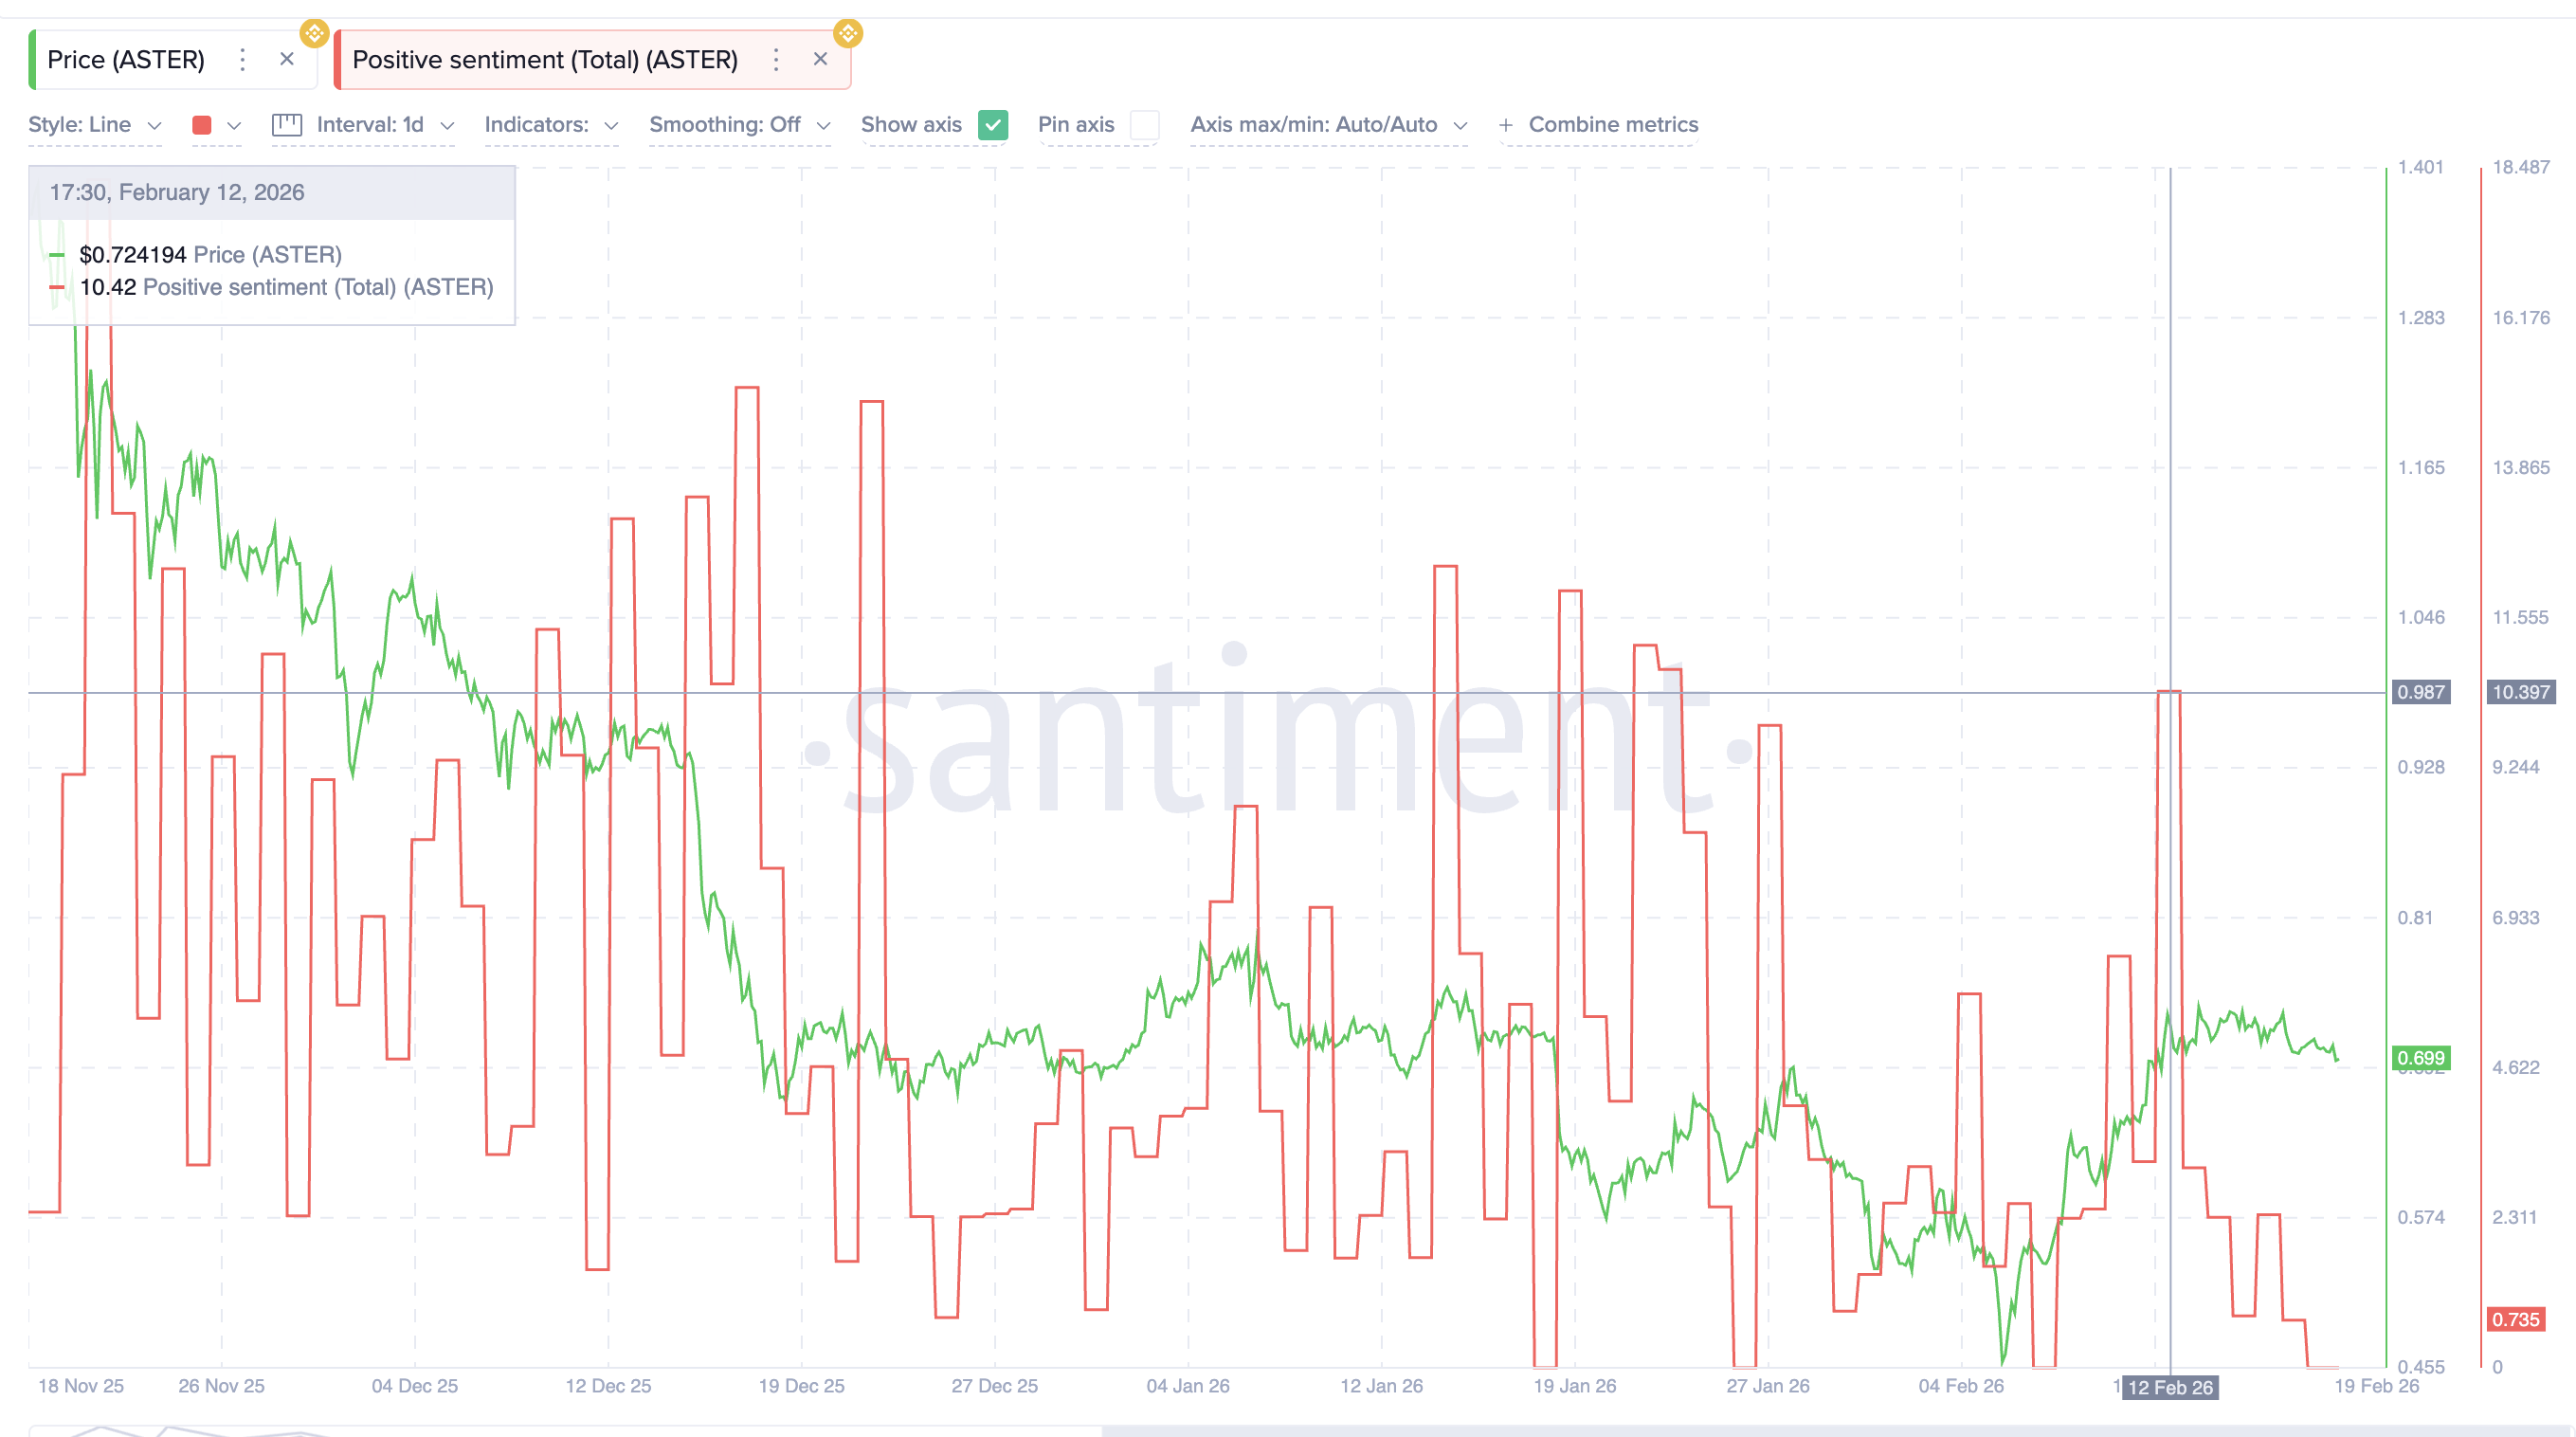
Market sentiment has dropped sharply. Positive sentiment scores fell from 10.39 on February 12 to near zero recently.
Want more token insights like this? Sign up for Editor Harsh Notariya’s Daily Crypto Newsletter here.
This reflects rising criticism and negative perception around Aster’s declining activity, which, based on available data, appears somewhat exaggerated but not entirely unfounded.
This creates a conflict in the market. Large whales continue accumulating, showing long-term confidence. But smaller investors are becoming more cautious as sentiment weakens. This divergence between whale behavior and public sentiment often appears near major turning points.
ASTER Price Levels That Could Trigger an 85% Breakout
The ASTER price now sits near a critical technical level. The neckline of the inverse head-and-shoulders pattern is located at $0.79. A breakout above this level would confirm the bullish reversal. If this breakout happens, the next resistance levels appear at $0.92, $1.06, and $1.29. The full breakout target sits near $1.46. This would represent an 85% rally from current levels.
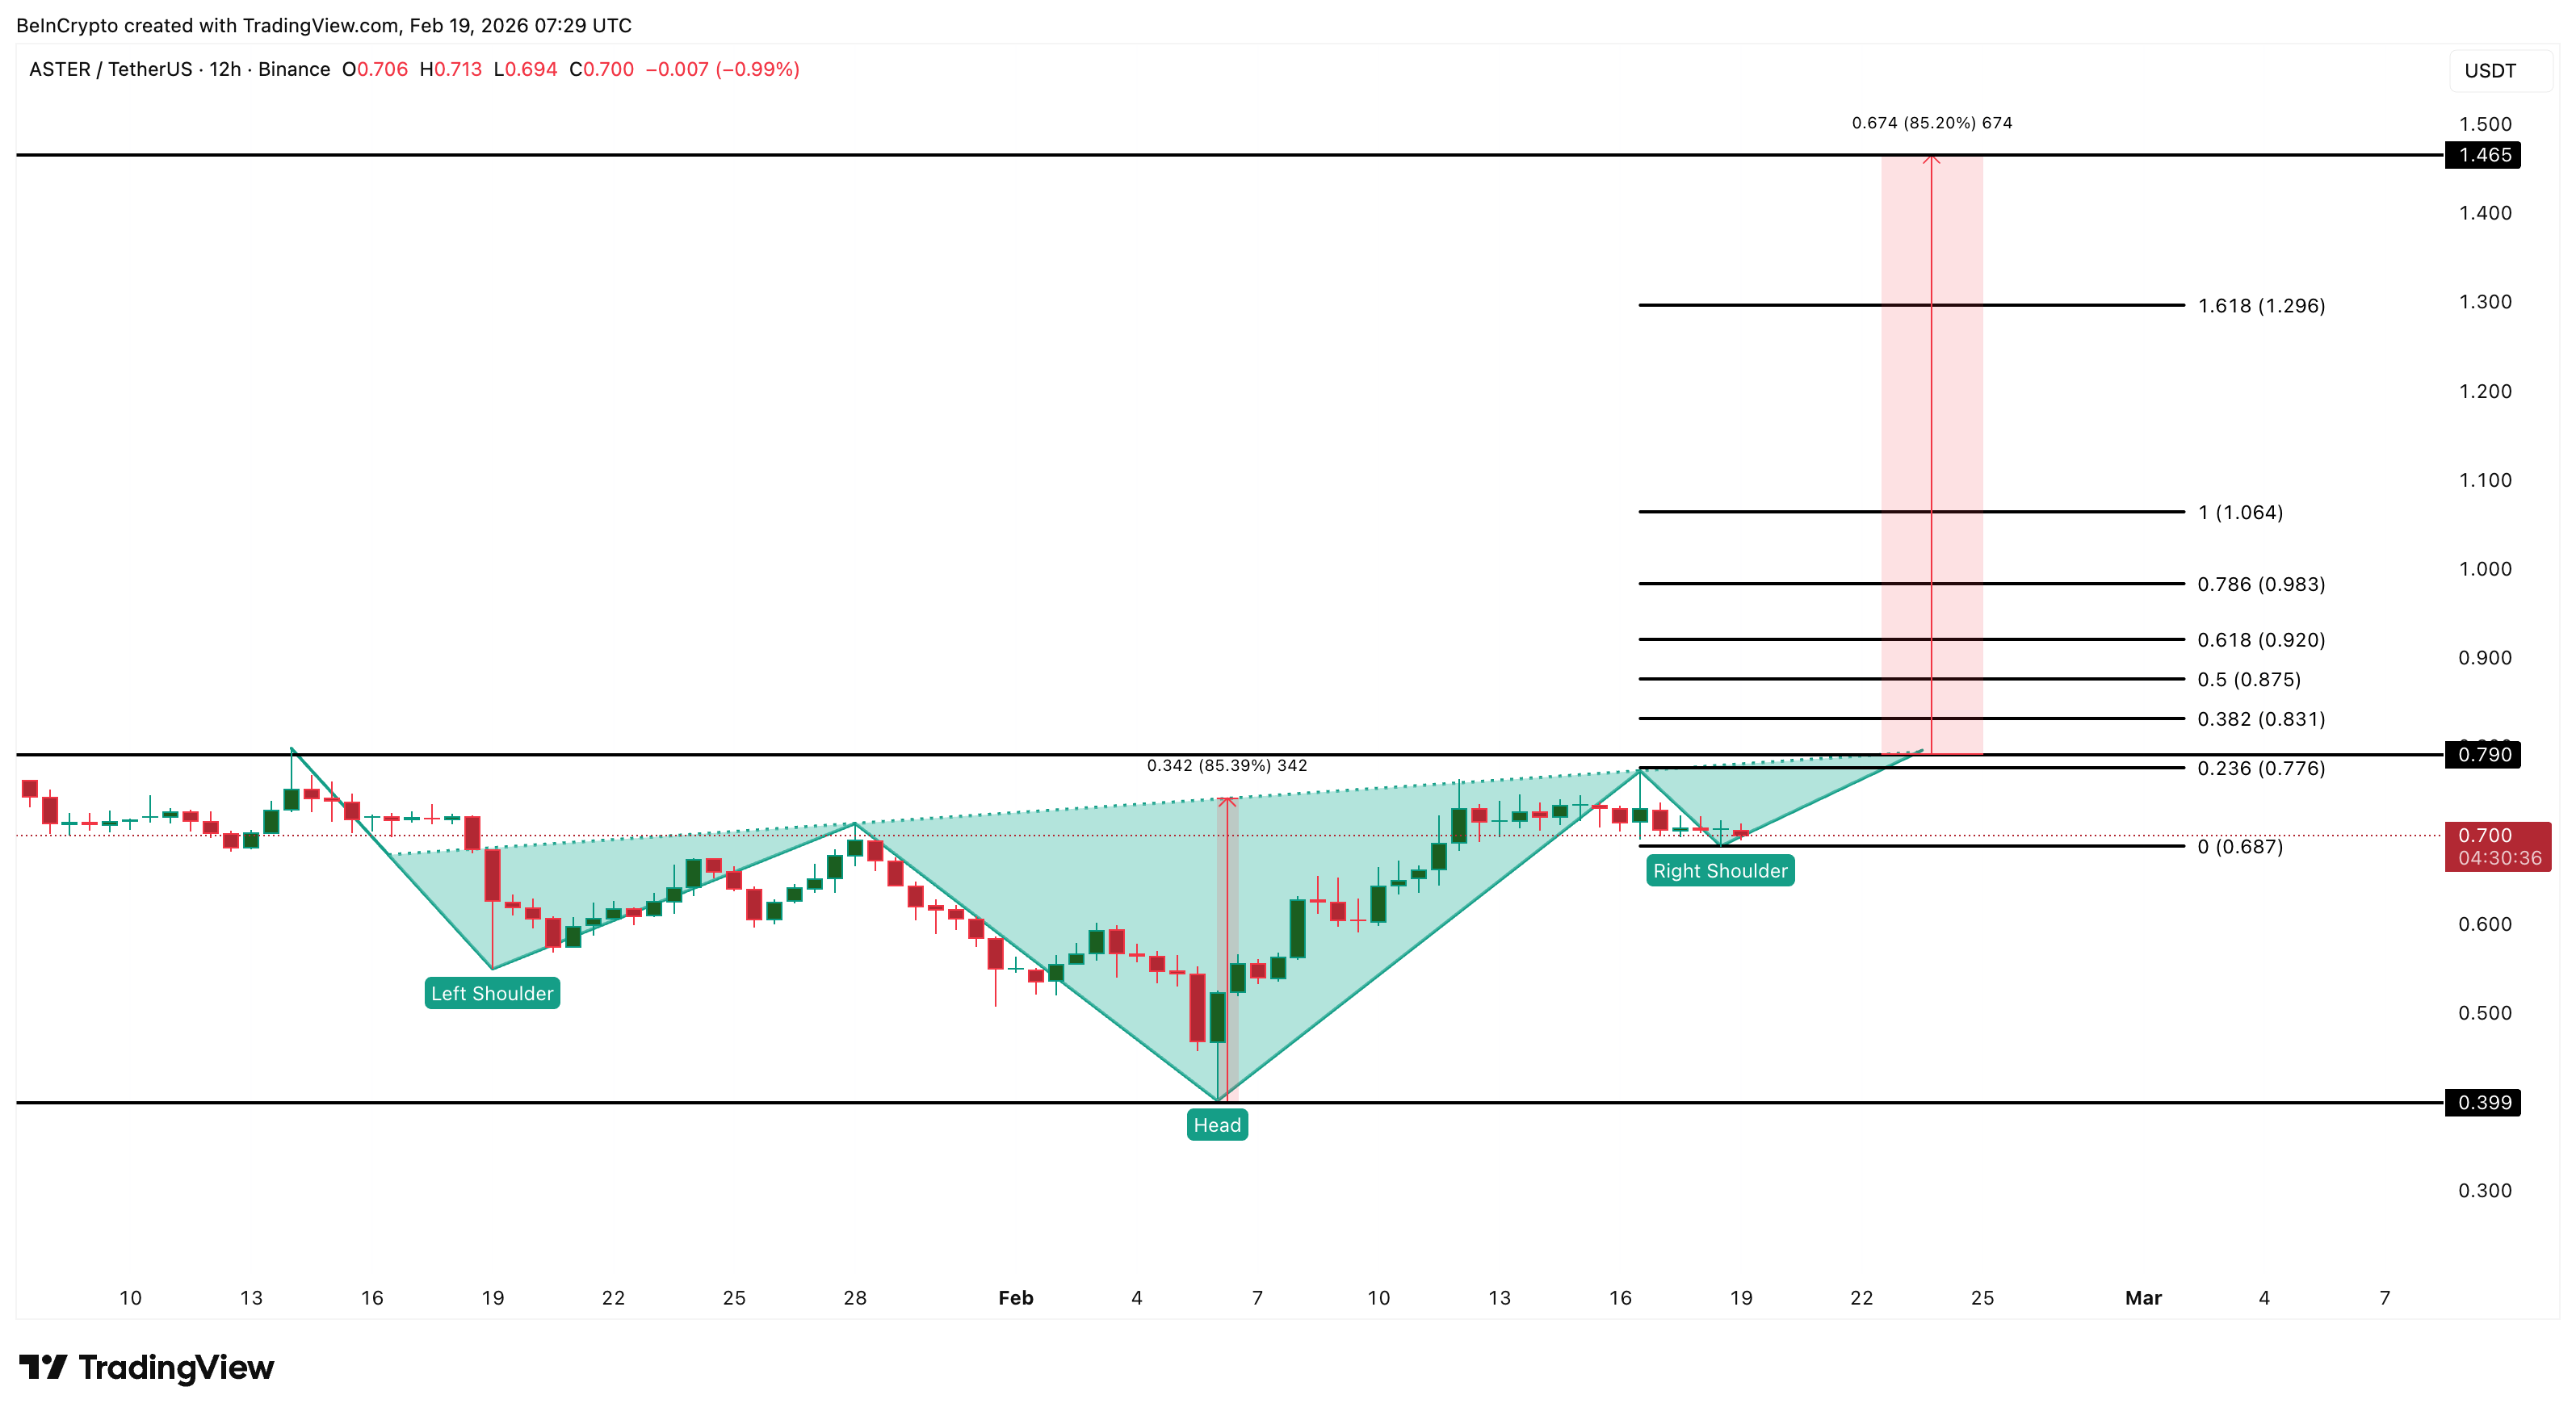
However, downside risks still exist. If Aster falls below $0.68, the bullish setup would weaken. A deeper drop below $0.39 would invalidate the pattern completely and confirm continued bearish pressure.
For now, Aster remains at a turning point. User activity and sentiment have collapsed sharply. But whale accumulation, bullish divergence, and reversal patterns suggest recovery remains possible. The next move above $0.79 or below $0.39 will likely decide Aster’s long-term direction.

Running a well-crafted prompt through Alibaba AI model KIMI can surface some eye-opening 2026 price scenarios for XRP, Shiba Inu, and Pepe.
According to Alibaba’s outlook, all three digital assets could generate substantial returns by New Year, perhaps much sooner than investors expect.
Below is a closer look at the projections and the logic behind them.
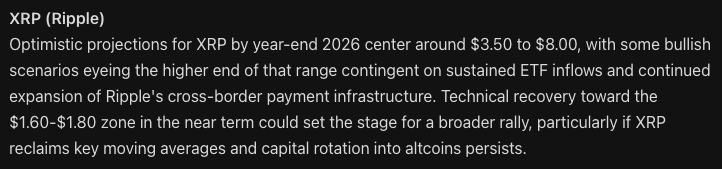
XRP ($XRP): Will Ripple’s Payments Solution Hit $8?
In a recent statement, Ripple once again emphasized that XRP ($XRP) sits at the heart of its strategy to position the XRP Ledger as a globally scalable, enterprise-grade payments infrastructure.

Thanks to near-instant transaction settlement and ultra-low fees, XRPL has also gained traction as a preferred blockchain for two of crypto’s fastest-expanding sectors: stablecoins and tokenized real-world assets.
With XRP currently changing hands around $1.41, Alibaba forecasts that the token could reach as high as $8 by the end of 2026, a sixfold increase from today’s levels.
Technical indicators appear to support this scenario. XRP’s recent support and resistance lines for a bullish flag, which could be a precursor to a major rally.
Potential tailwinds include accelerating institutional demand following the approval of U.S.-listed XRP exchange-traded funds, Ripple’s growing roster of enterprise partners, and the possible advancement of the U.S. CLARITY bill later this year.
Shiba Inu (SHIB): Alibaba Think SHIB Will Grow 850% by Christmas
Shiba Inu ($SHIB), launched in 2020 as a lighthearted alternative to Dogecoin, has since matured into a sizable crypto ecosystem with a market cap of $3.6 billion.
Currently trading around $0.000006187, Alibaba’s analysis suggests that a decisive breakout above resistance in the $0.000025 to $0.00003 range could trigger a strong upside move, potentially lifting SHIB to $0.000059 by year-end.
Such a rally would equate to approximately 850% gains from current prices and place SHIB just below its October 2021 ATH of $0.00008616.
Additionally, Shiba Inu has expanded well beyond meme status. Its Layer-2 network, Shibarium, delivers faster transactions, lower fees, added privacy features, and improved developer tools.
Pepe ($PEPE): Alibaba Examines a 2,200% Bull Case
Pepe ($PEPE), which debuted in April 2023, has grown into the largest meme coin outside the doge category, boasting a market capitalization of roughly $1.8 billion.
Drawing inspiration from Matt Furie’s “Boy’s Club” comics, PEPE’s instantly recognizable branding and cultural relevance have kept it highly visible across social media platforms.
Despite fierce competition in the meme coin arena, PEPE’s dedicated community, and the countless imitators it has spawned, have helped it remain a consistent leader within the sector.
Occasional cryptic posts from Elon Musk on X have further fueled speculation that PEPE could sit alongside DOGE and BTC among his personal holdings.
At present, PEPE trades near $0.0000042, roughly 85% below its December 2024 ATH of $0.00002803.
Under Alibaba’s most bullish assumptions, PEPE could surge by as much as 2,233%, climbing to approximately $0.000098 and decisively breaking its previous record.
Maxi Doge: A New Meme Coin Contender Steps Into the Spotlight
Limited by their size, PEPE and SHIB’s potential gains might be substantial, but they’re just short of explosive.
However, Maxi Doge ($MAXI) hasn’t even launched yet and it’s already one of the most talked-about meme coins of 2026, raising $4.6 million in its ongoing presale.
The project revolves around Maxi Doge, a brash, gym-obsessed, unapologetically degen character portrayed as a distant cousin and would-be rival to Dogecoin’s crown, capturing the raw, DGAF energy that defined the 2021 meme coin boom.
MAXI is an ERC-20 token on Ethereum’s proof-of-stake network, giving it a significantly smaller environmental footprint than Dogecoin’s proof-of-work design.
Early presale participants can currently stake MAXI tokens for yields of up to 68% APY, with rewards tapering as more users join the staking pool.
The token is $0.0002804 in the current presale stage, with automatic price increases programmed at each funding milestone. Purchases are supported via MetaMask and Best Wallet.
Stay updated through Maxi Doge’s official X and Telegram pages.
Visit the Official Maxi Doge Website Here
The post China’s Alibaba AI Predicts the Price of XRP, Shiba Inu and PEPE By the End of 2026 appeared first on Cryptonews.
Analysts told The Defiant that the move tests whether Optimism’s shared revenue model is sustainable in the long term.
Base’s decision to move away from the OP Stack to a unified software stack is raising questions about the long-term economics behind Optimism’s Superchain model.
The OP Mainnet, which is powered by the OP Stack, is currently the third-largest Ethereum Layer-2 by total value locked (TVL) at $1.84 billion, per L2beat.
OP, Optimism’s native token, is currently trading at around $0.14, down 26% over the past 24 hours, according to CoinGecko data. The sell-off followed a Wednesday, Feb. 18, blog post from Base – the Ethereum Layer-2 blockchain launched by Coinbase with a TVL of $3.8 billion – outlining plans to move away from Optimism’s software over the coming months.

Experts told The Defiant this move matters because Base is the biggest network using Optimism’s technology. If Base steps away, it raises doubts about whether the Superchain can keep growing its shared revenue over time.
Optimism’s Superchain Model
Under Optimism’s Superchain model, chains that join agree to share a small portion of their fees with the Optimism Collective, according to an official Optimism blog post from 2024. Specifically, each chain sends back either 2.5% of its chain revenue or 15% of its on-chain profits (after costs and gas fees), whichever is higher.
Because Base has been one of the busiest rollups, it was widely seen as one of the biggest contributors to this shared pool.
“Base moving away from the OP Superchain isn’t that surprising when you look at the incentives,” said Shresth Agrawal, CEO of Pod Network. “Base was reportedly contributing around 97% of the revenue, so at some point the ‘Superchain tax’ becomes hard to justify.”
Nicolai Sondergaard, a research analyst at Nansen, told The Defiant that Base was processing roughly four times more transactions than Optimism, generating about 144 times more decentralized exchange (DEX) volume, and producing 80 times more gas fees.
“The ~26% crash in OP (now around $0.14) is the market repricing the whole Superchain thesis,” Sondergaard added. “If Coinbase’s Base, the flagship OP Stack chain, is leaving to build their own stack, why would anyone else stay and share revenue?”
However, Agrawal said that the broader issue, in his opinion, is licensing. “The OP Stack became the default L2 framework partly because it embraced open-source norms,” Agrawal explained. “But fully permissive licenses make monetization difficult—large, well-distributed players can fork or internalize the stack without long-term revenue sharing.”
He pointed to alternatives such as business-style licenses (similar to Arbitrum’s early approach), which he said may be harder to adopt at first but could prove more commercially sustainable.
“Main Revenue Driver”
Meanwhile, Oxytocin, head of ecosystem at Umia and a former Optimism governance delegate, explained to the Defiant that rollup partnerships like Base are integral to Optimism’s long-term revenue narrative.
“While this revenue would go directly to the Foundation as opposed to a token-controlled treasury, the value accrued through these kinds of deals with rollups was one of the main proposed revenue drivers,” Oxytocin said. “The timing of this announcement will also impact the effectiveness of the recently proposed OP buyback scheme.”
In January, the Optimism Foundation proposed a buyback program that would use 50% of incoming Superchain revenue to purchase OP tokens starting sometime in February. The plan is meant to better align the token’s value with the growth of the Superchain ecosystem.
Moving Forward
The Defiant reached out to Optimism for comment and was redirected to an X post by Jing Wang, the CEO of OP Labs and Co-founder of Optimism. “This is a hit to near-term on-chain revenues,” Wang wrote on Feb.18. “But as cryptotwitter has been saying for ages, we needed to evolve our biz model.”
Wang added that the OP Stack remains the “most performant” and has “endured the most traffic in production,” regardless of Base’s fork. Data from DeFiLlama shows that the TVL in Optimism Bridge is $498 million, down sharply from its peak of around $5 billion in 2024.
In an official statement, Optimism said it was “grateful” for its three-year partnership with Base and that it will continue working with Base as an OP Enterprise customer “while they build out their independent infrastructure.”
The development also comes as Optimism is attracting new partners. On Wednesday, decentralized finance (DeFi) firm EtherFi said it plans to move its Cash accounts and card program from Scroll to Optimism’s OP Mainnet.
The move is expected to bring $160 million in TVL and more than 70,000 active cards to the network, The Defiant previously reported. Both companies described the move as a long-term partnership.
“While the recent news is a significant shakeup for many, I remain confident that OP Labs will be able to iterate on their value mission and continue attracting new members to the OP Stack, like the recent announcement from EtherFi,” Oxytocin concluded. “Optimism’s ethos has always been one of strong reflection and iteration, and they have proven many times in the past that they are able to re-align their roadmap as needed.”

Bitcoin is sculpting what could become a five-month red stretch, a pattern that would mark the longest losing run for the largest crypto asset since the 2018 bear market. With BTC down about 15% this month after four consecutive negative closes, traders are weighing whether March might bring a contrarian turn. Data from CoinGlass underscores the current malaise, while some analysts point to historical precedents suggesting a relief rally could follow a protracted drawdown. Yet others caution that the narrative this time could be structurally different, complicating parity between history and the present price action.
Key takeaways
- Bitcoin is on its fifth straight red monthly candle, placing it on the longest losing streak since 2018 if the pattern persists into March.
- Historical analogs show that multi-month declines have sometimes been followed by substantial rallies, with Milk Road suggesting as much as a 316% gain over the next five months if history repeats.
- A potential reversal could begin as early as April 1, according to an analyst-led interpretation of prior cycles.
- In 2022, BTC endured four consecutive red quarters, culminating in a 64% annual drawdown and a year-end close near $16,500 after opening near $46,230.
- Some market voices argue the current bear market is fundamentally different, pointing to RSI behavior and other indicators that diverge from prior cycles, complicating traditional bottoming expectations.
Tickers mentioned: $BTC
Sentiment: Neutral
Price impact: Neutral. While patterns hint at a possible rebound, no definitive price move is confirmed yet.
Market context: The Bitcoin narrative sits amid a broader backdrop of historic drawdowns, with weekly and quarterly signals suggesting a mixed path ahead. Analysts note that the current bear period may not mirror past cycles, even as the same asset class contends with macro and liquidity dynamics that shape risk appetite across crypto markets.
Why it matters
The persistence of downbeat monthly candles keeps a number of questions at the forefront for investors and builders alike. If Bitcoin’s streak ends in the near term, it could validate a patience-driven approach in a market where volatility remains a defining feature. The potential for a sizable rebound — should the cycle mirror past recoveries — would have implications for institutional engagement, risk management, and the development of on-chain infrastructure that often aligns with price cycles.
From a risk-management perspective, the divergence between monthly patterns and weekly or quarterly signals matters. While a five-month red run would align with the memory of 2018’s late-stage bear, the more nuanced pattern observed in 2022 — four red quarters culminating in a brutal annual drawdown — suggests that the bottoming process can be uneven and drawn out. This nuance is essential for traders who rely on calendar-based expectations, as opposed to a purely price-driven narrative. The discussion around whether the bear is structurally different adds another layer to how market participants interpret leverage, liquidity provisioning, and hedging strategies within the crypto ecosystem.
Analysts emphasize that a bottom is not a singular event but a process that unfolds across multiple timeframes. The contrast between longer, slower-moving monthly candles and shorter, more volatile weekly candles can produce whipsaws or false signals, challenging even seasoned traders. The current discourse also highlights how historical reference points can both illuminate potential paths and mislead when the fundamentals have shifted — for example, the RSI, a widely watched momentum indicator, is said to be at levels that resemble prior bear-market lows, which some observers interpret as either a cap on upside or a prelude to a reversal depending on the broader setup.
In practical terms, this means market participants should remain vigilant for changes in liquidity conditions, risk sentiment, and macro drivers that influence appetite for risk across crypto assets. The evolving narrative around whether this bear is “different” matters not just for price trajectories but for how developers, investors, and miners approach long-horizon planning, supply dynamics, and the deployment of new financial products tied to BTC exposure.
What to watch next
- Monitor April 1 as a potential pivot point if the historical pattern repeats, with attention to whether the fifth red month translates into a sustained rebound.
- Track weekly candle formations and RSI behavior for signs of a bottom or renewed downside pressure.
- Follow commentary around the notion that the current bear cycle is fundamentally different, to assess whether this changes risk management and capital allocation approaches.
- Observe any shifts in macro sentiment and liquidity that could influence BTC’s risk-on/risk-off dynamics in the near term.
Sources & verification
- CoinGlass data on Bitcoin’s fifth consecutive red month and the 15% monthly decline.
- Milk Road analysis and X post citing the potential 316% upside over the next five months if history repeats, with an April 1 timeframe mentioned.
- Historical quarterly performance in 2022 showing four red quarters and a 64% annual drawdown, as contextualized by on-chain and price-history analysis.
- Analyst commentary noting a potentially different bear market structure in 2026 relative to prior cycles, as discussed by market observers.
- Solana Sensei’s chart discussion focusing on Bitcoin’s weekly performance and the persistence of a five-candle streak.
Bitcoin’s latest drawdown and what it changes
Bitcoin (CRYPTO: BTC) finds itself at a crossroads as a fifth consecutive monthly red candle looms, a scenario that would mark the longest such streak since the 2018 downturn. CoinGlass’s data frames the cue: BTC has declined around 15% this month after finishing the four preceding months in the red. The most notable parallel in recent history is the 2018 bear, a period that preceded a protracted decline before a multi-times rally years later. This context frames the current debate: are we approaching a traditional bear-market bottom, or is this cycle signaling a new regime with different dynamics?
Within this debate sits a striking counterpoint from Milk Road, which highlighted that prior episodes of extended debits often culminated in powerful rallies. The analysis notes a potential 316% gain in the subsequent five months if the pattern repeats, with an initial pivot anticipated around early April. While such projections draw on historical analogs, they do not guarantee future outcomes, and market participants remain mindful of the speed and scale of moves that can occur in crypto markets. The possibility of a rapid reversal exists, but it is contingent on a confluence of favorable conditions that historically have proven elusive to time with precision.
The 2022 bear period adds another layer of caution. That year, BTC endured four consecutive red quarters, culminating in a total drawdown of roughly 64% as the price collapsed from a starting point near $46,230 to around $16,500 by year-end. The stark difference between that season and the present has led some to question whether history offers a reliable playbook for all cycles. In a broader sense, the bear narrative for 2026 has permeated analysis, with voices warning that a similar stretch could push prices toward new lows if macro and liquidity conditions deteriorate further. One linked discussion even imagines a scenario where the decline might extend below the 15-month support band near $60,000, underscoring the potential for further downside if selling pressure intensifies.
Within the microstructure, weekly performance has drawn the attention of traders as well. A well-known analyst in the space highlighted that Bitcoin printed its fifth consecutive weekly down candle, marking the longest such streak since 2022 and positioning it as the second-longest losing run on record. The 2022 period saw nine red weeks and a descent to around $20,500, illustrating how abrupt and protracted declines can be, even after substantial drawdowns. The interplay of monthly, weekly, and quarterly signals underscores the challenge of diagnosing a bottom with a single timeframe in mind and highlights the risk of misreading the onset of a durable recovery.
Beyond the numbers, a divergence in narrative is shaping market sentiment. Veteran analyst Sykodelic argues that the current bear phase is fundamentally different from earlier cycles, pointing to the monthly RSI having already touched levels associated with prior bear-market lows in 2015 and 2018. The assertion is that the absence of a classic overbought expansion in the bull phase can complicate expectations of symmetric contractions. In other words, traders may be dealing with a regime where the typical playbook fails to capture the full complexity of price action, making caution and disciplined risk management all the more important as the market tests key psychological and technical thresholds.
All of this occurs as broader market narratives evolve around risk tolerance and the appetite for crypto exposure. The tension between potential upside and the risk of renewed downside remains a core feature of the current price environment. For market participants, the central question is whether the repeated red candles are signaling a deeper pattern or simply a fraught interim phase that could resolve in a relatively swift re-pricing if buyers step back in with confidence. The answer will likely hinge on a mix of on-chain signals, liquidity conditions, and macro developments that influence whether BTC can sustain any rally beyond a few weeks or months.
What to watch next
- April 1 as a potential inflection point if the historical pattern repeats, with close attention to price action in the days that follow.
- Confirmation signals from weekly candles and RSI stabilization, which could indicate a bottoming process even amid ongoing volatility.
- Shifts in risk sentiment and liquidity that may tilt BTC toward a risk-on or risk-off regime in the near term.
Key takeaways:
-
Professional traders are paying a 13% premium for downside protection as Bitcoin struggles to maintain support above $66,000.
-
While stocks and gold remain strong, $910 million in Bitcoin ETF outflows suggest that institutional investor caution is rising.
Bitcoin (BTC) price entered a downward spiral after rejecting near $71,000 on Sunday. Despite successfully defending the $66,000 level throughout the week, options markets reflect growing fear as professional traders avoid downside price exposure.
Even with relative strength in the stock market and gold prices, traders seem to be effectively betting on a $60,000 retest rather than overreacting to Bitcoin price dips.

Bitcoin put (sell) options traded at a 13% premium relative to call (buy) instruments on Thursday. Under neutral conditions, the delta skew metric typically ranges between -6% and +6%, indicating balanced demand for upside and downside strategies. The fact that these levels have been sustained over the past four weeks shows that professional sentiment is leaning heavily toward caution.

This bearish bias is clear in the neutral-to-bearish positioning seen in Bitcoin options. According to Laevitas data, the bear diagonal spread, short straddle and short risk reversal were the most traded strategies on the Deribit exchange over the past 48 hours.
The first lowers the cost of the bearish bet because the short-term option loses value faster, while the second maximizes profit if Bitcoin price barely moves. The short risk reversal, on the other hand, generates profit from a downward move with little to no upfront cost, but it carries unlimited risk if the price spikes.
Weak institutional demand for Bitcoin ETFs fuels discontent
To better gauge the risk appetite of traders, analysts often look at stablecoin demand in China. When investors rush to exit the cryptocurrency market, this indicator usually drops below parity.

Under neutral conditions, stablecoins should trade at a 0.5% to 1% premium relative to the US dollar/Yuan exchange rate. This premium compensates for the high costs of traditional FX conversion, remittance fees and the regulatory friction caused by China’s capital controls. The current 0.2% discount suggests moderate outflows, though this is an improvement from the 1.4% discount seen on Monday.
Part of the current discontent among traders can be explained by the lackluster flows in Bitcoin exchange-traded funds (ETFs), which serve as a proxy for institutional demand.
Related: Bitcoin ETFs still sit on $53B in net inflows despite recent outflows–Bloomberg

US-listed Bitcoin ETFs have seen $910 million in total outflows since Feb. 11, which likely caught bulls off balance, especially as Bitcoin traded 47% below its all-time high while gold prices hovered near $5,000, up 15% in just two months. Similarly, the S&P 500 index sat only 2% below its own all-time high, indicating that this risk-aversion is largely restricted to the cryptocurrency sector.
While Bitcoin options signal a fear of further downside, traders are likely staying extremely cautious until a clear rationale for the crash to $60,200 on Feb. 6 finally emerges.
This article does not contain investment advice or recommendations. Every investment and trading move involves risk, and readers should conduct their own research when making a decision. While we strive to provide accurate and timely information, Cointelegraph does not guarantee the accuracy, completeness, or reliability of any information in this article. This article may contain forward-looking statements that are subject to risks and uncertainties. Cointelegraph will not be liable for any loss or damage arising from your reliance on this information.
Crypto World
Ethereum Foundation Flags Post-Quantum Security as Core Priority in 2026 Protocol Roadmap


Ethereum developers plan major protocol changes in 2026, combining scaling, security hardening, and UX improvements following last year’s network upgrades.
The Ethereum Foundation said it will prioritize post-quantum security and further increases to the gas limit as part of its protocol roadmap for 2026.
The organization is also restructuring its development efforts into three core tracks covering scaling, user experience, and Layer 1 security.
Three-Track Protocol Overhaul
On Wednesday, the Foundation said Ethereum’s next phase will focus on expanding network capacity while ensuring long-term security and resilience. Gas limit increases also remain a central objective, following a rise from 30 million to 60 million over the past year. Developers are now targeting a move toward and beyond 100 million gas per block.
Post-quantum readiness was identified as a crucial consideration across multiple areas of protocol development, amidst growing attention to cryptographic security as quantum computing capabilities advance. The Foundation said its protocol work in 2026 will be organized into three tracks – Scale, Improve UX, and Harden the L1.
The “Scale” track combines work previously split between Layer 1 execution scaling and blob data availability. This track will oversee continued gas limit increases supported by client benchmarking and block-level access lists, further blob parameter increases following recent upgrades, and delivery of scaling components planned for the Glamsterdam network upgrade. It will also advance state scaling efforts, including near-term repricing and history expiry, and longer-term plans for statelessness and new data structures.
The “Improve UX” track will focus on protocol-level changes that aim to simplify how users interact with Ethereum. Focus will also be on native account abstraction and interoperability. Building on EIP-7702, which allows externally owned accounts to temporarily execute smart contract code, developers are working toward making smart contract wallets the default without relying on additional infrastructure or incurring extra gas overhead.
The Foundation said this work also intersects with post-quantum readiness, as native account abstraction provides a pathway for transitioning away from ECDSA-based authentication. Efforts to improve interoperability will continue through the Open Intents Framework, in addition to progress on faster Layer 1 confirmations and shorter Layer 2 settlement times.
You may also like:
The “Harden the L1” track introduces a dedicated focus on preserving Ethereum’s core properties as the network scales. This includes security initiatives such as post-quantum readiness and execution-layer safeguards, research into censorship resistance for transactions and blob data, and expanded testing infrastructure to support a faster upgrade cadence. The Foundation said work on devnets, testnets, and client interoperability will remain critical as protocol changes are deployed more frequently.
Looking Ahead
Meanwhile, Glamsterdam is targeted for the first half of 2026, according to the update shared by the Ethereum Foundation. Additionally, the Hegotá upgrade is planned for later in the year.
These upgrades are expected to include higher gas limits, continued blob scaling, enshrined proposer-builder separation, and further progress on native account abstraction, censorship resistance, and post-quantum security.
SECRET PARTNERSHIP BONUS for CryptoPotato readers: Use this link to register and unlock $1,500 in exclusive BingX Exchange rewards (limited time offer).


Quiet networks and idle supply point to social demotivation, which often appears before sentiment and price narratives flip.
Bitcoin has been trading around the mid-$60,000s after losing significant ground from its late-2025 highs. It has failed to reclaim the psychologically crucial $70,000 threshold despite several attempts.
On-chain activity of the world’s largest cryptocurrency and blockchain is showing signs of stagnation, according to data shared by Alphractal.
Bearish Divergence Builds
The firm reported that Bitcoin’s active supply has stopped growing, which indicates that fewer BTC are moving across the network, and overall activity has slowed. The latest decline goes beyond market structure and reflects ” global human behavior,” as weaker prices and rising uncertainty have made participants less willing to act.
Alphractal explained that holders are increasingly keeping coins idle, which has resulted in a quieter network. This phase is being described as “social demotivation” on-chain, amid emotional fatigue, reduced engagement, and a lack of conviction. Such changes in behaviour often surface before broader market narratives change.
Santiment’s data also reported a sharp deterioration in Bitcoin’s network activity compared with 2021 levels, with 42% fewer unique BTC addresses making transactions and 47% fewer new addresses being created. These trends do not mean crypto is “dead” or that a multi-year bear market is inevitable. However, the analytics platform did highlight a clear bearish divergence developed throughout 2025, as total market capitalizations continued to reach new highs even as BTC’s on-chain utility declined.
Whale Accumulation Accelerates
Even as on-chain participation has slowed, accumulation by large BTC holders has accelerated. Bitcoin whale accumulation has increased by more than 200,000 BTC in recent weeks. While whale inflows to exchanges have picked up, a trend often linked to short-term selling, overall whale holdings have continued to rise.
To assess behavior over a longer timeframe, CryptoQuant tracks whale-held supply using monthly averages rather than short-term flows. This metric dropped sharply to nearly minus 7% on December 15 but has since reversed, as whale holdings increased by 3.4% over the past month.
You may also like:
During this period, the amount of Bitcoin held by whales grew from around 2.9 million BTC to more than 3.1 million BTC. CryptoQuant observed that a similar scale of accumulation last occurred during the April 2025 market correction, when whale buying helped absorb selling pressure and boosted the BTC rally from $76,000 to $126,000. With Bitcoin being 46% below its peak, the current level could be encouraging some large holders to accumulate.
SECRET PARTNERSHIP BONUS for CryptoPotato readers: Use this link to register and unlock $1,500 in exclusive BingX Exchange rewards (limited time offer).

Rather than reacting to market drops, Paul Atkins signaled regulators are prioritizing crypto frameworks over price stabilization efforts.
U.S. Securities and Exchange Commission (SEC) Chair Paul Atkins has said that regulators should not panic over falling crypto prices, pushing back against calls for emergency intervention as Bitcoin (BTC) slipped toward $66,000.
The remarks signal the SEC’s intent to focus on structural rulemaking rather than market volatility, offering a roadmap for tokenized securities while dismissing short-term price action as irrelevant to the agency’s mission.
Regulators Address Market Downturn With Policy Agenda
Speaking at ETHDenver on February 18 with Commissioner Hester Peirce, Atkins acknowledged the market’s recent slide but rejected the idea that the SEC should respond to price swings.
“It is not the regulator’s job to worry about the daily swings of the markets,” Atkins said. “People whose only focus is on the number always going up are likely to be disappointed.”
The comments come as crypto markets face sustained pressure, with Bitcoin trading near $66,000 at the time of writing, and analysts watching the $60,000 support level as a potential next test. Meanwhile, Ripple’s XRP dropped nearly 5% to $1.40, and Ethereum (ETH) fell back below $2,000. Some market watchers have warned of further downside, with Bloomberg Intelligence strategist Mike McGlone reiterating a bearish $10,000 Bitcoin forecast just days before Atkins’s speech.
But rather than address price action, the SEC Chair used the appearance to outline a series of regulatory initiatives under “Project Crypto,” a joint effort with the Commodity Futures Trading Commission (CFTC).
The agenda includes developing frameworks for crypto asset classification, crafting rules for tokenized securities trading on automated market makers, and issuing guidance on custody for non-security assets like stablecoins.
Building a Framework Beyond Market Cycles
The SEC’s approach reflects a deliberate shift away from the enforcement-heavy tactics of previous years. Atkins noted that the agency has already dropped numerous crypto cases, ended what critics called “regulation by enforcement,” and issued staff guidance on mining, staking, and meme coins.
You may also like:
On her part, Commissioner Peirce framed the current downturn as an opportunity for builders. “Numbers go down is the mantra of the moment,” she said, noting that some critics are engaging in “Schadenfreude” over crypto’s struggles.
But she argued that regulatory clarity alone does not create value.
“You have to build stuff that people want and need,” Peirce said. “That is the best way to garner support on both sides of the aisle in Washington.”
Atkins emphasized that the SEC’s rulebook should not be a barrier to innovation, encouraging developers to “come in and talk to us” and announcing plans for an “innovation exemption” to allow limited trading of tokenized securities on decentralized platforms.
The exemption would be temporary and include volume limits, designed to let market participants experiment while the agency develops permanent rules.
“Put your nose to the grindstone and work to build things that matter,” Atkins told the audience. “That is how you transform Schadenfreude to Freudenfreude—the sense of happiness we feel when others succeed.”
SECRET PARTNERSHIP BONUS for CryptoPotato readers: Use this link to register and unlock $1,500 in exclusive BingX Exchange rewards (limited time offer).


Societe Generale’s digital assets arm SG-FORGE has deployed its euro stablecoin, EUR CoinVertible, on the XRP Ledger, expanding beyond its existing integrations on Ethereum and Solana as competition heats up in Europe’s regulated stablecoin race.
EUR CoinVertible is issued under French digital asset rules and is backed 1 to 1 by cash deposits or high-quality securities. It has a circulating supply of roughly 65.8 million euros, per CoinGecko, making it one of the larger euro stablecoins in the market behind Circle’s EURC.
SG-FORGE said it chose the XRP Ledger for its low transaction costs and fast settlement, while Ripple’s custody infrastructure will be used to support the rollout. The stablecoin could eventually be explored as collateral for trading or integrated into Ripple’s payment-related products.
For XRPL, the listing is another institutional credibility win as the network positions itself as a compliant venue for tokenized finance. The launch lands just as XRPL validators have been voting on new upgrades such as Permissioned DEX, a feature meant to allow controlled trading environments where only approved participants can interact, a requirement for many regulated firms.
The stablecoin push also comes as blockchains compete to host tokenized deposits, bonds and settlement assets. For XRP itself, the news is more structural than price-driving, but it adds to the narrative that XRPL is trying to be more than a payments chain.
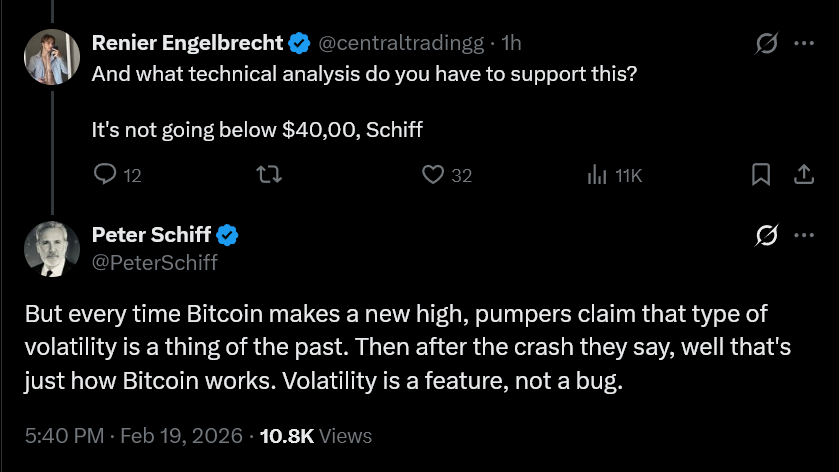
Economist and longtime Bitcoin critic Peter Schiff warned that Bitcoin could collapse to $20,000 if the asset loses key support near $50,000.
His comments come as geopolitical tensions escalate following reports that the US military is preparing strike options against Iran.
Peter Schiff’s Anti-Bitcoin Perception is Stronger than Ever Before
Schiff argued that a drop below $50,000 now appears likely and could trigger a much deeper decline. He suggested Bitcoin may repeat historic crash patterns seen in previous cycles, even despite increased institutional adoption and broader mainstream interest.
His warning arrives as Bitcoin trades near $66,000, down sharply from its recent cycle highs.
Schiff has remained one of Bitcoin’s most consistent skeptics for over a decade. He has repeatedly described Bitcoin as a speculative bubble and argued that it lacks intrinsic value.

Throughout previous bull markets, he predicted major crashes, while continuing to promote gold as a superior store of value.
However, Bitcoin has also repeatedly recovered from severe corrections and reached new highs over time.
His latest warning comes at a fragile moment for crypto markets. Global risk sentiment has weakened amid fears of potential US military action against Iran.
Historically, Bitcoin often falls in the early phase of geopolitical shocks as investors reduce exposure to volatile assets.
On-chain data supports the view that short-term weakness remains possible. The Short-Term Holder SOPR indicator currently sits below 1, showing that recent buyers are selling at a loss.
This reflects fear and ongoing capitulation among weaker investors.
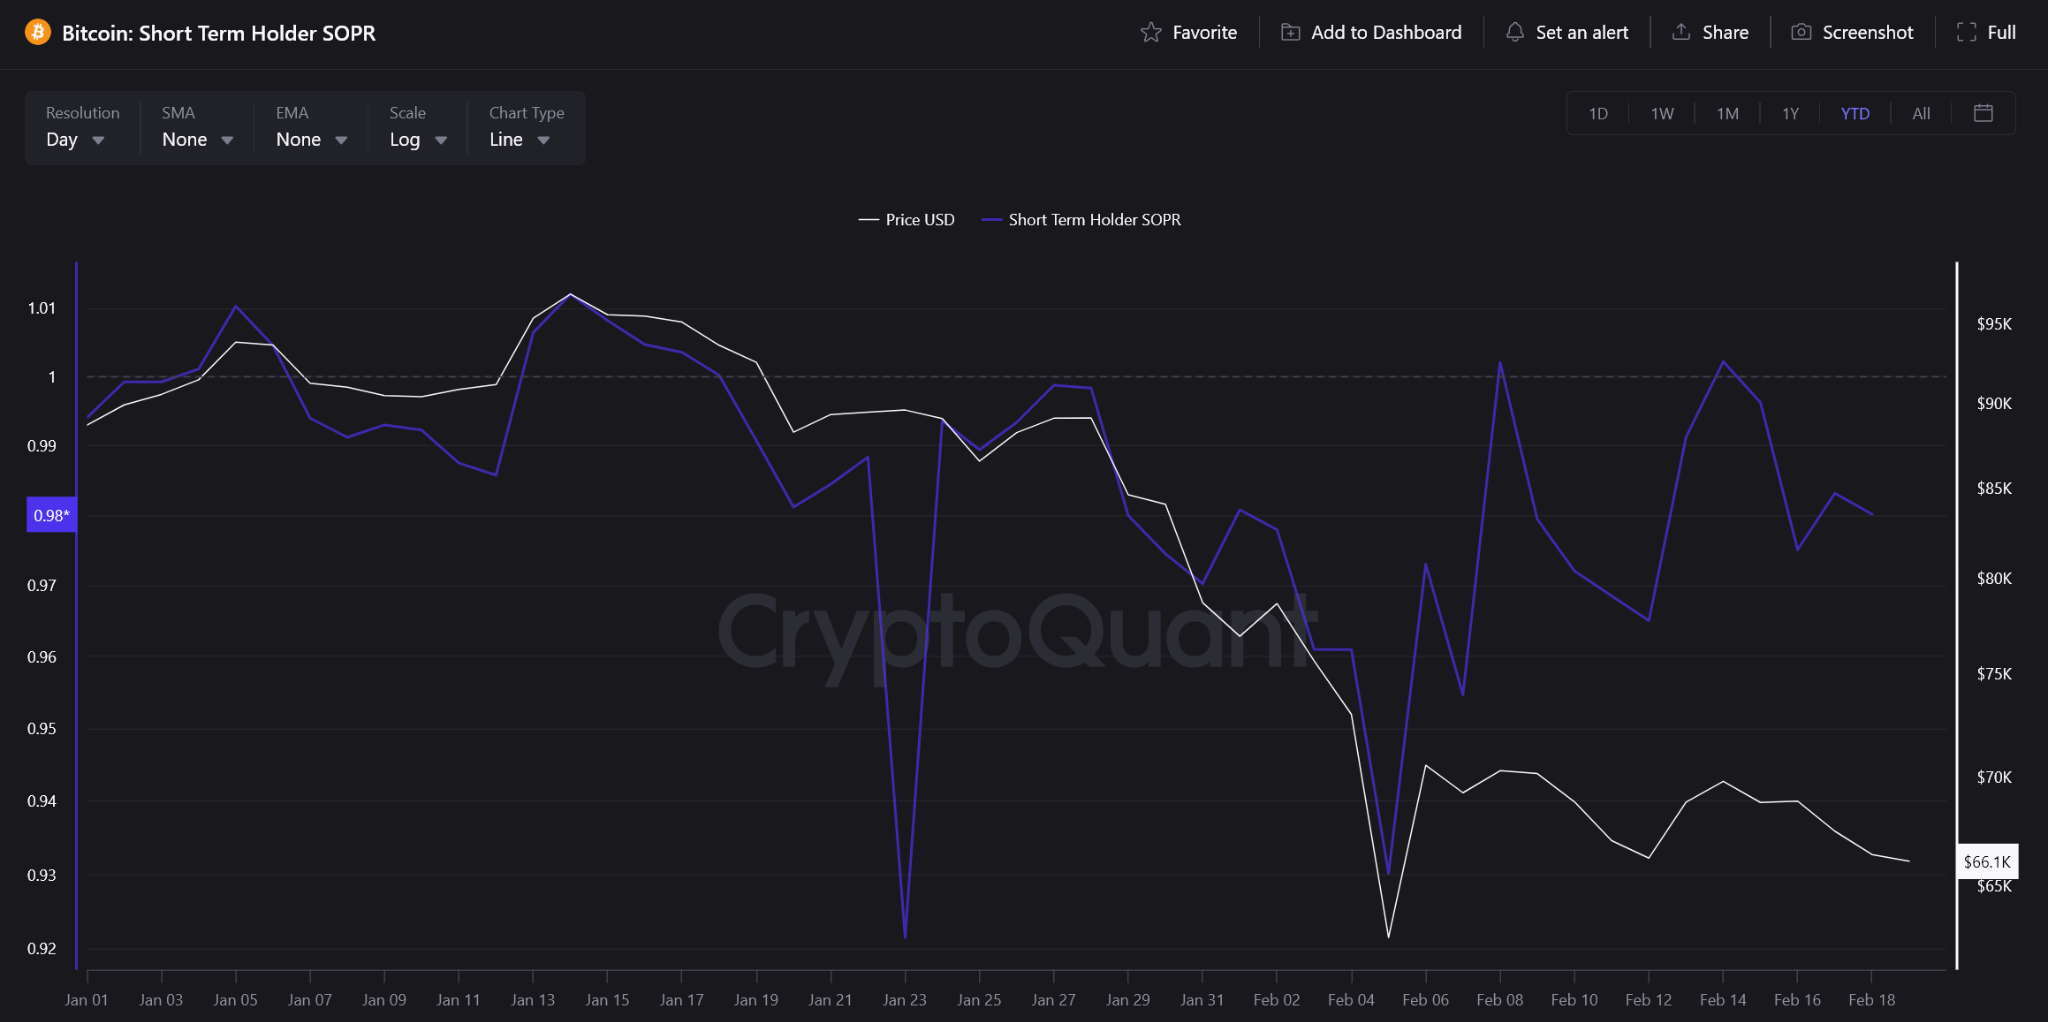
At the same time, another key metric tells a different story. Bitcoin’s short-term Sharpe ratio has dropped to extremely negative levels.
This suggests Bitcoin has already experienced unusually poor returns relative to volatility.
In past cycles, such conditions often appeared near local bottoms rather than the beginning of prolonged collapses.
This creates a mixed outlook. While geopolitical stress and weak sentiment could push Bitcoin lower in the short term, much of the speculative excess appears already flushed out.
Schiff’s prediction reflects rising uncertainty—but on-chain data suggests the market may be closer to a reset phase than the start of a full-scale collapse.


ETH’s reported 50.18% staking share is disputed, with CoinShares putting active staking near 30.8% due to deposit‑only contract data.
Summary
- Santiment says 50.18% of ETH supply (about 80m ETH) sits in the staking deposit contract, crossing a symbolic 50% threshold for the first time.
- CoinShares’ Luke Nolan calls the figure “inaccurate or materially misleading,” noting the contract logs deposits only and ignores withdrawals.
- Active staking is closer to 37m ETH, or roughly 30.8% of circulating supply, using Ethplorer and CryptoQuant validator data.
A dispute has emerged between blockchain analytics firms over the accuracy of Ethereum staking data, with analysts disagreeing on whether staking volume has exceeded 50% of the cryptocurrency’s total supply.
On-chain analytics company Santiment announced that Ethereum (ETH) staking volume had surpassed 50% of the total supply for the first time, according to a recent analysis. The firm reported that 50.18% of the total Ethereum supply was recorded in the staking deposit contract.
CoinShares analysts challenged Santiment’s findings, calling the figure misleading, according to CoinDesk. The analysts stated that the reported percentage does not accurately reflect the amount of active staking on the network.
Luke Nolan, a senior research fellow at CoinShares, said the data is inaccurate or significantly misleading. He explained that the Ethereum staking deposit contract only accumulates deposit records and does not process withdrawal data.
The approximately 80 million Ether reported by Santiment represents accumulated deposit records rather than the actual balance, according to Nolan. The figure does not account for withdrawals from the staking contract, he said.
CoinShares estimates the active staking volume that contributes to network security stands at approximately 37 million Ether, or 30.8% of the supply, according to the firm’s analysis.
Other analysts have also claimed the staking rate is around 30%, not 50%, according to reports.

China’s Alibaba AI Predicts the Price of XRP, Shiba Inu and PEPE By the End of 2026

Raunchy 70s Sci-Fi Horror From Master Director Is A Deadly Experiment

The Apprentice’s latest contestant to be fired tonight


-

 Video3 days ago
Bitcoin: We’re Entering The Most Dangerous Phase
-

 Tech5 days ago
Luxman Enters Its Second Century with the D-100 SACD Player and L-100 Integrated Amplifier
-

 Crypto World3 days ago
Can XRP Price Successfully Register a 33% Breakout Past $2?
-

 Sports3 days ago
GB's semi-final hopes hang by thread after loss to Switzerland
-

 Video7 days ago
The Final Warning: XRP Is Entering The Chaos Zone
-
 Tech3 days ago
The Music Industry Enters Its Less-Is-More Era
-

 Business2 days ago
Infosys Limited (INFY) Discusses Tech Transitions and the Unique Aspects of the AI Era Transcript
-

 Entertainment1 day ago
Kunal Nayyar’s Secret Acts Of Kindness Sparks Online Discussion
-

 Video3 days ago
Financial Statement Analysis | Complete Chapter Revision in 10 Minutes | Class 12 Board exam 2026
-

 Tech2 days ago
Retro Rover: LT6502 Laptop Packs 8-Bit Power On The Go
-
 Crypto World6 days ago
Bhutan’s Bitcoin sales enter third straight week with $6.7M BTC offload
-
 Sports19 hours ago
Clearing the boundary, crossing into history: J&K end 67-year wait, enter maiden Ranji Trophy final | Cricket News
-

 Entertainment1 day ago
Dolores Catania Blasts Rob Rausch For Turning On ‘Housewives’ On ‘Traitors’
-

 Crypto World6 days ago
Kalshi enters $9B sports insurance market with new brokerage deal
-

 Business2 days ago
Tesla avoids California suspension after ending ‘autopilot’ marketing
-
 NewsBeat4 days ago
The strange Cambridgeshire cemetery that forbade church rectors from entering
-

 Crypto World1 day ago
WLFI Crypto Surges Toward $0.12 as Whale Buys $2.75M Before Trump-Linked Forum
-
 NewsBeat4 days ago
Man dies after entering floodwater during police pursuit
-

 NewsBeat5 days ago
UK construction company enters administration, records show
-

 Crypto World2 hours ago
83% of Altcoins Enter Bear Trend as Liquidity Crunch Tightens Grip on Crypto Market