

Crypto World
Bitcoin’s record monthly losses; history says a brewing turnaround

Bitcoin is sculpting what could become a five-month red stretch, a pattern that would mark the longest losing run for the largest crypto asset since the 2018 bear market. With BTC down about 15% this month after four consecutive negative closes, traders are weighing whether March might bring a contrarian turn. Data from CoinGlass underscores the current malaise, while some analysts point to historical precedents suggesting a relief rally could follow a protracted drawdown. Yet others caution that the narrative this time could be structurally different, complicating parity between history and the present price action.
Key takeaways
- Bitcoin is on its fifth straight red monthly candle, placing it on the longest losing streak since 2018 if the pattern persists into March.
- Historical analogs show that multi-month declines have sometimes been followed by substantial rallies, with Milk Road suggesting as much as a 316% gain over the next five months if history repeats.
- A potential reversal could begin as early as April 1, according to an analyst-led interpretation of prior cycles.
- In 2022, BTC endured four consecutive red quarters, culminating in a 64% annual drawdown and a year-end close near $16,500 after opening near $46,230.
- Some market voices argue the current bear market is fundamentally different, pointing to RSI behavior and other indicators that diverge from prior cycles, complicating traditional bottoming expectations.
Tickers mentioned: $BTC
Sentiment: Neutral
Price impact: Neutral. While patterns hint at a possible rebound, no definitive price move is confirmed yet.
Market context: The Bitcoin narrative sits amid a broader backdrop of historic drawdowns, with weekly and quarterly signals suggesting a mixed path ahead. Analysts note that the current bear period may not mirror past cycles, even as the same asset class contends with macro and liquidity dynamics that shape risk appetite across crypto markets.
Why it matters
The persistence of downbeat monthly candles keeps a number of questions at the forefront for investors and builders alike. If Bitcoin’s streak ends in the near term, it could validate a patience-driven approach in a market where volatility remains a defining feature. The potential for a sizable rebound — should the cycle mirror past recoveries — would have implications for institutional engagement, risk management, and the development of on-chain infrastructure that often aligns with price cycles.
From a risk-management perspective, the divergence between monthly patterns and weekly or quarterly signals matters. While a five-month red run would align with the memory of 2018’s late-stage bear, the more nuanced pattern observed in 2022 — four red quarters culminating in a brutal annual drawdown — suggests that the bottoming process can be uneven and drawn out. This nuance is essential for traders who rely on calendar-based expectations, as opposed to a purely price-driven narrative. The discussion around whether the bear is structurally different adds another layer to how market participants interpret leverage, liquidity provisioning, and hedging strategies within the crypto ecosystem.
Analysts emphasize that a bottom is not a singular event but a process that unfolds across multiple timeframes. The contrast between longer, slower-moving monthly candles and shorter, more volatile weekly candles can produce whipsaws or false signals, challenging even seasoned traders. The current discourse also highlights how historical reference points can both illuminate potential paths and mislead when the fundamentals have shifted — for example, the RSI, a widely watched momentum indicator, is said to be at levels that resemble prior bear-market lows, which some observers interpret as either a cap on upside or a prelude to a reversal depending on the broader setup.
In practical terms, this means market participants should remain vigilant for changes in liquidity conditions, risk sentiment, and macro drivers that influence appetite for risk across crypto assets. The evolving narrative around whether this bear is “different” matters not just for price trajectories but for how developers, investors, and miners approach long-horizon planning, supply dynamics, and the deployment of new financial products tied to BTC exposure.
What to watch next
- Monitor April 1 as a potential pivot point if the historical pattern repeats, with attention to whether the fifth red month translates into a sustained rebound.
- Track weekly candle formations and RSI behavior for signs of a bottom or renewed downside pressure.
- Follow commentary around the notion that the current bear cycle is fundamentally different, to assess whether this changes risk management and capital allocation approaches.
- Observe any shifts in macro sentiment and liquidity that could influence BTC’s risk-on/risk-off dynamics in the near term.
Sources & verification
- CoinGlass data on Bitcoin’s fifth consecutive red month and the 15% monthly decline.
- Milk Road analysis and X post citing the potential 316% upside over the next five months if history repeats, with an April 1 timeframe mentioned.
- Historical quarterly performance in 2022 showing four red quarters and a 64% annual drawdown, as contextualized by on-chain and price-history analysis.
- Analyst commentary noting a potentially different bear market structure in 2026 relative to prior cycles, as discussed by market observers.
- Solana Sensei’s chart discussion focusing on Bitcoin’s weekly performance and the persistence of a five-candle streak.
Bitcoin’s latest drawdown and what it changes
Bitcoin (CRYPTO: BTC) finds itself at a crossroads as a fifth consecutive monthly red candle looms, a scenario that would mark the longest such streak since the 2018 downturn. CoinGlass’s data frames the cue: BTC has declined around 15% this month after finishing the four preceding months in the red. The most notable parallel in recent history is the 2018 bear, a period that preceded a protracted decline before a multi-times rally years later. This context frames the current debate: are we approaching a traditional bear-market bottom, or is this cycle signaling a new regime with different dynamics?
Within this debate sits a striking counterpoint from Milk Road, which highlighted that prior episodes of extended debits often culminated in powerful rallies. The analysis notes a potential 316% gain in the subsequent five months if the pattern repeats, with an initial pivot anticipated around early April. While such projections draw on historical analogs, they do not guarantee future outcomes, and market participants remain mindful of the speed and scale of moves that can occur in crypto markets. The possibility of a rapid reversal exists, but it is contingent on a confluence of favorable conditions that historically have proven elusive to time with precision.
The 2022 bear period adds another layer of caution. That year, BTC endured four consecutive red quarters, culminating in a total drawdown of roughly 64% as the price collapsed from a starting point near $46,230 to around $16,500 by year-end. The stark difference between that season and the present has led some to question whether history offers a reliable playbook for all cycles. In a broader sense, the bear narrative for 2026 has permeated analysis, with voices warning that a similar stretch could push prices toward new lows if macro and liquidity conditions deteriorate further. One linked discussion even imagines a scenario where the decline might extend below the 15-month support band near $60,000, underscoring the potential for further downside if selling pressure intensifies.
Within the microstructure, weekly performance has drawn the attention of traders as well. A well-known analyst in the space highlighted that Bitcoin printed its fifth consecutive weekly down candle, marking the longest such streak since 2022 and positioning it as the second-longest losing run on record. The 2022 period saw nine red weeks and a descent to around $20,500, illustrating how abrupt and protracted declines can be, even after substantial drawdowns. The interplay of monthly, weekly, and quarterly signals underscores the challenge of diagnosing a bottom with a single timeframe in mind and highlights the risk of misreading the onset of a durable recovery.
Beyond the numbers, a divergence in narrative is shaping market sentiment. Veteran analyst Sykodelic argues that the current bear phase is fundamentally different from earlier cycles, pointing to the monthly RSI having already touched levels associated with prior bear-market lows in 2015 and 2018. The assertion is that the absence of a classic overbought expansion in the bull phase can complicate expectations of symmetric contractions. In other words, traders may be dealing with a regime where the typical playbook fails to capture the full complexity of price action, making caution and disciplined risk management all the more important as the market tests key psychological and technical thresholds.
All of this occurs as broader market narratives evolve around risk tolerance and the appetite for crypto exposure. The tension between potential upside and the risk of renewed downside remains a core feature of the current price environment. For market participants, the central question is whether the repeated red candles are signaling a deeper pattern or simply a fraught interim phase that could resolve in a relatively swift re-pricing if buyers step back in with confidence. The answer will likely hinge on a mix of on-chain signals, liquidity conditions, and macro developments that influence whether BTC can sustain any rally beyond a few weeks or months.
What to watch next
- April 1 as a potential inflection point if the historical pattern repeats, with close attention to price action in the days that follow.
- Confirmation signals from weekly candles and RSI stabilization, which could indicate a bottoming process even amid ongoing volatility.
- Shifts in risk sentiment and liquidity that may tilt BTC toward a risk-on or risk-off regime in the near term.


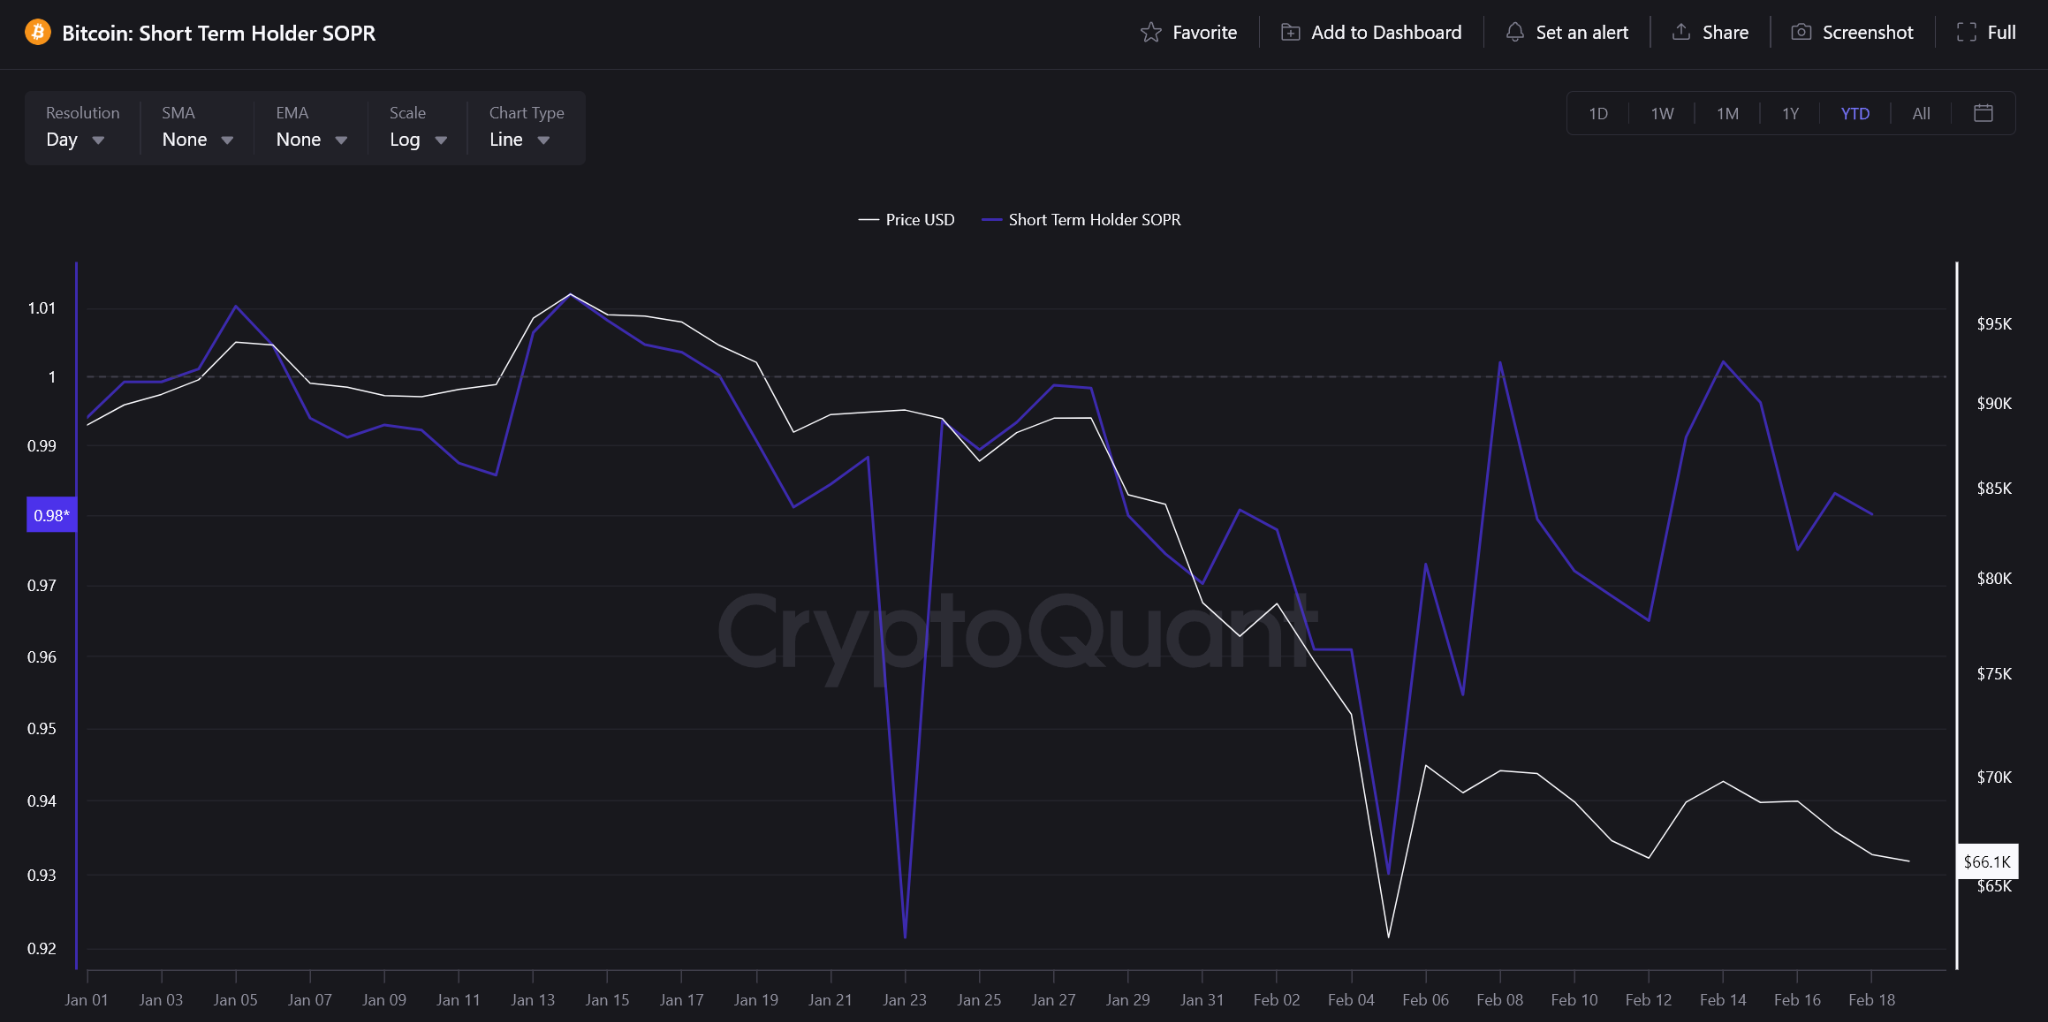
Bitcoin traded near $66,400 on February 19, holding steady after days of volatility. However, growing fears of a potential US military strike on Iran are adding fresh uncertainty to global markets, including crypto.
According to confirmed reports from multiple American media, US military officials have told President Donald Trump that strike options against Iran are ready and could be executed as early as this weekend.
US-Iran on the Brink of War as Bitcoin Holds Fragile Support
The Pentagon has already deployed additional aircraft and moved a second carrier strike group toward the Middle East. At the same time, Iran has conducted military exercises and warned it would retaliate if attacked.
These developments follow stalled nuclear talks and rising tensions over Iran’s uranium enrichment and missile programs.
The White House said diplomacy remains the preferred path, but officials also acknowledged that military action is under active consideration. This escalation has increased risk across global markets.

Bitcoin’s recent price action reflects this uncertainty. The asset has fallen sharply from its cycle highs above $100,000 and now trades in the mid-$60,000 range.
Short-term investors are selling at a loss, according to the Short-Term Holder SOPR indicator, which currently sits below 1. This means many recent buyers are exiting their positions under pressure.
At the same time, Bitcoin’s short-term Sharpe ratio has dropped to extremely negative levels. This shows that recent returns have been poor relative to volatility. Historically, such conditions appear during periods of market stress and fear.
If the US launches a strike this weekend, Bitcoin will likely react in two phases.
Bitcoin’s On-Chain Signals Suggest Panic May Trigger Volatility
First, markets may see an immediate sell-off. During sudden geopolitical shocks, investors often move into cash and safer assets. Bitcoin has historically behaved like a risk asset in the early phase of global crises. The SOPR data confirms that short-term holders are already weak and sensitive to fear.
However, the second phase could look different.
The Sharpe ratio suggests Bitcoin is already deeply oversold in the short term. Many weak hands have exited. This reduces the amount of forced selling that can still occur.
As a result, any sharp drop could be short-lived if buyers step in at lower levels.
In addition, geopolitical uncertainty can eventually strengthen Bitcoin’s appeal. Investors often turn to assets outside traditional financial systems when global tensions rise. This shift does not happen instantly, but it tends to develop over time.
For now, Bitcoin sits at a critical point. Fear remains high, and geopolitical risks are rising. But on-chain data suggests much of the damage from the recent correction has already occurred.
The next move will depend heavily on whether tensions escalate into actual military conflict—or ease through diplomacy.


Pro‑crypto PAC Protect Progress plans $1.5m spend next month against Rep. Al Green over his anti‑crypto voting record.
Summary
- Protect Progress, aligned with Fairshake, will pour $1.5m into ads and outreach in Texas’ Democratic primary to defeat Green.
- The PAC cites Green’s opposition to FIT 21, the Digital Asset Market Clarity Act, the GENIUS stablecoin bill, and his support for SAB 121 bank‑custody limits.
- Fairshake and affiliates control about $193m in cash from donors including Ripple, Coinbase and a16z, signaling deeper crypto lobbying in 2026 races.
A cryptocurrency-aligned super PAC announced plans to spend $1.5 million opposing Rep. Al Green in the Texas Democratic primary next month, according to a statement released by the organization.
Protect Progress, a federal super PAC affiliated with Fairshake, said the funds will support advertising and voter outreach aimed at unseating Green, a longtime member of the House Financial Services Committee who has voted against several major crypto-related bills.
The group cited Green’s opposition to measures including the Financial Innovation and Technology for the 21st Century Act, the Digital Asset Market Clarity Act currently under consideration, and the GENIUS stablecoin bill that passed earlier this year. The organization also pointed to his support for maintaining the SEC’s Staff Accounting Bulletin 121, which limited how banks custody digital assets.
“As a member of the Financial Services Committee, Representative Al Green has decided to try and stop American innovation in its tracks,” Fairshake spokesperson Josh Vlasto said in a statement.
Green, who has served in Congress since 2005, has voiced skepticism about cryptocurrency, warning of potential risks to the U.S. dollar’s global role and raising concerns about the sector’s economic and environmental impact, according to public statements. During a House hearing last year, he dismissed claims that regulators pressured banks to cut ties with crypto firms, calling “Operation Choke Point 2.0” a “made-up statement.”
Green is running in a reshaped Houston-area district following Texas redistricting and faces Democratic challenger Christian Menefee, who has received favorable assessments from crypto advocacy groups.
Fairshake and affiliated committees reported holding approximately $193 million in cash earlier this year, following fundraising from major industry players including Coinbase, Ripple and Andreessen Horowitz, according to federal filings. The spending reflects how crypto-backed political groups plan to engage in the 2026 election cycle, backing candidates supportive of digital asset regulation while opposing lawmakers viewed as hostile to the industry.
Nvidia is close to finalizing a $30 billion investment in OpenAI, replacing an earlier plan for a massive $100 billion multi-year partnership.
According to Financial Times, the deal would be part of OpenAI’s latest funding round, which could value the company at roughly $830 billion. OpenAI is expected to reinvest much of that capital into AI infrastructure, including Nvidia’s GPUs.
The shift from a $100 billion commitment to a smaller $30 billion equity investment changes the financial risk profile.
Instead of funding massive infrastructure directly, Nvidia gains ownership exposure while still securing demand for its hardware. This restructuring has drawn close attention from investors already watching Nvidia’s volatile stock movements.

From Six-Week Lows to Strategic Rebound: Nvidia’s Volatile Month
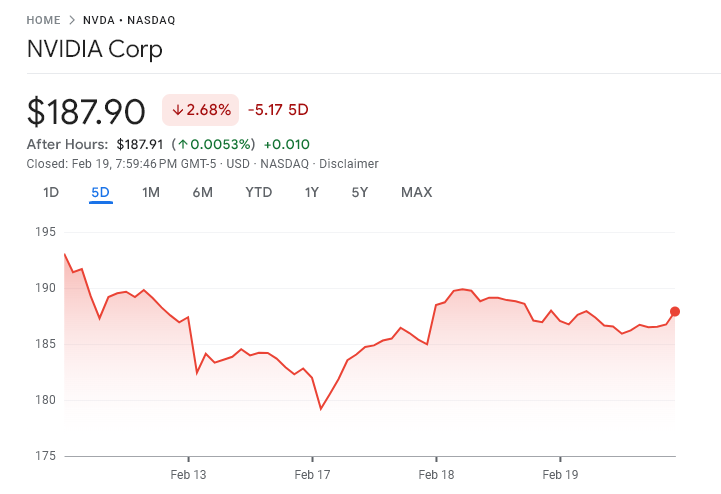
Nvidia’s stock has moved sharply over the past several weeks. In early February, shares fell to around $177, marking a six-week low.
The decline followed uncertainty over the original $100 billion OpenAI deal, concerns over US export restrictions on AI chips to China, and broader investor worries about the sustainability of AI spending.
However, the stock rebounded after Nvidia announced a smaller investment commitment, new partnerships, and major chip supply deals.
A multi-year agreement to supply millions of AI chips to Meta also helped restore confidence. By mid-February, Nvidia shares recovered toward the high-$180 range.
Still, volatility persisted. Investors remained cautious about regulatory risks, high valuation levels, and whether AI infrastructure spending could deliver sustained returns.
Nvidia Commits to a Much Smaller Deal With OpenAI, But it Has a Bigger Signal
The latest $30 billion investment is widely seen as strategically bullish for Nvidia. First, it removes the financial burden of the original $100 billion plan, which could have strained Nvidia’s balance sheet.
Second, it strengthens Nvidia’s position as OpenAI’s primary hardware partner.
This means Nvidia benefits in two ways. It gains equity exposure to one of the world’s most valuable AI companies while continuing to sell the chips powering OpenAI’s models.
However, short-term reactions may remain mixed. Large investments always carry risk, and some investors prefer Nvidia to focus purely on chip sales.
Still, the deal reinforces a key point: AI infrastructure spending continues to accelerate.
Ultimately, the investment strengthens Nvidia’s long-term outlook. It confirms that Nvidia remains at the center of the global AI boom, even as markets navigate short-term uncertainty.

TLDR:
- ETH-accumulating whales increased their balance as the realized price dropped, confirming active buying at lower levels.
- The realized cap for accumulating whale addresses rose, ruling out any selling activity within this cohort.
- ETH is currently trading at $1,949, with a 1.80% price gain recorded over the past seven-day period.
- Trader Daan Crypto warns that a drop below $1,900 could push ETH toward its February lows fairly quickly.
ETH continues to draw attention from large investors even as its price shows signs of pressure. On-chain data reveals that accumulating whale addresses are not selling their holdings.
Instead, these whales are buying at lower price levels. The realized price metric for this cohort has bent downward, which may seem alarming at first glance.
However, a closer look at balance and realized cap data tells a more complete story about what these large holders are actually doing.
What the Realized Price Drop Really Means for ETH
The realized price of accumulating whale addresses has turned downward for the first time. This kind of movement can point to two separate scenarios in the market.
Either a whale with a higher cost basis sold their ETH, pulling the average down. Or new buying occurred at lower prices, which also pulls the realized price downward.
To determine which case applies, analysts cross-referenced balance data and realized cap figures. In the same period where the realized price dropped, the balance of accumulating whales went up. At the same time, their realized cap also rose, not fell.
These two data points together confirm that no selling took place among this cohort. On the contrary, whales added more ETH to their holdings at reduced price levels. This buying behavior is what caused the realized price to bend downward, not distribution.
CryptoMe, a well-followed Cryptoquant on-chain analytics analyst, stated that accumulating whales’ trust in ETH still looks strong based on this data set.
Price Levels and What Traders Are Watching Closely
Even with whale accumulation continuing, the broader price action remains uncertain. ETH is currently trading at $1,949.06, with a 24-hour volume of over $18.8 billion. The asset posted a 0.23% gain in the past 24 hours and a 1.80% rise over the past seven days.
Crypto trader Daan Crypto Trades pointed out that liquidity levels are clear in this range. According to Daan, a move above $2,150 would mark a new local high and likely push prices further up. However, a drop to $1,900 or below opens the door to revisiting February lows.
That caution is worth noting, especially since the accumulating whale data only covers one segment of the market. Other investor groups and broader macro conditions can still move the ETH price independently.
The on-chain data does not account for retail behavior, derivatives activity, or sentiment shifts.
Therefore, while whale accumulation is a constructive sign, it does not guarantee price direction in the short or medium term.
Traders and investors are advised to monitor multiple data sources before concluding where ETH heads next.

New analysis from banking data company KlariVis found that 90% of community banks in its sample had customers transacting with Coinbase. Across 53 banks where transaction direction could be determined, $2.77 flowed to the crypto exchange for every $1.00 returning, resulting in a net $78.3 million deposit shift over 13 months.
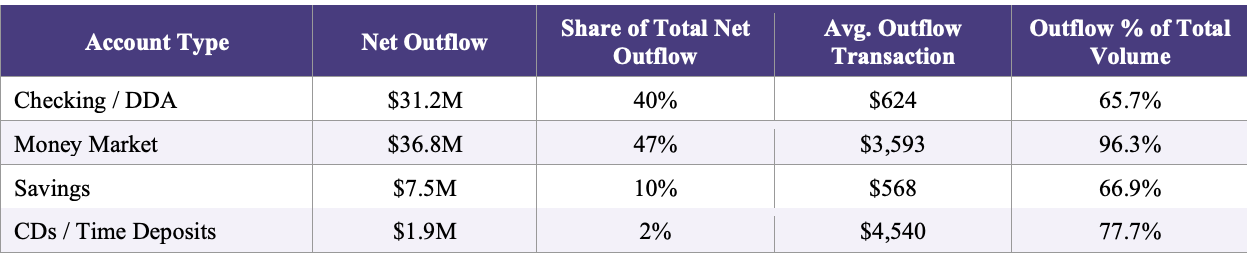
The study reviewed 225,577 Coinbase-related transactions across 92 community banks and found that transfers were heavily concentrated in money market accounts, where 96.3% of identifiable transaction volume represented funds leaving banks for the exchange.
“In general, community banks can be defined as those owned by organizations with less than $10 billion in assets,” the Federal Reserve says on its website.
KlariVis said that if the patterns observed in the sample hold nationally, more than 3,500 of the country’s roughly 3,950 community banks could have similar customer activity tied to Coinbase transfers.
The size of the 53 banks with directional data ranged from $185 million to $4.5 billion in deposits, with smaller institutions showing higher relative exposure. At banks with less than $1 billion in deposits, 82% to 84% of Coinbase-related transactions represented funds moving out, compared with about 66% to 67% at banks above $1 billion.
Across those banks, total outflows reached $122.4 million compared with $44.2 million in inflows. The average outbound transfer was $851, while inbound transfers averaged $2,999 but occurred far less frequently.

Money market accounts accounted for $36.8 million of the net outflow, with average transfers of $3,593, significantly higher than checking account movements.
Community banks hold about $4.9 trillion in deposits and fund about 60% of small business loans under $1 million and 80% of agricultural lending, according to the report, which argues sustained deposit migration could affect local credit availability.
Using academic estimates that small banks reduce lending by about $0.39 for every $1 decline in deposits, KlariVis said the $78.3 million net outflow could translate into about $30.5 million in reduced lending capacity.
Related: Coinbase’s Base transitions to its own architecture with eye on streamlining
CLARITY Act stalled by debate over stablecoin yield
The study comes as the US Congress, banks and crypto-native companies debate the CLARITY Act, which aims to define the regulatory framework for digital asset markets and determine whether crypto exchanges and stablecoin intermediaries can offer yield on customer holdings.
While the GENIUS Act, passed in July 2025, bars stablecoin issuers from paying interest, it does not prohibit third-party intermediaries such as Coinbase from offering yield on stablecoin balances, which has become a major point of contention between financial institutions and crypto companies.
In August, Banking groups, led by the Bank Policy Institute, urged lawmakers to address what they describe as a “loophole” in the law, warning that allowing exchanges to offer indirect yield could accelerate deposit outflows, disrupt credit flows and shift up to $6.6 trillion from the traditional banking system.
Last month, Bank of America CEO Brian Moynihan echoed that sentiment, saying interest-bearing stablecoins could draw up to $6 trillion from the US banking system, citing US Treasury-backed research suggesting deposits could migrate if issuers are allowed to pay yield.
Meanwhile, Coinbase CEO Brian Armstrong has pushed back against restrictions on stablecoin rewards. In January, he withdrew support for a version of the bill, writing on X: “We’d rather have no bill than a bad bill.” He raised several concerns about the draft, one of which was that it would eliminate stablecoin yield and protect banks from competition.

Despite ongoing tensions between banks and crypto companies, US Senator Bernie Moreno said on Wednesday he thinks the CLARITY Act could advance through Congress by April. Prediction marketplace Polymarket currently shows an 83% chance that the legislation will be signed into law this year.
Magazine: Bitcoin’s ‘biggest bull catalyst’ would be Saylor’s liquidation: Santiment founder


The high costs of deploying and running artificial intelligence agents in the workforce may prevent them from replacing humans who can do the same work at lower cost, say two multimillionaire tech investors.
Tech investor Jason Calacanis said on the All-In podcast on Saturday that he has been paying $300 per day for an Anthropic Claude AI agent to help run his businesses, despite the bot only operating at 10% to 20% of full capacity.
“When do tokens outpace the salary of the employee?” Calacanis questioned, referring to the usage allowance, called tokens, that users must purchase to use most AI models.
Social Capital CEO Chamath Palihapitiya said he had the same problem and that the cost of the models means they “need to be at least two times as productive as another employee.” He added he may need to set a budget on how much AI his business can use.
What Happens When AI Tokens Cost More Than Your Employees?@Jason:
“We, with our agents, hit $300/day per agent using the Claude API, like instantly. And that was doing, maybe, 10 or 20%. That’s $100k/year per agent.”@chamath:
“We’re getting to a place where we have to… pic.twitter.com/5N0rteNFts
— The All-In Podcast (@theallinpod) February 18, 2026
Tech investor Mark Cuban said on Thursday that the high cost of AI adoption in the workforce raised by Calacanis and Palihapitiya was the smartest counter-argument he’d seen to AI taking over jobs.
Cuban said that with the cost of tokens and maintenance, it could cost twice as much for eight Claude AI agents “to do what an employee does per day” for $1,200.
He questioned whether the AI bots were more than twice as productive as a human. or if there were “qualitative issues like morale, morality […] that can’t be quantified, that need to go into the decision.”
The threat of AI replacing large swathes of the workforce has caused uncertainty in recent years, as some companies have initiated layoffs, pointing to their use of AI making some jobs obsolete.
A research paper from Microsoft in July found that knowledge-based occupations, along with customer service and sales roles, were most at risk of being replaced by AI.
Related: China’s AI lead will shape crypto’s future
White House AI and crypto czar David Sacks is one of many who claim such fears are overhyped, saying in August that AI still needs to be prompted and verified to “drive business value.”
However, others, such as business consulting firm McKinsey & Co, have highlighted that the point of these AI agents is to automate tasks end-to-end, operating without constant human input.
Stablecoins could be agentic AI’s native currency
The use of AI agents has grown in popularity among crypto users, and stablecoin issuer Circle CEO Jeremy Allaire predicted last month that billions of AI agents will be transacting with stablecoins for everyday payments on behalf of users within five years.
Binance co-founder Changpeng Zhao said in January that crypto would end up being the native currency for AI agents due to blockchain being the “most native technology interface for AI agents.”
AI agents are already operating on several blockchains, such as Ethereum Layer 2 Base, where AIXBT, via the Virtuals Protocol, makes micropayments and facilitates trades on behalf of users, while ASI Alliance on Fetch.ai can manage assets and coordinate other economic tasks for users.
On Wednesday, OpenAI launched a new benchmark evaluating how well different AI models detect, patch, and even exploit security vulnerabilities found in smart contracts.
OpenAI said the research was useful as it is becoming more important to evaluate their performance in “economically meaningful environments.”
“Smart contracts secure billions of dollars in assets, and AI agents are likely to be transformative for both attackers and defenders,” it said.
Magazine: IronClaw rivals OpenClaw, Olas launches bots for Polymarket — AI Eye
Kraken’s tokenized equities platform, xStocks, has surpassed $25 billion in total transaction volume in under eight months since its launch, signaling accelerating adoption of tokenized assets among mainstream investors. Kraken disclosed the milestone on Thursday, noting that the figure covers trades executed across both centralized and decentralized venues, as well as minting and redemption activity. The jump represents a 150% increase from the $10 billion milestone reached in November, the point at which xStocks first crossed that threshold. The tokens are issued by Backed Finance, a regulated asset provider delivering 1:1 backed tokenized representations of publicly traded equities and exchange-traded funds, with Kraken serving as a primary distribution and trading venue. Since its 2025 debut, xStocks has expanded to more than 60 tokenized equities, including notable exposures to major U.S. technology leaders such as Amazon, Meta Platforms, Nvidia and Tesla. The momentum in on-chain activity has been a central driver of growth, with on-chain trading volume totaling $3.5 billion and more than 80,000 unique on-chain holders. On-chain trading, conducted directly on public blockchains, offers transparency and self-custody of assets, a contrast to trading confined to centralized exchange order books. The rise in on-chain participation suggests users are not only trading tokenized equities but also integrating them into broader decentralized finance ecosystems. Eight of the 11 largest tokenized equities by unique holder count are now part of the xStocks ecosystem, underscoring its growing market share in this nascent segment.
Key takeaways
- xStocks reached $25 billion in total transaction volume within eight months of launch, incorporating centralized, decentralized, minting, and redemption activity, a 150% rise from the $10 billion mark seen in November.
- On-chain activity is a major growth driver, with $3.5 billion in on-chain trading volume and more than 80,000 unique on-chain holders to date.
- At launch, xStocks offered more than 60 tokenized equities; eight of the 11 largest tokenized equities by holder count are now within the xStocks ecosystem.
- Tokenized real-world assets (RWAs) continue to gain traction, with tokenized RWAs up 13.5% in the past 30 days and tokenized stocks reaching a $1.2 billion market capitalization in December.
- The structure involves Backed Finance issuing 1:1 backed tokenized representations of publicly traded securities, while Kraken remains a key distribution and trading channel.
Sentiment: Bullish
Market context: The ongoing expansion of tokenized equities fits into a broader trend toward real-world asset tokenization, where liquidity, transparency, and cross-venue settlement are increasingly appealing to investors seeking alternative exposure beyond traditional markets. While the broader crypto market has experienced volatility, demand for tokenized RWAs and on-chain settlement continues to grow, reflecting a diversification dynamic within digital asset ecosystems.
Why it matters
The milestone achieved by xStocks matters for several reasons. First, it demonstrates tangible monetizable traction for tokenized equities in a relatively short window, suggesting that institutions and individual investors are testing the feasibility of on-chain settlement and custody for traditional securities. By reaching $25 billion in total volume, xStocks signals that tokenization is moving beyond a niche experiment toward a scalable model that could reshape how investors access equity exposure. The fact that nine-figure volumes are now a routine attribute of a regulated tokenized product adds a layer of credibility to the broader tokenization narrative.
Second, the architecture underpinning xStocks—where Backed Finance issues 1:1 backed tokenized shares and Kraken provides distribution and liquidity—highlights a credible pathway for regulatory-aligned asset digitization. The 1:1 backing is a key feature designed to address concerns about the legal and financial solidity of tokenized assets, while Kraken’s established trading infrastructure offers a familiar on-ramp for traders who want to access tokenized equities without abandoning traditional market workflows. This combination could help bridge traditional exchanges and on-chain markets, potentially accelerating adoption among both retail and institutional participants.
Third, the on-chain growth underscores a broader DeFi-enabled use case for tokenized equities beyond mere trading. With $3.5 billion in on-chain volume and more than 80,000 unique holders engaging on public blockchains, participants are increasingly integrating tokenized stocks into cross-contract and cross-chain strategies. This points to a maturing ecosystem where tokenized assets intersect with liquidity protocols, lending and yield-generating strategies, and other DeFi innovations. If on-chain participation continues to rise, it could spur new product possibilities — such as on-chain custody solutions, collateralization for loans, or liquidity provisioning keyed to tokenized stock tokens — expanding the utility of tokenized equities beyond price discovery alone.
Lastly, the data showing eight of the 11 largest tokenized equities by holder count being part of xStocks signals meaningful market share gains. It suggests that a core subset of tokenized equities is achieving stronger network effects, attracting more funds and holders, and potentially driving more issuers and asset classes into the tokenization fold. While tokenized RWAs have demonstrated resilience and growth in a challenging market environment, tokenized stocks now appear to be carving out a distinct, investable niche within the broader crypto and digital asset landscape.
The outlook remains contingent on several external factors, including regulatory clarity across jurisdictions and the pace of mainstream adoption. As tokenized assets evolve, observers will be watching for new tokenized equities, expanded custodial and settlement mechanisms, and additional platforms embracing tokenized securities with similar architectures to Backed Finance. The trend toward real-world asset tokenization is not a fleeting one; it represents a structural development in how markets can be accessed and transacted on-chain, potentially altering liquidity dynamics and the composition of investment portfolios for years to come.
What to watch next
- Continued growth in on-chain trading volume and the number of unique on-chain holders for xStocks, with a focus on whether momentum persists beyond the current milestone.
- Expansion of tokenized equities beyond the initial lineup of more than 60 tokens, including new assets and potential broadened access to additional market segments.
- Regulatory developments affecting tokenized securities and standardized on-chain settlement, including any jurisdictional approvals or clarifications that could facilitate broader deployment.
- Integration opportunities with DeFi ecosystems, such as enhanced liquidity provision, collateralization options, and new yield-based use cases for tokenized equities.
Sources & verification
- Kraken’s public disclosure detailing the $25 billion total transaction volume milestone and the scope of trade types (centralized, decentralized, minting, redemption).
- Launch specifics: xStocks initially offered over 60 tokenized equities, including exposure to Amazon, Meta Platforms, Nvidia and Tesla, as cited in the disclosure.
- On-chain activity metrics: $3.5 billion in on-chain trading volume and 80,000+ unique on-chain holders as reported by Kraken.
- Tokenized RWAs performance: 13.5% growth in tokenized RWAs over 30 days and Token Terminal data indicating tokenized stocks reached a $1.2 billion market cap in December.
Momentum for tokenized equities grows as xStocks hits $25B in total volume
Kraken’s tokenized equities platform, xStocks, has demonstrated unaudited momentum by surpassing $25 billion in total transaction volume less than eight months after launch. The achievement spans a blend of centralised and decentralised trading activity, as well as the minting and redemption of tokenized assets. In a market environment where crypto prices have fluctuated, the acceleration in tokenized equity volumes showcases growing investor curiosity about on-chain settlement, transparent asset representation, and regulated issuance models. The milestone is framed by the fact that xStocks began life in 2025 with a catalogue of more than 60 tokenized equities, a roster that included shares tied to Amazon, Meta Platforms, Nvidia and Tesla, among others.
According to Kraken, the $25 billion figure captures trading that occurs across both traditional exchange venues and decentralized trading channels, reflecting a broader push to digitize publicly traded securities. The platform’s issuer, Backed Finance, provides 1:1 backed representations of the underlying stocks and ETFs, offering a structured path for investors to own tokenized shares with clearly defined backing. Kraken positions itself as a gateway for such instruments, handling distribution and trading while Backed Finance shoulders the task of token issuance and alignment with real-world assets. This arrangement aligns with a growing appetite for regulated tokenized products that can be traded with familiar market mechanics while benefiting from the transparency of blockchain settlement.
On-chain activity has emerged as a major growth lever. With $3.5 billion in on-chain volume and more than 80,000 unique holders interacting with tokenized equities on public blockchains, the ecosystem is differentiating itself from conventional off-chain trading. On-chain participation implies that investors are comfortable with self-custody and direct visibility into transactions, a dynamic that complements the more traditional off-chain trading seen on centralized exchanges. The increased on-chain activity is also indicative of broader market interest in DeFi-native use cases for tokenized assets, including potential liquidity access, programmable settlement, and cross-venue arbitrage opportunities that leverage the transparent, verifiable nature of blockchain records.
Competitive dynamics within tokenized equities become more meaningful as data show eight of the 11 largest tokenized equities by unique holder count now belong to the xStocks ecosystem. This concentration hints at a rising market share within the tokenized equities space, where a core group of assets is attracting a growing community of holders. The development cements xStocks’ role as a leading force in the early-stage tokenization wave, signaling to issuers and investors that there is tangible, scalable demand for tokenized representations of real-world assets.
Beyond the headline numbers, the broader context underscores a market increasingly comfortable with tokenized real-world assets (RWAs). Tokenized RWAs grew by 13.5% in value over the last 30 days, a period when the overall crypto market moved lower by roughly $1 trillion in market capitalization. Market observers have likened tokenized stocks to a potential “stablecoin moment” for asset tokenization—where rapid early adoption leads to widespread acceptance and predictable use cases. Supporting data from Token Terminal shows tokenized stocks reached a market capitalization of about $1.2 billion in December, marking a notable emergence from a period of minimal presence just half a year prior. This trajectory suggests a broadening base of participants and a more robust, diversified ecosystem for tokenized asset products.
https://platform.twitter.com/widgets.js


Solomon urges strict US crypto rules as CLARITY Act momentum builds.
Summary
- Solomon says crypto must operate under a clear us rule-based framework, rejecting a “no rules” approach and citing el salvador as outlier.
- Senator Moreno targets april for passing the clarity act, arguing Republicans keep congress and dismissing democrat takeover risks.
- Ripple’s Garlinghouse puts odds near 80% that the market structure bill is signed by end of april once stablecoin reward disputes ease.
Goldman Sachs CEO David Solomon called for the United States to establish a clearly defined, rules-based framework governing crypto market operations during remarks at the World Liberty Forum in Mar-a-Lago on Wednesday.
Speaking in an interview with CNBC, Solomon stated that lawmakers should take a long-term view when shaping crypto legislation. The banking executive said the US banking system must function alongside emerging technologies rather than be displaced by them.
Solomon rejected the notion that cryptocurrency can thrive without regulatory oversight. “If there are people who think we are going to operate in this environment without rules, they are probably wrong, and they should move to El Salvador,” Solomon said, according to CNBC.
The CEO indicated Goldman Sachs maintains active involvement in digital asset-related areas, including digitization and tokenization. However, he noted that digital assets represent a relatively small portion of the firm’s overall operations.
Solomon’s comments came amid ongoing debate in Washington over proposed crypto market structure legislation, commonly referred to as the CLARITY Act. Senator Bernie Moreno acknowledged earlier Wednesday that he retains concerns about the bill, but expressed optimism that Congress could pass the measure by April, according to reports.
Moreno dismissed concerns that potential Democratic gains in November’s midterm elections could jeopardize the legislation. The senator predicted Republicans would maintain control of both chambers of Congress.
Ripple CEO Brad Garlinghouse suggested on Tuesday that the CLARITY Act could advance quickly toward passage once disputes over stablecoin rewards between banking and crypto sectors are resolved. Garlinghouse estimated an 80% probability the market structure bill will be signed into law by the end of April, according to his public statements.

Paul Atkins and Hester Peirce spoke at ETHDenver on Wednesday on the future of regulation at the SEC and its response to crypto market volatility.
Paul Atkins, chair of the US Securities and Exchange Commission (SEC), and the agency’s crypto task force head, Hester Peirce, said Wednesday they would support efforts to clarify how “tokenized securities interact with existing regulation,” better positioning industry developers.
Speaking to attendees at the ETHDenver conference on the future of regulation, Atkins and Peirce addressed concerns about volatility in many cryptocurrency prices and how the agency plans to move forward with digital asset regulation amid a potential market structure bill in Congress.
In response to “falling crypto prices of late,” likely referring to the price of Bitcoin (BTC) and Ether (ETH) falling by more than 28% and 40%, respectively, in the previous 30 days, Atkins said:
“As regulators, the best thing we can do is to ensure that the rules governing the asset classes we regulate enable people to have the information they need to express their market sentiments through decisions about whether to buy, sell, or hold the assets at issue.”

Neither commissioner directly spoke on efforts to pass market structure legislation in Congress, although Peirce said that the SEC had “provided technical assistance” on the matter. A bill moving through the US Senate, called the CLARITY Act when it passed the House of Representatives in July, could shift much of the SEC’s authority over digital assets to the Commodity Futures Trading Commission (CFTC).
Related: Democratic lawmakers slam SEC Chair Atkins over crypto enforcement
ETHDenver, happening this week in Colorado, is one of the largest cryptocurrency events in the United States, bringing together developers and industry leaders.
CFTC is still understaffed, despite Senate-confirmed chair
Michael Selig, confirmed as a commissioner and chair of the CFTC in December, remains the sole leader at an agency intended for five commission members. As the US Senate considers provisions within the market structure bill, some lawmakers have pushed for language requiring at least four commissioners to be confirmed before the law can take effect.
Magazine: Brandt says Bitcoin yet to bottom, Polymarket sees hope: Trade Secrets

The latest Federal Open Market Committee minutes struck a hawkish tone, pressuring risk assets including cryptocurrencies.
Summary
- Policymakers warned inflation progress may be “slower and more uneven,” signaling rate cuts are not imminent and that hikes have not been fully ruled out.
- With Treasury yields rising and easing deemed potentially premature, high-beta assets like Bitcoin, Ethereum and XRP faced renewed selling pressure.
- BTC holds near $66.8K but remains below its 50-day SMA; ETH consolidates near $1,960 with weak inflows; XRP trades under key Bollinger resistance near $1.46.
Policymakers acknowledged that while inflation has cooled from its highs, progress toward the Fed’s 2% target “might be slower and more uneven than generally expected,” and warned that the risk of inflation remaining persistently above target “was meaningful.”
That language reinforced expectations that rate cuts are not imminent and that policymakers remain cautious about declaring victory over price pressures.
The minutes also revealed that several participants would have supported a “two-sided” description of risks, signaling that further rate hikes have not been fully ruled out if inflation reaccelerates. At the same time, officials indicated that additional policy easing “may not be warranted” until there is clear evidence that disinflation is firmly back on track.
While two members dissented in favor of an immediate cut, the broader message emphasized patience and vigilance, a stance that typically tightens financial conditions and weighs on high-beta assets such as crypto.
With Treasury yields climbing and expectations for near-term liquidity fading, digital assets faced renewed selling pressure. This sets the stage for a closer look at how Bitcoin (BTC), Ethereum (ETH) and XRP (XRP) are reacting on the charts.
Crypto price prediction: Bitcoin (BTC)
Bitcoin extended its pullback following the hawkish Fed minutes, briefly dipping toward $65,000 before stabilizing before staging a rebound. It is currently trading around $66,800, but remains well below the 50-day SMA near $82,600, which signals that the broader short-term trend is still bearish.
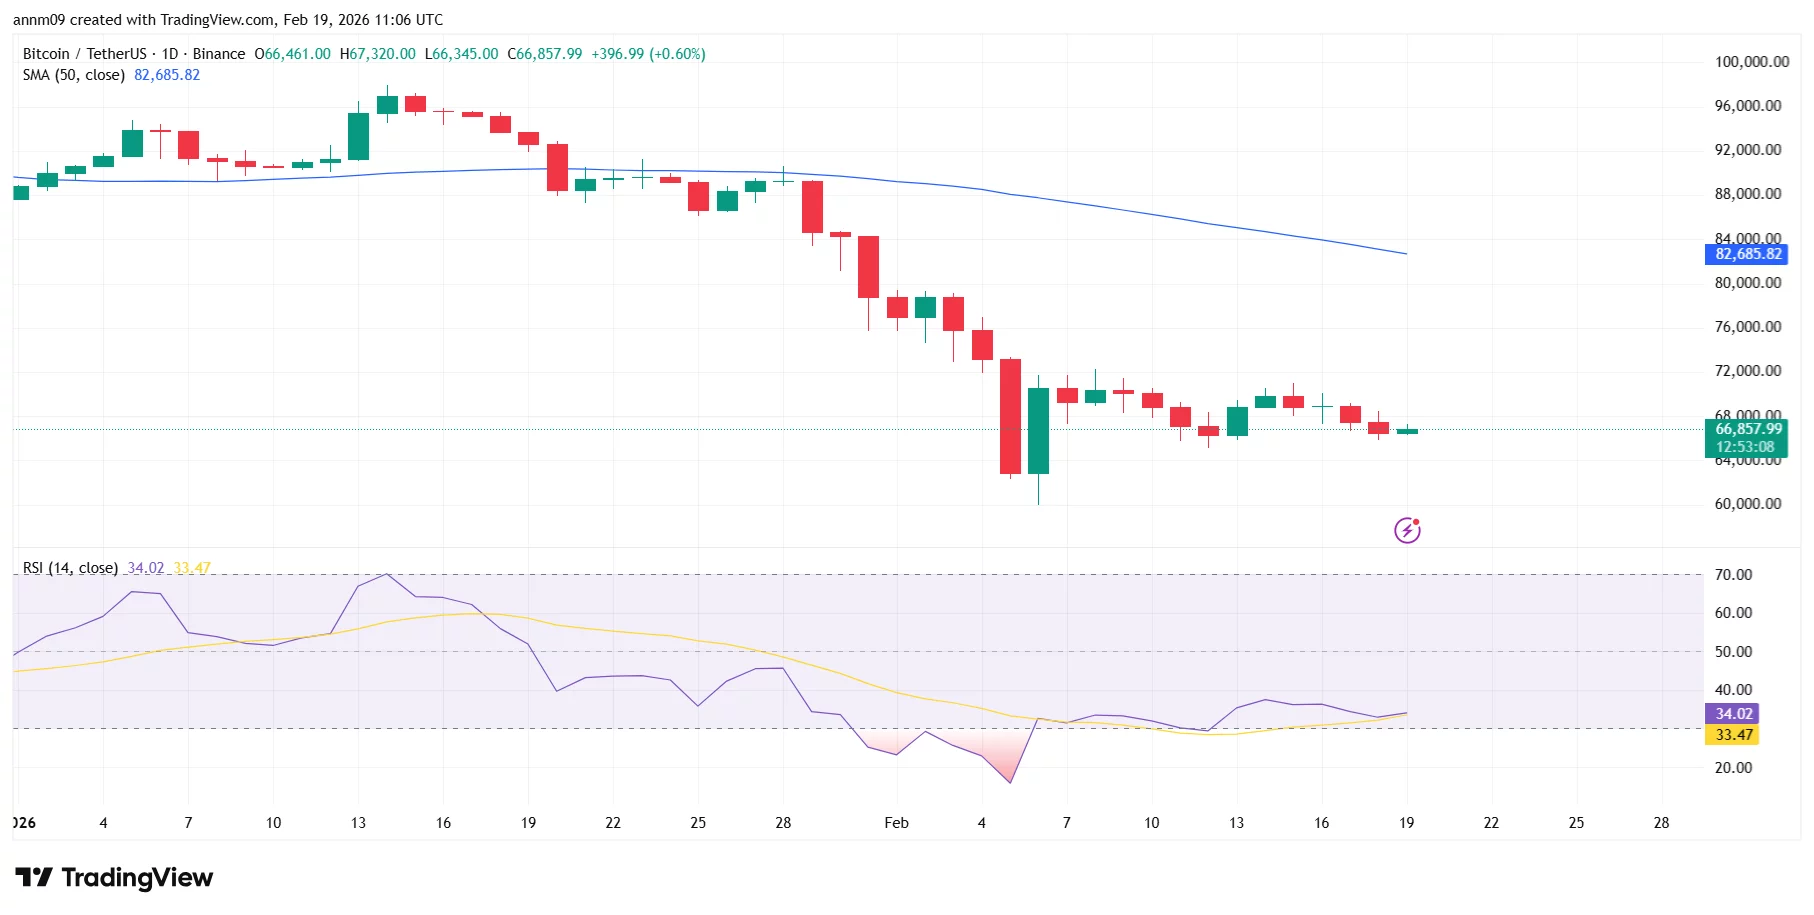
The RSI is hovering around 34, recovering from near-oversold territory but still below the neutral 50 level, suggesting weak momentum despite the bounce. Immediate support sits near $64,000, followed by the recent low around $60,000.
On the upside, resistance is seen near $70,000, with stronger structural resistance around $75,000–$76,000. Unless BTC reclaims those levels, rallies may continue to face selling pressure.
Ethereum (ETH)
Ethereum saw a sharp sell-off in early February, dropping toward the $1,900 zone before stabilizing. It is now trading around $1,960, consolidating in a tight range amid the Fed-driven volatility.
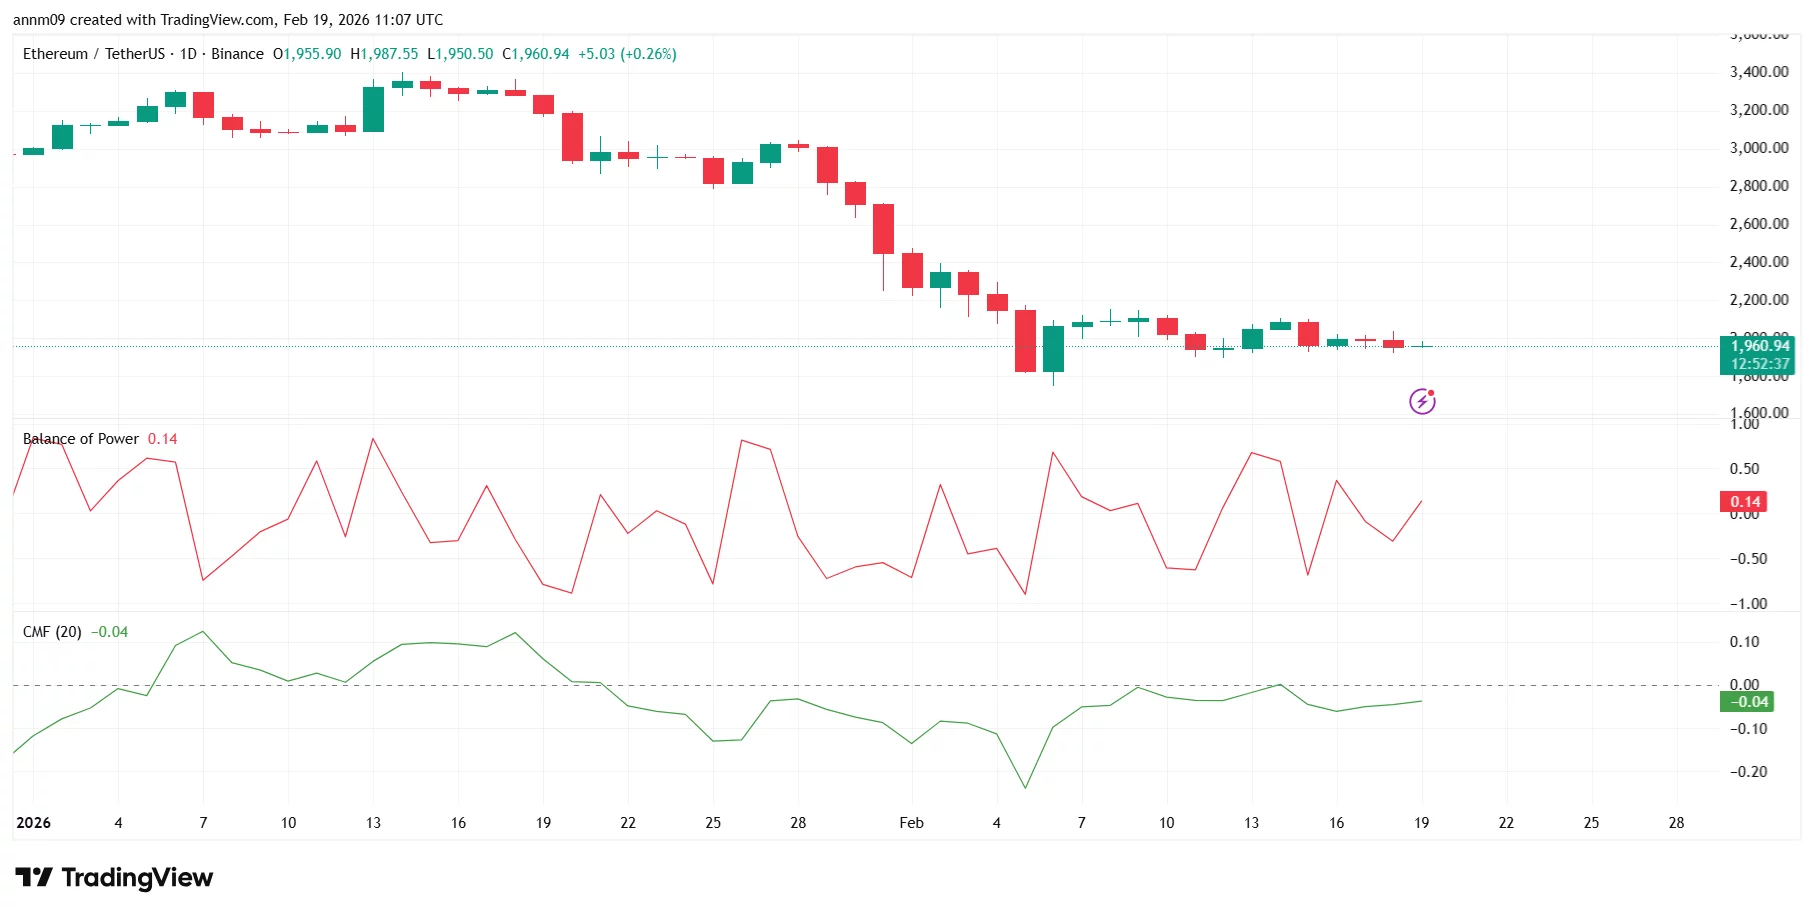
The Balance of Power indicator has turned slightly positive, hinting at mild buying pressure, but CMF remains marginally negative, suggesting capital inflows are still weak. Immediate support lies at $1,900, with a deeper floor around $1,800.
On the upside, ETH faces resistance near $2,050, followed by $2,200, where prior breakdown levels sit.
XRP
XRP remains under pressure compared to BTC and ETH. After sliding from above $2.00 earlier in the year, it recently bounced from the $1.20–$1.25 area and is currently trading near $1.41.
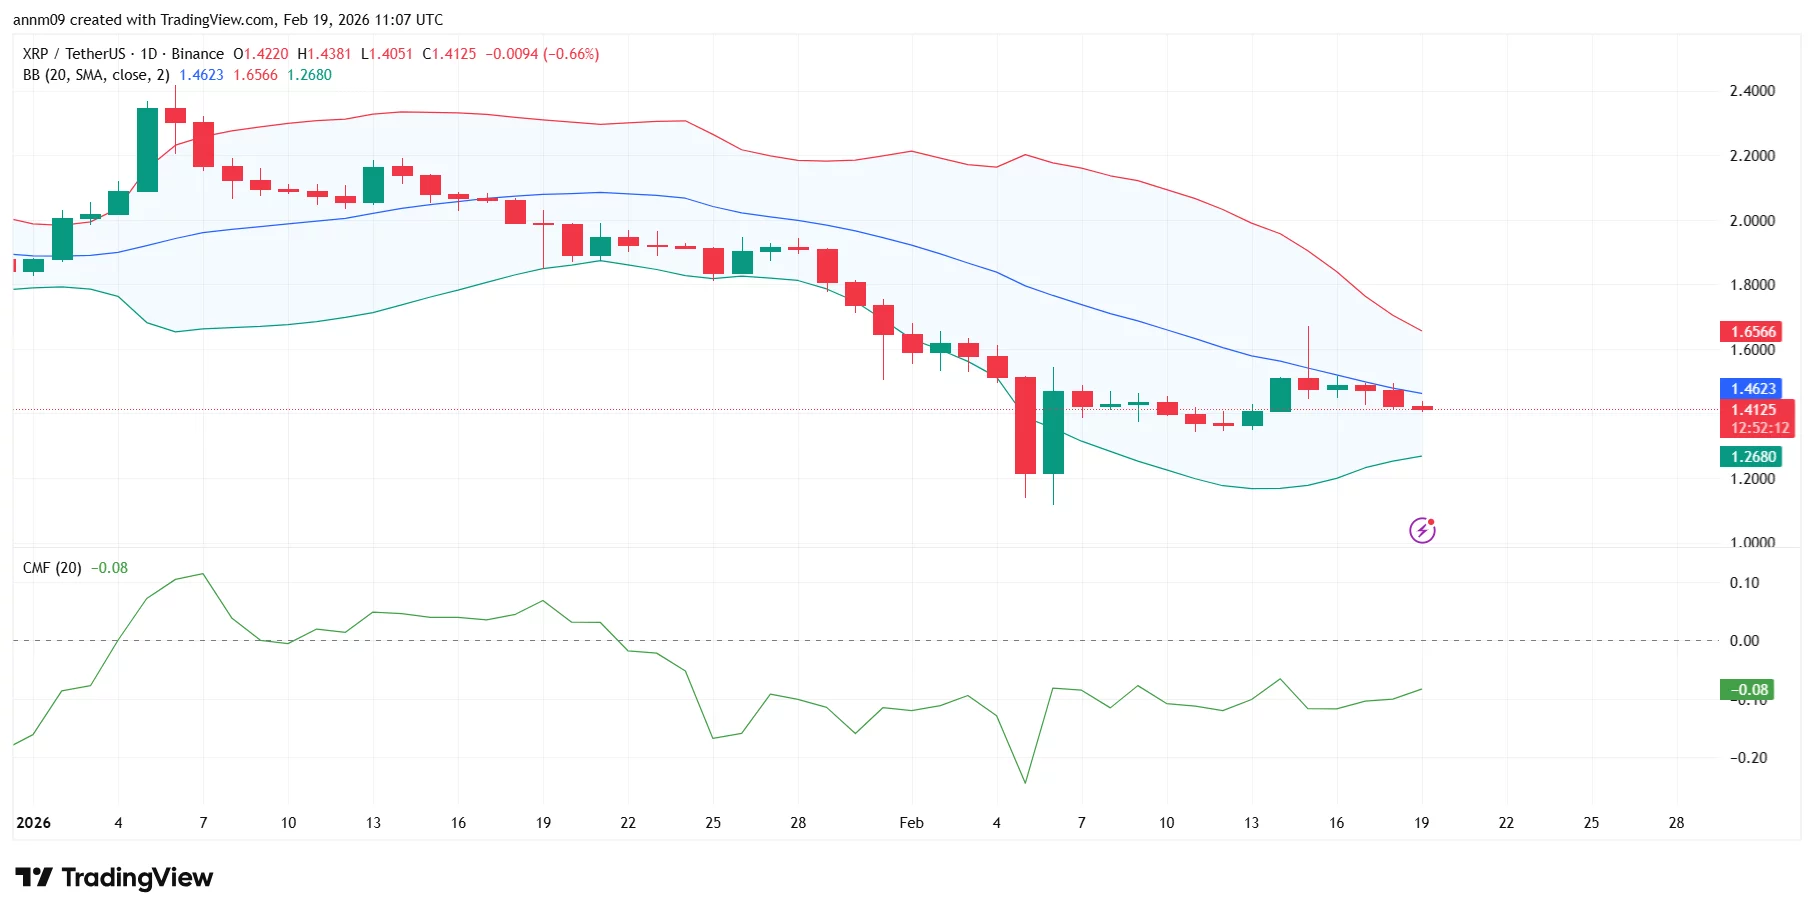
Price is sitting below the mid-Bollinger Band (around $1.46), while the upper band near $1.65 acts as dynamic resistance.
CMF remains slightly negative, indicating limited buying conviction. Immediate support rests at $1.35, followed by the recent swing low near $1.25. Resistance is seen at $1.46, with a stronger barrier at $1.60–$1.65.
Endangered marine life is being caught in fishing nets, but it doesn’t need to be

Aussie shares ease from record highs with gains intact

Will Bitcoin Crash to $50K?


-

 Video3 days ago
Bitcoin: We’re Entering The Most Dangerous Phase
-

 Tech5 days ago
Luxman Enters Its Second Century with the D-100 SACD Player and L-100 Integrated Amplifier
-

 Crypto World3 days ago
Can XRP Price Successfully Register a 33% Breakout Past $2?
-

 Sports3 days ago
GB's semi-final hopes hang by thread after loss to Switzerland
-

 Video7 days ago
The Final Warning: XRP Is Entering The Chaos Zone
-
 Tech3 days ago
The Music Industry Enters Its Less-Is-More Era
-

 Business2 days ago
Infosys Limited (INFY) Discusses Tech Transitions and the Unique Aspects of the AI Era Transcript
-

 Entertainment2 days ago
Kunal Nayyar’s Secret Acts Of Kindness Sparks Online Discussion
-

 Video3 days ago
Financial Statement Analysis | Complete Chapter Revision in 10 Minutes | Class 12 Board exam 2026
-

 Tech2 days ago
Retro Rover: LT6502 Laptop Packs 8-Bit Power On The Go
-
 Crypto World6 days ago
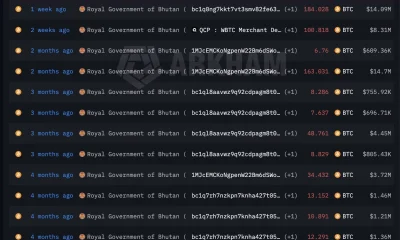
Bhutan’s Bitcoin sales enter third straight week with $6.7M BTC offload
-
 Sports22 hours ago
Clearing the boundary, crossing into history: J&K end 67-year wait, enter maiden Ranji Trophy final | Cricket News
-

 Entertainment1 day ago
Dolores Catania Blasts Rob Rausch For Turning On ‘Housewives’ On ‘Traitors’
-

 Crypto World7 days ago
Kalshi enters $9B sports insurance market with new brokerage deal
-

 Business2 days ago
Tesla avoids California suspension after ending ‘autopilot’ marketing
-
 NewsBeat4 days ago
The strange Cambridgeshire cemetery that forbade church rectors from entering
-

 Crypto World1 day ago
WLFI Crypto Surges Toward $0.12 as Whale Buys $2.75M Before Trump-Linked Forum
-
 NewsBeat4 days ago
Man dies after entering floodwater during police pursuit
-

 Crypto World5 hours ago
83% of Altcoins Enter Bear Trend as Liquidity Crunch Tightens Grip on Crypto Market
-

 NewsBeat6 days ago
UK construction company enters administration, records show