

Crypto World
The 100-Day Crypto Bloodbath That’s Crushing Altcoins


According to CoinGlass, momentum gauges sit in neutral territory, reinforcing views that neither bulls nor bears dominate yet across majors.
The crypto market has lost about $730 billion in value in the past 100 days, according to data shared by on-chain analyst GugaOnChain on February 20.
The scale and speed of the drawdown point to heavy capital outflows, with smaller altcoins falling faster than large assets and traders watching for signs of stabilization.
Deepening Bearish Sentiment
According to GugaOnChain, Bitcoin’s market cap fell from $1.69 trillion on November 22, 2025, to $1.34 trillion currently, a decline of 21.62%. The top 20 cryptocurrencies, excluding Bitcoin and stablecoins, also suffered a major blow, dropping 15.17% from $1.07 trillion to $810.65 billion.
Just as vulnerable were mid- and small-cap altcoins, which plunged 20.06% from $390.38 billion to $267.63 billion over their respective 100-day windows.
Meanwhile, the selling pressure shows no sign of abating. Separate figures posted by Arab Chain show whale inflows to Binance reached a 30-day average near $8.3 billion, the highest level since 2024.
Large transfers to exchanges can signal preparation to sell or rebalance holdings, though such flows can also reflect derivatives positioning or liquidity management. The spike followed months of stable activity, which analysts often treat as a sign of changing sentiment among major holders.
Price action seems to be matching that cagey tone. At the time of writing, BTC was trading just below the $68,000 level after falling by more than 24% in the last month and roughly 30% over the past year.
You may also like:
Market-wide metrics also paint a similar picture, with total crypto capitalization standing near $2.4 trillion, up just 0.5% in 24 hours. According to CoinGlass, the average RSI sits near 45, indicating neutral momentum, and the Altcoin Season Index reads 45, also neutral.
Additionally, Bitcoin dominance holds near 57%, which signals that capital has not rotated aggressively into altcoins.
On-Chain Activity Slows
Recent data from market intelligence provider Santiment shows that network activity has also collapsed alongside prices. According to the firm, Bitcoin’s active supply stopped growing, with fewer coins moving across the network.
Per the data, there are 42% fewer unique Bitcoin addresses making transactions compared to 2021 levels, and 47% fewer new addresses are being created. Analysts describe this phenomenon as “social demotivation,” which is emotional fatigue and reduced engagement that often precedes narrative shifts.
Elsewhere, Glassnode reported that Bitcoin has broken below the “True Market Mean” and slipped into a defensive range toward the realized price of approximately $54,900. Historically, deeper bear market phases have tended to find their lower structural boundary around this level, which represents the average acquisition cost of all circulating coins.
Furthermore, the Accumulation Trend Score sits near 0.43, well short of the 1.0 level that would signal serious large-entity buying. At the same time, Spot Cumulative Volume Delta has turned negative across major exchanges, meaning sellers are still in control.
SECRET PARTNERSHIP BONUS for CryptoPotato readers: Use this link to register and unlock $1,500 in exclusive BingX Exchange rewards (limited time offer).


TLDR
- Opendoor (OPEN) stock jumped up to 16.5% after-hours Thursday after Q4 earnings
- Q4 revenue of $736 million beat Wall Street’s $595 million estimate by 23.7%
- Home acquisition volume surged 46% quarter-over-quarter
- Adjusted EPS of -$0.07 beat the -$0.09 analyst estimate
- Management targets breakeven adjusted net income by end of 2026
Opendoor stock jumped as much as 16.5% in after-hours trading Thursday after Q4 2025 earnings topped revenue estimates by a wide margin and home acquisition volume accelerated sharply.
Revenue came in at $736 million against a Wall Street estimate of $595 million — a 23.7% beat. Year-on-year revenue was still down 32.1%, reflecting the company’s ongoing reset, but investors chose to focus on the forward momentum.
Opendoor Technologies Inc., OPEN
Adjusted EPS of -$0.07 also beat the -$0.09 consensus estimate, clearing expectations by roughly 25%.
Acquisition Volume and Inventory Turns Drive Optimism
The headline number for many investors was home acquisition volume, up 46% quarter-over-quarter. That points to Opendoor pushing back toward scale after a prolonged pullback.
The share of homes sitting on the market for more than 120 days dropped to 33%, down from 51% in Q3 2025. Faster inventory turns reduce capital drag and are central to the company’s recovery plan.
Free cash flow swung to positive $67 million from negative $83 million a year earlier. Fixed operating expenses fell to $35 million, a sign of leaner operations taking hold.
CEO Kaz Nejatian credited structural changes in how the business runs. “These results reflect structural improvements in how we operate — with more accurate pricing, faster inventory turns, and disciplined selection,” he said.
The company’s “Cash Plus” program now makes up 35% of weekly volume, which Opendoor sees as a key tool for improving capital efficiency.
Q1 2026 Guidance
For Q1 2026, Opendoor guided for an adjusted EBITDA loss of $30 million to $35 million. The midpoint of -$32.5 million beat analyst estimates of -$37.4 million.
Revenue is expected to drop around 10% in the upcoming quarter. The company has been clear it is not managing for short-term targets.
“We’re focused on making the right long-term decisions to rebuild Opendoor rather than managing to short-term guidance,” management said.
Homes sold in Q4 totaled 1,978, down 844 year-on-year. Analysts expect revenue to grow around 7% over the next 12 months, with full-year adjusted EPS improving from -$0.25 to -$0.21.
The stock was trading near $5.36 after the release, with a market cap of around $4.41 billion.

By Francisco Rodrigues (All times ET unless indicated otherwise)
Bitcoin has gained 2% in the past 24 hours, scrambling to top $68,000 after a selloff earlier this month. That’s done little to ease sentiment, with the “Fear and Greed” index remaining at the “extreme fear” level for a 20th straight day.
André Dragosch, the head of research in Europe at Bitwise, said consolidation is expected after the crash, which saw bitcoin drop to a $60,000 low.
“Apart from Covid, bitcoin doesn’t usually show V-shaped recoveries after strong capitulations,” he told CoinDesk. “The most likely case is that we continue to move sideways to down.”
Still, Dragosch pointed to signs for optimism. Prediction markets now place the odds of the U.S.’s Clarity Act passing in 2026 near 80%. He described the bill as a major catalyst for alternative tokens such as ether (ETH) and solana (SOL). Bitwise’s internal Cryptoasset Sentiment Index registered neutral, he added.
“On the macro front, bitcoin continues to exhibit significant ‘discounts’ with respect to global money supply, gold, and the overall macro growth outlook. Bitcoin also exhibits a significant undervaluation relative to global Bitcoin ETP flows,” Dragosch said. “ETP flows are still relatively weak, but once risk appetite and flows return, this suggests we could see a significant catch-up in bitcoin.”
Caution lingers, however. Data from CryptoQuant shows large bitcoin holders have moved coins onto Binance at record levels. Such transfers often signal intent to sell, increasing the supply on spot markets and potentially weighing on prices.
Dragosch rejected concerns bitcoin may be a “canary in the macro coal mine,” signaling tighter liquidity and rising recession risk. The U.S. yield curve and other forward indicators suggest continued money supply growth, he said. Global liquidity is expanding at more than 10% a year, a backdrop that has not typically aligned with extended bitcoin bear markets, he added.
Indeed, prediction markets have reduced the odds of a recession in the U.S. this year. The chance of that happening plunged from over 40% in mid-2025 to just above 20%.
The crypto market may nevertheless see volatility rise into the weekend. Later today, U.S. core PCE index data is released, which could provide clues on future Fed policy direction.
Traders are bracing for a tight rise from previous figures. While higher inflation traditionally supports the case for scarce assets, a hawkish reaction from the Fed could drive the dollar higher, further pressuring risk assets into the weekend. Stay alert!
Read more: For analysis of today’s activity in altcoins and derivatives, see Crypto Markets Today
What to Watch
For a more comprehensive list of events this week, see CoinDesk’s “Crypto Week Ahead“.
- Crypto
- Macro
- Feb. 20. 8:30 a.m.: U.S. Core PCE price index MoM for December est. 0.4% (Prev. 0.2%); YoY est. 2.9% (Prev. 2.8%)
- Feb. 20, 8:30 a.m.: U.S. GDP growth rate QoQ Adv for Q4 est. 3. (Prev. 4.4%)
- Feb. 20, 9:45 a.m.: U.S. S&P Global manufacturing PMI flash for February est. 52.6 (Prev. 52.4).
- Feb. 20, 10 a.m.: U.S. Michigan consumer sentiment final for February est. 57.3 (Prev. 56.4)
- Earnings (Estimates based on FactSet data)
Token Events
For a more comprehensive list of events this week, see CoinDesk’s “Crypto Week Ahead“.
- Governance votes & calls
- Aavegotchi DAO is voting to consolidate assets from depleted wallets into the Liquidity wallet to simplify operations. Voting ends Feb. 22.
- Fluid DAO is voting to withdraw 1 million GHO and 1 million FLUID from the treasury to the Team Multisig to fund JupLend rewards and protocol incentives. Voting ends Feb. 22.
- GMX is voting on a proposal to implement tiered trading fee discounts for stakers and a staker-weighted trading leaderboard. Voting ends Feb. 22.
- Unlocks
- Feb. 20: LayerZero (ZRO) to unlock 5.98% of its circulating supply worth $48.33 million.
- Feb. 20: Kaito (KAITO) to unlock 10.64% of its circulating supply worth $10.77 million.
- Token Launches
Conferences
For a more comprehensive list of events this week, see CoinDesk’s “Crypto Week Ahead“.
Market Movements
- BTC is up 1.97% from 4 p.m. ET Thursday at $68,220.42 (24hrs: +1.98%)
- ETH is up 1.1% at $1,969.19 (24hrs: +0.12%)
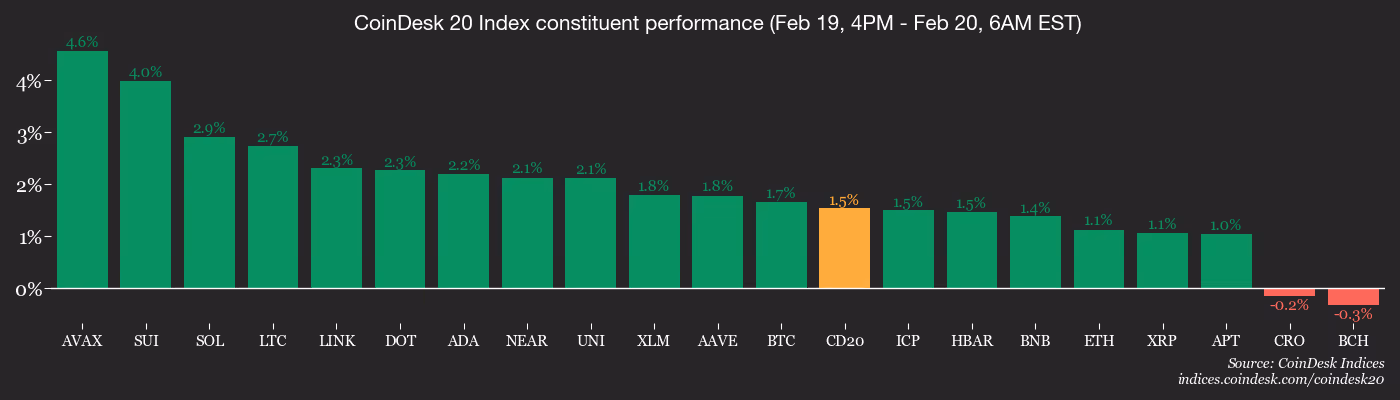
- CoinDesk 20 is up 1.5% at 1,960.80 (24hrs: +1.14%)
- Ether CESR Composite Staking Rate is up 2 bps at 2.83%
- BTC funding rate is at -0.0047% (-5.1936% annualized) on Binance

- DXY is unchanged at 97.95
- Gold futures are up 0.97% at $5,046.00
- Silver futures are up 3.9% at $80.66
- Nikkei 225 closed down 1.12% at 56,825.70
- Hang Seng closed down 1.1% at 26,413.35
- FTSE is up 0.69% at 10,700.09
- Euro Stoxx 50 is up 0.48% at 6,088.42
- DJIA closed on Thursday down 0.54% at 49,395.16
- S&P 500 closed down 0.28% at 6,861.89
- Nasdaq Composite closed down 0.31% at 22,682.73
- S&P/TSX Composite closed up 0.61% at 33,594.98
- S&P 40 Latin America closed up 0.83% at 3,738.74
- U.S. 10-Year Treasury rate is down 0.4 bps at 4.071%
- E-mini S&P 500 futures are up 0.2% at 6,890.75
- E-mini Nasdaq-100 futures are up 0.29% at 24,930.00
- E-mini Dow Jones Industrial Average Index futures are up 0.12% at 49,516.00
Bitcoin Stats
- BTC Dominance: 59.04% (+0.4%)
- Ether-bitcoin ratio: 0.02883 (-0.93%)
- Hashrate (seven-day moving average): 1,046 EH/s
- Hashprice (spot): $29.88
- Total fees: 2.36 BTC / $157,285
- CME Futures Open Interest: 119,935 BTC
- BTC priced in gold: 13.5 oz.
- BTC vs gold market cap: 4.54%
Technical Analysis

- The chart shows bitcoin’s weekly price moves against the dollar.
- BTC/USD weekly is still trading at its 200-week exponential moving average, waiting for a confirmation by the end of the week.
- There are no clear RSI divergences or signs of a bottom so far.
Crypto Equities
- Coinbase Global (COIN): closed on Thursday at $165.94 (+1.15%), +1.98% at $169.23 in pre-market
- Circle Internet (CRCL): closed at $61.92 (-1.95%), +2.08% at $63.21
- Galaxy Digital (GLXY): closed at $21.63 (-0.46%)
- Bullish (BLSH): closed at $32.37 (+1.63%), -1.05% at $32.03
- MARA Holdings (MARA): closed at $7.96 (+6.13%), +1.63% at $8.09
- Riot Platforms (RIOT): closed at $16.22 (+4.71%), +1.36% at $16.44
- Core Scientific (CORZ): closed at $17.98 (+4.11%)
- CleanSpark (CLSK): closed at $9.82 (+5.93%), +1.43% at $9.96
- CoinShares Valkyrie Bitcoin Miners ETF (WGMI): closed at $40.69 (+1.62%)
- Exodus Movement (EXOD): closed at $10.42 (+5.47%)
Crypto Treasury Companies
- Strategy (MSTR): closed at $129.45 (+3.39%), +2.48% at $132.66
- Strive (ASST): closed at $8.12 (+0.87%), +0.99% at $8.20
- SharpLink Gaming (SBET): closed at $6.80 (+3.03%)
- Upexi (UPXI): closed at $0.67 (-3.33%), +3.48% at $0.69
- Lite Strategy (LITS): closed at $1.10 (+0.00%)
ETF Flows
Spot BTC ETFs
- Daily net flows: -$165.8 million
- Cumulative net flows: $53.91 billion
- Total BTC holdings ~1.26 million
Spot ETH ETFs
- Daily net flows: -$130.1 million
- Cumulative net flows: $11.55 billion
- Total ETH holdings ~5.73 million
Source: Farside Investors
While You Were Sleeping

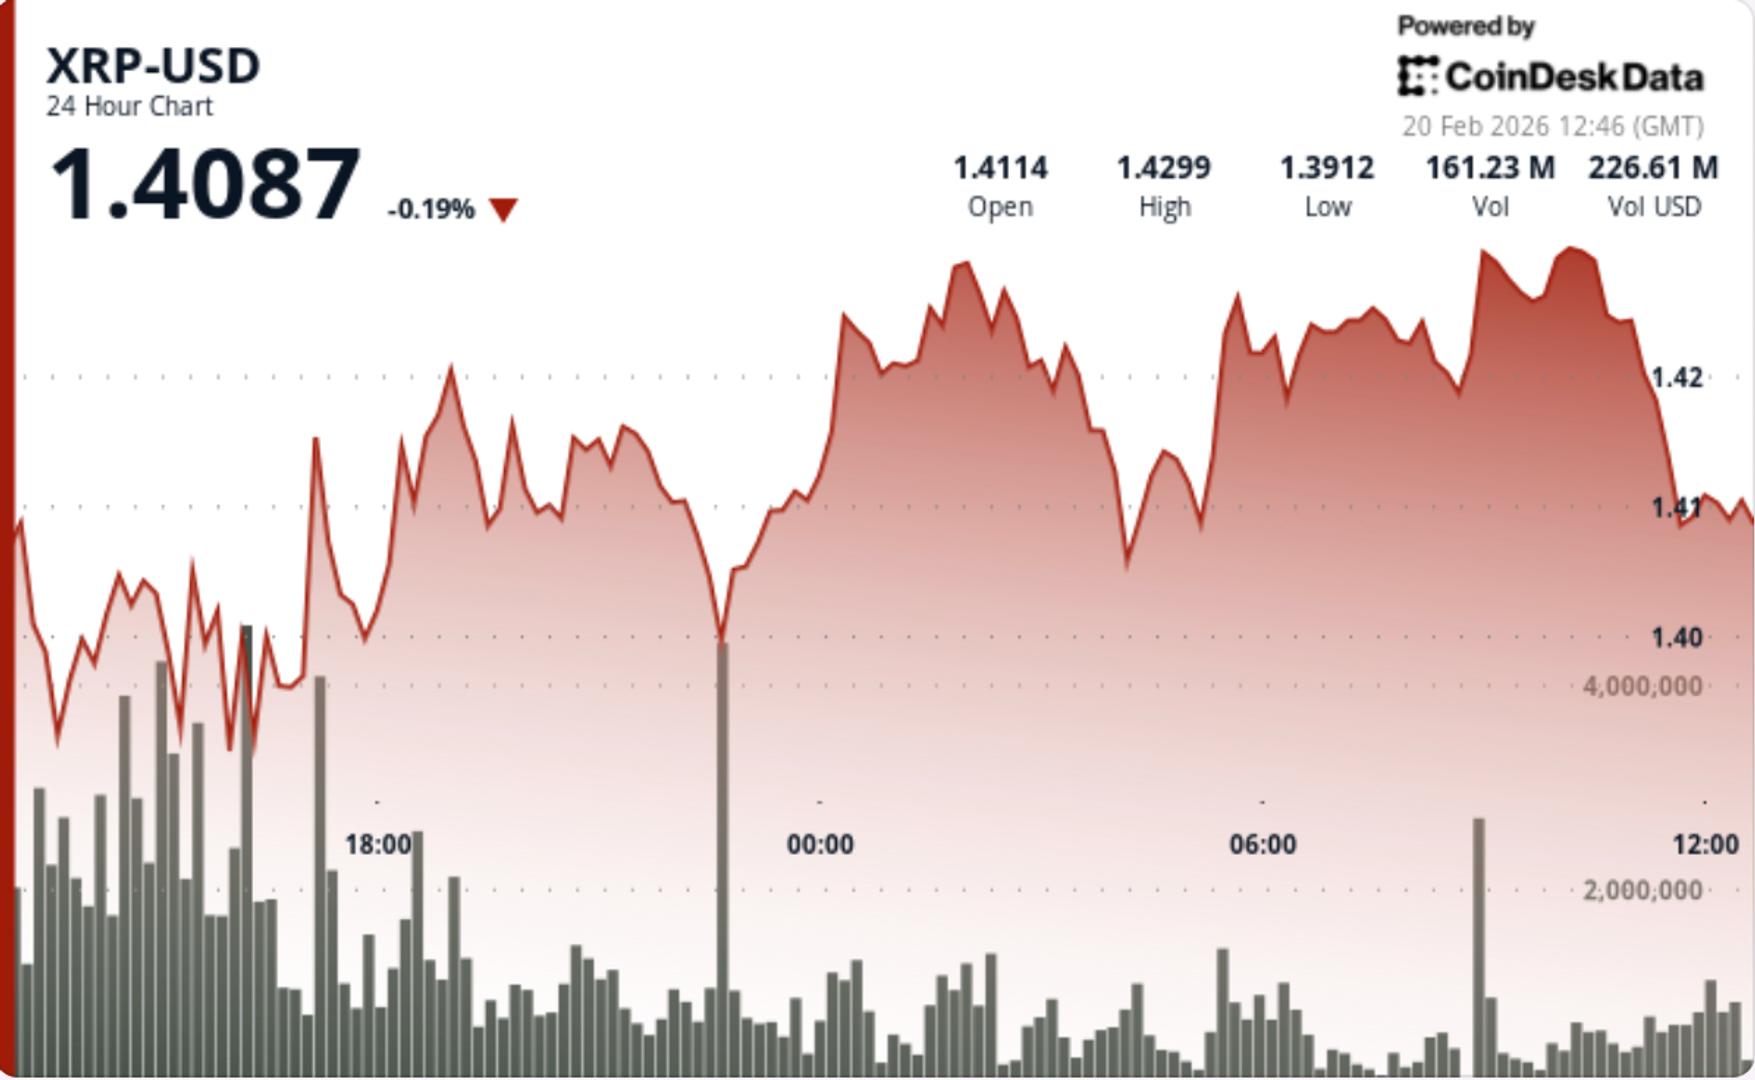
XRP held steady near $1.42 as volatility dropped to levels last seen before a major 2024 rally, raising questions about whether the downtrend is exhausting.
News Background
- XRP has declined roughly 61% from its all-time high during the current stretch of market turbulence, but recent price action suggests the selloff may be slowing. Losses have moderated into consolidation, with small gains across shorter timeframes replacing sharp directional moves.
- Notably, XRP’s historical volatility has fallen to 96, matching levels last seen in June 2024 — a period that marked the bottom of a prior downtrend before a rally into November.
- The compression has fueled speculation that XRP may be entering a similar base-building phase.
- Some analysts point to parallels with earlier cycle structures, including the extended consolidation that preceded the 2017 breakout.
Price Action Summary
- XRP slipped 0.14% to $1.42
- Price tested and held support near $1.39
- Volume surged nearly 94% above average during the breakdown
- Recovery stalled near $1.428–$1.431 resistance
Technical Analysis
- The session’s key moment came when XRP tested $1.3915 on heavy volume before stabilizing. While the bounce completed a 38.2% retracement, momentum faded as price approached $1.44, the daily pivot and near-term ceiling.
- Structure remains cautious below $1.44–$1.45, but the successful defense of $1.39 suggests sellers are losing urgency. Declining volume during consolidation points to compression rather than fresh distribution.
What traders say is next?
- Traders view this as a compression setup.
- If XRP reclaims $1.44, it opens room toward $1.50 and potentially $1.62.
If $1.39 breaks, downside risk shifts toward $1.35. - With volatility near prior cycle lows, the next decisive move may be less about direction now — and more about how long this compression can hold before expansion resumes.
According to media reports, Bitcoin’s fall from its all-time high in October 2025 to February’s low near $60k triggered the largest outflow from spot Bitcoin ETF funds since their launch in January 2024.
Glassnode data show that more than 100,000 BTC were withdrawn from these funds in January alone, though the total remains substantial, with roughly 1.25 million coins still held on balance sheets.
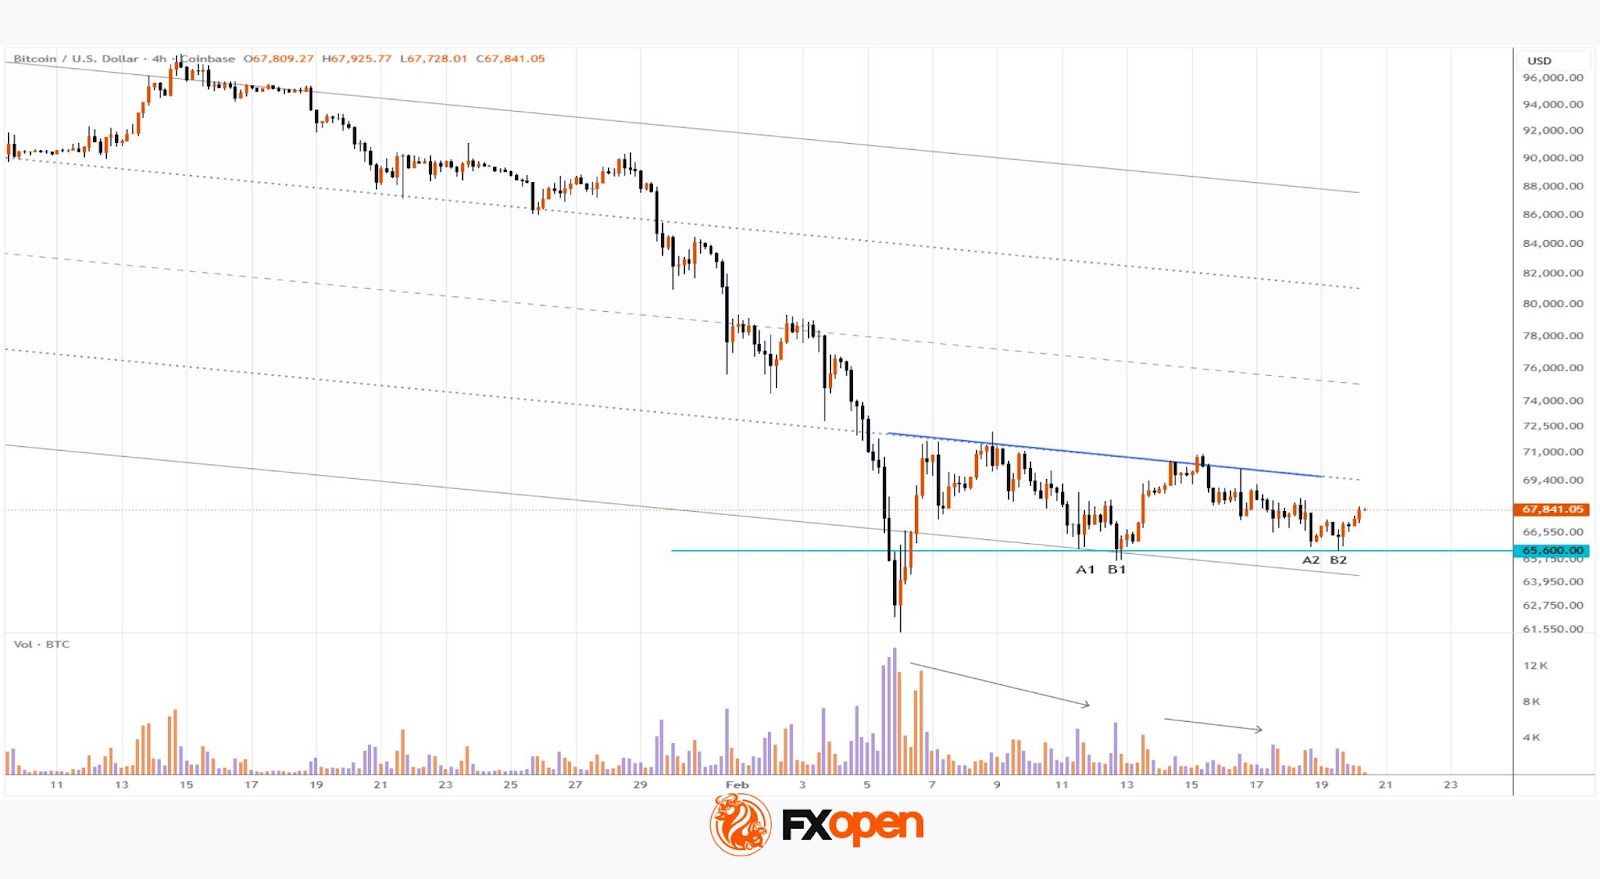
Analysing trading volumes on Coinbase, however, reveals a trend of declining activity (as indicated by the arrow). From a long-term perspective, this may suggest the ETF outflow trend is easing, potentially allowing the market to resume its multi-year uptrend. How plausible is this scenario?

Technical Analysis of BTC/USD
Bitcoin’s price fluctuations are currently compressing between the thick lines on the chart – a sign of market stabilisation, where supply and demand appear balanced.
Notable bullish patterns include:
- A double bottom (A1–B1) on 11–12 February, aligning with the lower boundary of the long-term descending channel.
- A second double bottom (A2–B2) on 18–19 February, featuring a slightly lower secondary low.
In the short term, traders might anticipate a rebound towards the upper boundary of the triangle. While the descending channel remains relevant, a decisive bullish break of this consolidation pattern would signal improving sentiment in the crypto market following February’s panic selling.
FXOpen offers the world’s most popular cryptocurrency CFDs*, including Bitcoin and Ethereum. Floating spreads, 1:2 leverage — at your service (additional fees may apply). Open your trading account now or learn more about crypto CFD trading with FXOpen.
*Important: At FXOpen UK, Cryptocurrency trading via CFDs is only available to our Professional clients. They are not available for trading by Retail clients. To find out more information about how this may affect you, please get in touch with our team.
This article represents the opinion of the Companies operating under the FXOpen brand only. It is not to be construed as an offer, solicitation, or recommendation with respect to products and services provided by the Companies operating under the FXOpen brand, nor is it to be considered financial advice.
Artificial Intelligence is no longer an experimental capability; it is redefining how businesses generate revenue, manage risk, optimize operations, and compete at scale. In 2026, the impact of AI on businesses is visible in faster decision cycles, predictive supply chains, autonomous customer engagement systems, and data-driven product innovation. Intelligence is no longer layered onto systems; it is becoming the system itself.
Enterprises that embed AI into their operational core are compressing costs, accelerating time-to-market, and increasing customer lifetime value. Those who hesitate remain trapped in fragmented data environments and reactive decision models. The competitive divide is widening not because of access to AI tools, but because of how strategically AI is integrated into enterprise architecture, often with the support of an experienced AI Development Company capable of aligning technology with measurable business outcomes.
This guide breaks down the real impact of AI on business performance, from data maturity and workflow orchestration to ROI measurement and autonomous operations. It provides a structured roadmap for leaders who want to move beyond pilots, scale intelligently through comprehensive AI Development Services, and convert AI investment into a measurable enterprise advantage.
1. AI in 2026: From Pilots to Production – The Adoption Reality Check
Despite massive hype and rapid investment growth, the journey from pilot projects to enterprise-wide AI adoption remains uneven.
- Gartner forecasts global AI spending will exceed $2.5 trillion in 2026, with AI services, infrastructure, and software driving massive enterprise budgets.
- Research shows that only a small percentage of companies have AI fully embedded in core workflows, with as few as 5% deriving significant value from their deployments, despite broad adoption efforts.
- IBM’s Global AI Adoption Index reports 42% of enterprises actively deploying AI, while another 40% remain in the exploration stage.
This gap between adoption and actual impact highlights a defining theme of 2026: AI is no longer optional, but far from fully realized.
2. Why Many AI Projects Fall Short: The “Execution Divide”
Data shows that enterprises frequently struggle to scale AI beyond proof-of-concept (POC) due to:
1. Lack of AI-Ready Data
AI systems are only as effective as the data that fuels them. Fragmented, noisy, or siloed data pipelines undermine model accuracy and enterprise insight generation.
2. Misalignment of Strategy with Business Outcomes
Executives often invest in technology first and strategy second, leading to solutions that don’t solve real business problems.
3. Organizational Resistance
AI transformations require process redesign, workforce shift, and governance maturity, not just technology. Without aligning people and workflows, most initiatives stall.
4. Overemphasis on Tools vs. Outcomes
Although 78% of organizations report using AI, only a fraction derive a measurable business impact because their workflows remain unchanged.
This execution gap is why many teams invest heavily but see little strategic value.
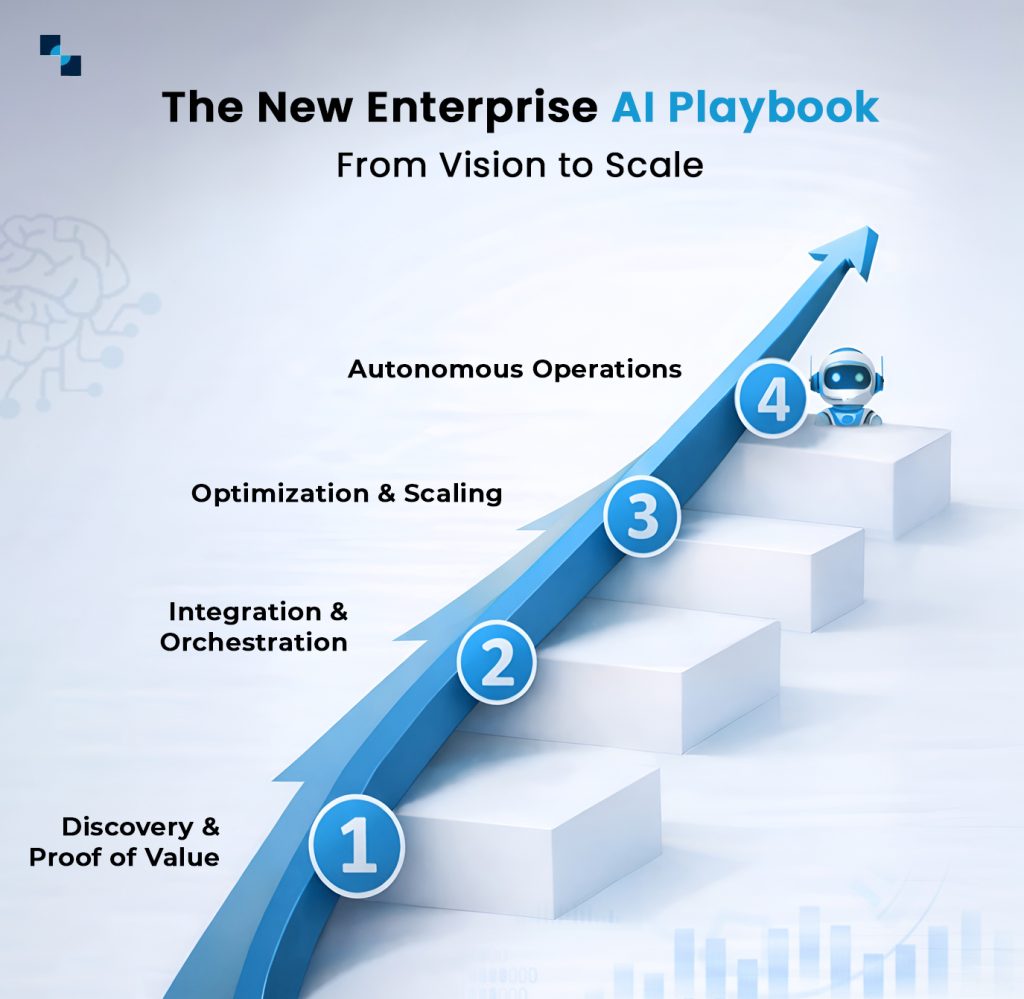
3. The New Enterprise AI Playbook: From Vision to Scale
To succeed in 2026, enterprises must follow a structured transformation path:
Stage 1: Discovery & Proof of Value
- Define specific business outcomes (e.g., cost reduction, revenue uplift, customer personalization).
- Identify high-impact use cases (e.g., automated claims processing, dynamic pricing models).
Stage 2: Integration & Orchestration
- Enterprises partnering with an AI Development Company for Business are embedding generative models directly into core operational workflows.
- Establish robust data governance frameworks.
Stage 3: Optimization & Scaling
- Transition from discrete models to a connected AI ecosystem that powers cross-functional intelligence.
- Track ROI consistently and build feedback loops for continuous improvement.
Stage 4: Autonomous Operations
- Mature organizations will reach a point where AI proactively manages resource allocation, pricing, and risk response.
According to Gartner’s 2026 Enterprise AI Outlook, the maturity of enterprise AI outcomes is increasingly determined by data readiness, seamless process integration, and clearly measurable ROI rather than by technology expenditure or model scale alone.

4. Demonstrable ROI: How AI Delivers Real Business Value
The most successful companies measure AI through three ROI dimensions:
Direct ROI
- Operational cost reduction
- Efficiency gains via automation and workflow augmentation
Indirect ROI
- Increased customer lifetime value through personalization
- Better customer satisfaction via AI-driven experiences
Strategic ROI
- Shorter product cycles
- Faster innovation via predictive insights and AI-augmented R&D
Organizations leveraging structured AI Development Services ensure that AI initiatives are aligned with measurable business objectives, linking model performance directly to revenue growth, operational efficiency, and strategic impact.
Recent enterprise research from Deloitte finds that AI delivers measurable outcomes such as enhanced customer relationships, operational efficiency, and increased revenue potential, though many companies are still in early phases of realization.
5. Generative AI: The New Enterprise Advantage
Generative AI has evolved from experimental technology into a critical enterprise capability. Unlike traditional AI that analyzes data, generative AI can create content, simulate scenarios, generate code, draft reports, design workflows, and support strategic planning. Enterprises partnering with an AI Development Company for Business embed these models directly into daily operational workflows across customer service, finance, marketing, procurement, and knowledge management.
Enterprises are deploying task-specific AI agents that handle repetitive, cognitive workloads, automate multi-step processes, support decision-making, and continuously optimize through real-time feedback. By engaging AI software developers, companies move beyond pilots toward integrated, enterprise-scale systems. These enterprise deployments are strengthened through structured AI software development services that ensure scalability, governance alignment, and long-term system resilience.
The result is a structural shift from standalone AI tools to digital workforce augmentation. Generative AI, implemented through AI-Powered Development Company expertise, becomes a strategic foundation that enhances productivity, accelerates execution, and transforms organizational performance into a scalable competitive advantage.
6. The Strategic Benefits of Partnering with an AI Development Company

Implementing AI at scale is not simply a technical exercise; it is an architectural transformation that touches data, workflows, governance, and long-term business strategy. Organizations that attempt to build advanced AI capabilities in isolation often encounter scalability bottlenecks, integration gaps, and unclear ROI.
Enterprises evaluating the best AI development companies prioritize scalability, governance maturity, architectural depth, and measurable ROI over experimental capability alone. Partnering with an experienced AI Development Company provides structured expertise that strengthens execution quality, accelerates deployment maturity, and ensures measurable business outcomes.
Deep Technical Architecture Capabilities
Enterprise-grade AI requires more than model deployment. It demands expertise in machine learning pipelines, large language models, agent-based orchestration, distributed systems, and secure infrastructure. Specialized AI teams understand how to design systems that are scalable, modular, and production-ready, not just experimental prototypes.
Data & Workflow Alignment
AI performance is fundamentally dependent on data quality and system integration. Strategic partners establish governed data pipelines, eliminate silos, and ensure models are embedded directly into operational workflows. This alignment transforms AI from a disconnected layer into a core operational engine.
Outcome-Driven Execution
Successful AI initiatives begin with business objectives, not algorithms. Experienced AI partners define clear performance metrics, build measurement frameworks, and align deployments with revenue growth, cost efficiency, and customer experience improvements. This approach ensures that AI investments translate into tangible enterprise value.
Governance, Risk, and Responsible AI
Enterprise deployment requires structured oversight. From model bias mitigation to compliance frameworks, data privacy safeguards, and auditability, governance must be engineered from the start. Strong AI partnerships integrate risk management and ethical design principles into system architecture, thus reducing exposure and ensuring long-term sustainability.
7. Workforce Transformation: The New Enterprise Skill Imperative
Artificial Intelligence is not merely optimizing workflows; it is redefining how work itself is structured, executed, and measured. As automation expands across cognitive and operational domains, roles are not simply being replaced; they are being redesigned. Organizations leveraging AI Development Services ensure that AI adoption is aligned with workforce transformation and skill development.
Across industries, millions of positions are evolving as AI systems absorb repetitive analysis, data processing, and routine decision-making tasks. Forward-looking enterprises engage ai software developers to equip employees with AI fluency, embedding it into performance metrics, leadership expectations, and career development pathways.
The emerging model is human enhanced by machine intelligence. Competitive advantage will depend not only on AI-Powered Development Company expertise but also on building intelligent teams capable of leveraging AI systems at scale.
Start Your Enterprise AI Transformation with Confidence
8. Building the AI-First Enterprise: The Future of AI Development Services
Over the next decade, AI will move beyond workflow support and become the structural backbone of enterprise design. Intelligence will be embedded across finance, operations, marketing, supply chains, product development, and risk management, not as a feature, but as core infrastructure built with AI Development Services.
In AI-first organizations:
Decision cycles compress dramatically
Real-time data modeling enables dynamic forecasting, adaptive pricing, automated risk scoring, and continuous operational recalibration.
Customer engagement becomes predictive rather than reactive
Behavioral modeling anticipates needs, optimizes touchpoints, and adjusts experiences across channels in milliseconds.
Innovation becomes systematic
AI-assisted research, simulation environments, and rapid prototyping reduce development timelines and increase experimentation velocity.
Competitive strength compounds over time
Self-improving systems continuously refine algorithms using proprietary data, creating intelligence loops that are difficult for competitors to replicate.

The Standard for Modern Enterprise Excellence
Artificial Intelligence has moved from optional experimentation to operational expectation. Its impact on business performance is seen in margin expansion, faster decision-making, improved capital allocation, and measurable revenue growth. Enterprises must leverage AI Development Services to strengthen data foundations, align AI initiatives with financial metrics, embed governance, and build workforce capability for AI collaboration.
Organizations that treat AI as core infrastructure and partner with a trusted AI Development Company will outperform peers in efficiency, innovation speed, and customer value creation. Supported by custom AI development, businesses can institutionalize AI today to shape tomorrow’s market dynamics. Antier empowers enterprises with scalable, secure AI and blockchain solutions, driving measurable ROI through expert AI-Powered Development Company services with the dedicated support of experienced professionals guiding every stage of innovation and implementation.
Frequently Asked Questions
01. What is the current impact of AI on businesses as of 2026?
By 2026, AI is redefining business operations through faster decision cycles, predictive supply chains, autonomous customer engagement, and data-driven product innovation, becoming integral to enterprise systems.
02. Why do many AI projects fail to deliver significant value?
Many AI projects fall short due to a lack of AI-ready data, as fragmented and siloed data pipelines hinder model accuracy and limit enterprise insights.
03. How can enterprises effectively integrate AI into their operations?
Enterprises can effectively integrate AI by embedding it into their operational core, leveraging comprehensive AI development services, and aligning technology with measurable business outcomes to enhance performance and competitiveness.


CME Group will run cryptocurrency futures and options on CME Globex around the clock starting May 29, 2026, after recording $3 trillion in notional volume across its crypto derivatives in 2025.
Why it matters:
- Traders can react to breaking news on weekends, eliminating the price gap risk that builds when crypto markets move while CME is closed.
- Institutions managing crypto exposure via CME derivatives gain continuous hedging access, reducing overnight risk accumulation.
- The move signals CME’s direct response to demand from TradFi firms scaling into digital assets.
The details:
- CME Group announced the 24/7 schedule on February 19, 2026, pending regulatory approval, per an official press release.
- Crypto derivatives average daily volume (ADV) hit 407,200 contracts year-to-date in 2026, up 46% year-over-year.
- Futures ADV reached 403,900 contracts, up 47% year-over-year, per CME Group data.
- Average daily open interest stands at 335,400 contracts, up 7% year-over-year.
- CME confirmed the launch date of May 29, 2026, via its official X account.
The big picture:
- CME’s 2025 crypto notional volume of $3 trillion confirms institutional demand for regulated derivatives now rivals spot market activity.
- The 24/7 schedule aligns CME with native crypto exchanges, which have always traded continuously, narrowing a structural gap between TradFi and DeFi.
- Continuous trading on a regulated venue could pull institutional volume away from offshore perpetual futures markets.
The post CME Launches 24/7 Crypto Futures Trading Starting May 29 appeared first on BeInCrypto.
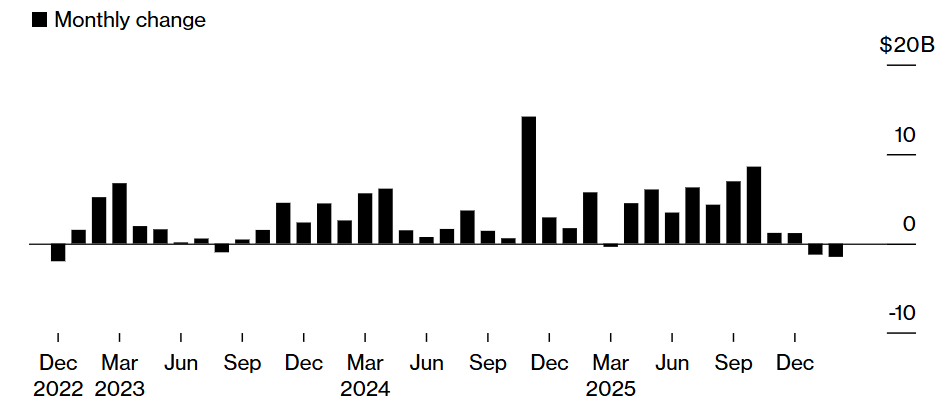
Tether’s USDT, the world’s largest US dollar-pegged stablecoin, is heading for its steepest monthly decline in years as large holders step up redemptions, according to blockchain data.
The circulating supply of USDt (USDT) fell by about $1.5 billion so far in February, following an $1.2 billion decrease in January, according to Artemis Analytics data reported by Bloomberg. This puts USDT on track for the biggest monthly drop in three years, weeks after the collapse of cryptocurrency exchange FTX in November 2022.
The USDT supply logged a $2 billion decrease in December 2022 after the collapse of FTX and its 150 subsidiaries sent shockwaves through the crypto industry.
The decline may signal a contraction in crypto market liquidity, as Tether’s USDT is the primary on-ramp for crypto investors. Its $183 billion market capitalization accounts for about 71% of the total stablecoin market, according to CoinMarketCap.

Cointelegraph reached out to Tether for comment on what is driving the February supply drop, but had not received a response by publication.
Related: BlackRock enters DeFi as institutional crypto push accelerates: Finance Redefined
Total stablecoin market cap flat in February
The pullback in USDT has not translated into a broader contraction across dollar-linked stablecoins.
The total market capitalization of stablecoins across all exchanges has risen 2.33% so far in February, from $300 billion to $307 billion, according to DeFiLlama data.

While the two leading stablecoins, USDT and Circle’s USDC (USDC), both decreased by 1.7% and 0.9%, respectively, the Trump-family-linked World Liberty Financial’s USD1 (USD1) stablecoin recorded a 50% increase in market capitalization over the past month and was valued at $5.1 billion as of Friday, according to DeFiLlama.
Related: Wells Fargo sees ‘YOLO’ trade driving $150B into Bitcoin and risk assets
Whales and smart money traders offload USDT, but fresh wallets stepping in
Whales, or large cryptocurrency investors, have been cutting their USDT holdings, but new participants are bringing fresh demand for the leading stablecoin.
Whale wallets sold $69.9 million USDT across 22 wallets over the past week, marking a 1.6-fold increase in the selling rate of this cohort, according to crypto intelligence platform Nansen.

The leading traders by returns, tracked as “smart money,” have also been net sellers of USDT. At the same time, new wallets created in the past 15 days bought roughly $591 million worth of USDT over the week, according to the platform.
The mixed flows highlight a market split between large holders redeeming or reallocating capital and new entrants stepping in to take the other side, even as overall stablecoin issuance remains broadly steady.
Magazine: Crypto wanted to overthrow banks, now it’s becoming them in stablecoin fight
Crypto World
As Ethereum staking surges, SolStaking expands the opportunity for scalable crypto returns

Disclosure: This article does not represent investment advice. The content and materials featured on this page are for educational purposes only.
With over half of all ETH now staked, platforms like SolStaking are positioning themselves to serve investors shifting from short-term trading toward structured yield strategies.
Summary
- More than 50% of Ethereum’s circulating supply is locked in staking, signaling a market shift toward long-term participation and reduced liquid supply.
- SolStaking offers fixed-term automated staking plans executed via smart contracts, targeting predictable returns and hands-off participation.
- Its infrastructure emphasizes institutional safeguards, including audits by PwC and custody insurance from Lloyd’s of London, alongside asset segregation and encryption.

Ethereum has quietly crossed a major threshold.
More than half of its total supply is now locked in staking. Even as ETH trades below recent highs, participation continues to increase. Over 50% of the network’s circulating supply is committed to validation rather than short-term trading.
That shift matters.
When supply tightens and long-term participation rises, market dynamics begin to change. The focus moves from daily volatility to sustained yield generation.
For many investors, the conversation is no longer just about price appreciation. It’s about capital efficiency.
That is where SolStaking positions itself.
About SolStaking
SolStaking is a multi-asset cryptocurrency staking platform operating under its U.S.-registered entity, Sol Investments, LLC.
The platform operates through automated smart contracts. Once a plan is activated, distributions are executed according to predefined contract terms without manual intervention.
Participation plans currently include:
Trial Plan — $100 — 2 Days — ~$108
TRX Income Plan — $3,000 — 15 Days — ~$3,585
XRP Flagship Plan — $30,000 — 30 Days — ~$44,400
BTC Flagship Plan — $300,000 — 50 Days — ~$630,000
Complete plan details are available on the official website.
Institutional-grade infrastructure
SolStaking operates with a framework designed for operational clarity and asset oversight:
- U.S.-registered entity: Sol Investments, LLC
- Separation of user assets and corporate operating funds
- Independent audits conducted by PwC
- Custody insurance provided by Lloyd’s of London
- Enterprise-grade encryption and continuous system monitoring
This infrastructure supports consistent smart contract execution and platform integrity.
Real-world asset integration
Beyond digital staking, SolStaking integrates real-world assets into its broader ecosystem, including:
- AI data centers
- Sovereign and investment-grade bonds
- Physical gold and commodities
- Industrial metals
- Logistics infrastructure
- Agriculture and clean energy projects
These components contribute to the platform’s operational ecosystem while smart contracts manage on-chain settlement processes.
Getting started
- Register on the official SolStaking platform.
- Deposit supported assets (XRP, BTC, ETH, SOL, USDT, USDC, LTC, DOGE).
- Select a smart contract plan.
- Activate participation.
Users can monitor balances and settlement progress in real time.
Conclusion
As digital asset markets mature, participation models are evolving.
For many investors, capital deployment is no longer limited to directional trading. Automated smart contract participation provides an alternative approach focused on predefined timelines and programmed execution.
SolStaking delivers fixed-term staking participation within a framework designed for transparency, automation, and operational structure.
To learn more about SolStaking, visit the official website. Email: [email protected]
Disclosure: This content is provided by a third party. Neither crypto.news nor the author of this article endorses any product mentioned on this page. Users should conduct their own research before taking any action related to the company.


For years, crypto markets have operated with a clear gap. DeFi introduced open and transparent trading, while centralized exchanges continued to handle most price discovery. The difference came down to infrastructure. Most blockchains focused on running applications, not high-speed trading. Order books, tight spreads, and real-time hedging demand fast execution and low costs, and that level of performance is now becoming non-negotiable.
At these volumes, the pressure on infrastructure becomes obvious. According to DeFiLlama, decentralized perpetual futures markets are now clearing roughly $20–30 billion in daily volume, with monthly volumes regularly approaching the $1 trillion range depending on market conditions.
As this trend accelerates, MegaETH, a high-performance Ethereum Layer 2 built around ultra-low latency and high throughput, has gone live. Among the first flagship applications to launch on this Layer 2 network on February 17 was World Markets – a decentralized trading platform that unifies spot trading, perpetual futures, and lending under a single account.
As one of the first full trading platforms on the network, it effectively serves as an early test of whether performance-focused chains can support institutional-style market structure on-chain.
When Markets Outgrow the Infrastructure
For most of DeFi’s first wave, the focus was composability. Protocols stacked on top of each other, liquidity moved across AMMs, and lending markets thrived.
However, serious trading is different from yield farming.
Order books require constant updates. Market makers need predictable fees. High-frequency traders need execution that doesn’t lag behind centralized venues by seconds. Even small inefficiencies compound when leverage is involved.
That’s where many general-purpose chains struggled.
Gas fees on networks like Base or Arbitrum can fluctuate dramatically during congestion. Latency, even if acceptable for swaps or NFT mints, becomes a real issue when managing leveraged derivatives.
Kevin Coons, founder of World Markets, speaks candidly:
“There has yet to be a successful DEX on a general purpose chain. Two simple reasons are gas and speed. Gas costs can be close to 100x higher. High gas costs prevent market makers from being able to quote tight spreads meaning on-chain exchanges can’t be competitive with Binance, until now.”
Whether or not one agrees with the 100x comparison, the broader point resonates: tight spreads and fast execution aren’t optional features in capital markets. They’re the foundation.
Coons adds:
“Speed matters to an extent. Being within range of Binance is important for getting price discovery on-chain. MegaETH is the first chain where price discovery is possible.”
That statement speaks to a larger trend. If decentralized markets want to compete, they can’t just be transparent but efficient as well.
MegaETH and the Rise of Performance Chains
MegaETH has positioned itself differently from earlier Ethereum scaling efforts.
Instead of focusing only on cheaper gas, it emphasizes performance metrics closer to centralized systems, targeting very high throughput and low confirmation times. The project has publicly referenced stress tests processing billions of transactions ahead of mainnet launch.
Official docs and ecosystem materials emphasize execution speed specifically for latency-sensitive use cases like order books and gaming.
This approach aligns with a pattern seen elsewhere. Hyperliquid, another trading-focused environment, has become one of the most active perpetual futures venues onchain, frequently clearing billions in daily volume.
The takeaway is that markets seem to gravitate toward infrastructure built specifically for trading workloads. General-purpose chains aren’t disappearing but capital markets are starting to migrate toward environments designed for financial throughput.
What World Markets Is Trying to Change
World Markets enters this environment with a structural design choice: unified margin.
Instead of forcing traders to separate capital across spot markets, perpetual futures, and lending platforms, the system keeps everything under a single portfolio.
On paper, that sounds straightforward. In practice, it opens the door to strategies that were previously difficult on-chain, including basis trades that exploit the structural gap between borrow rates and perpetual funding rates.
Traditional DeFi often leaves capital fragmented and heavily overcollateralized, forcing traders to split borrowing, hedging, and execution across separate platforms, with billions in capital sitting idle or locked inefficiently because the infrastructure never unified those functions.
World Markets attempts to consolidate all of that. The platform’s ATLAS risk engine enables portfolio-level margining and undercollateralized lending – mechanics more common in prime brokerage models than in early DeFi protocols.
In traditional finance, hedge funds operate under consolidated accounts where risk is assessed at the portfolio level. DeFi historically hasn’t worked that way.
World Markets is effectively attempting to replicate prime brokerage-style capital management on-chain, giving traders access to structures that have traditionally been reserved for institutional desks.
Rethinking Liquidations and Risk
Liquidation mechanics are one of the most controversial parts of leveraged trading.
Most exchanges, both centralized or decentralized, rely on automated systems that close positions once thresholds are breached. While necessary for solvency, those systems can override trader discretion.
World Markets frames its model differently. In Coons’ view:
“Sophisticated traders have highly leveraged portfolios. They reduce risk by hedging… Exchanges currently socialize these losses to their users by closing out their positions. On World Markets you have ultimate control over your risk. We don’t decide your risk for you.”
The idea is to give traders more direct control over counterparty exposure rather than relying entirely on exchange-imposed forced liquidations.
Whether that model scales will depend on adoption and liquidity depth. But structurally, it signals a move away from rigid, siloed liquidation logic toward portfolio-based risk management.
Where On-Chain Markets Are Heading
Zooming out, this moment is bigger than any single platform. Decentralized markets are beginning to outgrow the general-purpose infrastructure they were originally built on. DeFi’s first phase focused on access and composability. The next phase is about capital efficiency, execution quality, and market structure that can handle real trading volume.
According to Messari’s 2025 derivatives research, perpetual futures have become one of the largest segments of DeFi by volume, accounting for a significant share of total on-chain activity.
At that scale, performance stops being optional. Competing with centralized venues requires tighter spreads, faster execution, and deeper liquidity, all of which depend on infrastructure designed specifically for financial workloads.
MegaETH is aligning itself with that change, and World Markets’ launch represents one of the earliest attempts to run a fully integrated trading stack, including a central limit order book, on infrastructure designed specifically for high-speed financial execution. It signals a maturing phase for DeFi, where the chain itself becomes a strategic choice aligned with the demands of capital markets.
This Friday, we examine Ethereum, Ripple, Cardano, Binance Coin, and Hyperliquid in greater detail.
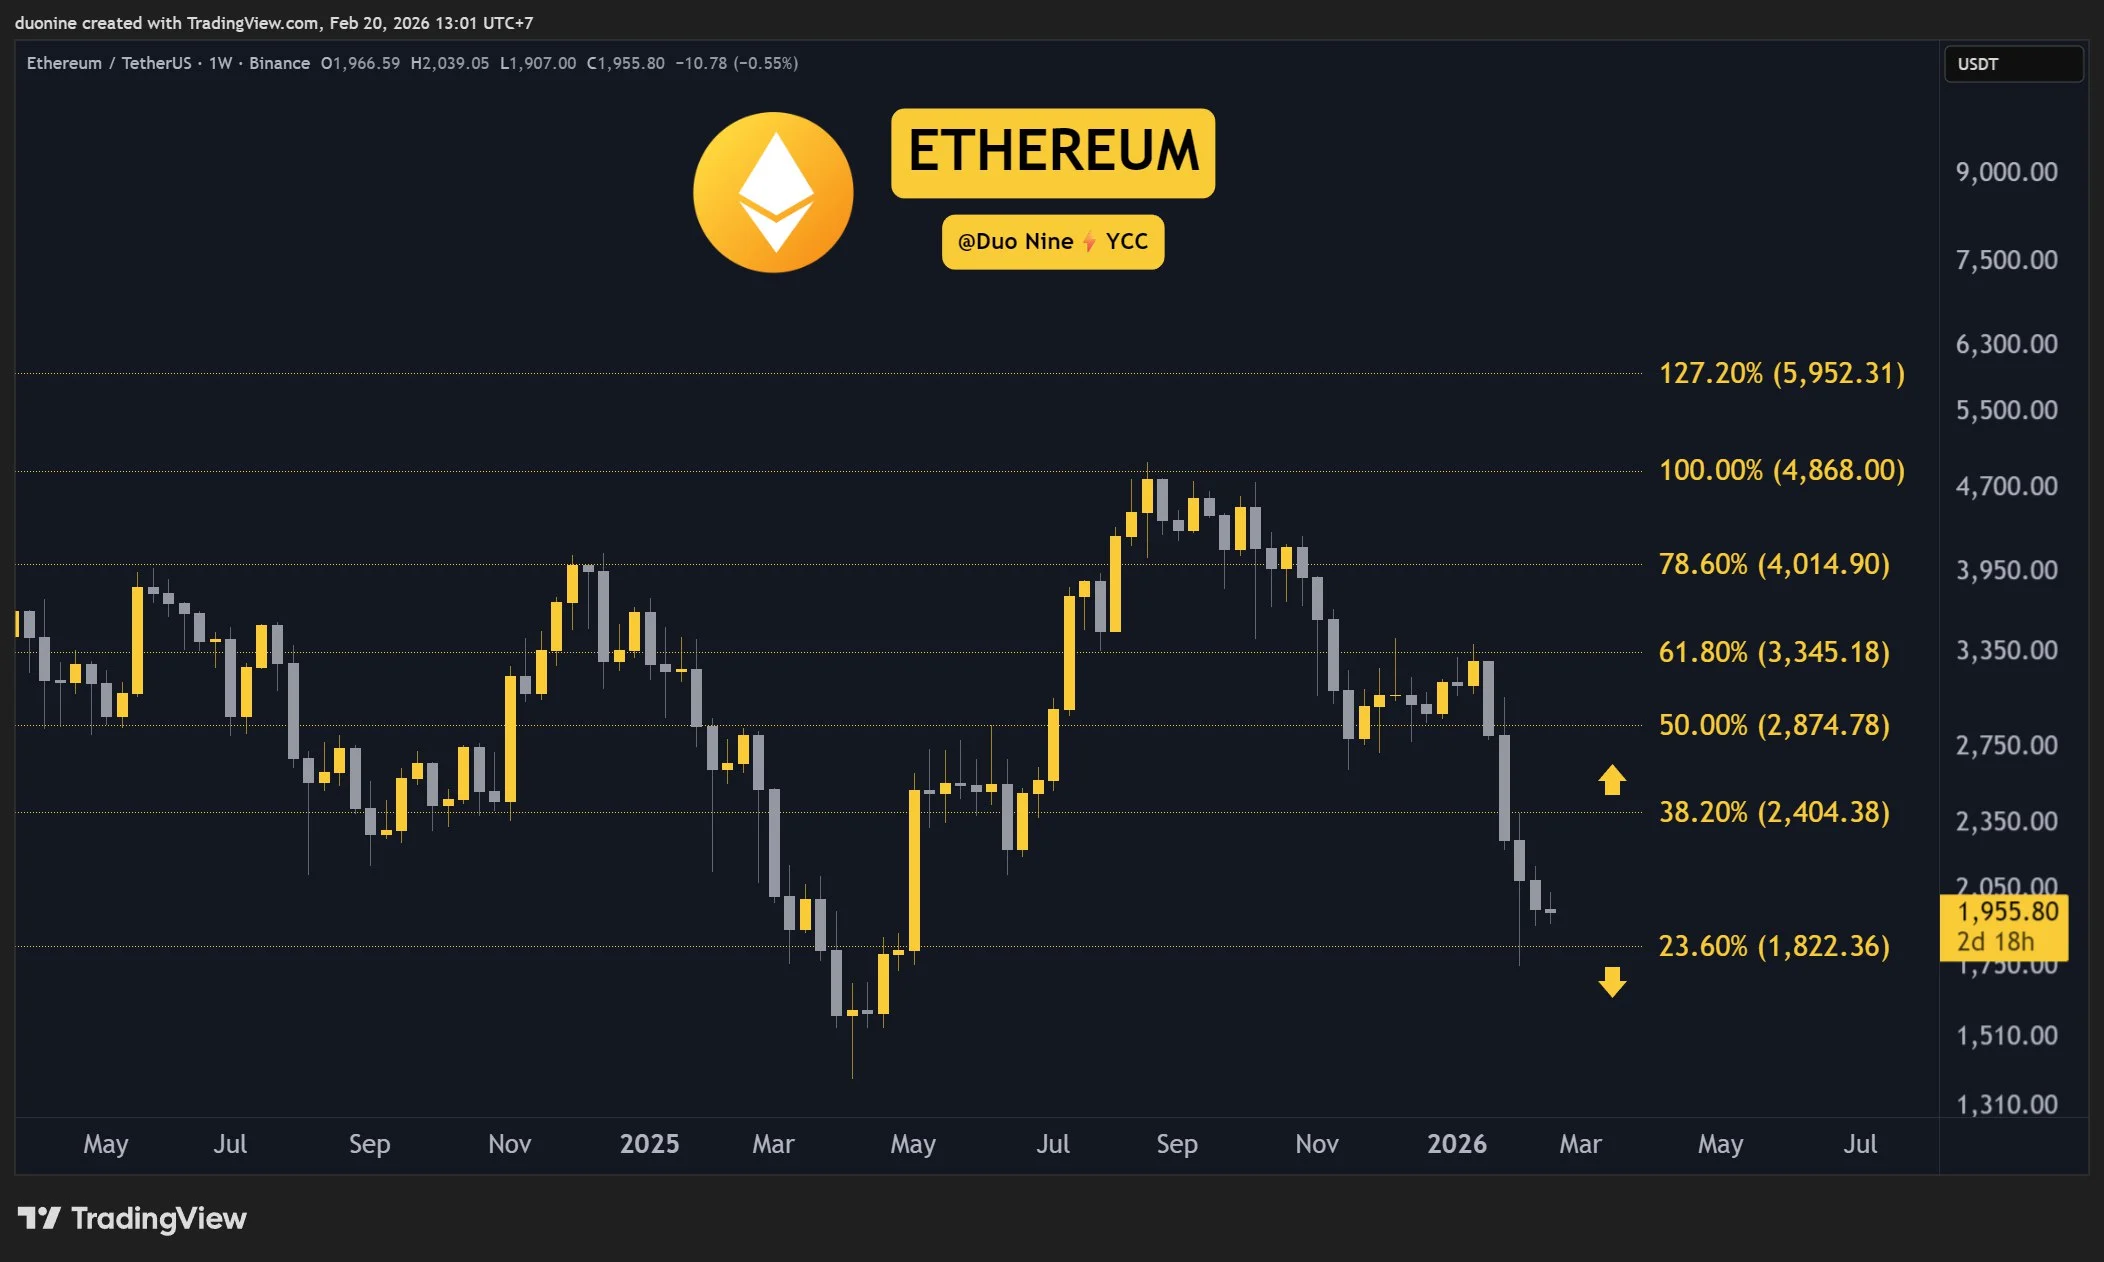
Ethereum (ETH)
Ethereum had a mostly flat week, closing up only 1%. This means buyers managed to defend the key support at $1,800. The sell momentum is also fading, which could hint at a possible reversal soon.
The current resistance levels are found at $2,000 and $2,400. Given the price closed in the red over the last four weeks, a relief rally appears likely and could test these key levels.
Looking ahead, Ethereum may be completing its second leg down in an ABC correction. If so, bulls may soon make their presence known on the order book. That starts once the $2,000 level is reclaimed.

Ripple (XRP)
XRP closes the week up 5%. However, this was not sufficient to turn the chart bullish. That’s because the attempt to break the resistance at $1.6 was rejected sharply by sellers.
Such a rejection is a bearish signal that the downtrend may still continue for some time. If so, a retest of support at $1.4 and even $1 is likely in the future.
Looking ahead, the sell momentum continues to dominate, which can lead to lower price levels. Watch closely how the price reacts at $1.4 for a good indication of where XRP will go next.

Cardano (ADA)
ADA is hanging close to the support at $0.28, but appears to struggle and may lose this level again. If so, expect lower prices in the future, with key support at $0.24. This comes after a 6% gain to close the week.
Cardano’s price action mirrors somewhat the one from XRP. The momentum remains bearish, but sellers and buyers are still fighting for dominance at the key support. Either way, a decisive move can be expected soon.
Looking ahead, ADA had a very disappointing year so far and this will not change until it reclaims a price above 50 cents. That’s the moment when bulls could hope for sustained gains.

Binance Coin (BNB)
Binance Coin has been hugging the $580 support level over the past week and closed with a 3% gain. Sellers also appear to be taking a break, but that does not mean the selloff is over.
The current resistance is at $690 and has not tested to date. This shows buyers are still hesitant to return here, but the signs are promising since the selling volume has decreased substantially lately.
Looking ahead, if BNB can hold here, then buyers may gather enough courage to push higher and challenge the resistance at $690. If, however, sellers return in force, the price could fall to $500 next.

Hype (HYPE)
HYPE closed the week in the red with a 5% loss. This comes after a sharp rejection at the $36 and $30 resistance levels. Buyers are on the defensive, which could see the price fall lower up to the key support at $26.
If $26 is lost later as well, that will be an extremely bearish signal, which could see HYPE make new lows this year. On the other hand, if that level holds, then it could be interpreted as a higher lo,w which will encourage buyers to return once more.
Looking ahead, this cryptocurrency is found in a pullback that may last a while. Best to be patient here and wait for bulls and bears to show their intention around $26 first.

SECRET PARTNERSHIP BONUS for CryptoPotato readers: Use this link to register and unlock $1,500 in exclusive BingX Exchange rewards (limited time offer).
Disclaimer: Information found on CryptoPotato is those of writers quoted. It does not represent the opinions of CryptoPotato on whether to buy, sell, or hold any investments. You are advised to conduct your own research before making any investment decisions. Use provided information at your own risk. See Disclaimer for more information.

royal family should face tough questions
Costa Coffee confirms expansion in Wales with new outlets
Opendoor (OPEN) Stock: Q4 Earnings Beat Drives 16% After-Hours Rally


-

 Video4 days ago
Bitcoin: We’re Entering The Most Dangerous Phase
-

 Tech5 days ago
Luxman Enters Its Second Century with the D-100 SACD Player and L-100 Integrated Amplifier
-

 Crypto World3 days ago
Can XRP Price Successfully Register a 33% Breakout Past $2?
-

 Sports3 days ago
GB's semi-final hopes hang by thread after loss to Switzerland
-

 Video11 hours ago
XRP News: XRP Just Entered a New Phase (Almost Nobody Noticed)
-
 Tech3 days ago
The Music Industry Enters Its Less-Is-More Era
-

 Business3 days ago
Infosys Limited (INFY) Discusses Tech Transitions and the Unique Aspects of the AI Era Transcript
-

 Video3 days ago
Financial Statement Analysis | Complete Chapter Revision in 10 Minutes | Class 12 Board exam 2026
-

 Entertainment2 days ago
Kunal Nayyar’s Secret Acts Of Kindness Sparks Online Discussion
-

 Tech2 days ago
Retro Rover: LT6502 Laptop Packs 8-Bit Power On The Go
-
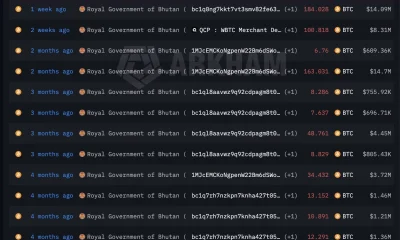
 Crypto World6 days ago
Bhutan’s Bitcoin sales enter third straight week with $6.7M BTC offload
-
 Sports1 day ago
Clearing the boundary, crossing into history: J&K end 67-year wait, enter maiden Ranji Trophy final | Cricket News
-

 Entertainment2 days ago
Dolores Catania Blasts Rob Rausch For Turning On ‘Housewives’ On ‘Traitors’
-

 Business2 days ago
Tesla avoids California suspension after ending ‘autopilot’ marketing
-
 NewsBeat5 days ago
The strange Cambridgeshire cemetery that forbade church rectors from entering
-

 Crypto World2 days ago
WLFI Crypto Surges Toward $0.12 as Whale Buys $2.75M Before Trump-Linked Forum
-
 NewsBeat5 days ago
Man dies after entering floodwater during police pursuit
-

 Crypto World16 hours ago
83% of Altcoins Enter Bear Trend as Liquidity Crunch Tightens Grip on Crypto Market
-

 NewsBeat6 days ago
UK construction company enters administration, records show
-
 Crypto World7 days ago
BlackRock Enters DeFi Via UniSwap, Bitcoin Stages Modest Recovery