
Crypto World
Ethereum Price Slides as Peter Brandt Warns of Further f
Join Our Telegram channel to stay up to date on breaking news coverage
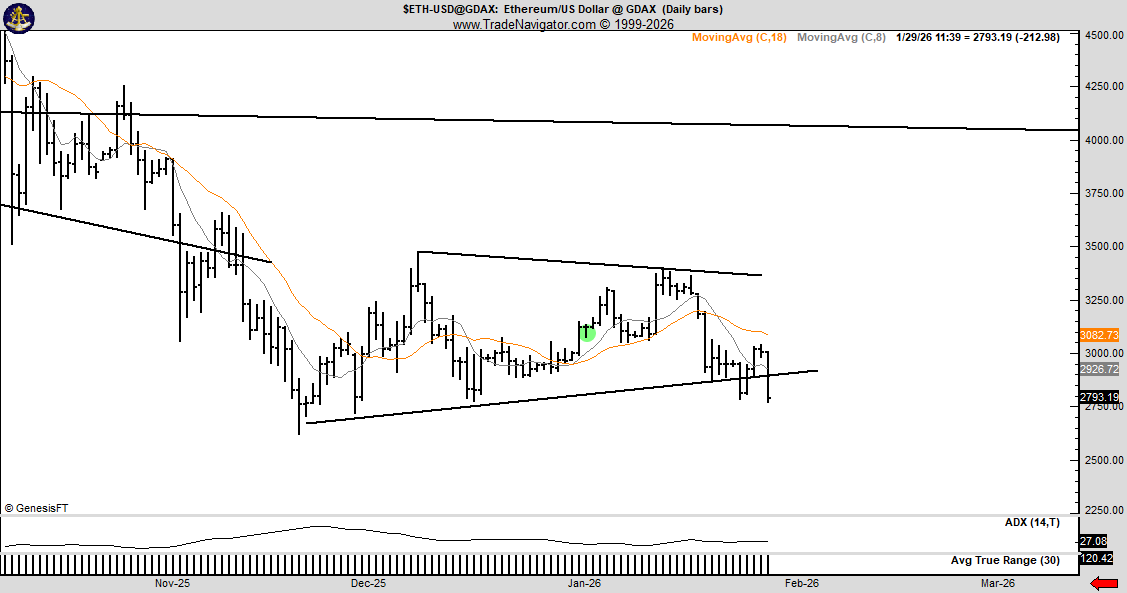
The Ethereum price has dropped 4% in the past 24 hours, slipping to around $2,744, as selling pressure increases, and Veteran trader Peter Brandt has warned that Ethereum’s decline may not be finished yet.
Brandt points to a breakdown from a symmetrical triangle on the 24-hour Ethereum chart, a pattern he describes as a well-known bearish signal that often leads to further losses when confirmed. According to him, the breakdown indicates that sellers remain in control, especially in an environment of thin market liquidity and continued capital outflows.
These conditions make it harder for Ethereum to recover, as even small sell orders can push prices lower. Brandt adds that the lack of strong buying interest means rallies are likely to be short-lived unless market conditions improve. He also places Ethereum’s weakness within a broader market context.

Brandt highlights a right-angled broadening pattern on the total cryptocurrency market capitalization chart. Following the recent market crash, the total crypto market value has already dropped to around $2.82 trillion. He warns that if this pattern continues, total market capitalization could fall toward $2.41 trillion.
ETF Outflows and Weak Sentiment Deepen Bearish Pressure
This would represent an additional 15–20% decline from current levels and could keep major cryptocurrencies such as Bitcoin, Ethereum, and XRP under continued pressure. Ethereum’s poor technical outlook matches weakening sentiment across the wider crypto market. The second-largest cryptocurrency has lost more than 46% of its value over the past few months, reflecting both global macro uncertainty and challenges specific to the crypto sector.
One of the biggest factors hurting sentiment has been steady outflows from spot Ethereum exchange-traded funds, which suggest that institutional investors are becoming more cautious. On Thursday alone, spot ETH ETFs recorded nearly $156 million in net outflows.
Fidelity’s FETH saw the largest withdrawals at $59.2 million, followed by BlackRock’s ETHA with $54.9 million. Grayscale’s ETHE and ETH products also experienced significant outflows of $13.1 million and $26.5 million, respectively. These continued redemptions reinforce concerns that institutional demand for Ethereum remains weak in the near term.
Ethereum Price Breaks Out Below Key Support
Ethereum (ETH/USD) on the 4-hour timeframe is showing a clear shift in market structure, with bearish momentum now dominating after a decisive breakdown below key support. Price action highlights a failed recovery attempt that transitioned into a strong bearish continuation.
Initially, ETH formed a rounded bottom pattern, signaling a gradual accumulation phase. This structure allowed price to rally toward the upper resistance zone around the $3,300–$3,350 region, which had previously acted as a strong supply area. However, repeated rejections from this resistance zone indicated weak bullish follow-through, suggesting that sellers remained firmly in control.
Following the rejection, ETH broke below the major support level near $2,950–$3,000, which had acted as a demand zone during prior consolidation. This breakdown is technically significant, as former support has now flipped into resistance. The move was impulsive, confirming a bearish breakout rather than a false move or liquidity sweep.
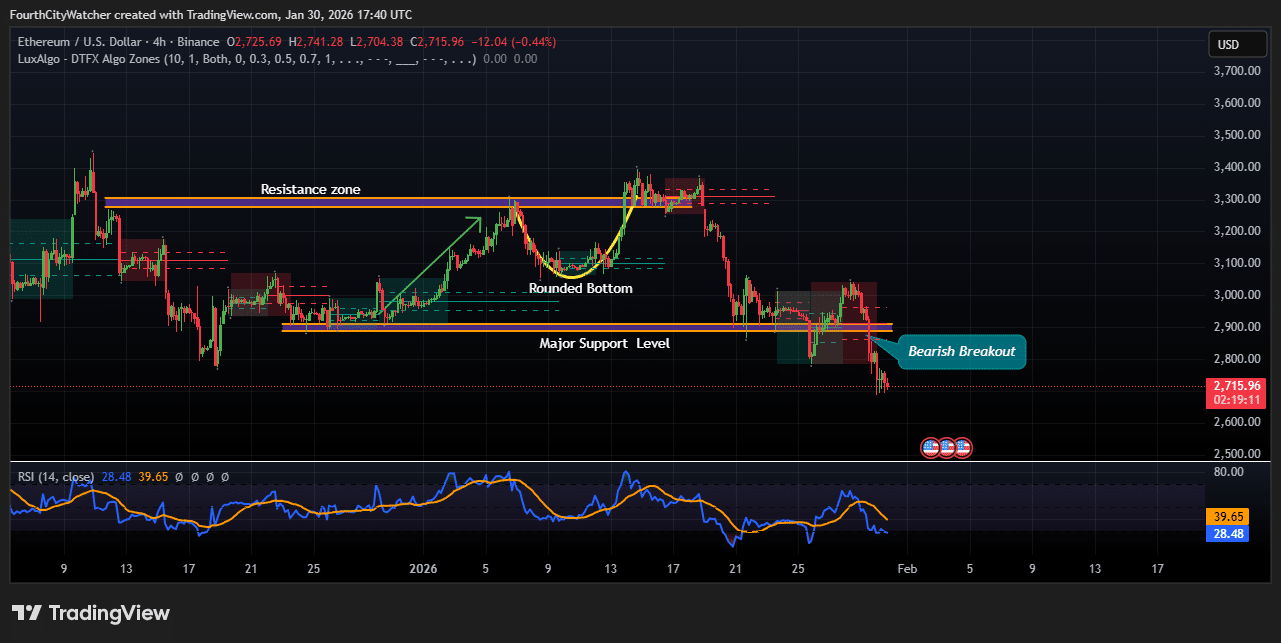
ETHUSD Chart Analysis. Source: Tradingview
Momentum indicators reinforce the bearish bias. The RSI (14) has dropped toward the lower range, hovering near oversold territory but without showing bullish divergence. This suggests that selling pressure remains active, and any short-term bounce could be corrective rather than trend-reversing. The RSI failing to reclaim the 50 midline further confirms bearish control.
Structurally, ETH is now forming lower highs and lower lows, a classic downtrend signal on the 4-hour chart. The bearish candle expansion following the support break also points to strong selling participation rather than weak retail-driven moves.
Looking ahead, the next key area to monitor lies around the $2,650–$2,700 region, which could act as a temporary demand zone or pause area. If this level fails to hold, downside risk may extend toward deeper liquidity zones below. On the upside, any recovery attempts are likely to face resistance near the broken $2,950–$3,000 support band.
Related Articles:
Best Wallet – Diversify Your Crypto Portfolio

- Easy to Use, Feature-Driven Crypto Wallet
- Get Early Access to Upcoming Token ICOs
- Multi-Chain, Multi-Wallet, Non-Custodial
- Now On App Store, Google Play
- Stake To Earn Native Token $BEST
- 250,000+ Monthly Active Users
Join Our Telegram channel to stay up to date on breaking news coverage

Pi has morphed from a hyped IOU into a battered $0.18 L1; 2026’s open mainnet will decide whether it earns real usage or just fuels another round of unlocked sell pressure.
Summary
- Pi now trades near $0.18 with a roughly $1.7–1.8 billion market cap after an 80–90% rally toward $0.30 faded, as unlocks and miner distribution keep it pinned near cycle lows.
- The 2026 “open mainnet” pivot — stricter KYC, biometric checks and migrating 2.5 million users into a compliant, transferable environment — is the only real catalyst beyond more supply hitting order books.
- External forecasts mostly cluster around range‑bound outcomes, with 2026 levels near $0.20 and best‑case 2030 targets in the low single digits if, and only if, Pi proves real usage, listings and on‑chain activity.
Pi Network (PI) has moved from a hyped IOU narrative to a battered, liquid L1 asset trading around the mid‑$0.17–$0.18 range, with its next leg entirely dependent on whether the 2026 open mainnet phase actually delivers real usage instead of just unlocked sell pressure. Treat it like any other high‑beta alt: structurally cheap on optics, structurally dangerous on tokenomics and execution risk.
Where Pi Trades Now
Pi sits near $0.18 with a market cap around $1.7–1.8 billion, down sharply from its speculative IOU blow‑off in 2022 when prices briefly printed triple‑digit wicks on thin order books. Recent price action tells you everything: the token rallied roughly 80–90% into late February–mid March 2026 toward $0.30, then faded back toward $0.20 as momentum stalled and RSI divergences flashed. Unlocks are biting – the token has logged several sessions near its all‑time low area as supply from long‑time “miners” meets underwhelming demand on centralized venues. Liquidity is decent but not deep enough to absorb aggressive distribution from a 10‑figure fully diluted supply without persistent slippage.
What Actually Changes In 2026
The core fundamental catalyst is the move toward an “open mainnet” with real transactions, dApps and stricter KYC/security, after years of closed‑ecosystem promises. The team is rolling out enhanced verification (KYC, palm‑print, AI checks) and has cleared roughly 2.5 million users for migration, crucial to get coins off the grey zone and into a compliant, transferable state. A broader 2026 roadmap ties this to supporting real‑world finance integrations and payments, but so far the market has treated each technical milestone (like the Pi Launchpad testnet) as a sell‑the‑news event rather than a re‑rating trigger.
Price Scenarios: 2026–2030
External models cluster Pi’s fair‑value band for the next few years somewhere between “modest grind” and “permanent underperformance.” Gate.io’s internal work sees an average near $0.20 for 2026, with a rough range between about $0.16 and $0.27 – effectively where it is already trading. Other forecasters project that, if the ecosystem scales and listings proliferate, Pi could grind into the low single digits by 2030, with some estimates around $2.50–$3.50 under constructive conditions. Those paths assume three things that are not yet proven: successful open mainnet, sustained user activity beyond mining, and a crypto macro environment that rewards L1 risk instead of choking it.
Verdict: Trade The Range, Don’t Worship The Narrative
For now, Pi looks like a liquid, range‑bound beta play rather than a structural compounder. Bulls get a clear technical invalidation: hold above the mid‑$0.17 pivot and reclaim the $0.23–$0.25 resistance band, and the market can start repricing toward the psychological $0.30–$0.40 area on any mainnet or listing surprise. Bears lean on the opposite logic: continued unlocks plus weak on‑chain usage send Pi into a slow bleed, with each rally sold by early miners finally getting exit liquidity. In this tape, smart money treats Pi as an event‑driven trade around roadmap milestones and macro risk cycles, not as a religion – position small, respect liquidity, and assume volatility is the rule, not the exception.
Crypto World
Special DeepSnitch AI Bonus Code: Limited Time Left To Reserve 300% Extra Tokens Ahead of Launch, Bears Lose Grip On ZEC and DOGE
Bitcoin just hit a six-week high, which somewhat restored the sentiment in the market. Yet, exchange inflows spiked to 6.1K BTC in a single hour. This could indicate that the rally is real, but selling pressure may be reaching a boiling point.
As fears of an extra wave of volatility become real, the special DeepSnitch AI bonus code presents the easiest way for traders to boost their chances of massive returns.
With launch slated for March 31, DeepSnitch AI’s crypto presale bonus offer provides as many as 300% extra tokens for large allocations. Since these codes expire at launch, the level of FOMO in the community is getting borderline ridiculous as traders keep adding to their allocations.

Is BTC selling pressure building?
According to Julio Moreno of CryptoQuant, hourly Bitcoin inflows into centralized exchanges exploded to 6.1K BTC on March 16. This is the highest reading since February 20, with large inflows accounting to 63% of the total figure.
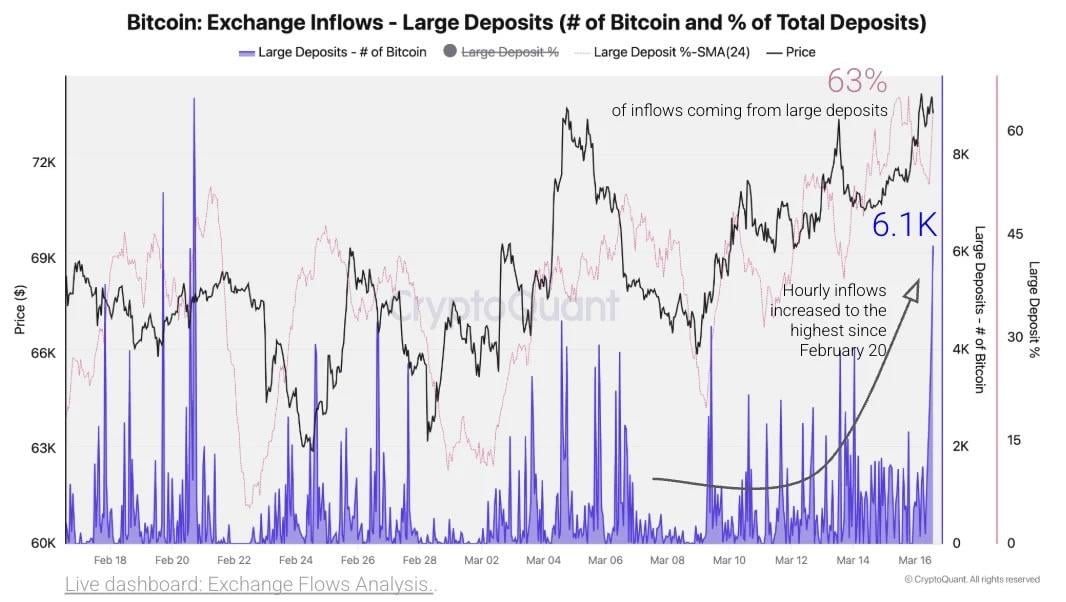
The driving force behind the inflows was Bitcoin’s 12% gradual rally in March.
Traders generally send BTC to exchanges before they sell or convert it into stablecoins, with Moreno noting that such spikes often preceded an uptick in selling pressure.
Thus, traders fear that smart money may be using the rally as an opportunity to profit. This uncertainty only contributed to traders doubling down on the special DeepSnitch AI bonus code, intending to scoop up extra tokens ahead of the March 31 launch.
Best March opportunities in crypto
1. DeepSnitch AI: How much are early investor bonus tokens worth?
Blink, and you’ll miss it. DeepSnitch AI is a project rapidly closing in on its March 31 launch. While this is enough to push FOMO to the max, the special DeepSnitch AI bonus code basically led to the project getting in on many trending lists.
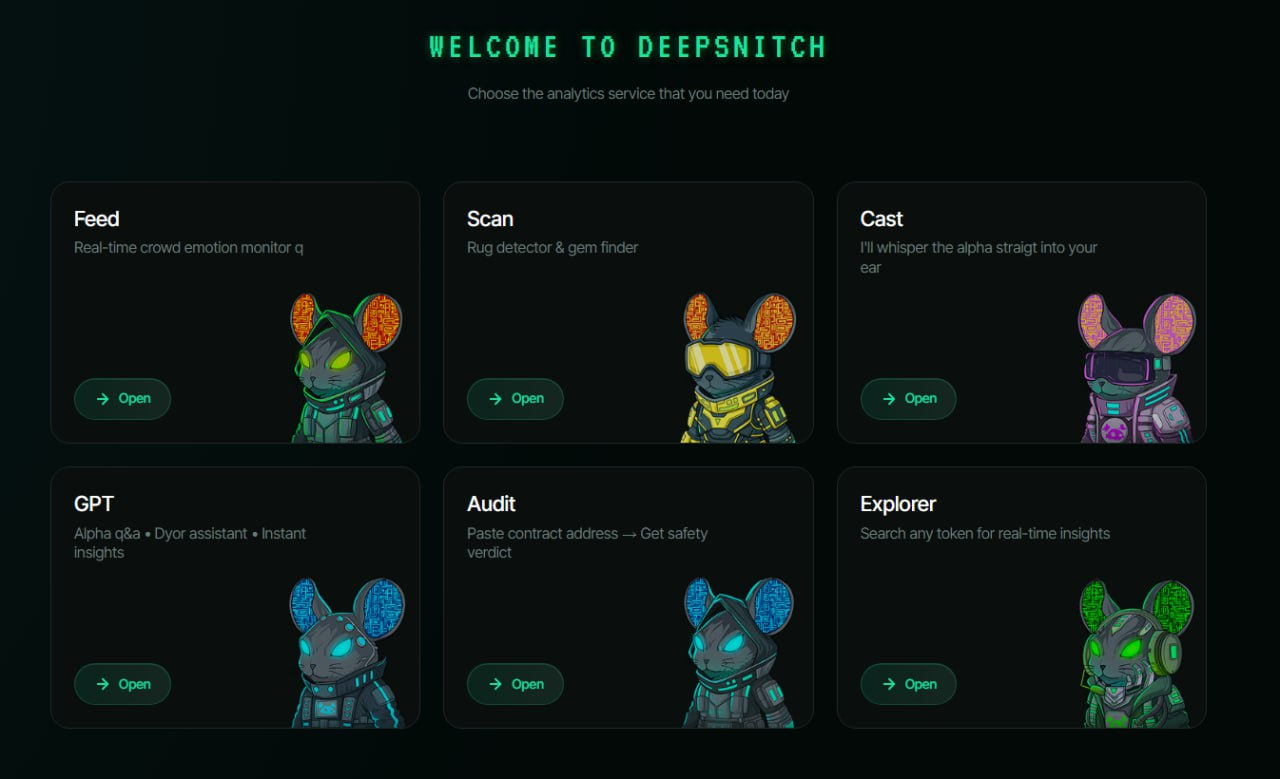
So far, DeepSnitch AI has raised $2.2M at $0.04487. The main offering is an analytics platform consisting of five autonomous AI agents that can do everything from discovering rugs and honeypots, DYOR, token analysis, to real-time sentiment and FUD tracking.
The latest bonuses only enhanced these fundamentals. You can apply any presale discount code at checkout if you meet the right allocation amount. Fortunately, there are multiple tiers, meaning that there’s a special DeepSnitch AI bonus code for everyone.
The lowest one, DSNTVIP30, gets you 30% extra tokens on $2K and above. DSNTVIP50 bumps that to 50% on $5K or more, and DSNTVIP150 adds 150% to your bag for $10K and up. And the biggest presale discount code, DSNTVIP300, unlocks 300% extra on allocations of $30K and above, which works out to roughly $90K.
DeepSnitch AI is running hot. With 41.7 million DSNT already staked, community projections of 100x to 300x make it one of the largest opportunities in recent times.
All codes expire on March 31.
2. Dogecoin: DOGE breaking out?
According to CoinMarketCap, DOGE traded at $0.099 on March 18.
As the community went crazy over the special DeepSnitch AI bonus code, bears surrendered control over DOGE’s price action.
In the short-term, Dogecoin must close above $0.10 (50-day SMA) to open the test of the $0.12 breakdown level, where sellers are expected to start dumping.
A sharp rejection here sets up a range between $0.09 and $0.12 for the near term. While the chances of DOGE hovering in this range are likely, if the OG meme coin closes above $0.12, the entire script will flip, and Dogecoin could end up surging to $0.16.
3. Zcash: Will the ZEC rally continue?
ZEC pushed to $276 on March 18, sparking hopes of the privacy coin’s grand re-entry, according to CoinMarketCap.
In the short term, the $278 level is the key battleground. Holding above it keeps the short-term structure intact, allowing buyers to kickstart another attempt at $286, but a clean break below $278 shifts the advantage back to sellers and opens the path to $272 first.
If ZEC continues sliding down, it could go as low as $265 or $258.
Final words: Boost your bags
Selling pressure could return in an instant, and that’s exactly why DeepSnitch AI has been making rounds lately.
With a launch set at exactly the right time, affordable pricing, powerful utility, and the special DeepSnitch AI bonus adding as much as 300% extra DSNT to your bag, the rewards could be massive if you lock in at exactly the right time.
Don’t let the market erase your gain. Reserve your tokens in the DeepSnitch AI presale now and join X or Telegram for the latest project updates.
FAQs
1. What is the DeepSnitch AI bonus code, and how does it work?
DeepSnitch AI offers four bonus codes tiered by allocation size. DSNTVIP30 gives 30% extra tokens, DSNTVIP50 gives 50% on $5K or more, DSNTVIP150 unlocks 150% for larger positions, and DSNTVIP300 gives 300% extra on allocations of $30K and above. All codes expire at the March 31 launch.
2. Why did Bitcoin exchange inflows spike, and what does it mean for the market?
Hourly Bitcoin inflows hit 6.1K BTC on March 16, the highest since February 20, with large deposits accounting for 63% of total inflows. CryptoQuant’s head of research flagged that historically, these spikes precede increased selling pressure.
3. When is the DeepSnitch AI TGE, and what happens after?
DeepSnitch AI lists on Uniswap on March 31. The seven-day claim window opens at TGE, with DEX and CEX listings expected to follow.
The post Special DeepSnitch AI Bonus Code: Limited Time Left To Reserve 300% Extra Tokens Ahead of Launch, Bears Lose Grip On ZEC and DOGE appeared first on Blockonomi.


Large XRP holders added 200 million tokens over two weeks, quietly building their stack even as the price failed to hold $1.50.
XRP has pulled back under $1.50 after briefly surpassing $1.60 yesterday, with a popular analyst saying the token now sits at a critical decision point and that a single piece of legislation could determine whether it breaks higher.
According to EGRAG CRYPTO, the CLARITY Act is the primary catalyst standing between XRP’s current price and a potential run past the $1.65 to $1.70 resistance band they dubbed “Zone 1.”
An Ascending Triangle With One Condition Attached
In their analysis, posted on X on March 18, EGRAG pointed out that XRP was forming an ascending triangle just below the $1.65-$1.70 range.
This is a pattern that usually leads to upward breakouts, and, according to the analyst, it shows rising lows, which would suggest that buyers were stepping in. The chart also showed that resistance has so far been flat, meaning that liquidity is concentrated above the current level.
EGRAG estimated that there is a 65% chance the XRP price will break above Zone 1, mainly due to structure and building compressions. However, the other 35% points to a rejection or fakeout, which they believe could happen if the CLARITY Act is postponed.
The Ripple token has gone up about 6.5% in the last seven days, with a range stretching from $1.37 to $1.60. That breakout happened around the same time as a buildup in derivatives positioning, as revealed by CryptoQuant contributor Amr Taha. According to him, XRP’s open interest delta rose by $16 million on March 13 and another $18 million on March 16, with the second wave coming just before the cryptocurrency’s jump above $1.50.
Whale activity followed suit, with chartist Ali Martinez reporting that large addresses had added 200 million XRP in the last two weeks, bringing their total from 10.88 billion to 11.08 billion.
You may also like:
But despite all this, XRP was rejected at $1.60, and was trading near $1.45 at the time of writing, a price that another market watcher, Tara, stated they were closely monitoring, referring to it as the macro 0.618 Fibonacci support level.
What Zone 1 Doesn’t Unlock
EGRAG’s analysis made it clear what the $1.65 to $1.70 zone can trigger, as well as what it cannot deliver on its own. According to them, while breaking above that range would be a meaningful technical event, getting to the next level at $2.60 and beyond requires additional conditions.
These include institutional flows or ETF-style exposures, stable BTC prices, or a drop in the number one cryptocurrency’s dominance, as well as weekly XRP closes above the $1.85-$2.00 band.
The CLARITY Act itself is moving, with negotiations possibly concluding as early as next week, according to investor Paul Barron. U.S. President Donald Trump had publicly blamed banks for holding the bill back in order to protect their deposit base.
Binance Free $600 (CryptoPotato Exclusive): Use this link to register a new account and receive $600 exclusive welcome offer on Binance (full details).
LIMITED OFFER for CryptoPotato readers at Bybit: Use this link to register and open a $500 FREE position on any coin!
Key takeaways:
-
Spot market demand through US-listed ETFs and Strategy buying BTC supports Bitcoin’s bullish momentum.
-
Low leverage among Bitcoin bulls reduces the risk of cascading liquidations even if prices drop another 5%.
-
Rising inflation concerns negatively impact fixed-income returns, paving the way for an eventual rotation from gold into Bitcoin.
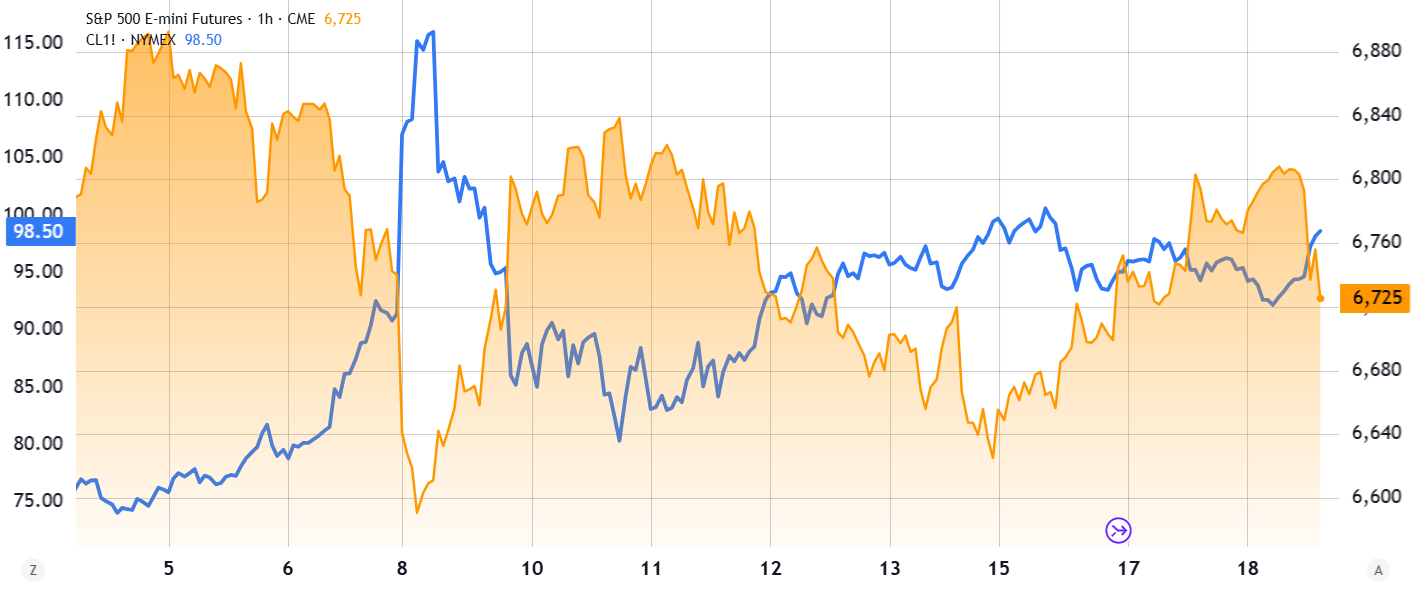
Bitcoin (BTC) faced a 7% correction after flirting with the $76,000 level on Tuesday. The downturn followed a decline in the US stock market after oil prices surged due to Israel attacking Iran’s largest gas processing facility and the US producer price index rising above expectations.
Despite the recent losses, there is no indication that Bitcoin’s bullish momentum has faded, given how the S&P 500 and US Treasuries have behaved amid worsening macroeconomic conditions. Additionally, Bitcoin bulls have avoided excessive leverage, reducing the risks of cascading liquidations.

The S&P 500 index traded merely 4% below its all-time high on Wednesday despite recent weak US job market data and continued pressure from the ongoing war in Iran. The US reported continued jobless claims relatively steady at 1.85 million in the week ending March 7. On Wednesday, the US announced that wholesale prices gained 3.4% in February versus the prior year, the largest gain in 12 months.
As oil prices jumped above $98, investors became more convinced that the US Federal Reserve will not be able to ease monetary policy throughout 2026. CME FedWatch Tool showed that odds for a steady interest rate by September plummeted to 42% on Wednesday, from 89% one month prior, according to implied odds on futures markets.
Bitcoin under pressure as prolonged war risks heighten investors’ risk aversion
Sticky inflation and the prospect of a prolonged war reduced the odds of economic stimulus focused on expansion, causing investors to avoid risk. However, there is no reason to believe that traders anticipate an imminent crash, at least judging by how interest rates are priced relative to inflation expectations.

The 2-year Treasury yield traded at 3.71% on Wednesday, while the Cleveland FED 2-year inflation expectation stood at 2.27%, resulting in a 1.44% adjusted return. During periods of extreme fear, higher demand for government bonds tends to result in near zero or negative returns. Conversely, a lack of confidence in US monetary policy can push the indicator to 2.5% or above.
Even if Bitcoin drops another 5% in the upcoming weeks, there is no indication of excessive leverage demand from bulls, meaning low risk of cascading liquidations. Recent bullish momentum has been supported by the spot market, especially through US-listed spot Bitcoin ETF accumulation and Strategy’s (MSTR) aggressive buying activity.

CoinGlass estimates that $450 million worth of leveraged long Bitcoin futures would be forcefully terminated down to $68,000, representing less than 1% of the current $49 billion aggregate open interest. The Bitcoin perpetual futures funding rate confirms that bears are becoming overconfident as demand for leverage on short positions has increased.
Related: 74% of institutions expect crypto prices to rise in 12 months–Survey

A negative funding rate means shorts are the ones paying to keep their positions open. More importantly, the indicator stood below the neutral 6% to 12% range even as Bitcoin price surged above $76,000, reinforcing the thesis of spot demand sustaining momentum rather than speculation using derivatives markets.
Gold prices dropped to $4,900 on Wednesday, showing signs of exhaustion after holding levels above $4,800 for four weeks. An eventual rotation out of gold could be the trigger for a sustained Bitcoin rally, especially as inflation concerns negatively impact expected returns for fixed-income assets. Overall, there is little indication that Bitcoin’s current bullish momentum has faded.
This article does not contain investment advice or recommendations. Every investment and trading move involves risk, and readers should conduct their own research when making a decision. While we strive to provide accurate and timely information, Cointelegraph does not guarantee the accuracy, completeness, or reliability of any information in this article. This article may contain forward-looking statements that are subject to risks and uncertainties. Cointelegraph will not be liable for any loss or damage arising from your reliance on this information.
At the same time, one important indicator suggests that the price may also plummet dramatically in the foreseeable future.
The leading cryptocurrency experienced a significant upswing over the past several days, with its price briefly rising to as high as $76,000.
Although it was stopped there and pushed south by $5,000, some key factors, including recent whale activity, suggest it may post further gains in the near future.
BTC Isn’t Done Yet?
Despite losing some steam in the past hours, Bitcoin remains well in the green on a weekly scale and currently trades at around $71,400 (per CoinGecko’s data). As a result, many analysts have flipped toward the optimists’ corner and expect an additional price increase.
The renowned market observer Ali Martinez, for instance, claimed that a daily close above the $73,344 resistance and later turning that level into a structural floor could open the door to a pump to $79,234 and $85,555.
In a subsequent post on X, the same analyst revealed that whales have acquired 40,000 BTC over the past seven days. The USD equivalent of the stash is almost $2.9 billion (at current rates), and now this cohort of investors controls roughly 5.17 million units, or roughly 25% of the asset’s circulating supply.
Such accumulations are generally viewed as bullish because they reduce the amount of BTC available on the open market, which, combined with non-declining demand, should lead to a price surge. They may also energize smaller players to step in and further support the upward momentum.
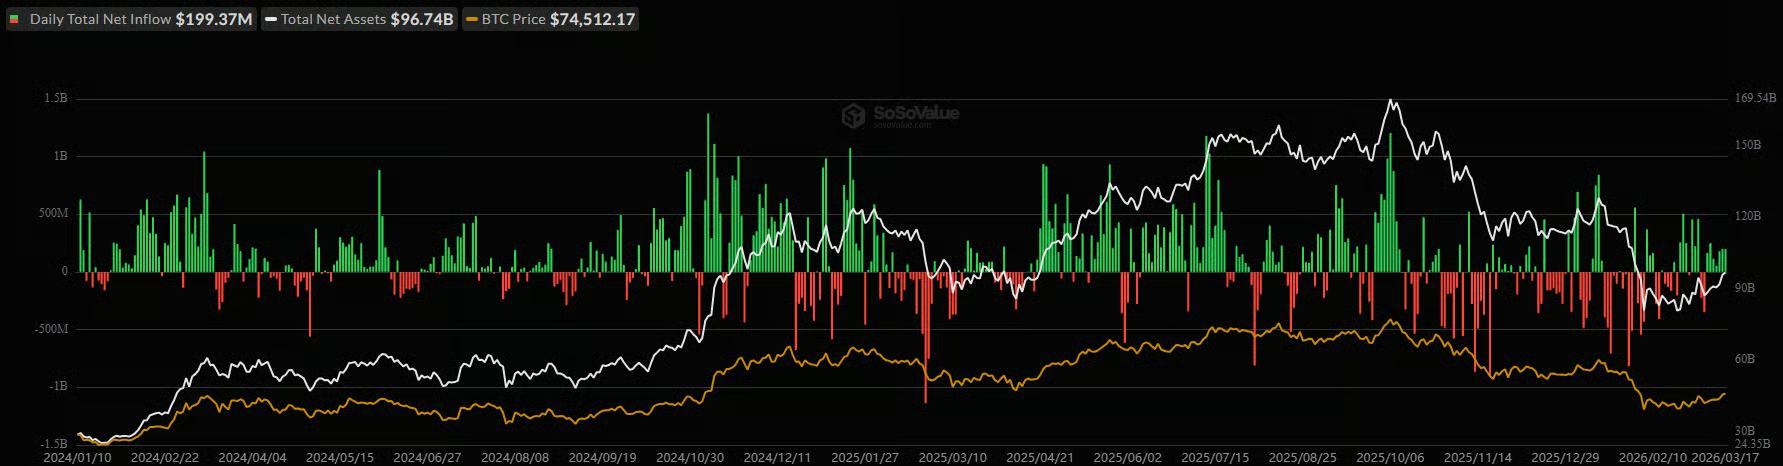
Next on the list is the solid interest in spot BTC ETFs lately. Over the past seven days, inflows into such investment vehicles have surpassed outflows, which is the longest such streak since October last year. When institutional investors such as pension and hedge funds increase their exposure to the asset through regulated financial vehicles, they require the issuers to purchase BTC to back their shares. Put simply, consistent ETF demand makes the remaining supply scarcer, which tends to push the price north.
You may also like:
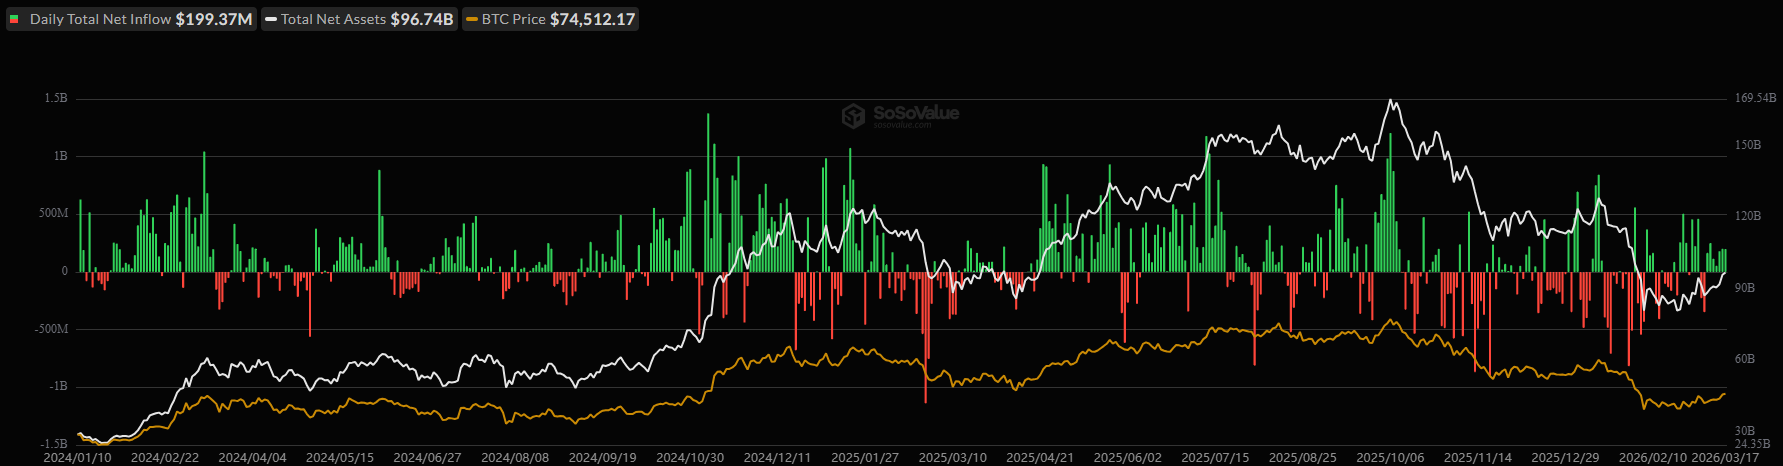
Despite the renewed appetite for such financial vehicles, many ETF investors remain underwater. Earlier this week, Axel Adler Jr. estimated that the $79,962 level represents the average cost basis of every BTC currently held inside these exchange-traded funds. If the asset trades below this mark, the cohort is sitting at unrealized losses, while breaking above would lead to paper profits.
Last but not least, we will touch upon the shrinking supply of BTC held on crypto exchanges. Today (March 18), the figure dropped to a new six-year low of approximately 2.72 million units. This suggests that investors continue to abandon centralized platforms in favor of self-custody methods, thereby reducing the immediate selling pressure.

Major Volatility Ahead?
Another industry participant who analyzed BTC’s recent performance is the X user Cantonese Cat. They claimed that the Bollinger Bands on a monthly scale have squeezed to levels never seen before.
The technical indicator shows how far the price deviates from its average, helping traders gauge volatility. When the bands tighten, it reflects a prolonged period with little turbulence: a setup that often precedes a large breakout. It is important to note that the huge move could be in any direction, or, as Cantonese Cat said:
“This will lead to a very powerful move when it expands. All that volatility that you saw over the last few months is nothing compared to what will come.”
Binance Free $600 (CryptoPotato Exclusive): Use this link to register a new account and receive $600 exclusive welcome offer on Binance (full details).
LIMITED OFFER for CryptoPotato readers at Bybit: Use this link to register and open a $500 FREE position on any coin!


Institutional investors remain broadly positive on digital assets despite recent market volatility, but they are becoming more selective about how they gain exposure, according to a new survey from Coinbase and EY-Parthenon.
The January 2026 survey of 351 institutional decision-makers found that 73% plan to increase their digital asset allocations this year, while 74% expect crypto prices to rise over the next 12 months. At the same time, nearly half said recent volatility has pushed their firms to place greater emphasis on risk management, liquidity and position sizing.
That mix of confidence and caution points to a maturing market, said David Duong, Coinbase’s head of institutional research.
“People are still interested in crypto,” Duong said in an interview. “They want to see tighter risk controls, but they want to stay allocated.”
The findings suggest institutions are no longer treating crypto as a short-term trade. Instead, many are building more permanent operating models around the asset class, with a heavier focus on governance, compliance and operational resilience.
One clear example is how institutions now prefer to access the market. The survey found that 66% of respondents get exposure through spot crypto exchange-traded funds (ETFs) and 81% prefer spot exposure through a registered vehicle. Duong said that does not mean exchange-traded products are only a temporary step before institutions move fully on-chain.
“I don’t think it’s just a transitional vehicle,” he said. “It caters to a certain segment of the investor community.” Still, he added that as the market develops, more institutions may want exposure to the underlying assets directly rather than only through fund wrappers.
Regulation remains the biggest tension in the market. Among respondents planning to increase holdings, 65% said greater regulatory clarity was a key driver, yet 66% also called regulatory uncertainty a primary concern when investing in digital assets.
That contradiction could become important if clearer rules emerge. “Regulatory clarity is acting as both the driver, but also the obstacle,” Duong said.
Recent developments around the proposed Digital Asset Market CLARITY Act have added urgency to that dynamic. The bill, which aims to define how crypto assets are regulated in the U.S., would clarify the roles of the SEC and CFTC while setting rules for stablecoins and market structure. While the legislation has yet to pass, policymakers and regulators have signaled growing support for a clearer framework, and parallel guidance from agencies like the Office of the Comptroller of the Currency has begun to outline how banks can engage with digital assets.
For institutions, that evolving backdrop is critical: clearer rules could unlock broader participation, while continued uncertainty remains a key constraint on capital entering the space.
The survey also found growing interest in stablecoins and tokenization, two areas increasingly seen as practical infrastructure rather than speculative bets. Eighty-six percent of respondents said they already use stablecoins or are interested in using them, with top use cases including T+0 settlement and internal cash management and money movement. Meanwhile, 63% said they are very interested in investing in tokenized assets, and more than 60% expect tokenization to significantly affect trading, clearing and settlement within three to five years.
Custody has also moved higher on the priority list. The share of respondents citing regulatory compliance as a key factor in selecting a custodian rose to 66% from 25% a year earlier. The importance of security and key-signing protocols jumped to 66% from 8%.
Duong said that shift reflects how institutions are thinking about crypto differently as use cases expand beyond trading.
“Compliance and security are now the top priorities,” he said. “Cost, interestingly enough, has fallen to the bottom of the list.”
For Coinbase, the message is that institutions still want crypto exposure, but only with stronger guardrails. For the broader market, the survey suggests the next phase of adoption may depend less on enthusiasm alone and more on whether the industry can deliver the controls large investors now expect.
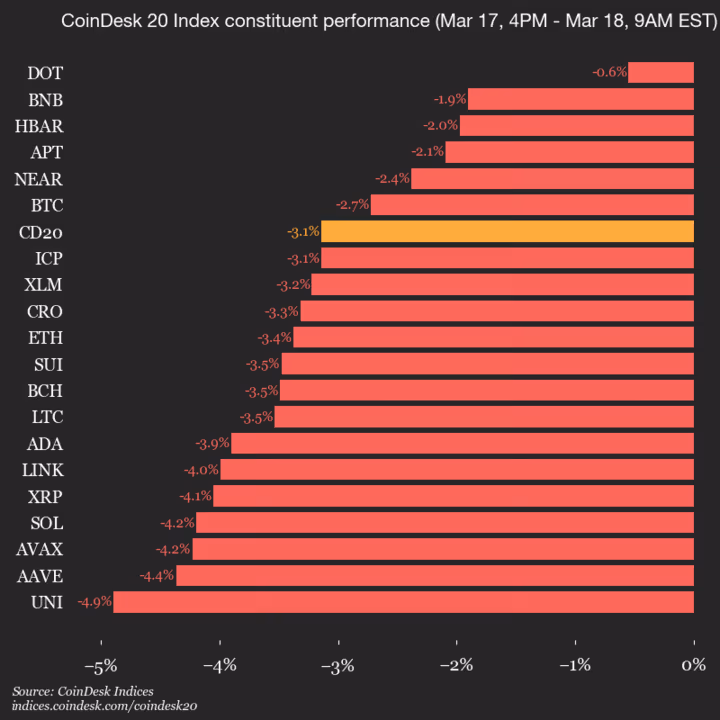
CoinDesk Indices presents its daily market update, highlighting the performance of leaders and laggards in the CoinDesk 20 Index.
The CoinDesk 20 is currently trading at 2102.78, down 3.1% (-68.15) since 4 p.m. ET on Tuesday.
None of the 20 assets are trading higher.

Leaders: DOT (-0.6%) and BNB (-1.9%).
Laggards: UNI (-4.9%) and AAVE (-4.4%).
The CoinDesk 20 is a broad-based index traded on multiple platforms in several regions globally.

Disclosure: This article does not represent investment advice. The content and materials featured on this page are for educational purposes only.
CoinEx launches Dual Investment product to help traders earn rewards during volatile market conditions.
Summary
- CoinEx unveils dual investment, enabling crypto holders to earn interest while targeting specific buy or sell prices.
- Traders can now grow their crypto holdings with CoinEx’s Dual Investment, earning yields even during market swings.
- Dual investment by CoinEx offers high APY rewards, letting investors lock USDT or BTC with conditional price targets.
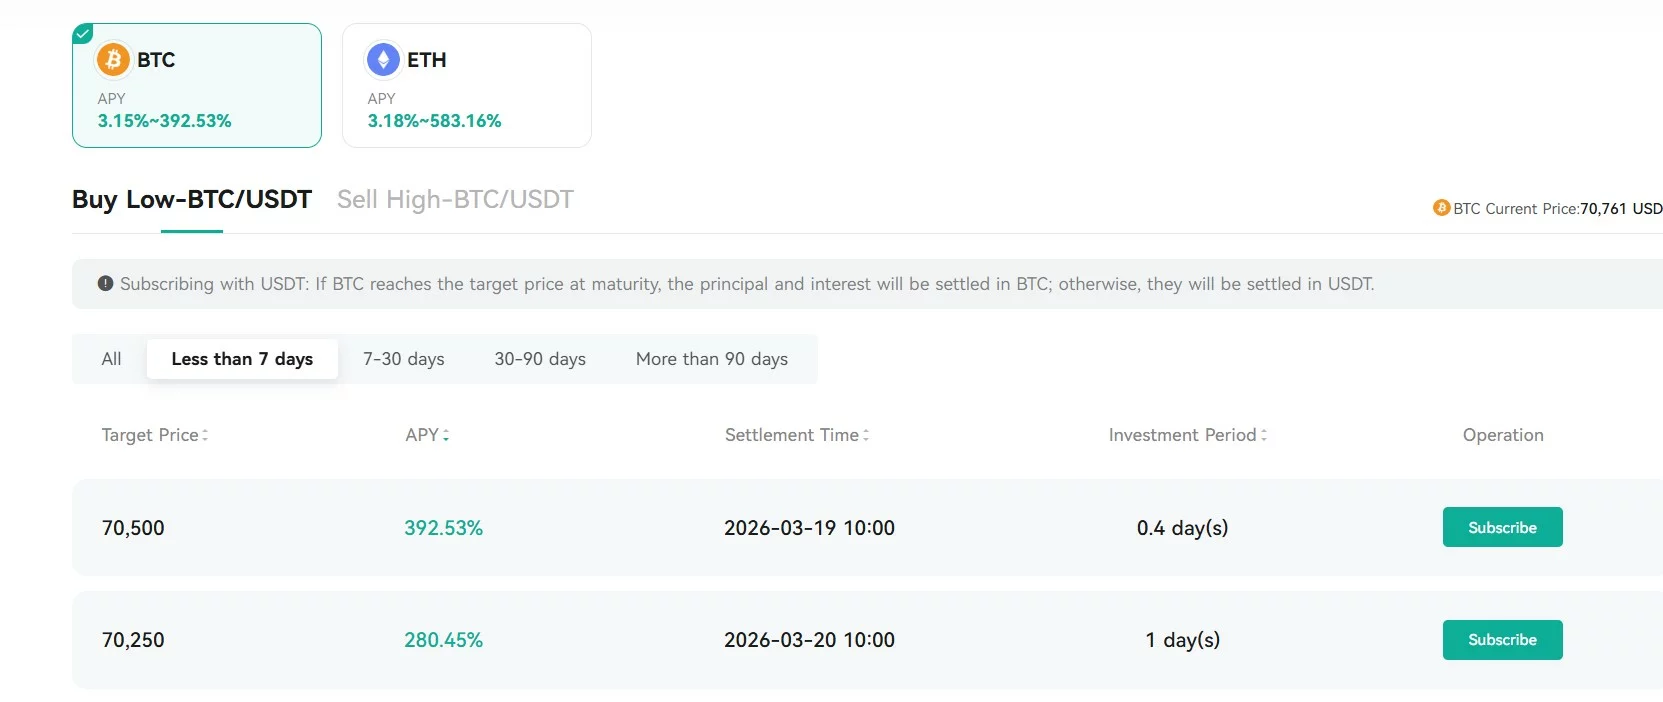
CoinEx has launched a product called dual investment, which allows traders to earn rewards even during times of high market volatility.
CoinEx’s dual Investment is a financial product designed to generate income while allowing investors to set a conditional “sell high” or “buy low” outcome.
Under this structure, an investor deposits a cryptocurrency such as USDT or Bitcoin, selects a target price at which they are willing to buy or sell, and chooses a fixed investment period.
If the market price reaches the selected level during that period, the investment is settled in the other asset, and the investor receives both their principal and the agreed yield. If the target price is not reached, the investor simply receives their original asset back, along with the accrued interest.
In a typical dual investment scenario, an investor might deposit $10,000 in USDT while setting a target price to buy low Bitcoin at $50,000, below its current price of $55,000. Over a seven-day period, the product offers a high annualized yield, for example, an APY of 90%, which translates to roughly $173 in interest for the week.
If the price of Bitcoin falls to $50,000 or below during that period, the investor’s funds are automatically converted into Bitcoin at the agreed price, and they receive the equivalent value along with the earned yield. However, if the market does not reach the target level, the investor retains their original USDT deposit, plus the interest earned.
For a trader holding Bitcoin who chooses to sell high, if the market price rises to their target, the asset is sold, and returns are paid in USDT with yield; if not, the investor keeps their Bitcoin and still earns interest.
When the market is moving sideways without going anywhere, dual Investment traders have a way to still make money. Instead of just waiting for prices to rise or fall, they can earn interest on their crypto even during times of market consolidation.
CoinEx offers dual investment for BTC/USDT and ETH/USDT pairs, with a fixed APY of up to 400%.
However, just like any investment, dual investment comes with its own risks. CoinEx says that the product carries non-principal-protected risk. Market volatility and other unforeseen factors mean investors may experience losses or miss out on potential gains that could have been captured on the spot market.
Investors should also note that assets in dual investment products are locked until the end of the chosen period, meaning they cannot redeem or withdraw their funds before maturity and settlement.
Disclosure: This content is provided by a third party. Neither crypto.news nor the author of this article endorses any product mentioned on this page. Users should conduct their own research before taking any action related to the company.


The Bank of Korea has kicked off Phase 2 of Project Hangang, expanding its digital won pilot to nine banks and, for the first time, using CBDC-linked deposit tokens for real government subsidy payments.
Summary
- The BOK’s Project Hangang Phase 2 extends its wholesale CBDC and deposit-token pilot from seven to nine banks and introduces live government subsidy disbursement as a core test case.
- New features such as biometric approvals, P2P wallet transfers and automatic top-ups aim to fix Phase 1’s weak engagement, when only ~80,000 of 100,000 invited users opened wallets and volume stayed below 700 million won despite a 30–35 billion won infrastructure spend.
- Seoul is positioning deposit tokens as an “intermediate stage between a CBDC and stablecoins,” tying the pilot to a potential 110 trillion won subsidy flow and future AI-powered automatic payments rather than rushing a full retail CBDC.
The Bank of Korea (BOK) officially launched the second phase of Project Hangang on Wednesday, its flagship initiative to build a blockchain-based payments and settlement infrastructure using wholesale central bank digital currency (CBDC) and commercial bank deposit tokens. The expansion marks a pivotal step forward for South Korea’s digital currency ambitions, broadening the project from seven to nine participating commercial banks and introducing live government subsidy disbursement for the first time.
Phase 2, formally dubbed “Project Hangang Phase 2,” adds Kyongnam Bank and iM Bank to the original seven institutions — KB Kookmin, Shinhan, Woori, Hana, NH Nonghyup, IBK Industrial, and BNK Busan Bank. The project is being conducted jointly with the Financial Services Commission and the Financial Supervisory Service, and covers real-scenario testing of deposit tokens across two critical use cases: government subsidy distribution and nationwide consumer payment and transfer services.
Phase 1 of Project Hangang, which ran for approximately three months beginning in April 2025, onboarded up to 100,000 participants and recorded 118,000 payment test transactions, validating that a deposit-token-based payment and settlement system could operate stably in a live environment. However, the pilot exposed significant friction: while 100,000 citizens were invited to participate, only around 80,000 actually opened digital wallets, and total payment volume reached just 692.46 million won — modest figures that prompted banks, which had collectively spent approximately 30–35 billion won building the underlying infrastructure, to raise concerns about commercialisation viability.
The BOK has addressed those gaps directly in Phase 2. New features include biometric authentication via fingerprint for payment approval, direct peer-to-peer transfers between digital wallets, and an automatic top-up function that converts funds from a linked bank account into deposit tokens when a wallet balance runs low. The BOK framed the improvements as meaningful steps toward usability parity with existing electronic payment systems.
One of the most consequential additions in Phase 2 is the integration of government subsidy disbursement. South Korea’s government distributes vast sums through social welfare programs — a BOK representative has noted that Project Hangang is designed to enhance fiscal efficiency by reducing misuse and cutting administrative costs associated with the current system of credit cards, locally issued vouchers, and bank accounts. The government is exploring allocating a portion of its $499 billion budget via CBDC-linked distribution infrastructure, making the subsidy pilot a test case with implications well beyond retail payments.
The BOK was careful to frame the project’s ambitions modestly. In its announcement, it described the digital currency being tested as “an intermediate stage between a CBDC and stablecoins,” and emphasised that Project Hangang is not premised on the immediate introduction of a full retail CBDC, but rather a real-transaction test of how public financial infrastructure could function in a digital environment. For commercial banks, the BOK added, it would be “an opportunity to try using it in advance in preparation for the possibility of future institutionalization.”
Large-scale follow-up real transactions with all nine banks are planned for the second half of 2026, with a stated objective of reducing payment fees for small business owners and building financial infrastructure connected to new industries — including AI-based automatic payments. LG CNS, which built the underlying technical infrastructure for Phase 1, remains a core systems partner.
The launch comes weeks after the BOK separately published a report in February 2026 urging regulators to restrict early issuance of won-backed stablecoins to licensed commercial banks, citing money laundering and financial stability risks — a stance that reinforces Seoul’s preference for a controlled, bank-led path to digital currency adoption rather than the open-access model seen in some other jurisdictions.
Crypto World
Best Crypto Portfolio for 2026: Messari Pivots to AI and Pepeto Gives Early Investors the Entry That Large Caps Cannot Offer
Messari just cut its staff to become an AI first company, handing leadership to former CTO Diran Li. When a major data provider goes all in on machine learning, that tells every investor where the future is heading.
The best crypto portfolio for 2026 needs large caps for the base and an early project for the returns that BTC at $71,614 and ETH at $2,203 can no longer deliver. And the early project absorbing the most capital right now is Pepeto.
Messari confirmed the company is doubling down as an AI first organization, restructuring its entire data layer around machine learning according to CoinDesk.
Strategy purchased $1.57 billion worth of Bitcoin, the largest single buy of 2026, pushing BTC briefly above $75,000 according to CoinDesk. Peter Brandt flagged an Ethereum bottom at $2,300 with a $4,000 target.
Best Crypto Portfolio Allocations and the Projects That Deserve Capital in March 2026
Pepeto Is the Early Entry That Belongs in Every Serious Crypto Portfolio Before the Listing Changes the Price
Picture this: the market just corrected after FOMC, your portfolio is red, and most investors are either panic selling or frozen, staring at charts they cannot read. The ones who already had Pepeto in their portfolio are not worried. Not because they predicted the dip, but because they got in at a price that makes the dip irrelevant. That is the real edge an early project offers for any crypto portfolio in 2026.
Instead of paying fees on every swap and watching your capital shrink trade by trade, PepetoSwap charges zero on every transaction and the bridge moves tokens across Ethereum, BNB Chain, and Solana for nothing. The risk scorer also scans every token in real time, catching honeypots and exploit code before your money ever touches the contract.
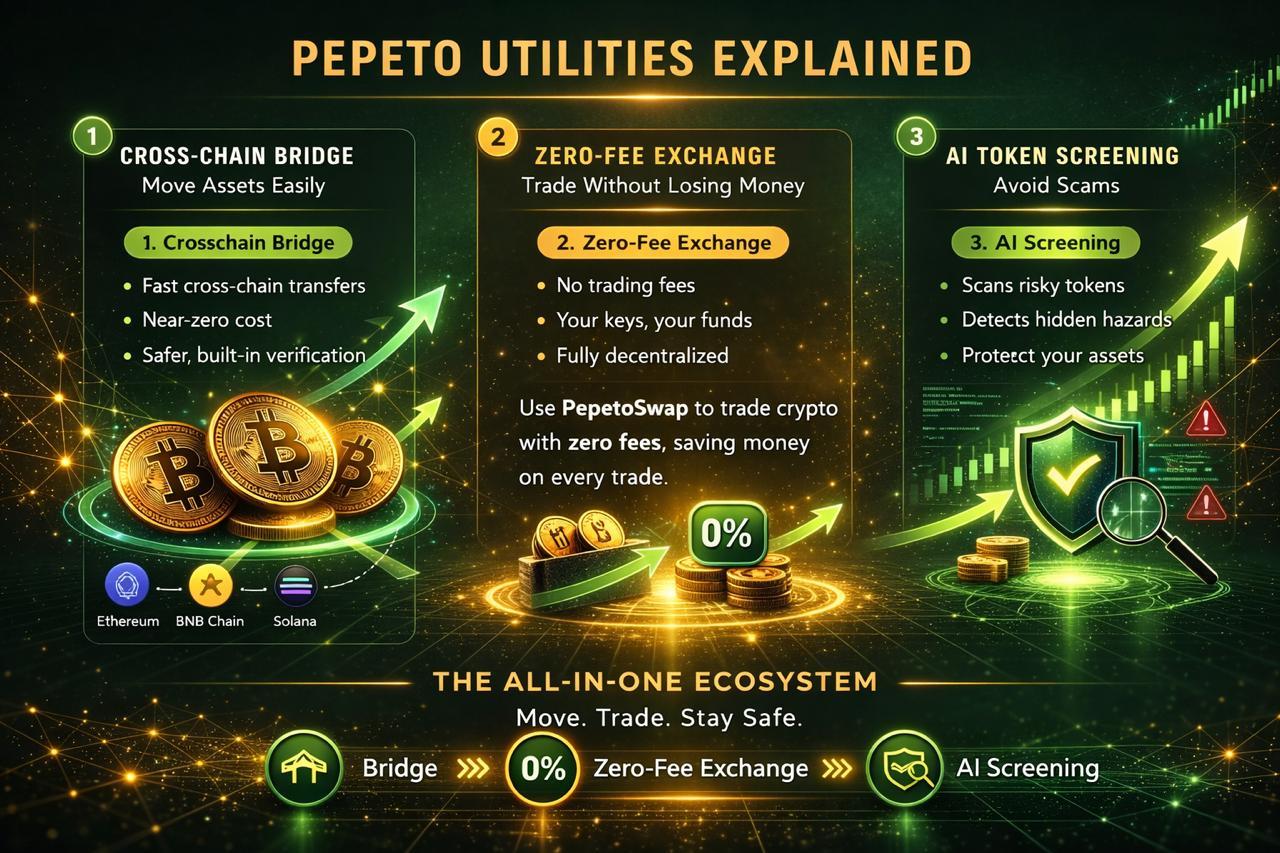
That kind of protection could have saved a lot of portfolios from the rug pulls that wiped out billions last cycle. A working exchange, bridge, and risk scorer all audited by SolidProof before the presale opened is something the presale market almost never delivers.
With the Binance listing approaching and more than $8.1 million already raised, adding Pepeto to a portfolio before it lists could be the single best allocation of 2026. And a $3,000 position at $0.000000186 buys over 16 billion tokens. If Pepeto only reaches the $11 billion cap that Pepe hit with the same 420 trillion supply and zero products, that $3,000 becomes more than $450,000, and that is the base case scenario as Pepeto offers far more utility and potential.
Bitcoin at $71,614 Anchors Every Crypto Portfolio With Institutional Backing
BTC trades at $71,614 according to CoinMarketCap, after the FOMC pullback from $76,000. Strategy’s $1.57 billion purchase and the longest ETF inflow streak in five months confirm institutional conviction.
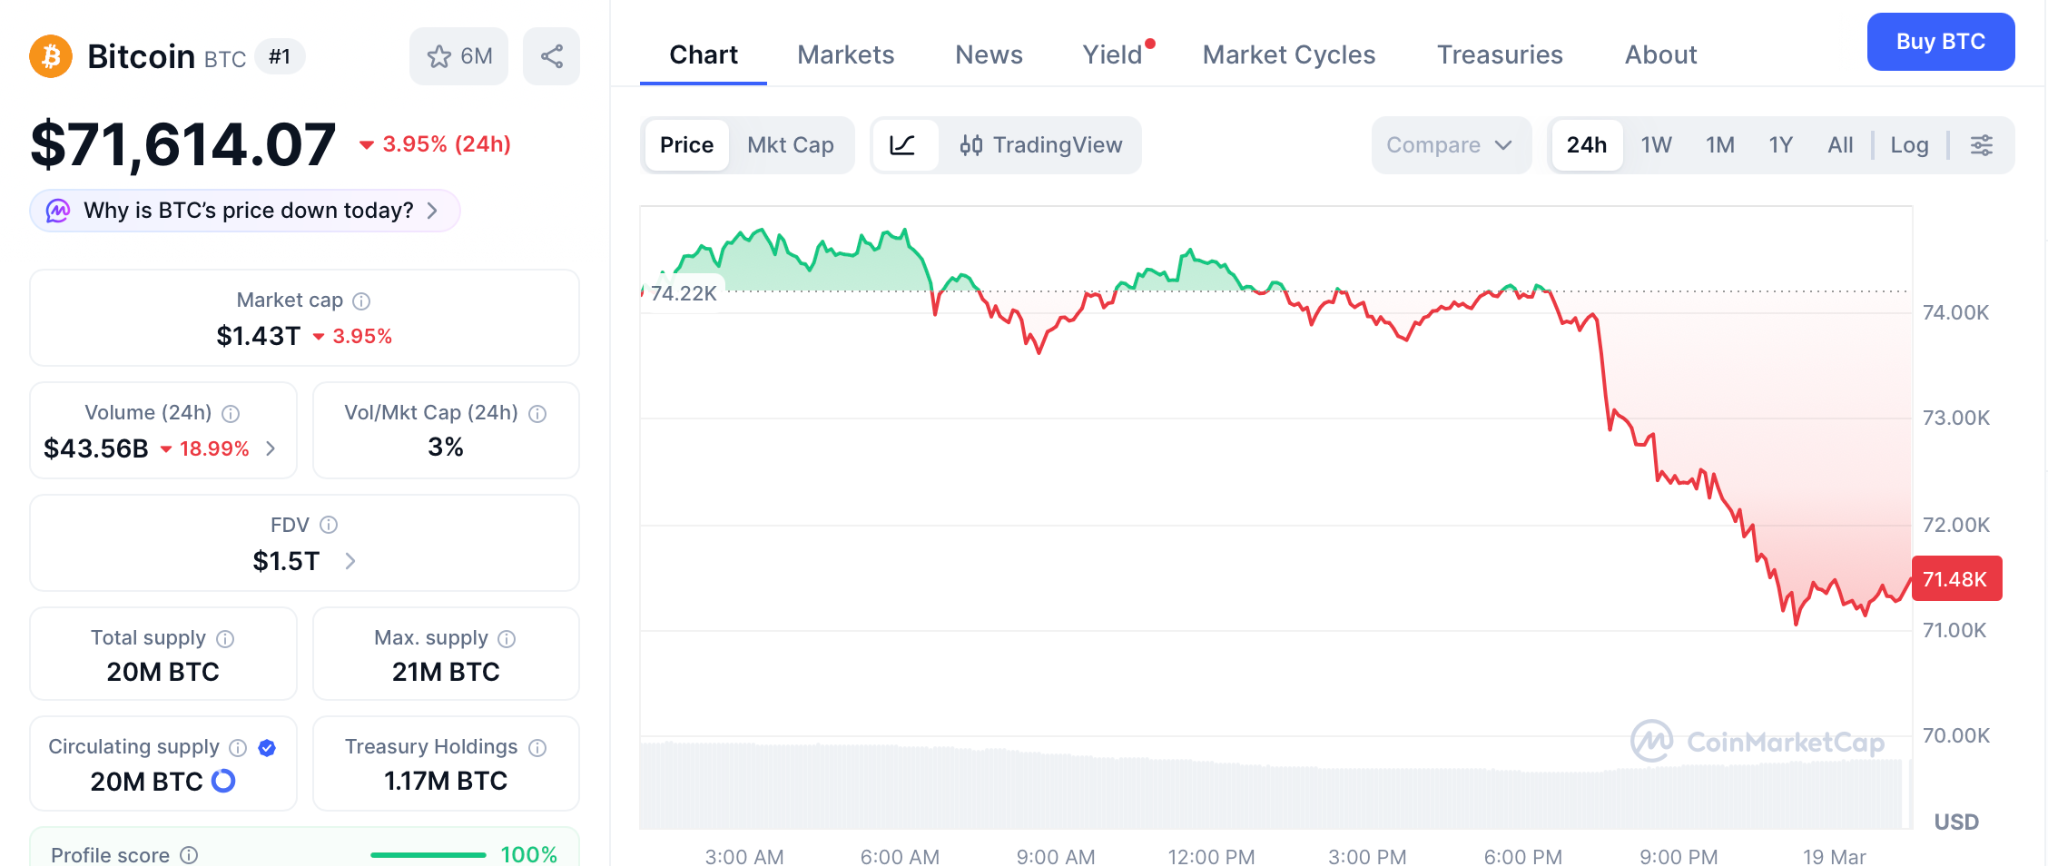
Kiyosaki targets $750,000 long term. Bitcoin is the anchor, but from $74,000 the returns that change a life come from the early entries.
Ethereum at $2,203 With Peter Brandt Flagging a Possible Bottom and a $4,000 Target
Peter Brandt indicated ETH is forming a bottom at a major historical support level, targeting $4,000 according to CoinGecko.
From $2,203 to $4,000 is roughly 75%. Strong for a portfolio allocation, but the biggest returns still come from getting into early projects before the listing.
Digitap Targets the Creator Economy but Lacks a Working Product and Community Traction
Digitap targets the $85 billion creator economy with AI subscription tools. The concept is interesting, but it has raised $1.5 million without a working product or community comparable to projects already generating real demand. The timeline to results is measured in years.
The Best Crypto Portfolio Does Not Wait for the Market to Recover Before the Early Entry Disappears
The best crypto portfolio does not wait for the market to feel safe again before the entry disappears. Pepeto is the early project that belongs in every serious portfolio for 2026, and the Binance listing means the presale at this price has a deadline the market will not extend.
A $3,000 position buys over 16 billion tokens, and 196% APY staking compounds that position daily while the listing advances. Visit the Pepeto official website and add the early entry before the listing, because every cycle proved that the best portfolios were built before the listing, not after.
Click To Visit Pepeto Website To Enter The Presale

FAQs
What is the best crypto portfolio for 2026?
BTC for stability, ETH for the recovery play, and Pepeto as the early project with the biggest potential before the Binance listing.
Why does Messari pivoting to AI matter for building a crypto portfolio?
When institutional data providers restructure around AI, it confirms the direction of the cycle. The best crypto portfolio positions early in that direction.
Is Pepeto a good early project to add to a portfolio?
More than $8.1 million raised, SolidProof audit, original Pepe coin team, and a Binance listing approaching. Visit the Pepeto official website.
The post Best Crypto Portfolio for 2026: Messari Pivots to AI and Pepeto Gives Early Investors the Entry That Large Caps Cannot Offer appeared first on Blockonomi.
can Pi escape its range in 2026?
The Phil Mickelson advice that helped Rory McIlroy win the Masters
The UK’s high electricity prices are here to stay. But could they offer an opportunity?


-
 Crypto World5 days ago
HYPE Token Enters Net Deflation as HyperCore Buybacks Outpace Staking Rewards
-

 Tech3 days ago
Your Legally Registered ‘Motorcycle’ Might Not Count Under Proposed US Law
-

 Fashion5 days ago
Weekend Open Thread: Addict Lip Glow
-
Sports4 days ago
Why Duke and Michigan Are Dead Even Entering Selection Sunday
-
 Tech1 day ago
Are Split Spacebars the Next Big Gaming Keyboard Trend?
-

 Business3 days ago
Search for Savannah Guthrie’s Mother Enters Seventh Week with No Arrests
-

 Business4 days ago
US Airports Launch Donation Drives for Unpaid TSA Workers as Partial Government Shutdown Enters Fifth Week
-
Crypto World4 days ago
Coinbase and Bybit in Investment Talks: Could Bybit Finally Enter the US Crypto Market?
-

 Business3 days ago
Australian shares drop as Iran war enters third week
-

 Business5 days ago
Country star Brantley Gilbert enters growing non-alcoholic beer market
-

 Crypto World3 days ago
Crypto Lender BlockFills Enters Chapter 11 with Up to $500M in Liabilities
-

 Sports5 days ago
College Basketball Best Bets: Conference Tournament Semifinal Picks
-

 Politics15 hours ago
The House | The new register to protect children from their abusers shows Parliament at its best
-

 Crypto World7 days ago
Three Binance Charts May Be Hinting at Bitcoin’s Next Move
-

 Business6 days ago
Trump demands Powell cut rates as Iran conflict raises energy prices
-

 Crypto World6 days ago
Senate Votes to Include CBDC Ban in Bipartisan Housing Bill
-

 Fashion3 days ago
25 Celebrities with Curly Hair That Are Naturally Beautiful
-

 News Videos7 hours ago
RBA board divided on rate cut, unusually buoyant share market | Finance Report | ABC NEWS
-

 NewsBeat6 days ago
Deane Road crash near Bolton colleges and university
-

 News Videos6 days ago
Tom Lee: The 100x Opportunity EVEN Bigger Than Bitcoin (New Ethereum Prediction 2026)


You must be logged in to post a comment Login