Government-backed funding gives Chinese firms significant operational advantages
Lower-cost AI models from China appeal to developing nations worldwide
Microsoft is investing billions to strengthen AI tools and infrastructure globally
Microsoft President Brad Smith has warned American technology companies may face growing challenges from Chinese competitors that benefit from substantial state subsidies.
Beijing has provided multi-billion-dollar support, including a national AI fund and energy vouchers, to reduce operational costs for domestic companies.
Smith compared the situation to China’s earlier success in telecommunications, noting how state-backed firms like Huawei and ZTE disrupted the global market and pressured European and US companies.
Rising competition is fueled by government support
“I do think we always have to think about, maybe even worry a little bit about, Chinese subsidies. Some American companies disappeared. European companies like Ericsson and Nokia were thrown on the defensive,” Smith told CNBC.
“I think for the rest of us, we have to compete with that, and we have to be good at competing with that, with the support of our governments.”
He also emphasized similar strategies could make lower-cost AI offerings from Chinese companies attractive in developing nations, where affordability is often key.
Advertisement
Chinese AI companies have quickly expanded their international presence, often relying on partnerships instead of building wholly owned data centers outside China.
Sign up to the TechRadar Pro newsletter to get all the top news, opinion, features and guidance your business needs to succeed!
Alibaba, for instance, provides cloud-based AI services across multiple regions but frequently collaborates with local infrastructure providers.
Smith pointed out that existing Chinese data centers worldwide could be leveraged with government support, giving Chinese firms a potential cost advantage in deploying AI models at scale.
Advertisement
China’s approach includes both direct funding and operational incentives – a national AI fund worth roughly $8.4 billion was established to support early-stage projects, while local governments provide vouchers to reduce computing costs.
Low energy prices in many Chinese regions further reduce barriers to building and operating power-intensive AI infrastructure.
These measures create a competitive landscape where US firms may face pricing pressures and constraints in emerging markets.
Advertisement
Microsoft is responding with its own investment strategy, aiming to spend $50 billion by 2030 on AI initiatives in developing countries, efforts which combine infrastructure development, training programs, and support for AI tools designed to enhance local productivity.
Smith argued American companies must compete effectively while leveraging their advantages, including access to high-performance chips and leading-edge technology, to maintain influence in global AI markets.
Analysts suggest that Chinese AI models could become dominant in regions with limited resources, forming a “China tech sphere” over the next five to ten years.
For governments and companies in developing nations, cost efficiency may outweigh national origin when choosing AI tools.
Advertisement
Microsoft’s response involves deploying AI and productivity tools that are scalable, reliable, and capable of operating in the same environments targeted by Chinese competitors.
The first major astronomical event visible in 2026 is a total lunar eclipse, or “blood moon.” This phenomenon is highly prized by stargazers because the entire lunar disk takes on a reddish color for a few moments.
The total lunar eclipse will occur on March 3. It will be clearly visible in North and Central America, while in Central and South Asia it will only be partially visible. It will not be visible in Europe or Africa.
Although the eclipse will begin in the early morning, totality will occur almost at dawn on March 3. A few hours before sunrise, the full moon will take on its characteristic reddish color for just 12 minutes.
Times of the Total Lunar Eclipse or “Blood Moon”
Los Angeles: 3:04 am
Denver: 4:04 am
Chicago: 5:04 am
St. Louis: 5:04 am
New York: 6:04 am
Washington, DC: 6:04 am
It’s safe to view a total lunar eclipse, unlike a solar eclipse. You don’t need any special equipment; just go to a high vantage point and dress warmly. Keep in mind that at the time of totality, the moon will be almost touching the horizon, about to disappear. That’s why it’s necessary to view it from a high place, with no buildings or trees blocking your view.
The little light from the sun filters through the Earth’s atmosphere and impacts the moon, giving it its orange color.
Advertisement
NASA
Why Does the Moon Turn Red?
During a total lunar eclipse, the moon does not lose its brightness completely, but takes on a dull red hue. This happens because the Earth is positioned between the sun and the moon and casts its shadow on the lunar surface.
Unlike the moon, the Earth is surrounded by an atmosphere, which filters sunlight. Thanks to it, we see the blue sky, the orange sunset, or distant objects in opaque tones. The light coming from the sun and passing through the Earth’s atmosphere manages to reach the moon, although in a smaller proportion. Those already filtered rays impact the satellite, painting it red. “It’s as if all the world’s sunrises and sunsets are projected onto the moon,” NASA explains.
Total lunar eclipses are slightly rarer than total solar eclipses. A blood moon occurs every 2.5 years on average, while a total solar eclipse happens about every 18 months, according to NASA’s astronomical catalogs.
Total lunar eclipses seem more frequent because they can be observed from anywhere it is nighttime. In contrast, to see a total solar eclipse it is necessary to be exactly in the narrow band of totality. For example, an observer can see a total lunar eclipse every two to three years, but might have to wait about 375 years to see a total solar eclipse from his or her city.
Advertisement
This story originally appeared onWIRED en Españoland has been translated from Spanish.
The Bosch Series 6 Air Fryer XXL is an incredibly versatile piece of kit that can make meal prep a breeze, and it’s on offer today.
While it might seem like a great idea to fill your kitchen cupboards with as many different appliances as possible, it’s far more sensible to make use of a single great device that can save you a lot of time, cooking a wide array of dishes.
It was just £5 less on Black Friday, so if you missed out back then, the £50.26 saving today will be most welcome.
Advertisement
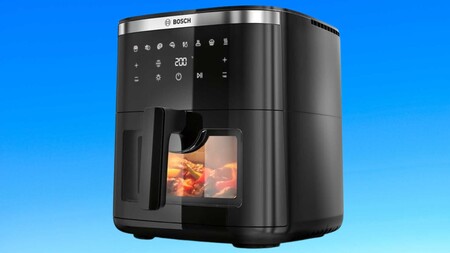
The Bosch Series 6 7.2L air fryer is now priced just shy of its Black Friday low
The Bosch Series 7.2L air fryer has dropped to a price that’s edging remarkably close to its Black Friday low, making it a strong moment to upgrade your kitchen setup.
Not only is it perfect for whipping up some crispy chips with a steak to the side, but it’s also great for frying off some burgers or grilling a few skewers for a more traditional barbecue feel when the summer hits.
Advertisement
Advertisement
It can even roast a whole chicken, so you can indulge in a hearty Sunday roast without having to rely on the oven all weekend.
Beyond the multifunctionality, Bosch’s air fryer also has a gigantic 7.2-liter capacity, which is more than enough to cater for larger families.
There are a total of seven preset programmes to make things even easier, plus features like an illuminated viewing window and a shake alarm (let’s just say, it’s best not to read too deeply into this one).
You can toggle between functions via the appliance’s intuitive digital touchscreen, but for a quick look at what’s going on inside the fryer, Bosch has included a handy illuminated viewing window, so you don’t even need to open anything up mid-cycle to know whether or not your food is looking good.
It’s also worth mentioning that when compared to an oven, air fryers can cook your food up to 65% faster, meaning you save on time and potentially energy costs in the process.
Advertisement
For those who would prefer to peruse some other options for the time being, here are the best air fryers we’ve tested and tracked for ourselves.
For nearly three decades, Bill Gurley has been among of the most influential voices in Silicon Valley — a general partner at Benchmark whose early bets on companies like Uber, Zillow, and Stitch Fix helped define what modern venture capital looks like. Now, having moved to Austin and stepped back from active investing, the native Texan is channeling that same pattern-recognition instinct into something different: a book, a foundation, and a policy institute aimed at problems he thinks he can actually help solve.
The book is Runnin’ Down a Dream — a nod to Tom Petty and also an argument that following your passion isn’t just romanticized career advice but a true competitive strategy, one that becomes only more urgent as AI rapidly reshapes the workforce. The foundation, which he’s calling the Running Down a Dream Foundation, will award 100 grants of $5,000 a year to people who need a financial cushion to make a leap they’ve been afraid to take.
We caught up with Gurley to talk about all of it — including what he makes of the somewhat surreal reality that several of his former peers in tech now hold enormous sway in Washington, why he thinks the 996 grind culture many young founders have adopted is less alarming than it sounds, and what AI really means for your career. The following has been edited for length and clarity. Our full conversation with Gurley drops Tuesday on TC’s StrictlyVC Download podcast.
Why write this book?
Advertisement
I went through a phase where I was reading a lot of biographies — people from very different fields, different time windows — and I started noticing patterns the way I would notice patterns in a market evolving. I wrote them down. A couple years later I got invited to speak at the University of Texas, dusted off the notes, built a presentation. They posted it on YouTube, and James Clear — who wrote Atomic Habits — noticed and posted about it. That’s what got me thinking about a book. And when I went through my own process of moving away from venture and thinking about what I wanted to do next, it became obvious I didn’t want to write about VC or Uber or any of that. I wanted to do something that could have a bigger mission.
Your research with Wharton found that roughly 60% of people would do things differently if they could start their careers over. That shocked you. Why?
When we first ran it as a SurveyMonkey poll we got seven out of ten. When we did it more rigorously with Wharton, we got six out of ten. One of the things that strikes me is that we have a phrase in the book — life is a use it or lose it proposition — and when you’re young, it’s just hard to have that framing. It’s hard to fast-forward through all of your time and recognize how precious it is. Daniel Pink has done a lot of work on what he calls regrets of inaction — the thing that weighs on people most as they get older is the thing they didn’t try, the stone left unturned. That holds across multiple geographies and cultures. And I think a lot of well-intentioned parents feel more responsibility to create economic stability for their kids than to encourage them to truly explore their passion. Especially with AI out there, that may not have been the right call.
Techcrunch event
Advertisement
Boston, MA | June 9, 2026
Exploring your passion sounds like easier advice for people who have financial runway. What do you say to someone working paycheck to paycheck?
Advertisement
A few things. First, the book profiles people who started on the very bottom rung and climbed to the top — [celebrity hairstylist and entrepreneur] Jen Atkins moved to LA with $200 in her pocket. There’s nothing in the book that says you need to start anywhere other than right at the beginning. Second, if you’re living paycheck to paycheck, I wouldn’t encourage you to quit. I’d encourage you to use your free time to build a little document on your phone about what your thing might be. Learn. Prepare to jump before you jump. And third — this is why I’m launching the foundation. The last page of the book talks about it: we’re going to give 100 grants a year of $5,000 to people who are in exactly that position, who can convince us in an application that they’ve thought long and hard about where they want to go but need a little help getting there.
You’ve been outspoken for years about regulatory capture — the idea that big companies use regulation to entrench themselves.
I gave a speech on regulatory capture a few years back — it was at the All-In Summit — and at the time I said I had a fear that the AI companies would try to use regulation to protect themselves. I think that’s happening now. The flip side is that there are legitimate questions: Jonathan Haidt’s book Anxious Generation has been on the bestseller list for almost two years, arguing social media has been really bad for children, with academic research to back it up. People would say we should have gotten in front of social media and need to do it with AI. The problem is that the people begging for regulation the most in AI are the actual companies themselves, and that makes me skeptical. There’s also the global dimension — if US AI gets entangled in state-by-state regulation and Chinese models are running free, we’re going to paint ourselves in red tape. I always ask people: what are your favorite five regulations of all time, and how were they successful? Do you have any confidence that people at the state level in a random state know how to write good AI regulation that will actually work?
It’s a little surreal that several prominent figures from your world now hold enormous influence in Washington. What do you make of that?
Advertisement
It’s very ironic. If you go back and watch that regulatory capture talk, who would have thought a few years later David Sacks would actually be [special advisor for AI and crypto in the White House]?
Back in 2018, Mike Moritz of Sequoia wrote in the FT that Americans would lose to China if they didn’t start working harder. It was controversial at the time, but a lot of young founders here seem to have since embraced a punishing work culture — the 996 ethos. What are your thoughts about what’s happening?
I kind of love it, honestly. I think Silicon Valley got really lazy during COVID — people weren’t coming into the office, the culture got soft in a way I hadn’t seen in all my years there. And I’ve been to China six times. I know what Michael Moritz was describing when he said we’re going to lose not because they’re smarter but because they have a better work ethic. But here’s the thing: if you study successful people across a lot of fields, we think it’s wonderful when an athlete practices 12 hours a day or when an artist works obsessively on their craft. Nobody says Jordan didn’t have work-life balance. We just don’t extend the same logic to building a company. If those founders love what they’re doing that much, and they feel like this is the moment to go hard, that’s actually precisely the point of the book: find the thing that makes you feel that way.
You talk about mentorship in the book. What makes a great mentor relationship and how do people find one?
Advertisement
The number one thing is to get out of your head this ideal that gets passed around in the self-help world: ‘go get a mentor,’ and everyone runs out and cold calls someone that’s ridiculously too high and unachievable, and it doesn’t work. For all those people that are really out of reach right now, I call them aspirational mentors — create a persona of them, just like I was talking about with the dream job folder. Get clips of all the books they’ve written, podcasts they’ve done, interviews they’ve done, and study them. You can learn a lot from people without talking to them directly, especially in the modern age. And then for your real mentors, go two levels down from where you thought you were going to aim. Discover somebody — tools like LinkedIn make this so easy — and be the first person to ever call them and ask them to be a mentor, because they’ll be flattered. They’ll be flattered that you knew who they were. Imagine anyone getting their first call to be a mentor. It’s a great feeling. You’re going to have way more success with that interaction than shooting too high.
I’ll tell you a funny story: I started getting so many calls from people who wanted to break into venture that I wrote a three-page PDF called “So You Want to Be a VC,” and hidden in the third page was basically — go do X, go do Y, go do Z, come back and tell me how that went. The number of people that actually ended up talking to me after getting that document was a fraction of the number I sent it to. It’s funny how much it thinned when you gave them a little homework to do.
You started working on this book before the impacts of AI became clearer. Does that at all change how people should think about their careers?
If you’re following the traditional path — going through the career center at your university, signing up on a list, waiting for a recruiter to sit through 30 people in 20-minute slots — you look like a cog. You look mass-produced. For that group, AI looks frightening, and maybe it should. But if you are blazing your own trail, using the techniques in the book, becoming what I call a candidate of one — someone whose path looks completely unique because you’ve built it intentionally — then every tool in this book is amplified by AI. Learning has never been easier than right now, in the entire history of the world. If you’re running toward it, if you’re becoming the most AI-aware person in your field, this thing is nothing but a superpower.
Asus and Acer enthusiasts in Germany are frustrated after being cut off from support for their high-end systems. Tom’s Hardware reports that the companies’ German sites no longer serve product pages, downloads, or support content. Read Entire Article Source link
Apple is gearing up for one of its most packed launch cycles in years, with five new products set to debut in the days leading up to the company’s March 4 “Apple Experience” event. The information comes from Mark Gurman’s latest Power On newsletter for Bloomberg, which outlines Apple’s multi-day rollout strategy and its broader push across Macs, iPhones and iPads.
Major lineup incoming
According to Gurman, Apple plans to reveal a new low-cost MacBook, updated MacBook Air and MacBook Pro models, a refreshed iPhone 17e, and at least one new iPad between March 2 and March 4. This staggered set of announcements marks a shift from Apple’s usual single-keynote approach, highlighting a more global, experiential strategy.
The March 4 event itself will take place simultaneously in New York, London, and Shanghai, with hands-on sessions expected to play a bigger role than traditional stage presentations.
Gurman notes that the centerpiece of this wave is the low-cost MacBook
This has been designed to compete directly with entry-level Windows laptops and Chromebooks. Instead of using an M-series chip, the device is expected to run on the A18 Pro, the same processor class used in iPhones – a move that allows Apple to drive down cost while keeping performance competitive.
Advertisement
At the same time, the refreshed MacBook Air and Pro models will continue Apple’s premium performance push, likely using the newest generation of its M-series chips. This positions Apple to hit both ends of the market: affordability for casual and education-sector users, and high-end options for creators and professionals.
For buyers, this rapid-fire launch cycle signals a major refresh window
Anyone considering upgrades across the Mac, iPhone or iPad lineup may benefit from waiting until the rollout is complete. Gurman’s reporting suggests the low-cost MacBook could become one of Apple’s most important products of 2026, potentially reshaping the laptop landscape by offering a full macOS experience at a lower entry point.
Meanwhile, the iPhone 17e and new iPads could help Apple strengthen its mid-range offerings, an increasingly competitive segment in global markets.
Broader strategic context
Though the March 4 event won’t focus on wearables, Gurman writes that Apple’s longer-term roadmap includes a significant push into AI-driven wearables and visual intelligence. This aligns with CEO Tim Cook’s recent hints that AI-first hardware will define Apple’s next decade. The company is accelerating development of smart glasses and next-generation wearables that integrate deeply with Apple Intelligence software.
Advertisement
What’s next
The next two weeks are expected to deliver a steady stream of announcements, culminating in Apple’s global showcase. Analysts will be watching closely for pricing, performance claims and how Apple positions the low-cost MacBook against the broader market. As Gurman emphasizes, this rollout marks the start of a transformative year for Apple, blending aggressive hardware refreshes with a growing shift toward AI-centric product design.
Although Mojang has not provided a precise timeline for transitioning Minecraft to Vulkan, players and modders can begin testing the new renderer in Java Edition in the coming months. To ensure a smooth transition for Java Minecraft’s robust modding community, the company will initially release updates on OpenGL and Vulkan,… Read Entire Article Source link
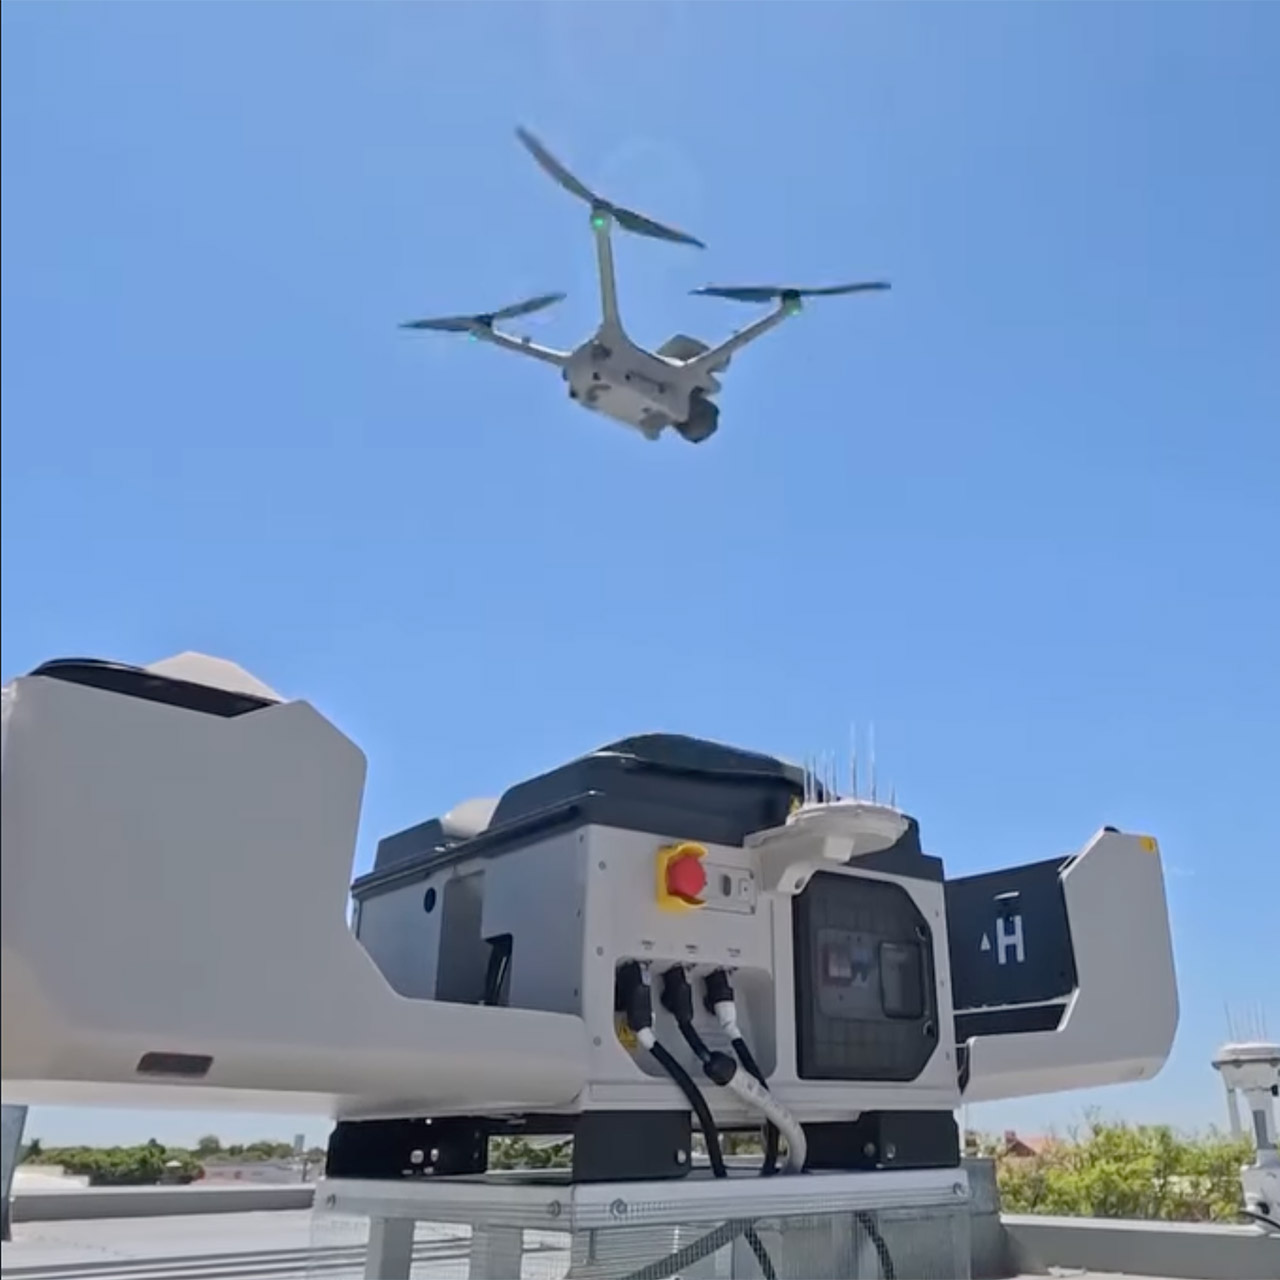
Moree, in the northwest of New South Wales, has become a trial ground for something new in Australian policing. There are now two drones sitting atop the local police station, ready to take flight at a moment’s notice, but there is a catch: they are being guided by pilots hundreds of kilometers away in Sydney. This marks the start of PolAir-rural, a six-month experiment that will discreetly alter the way police manage crime in rural areas.
Moree is almost 600 kilometers from Sydney and is a tiny regional hub of around 7100 people. It has a rather high prevalence of property crime, theft, and break-ins. The police picked Moree because, bluntly, locals were fed up with all of the crime, and traditional techniques were frequently falling short due to the distance from Sydney and limited resources. By January 2026, the first drones had arrived, and what a sight they were, mounted in a self-contained box on the station’s roof. They launch, fly, land, and recharge without assistance from anyone on-site.
Due to platform compatibility issue, the DJI Fly app has been removed from Google Play. DJI Neo must be activated in the DJI Fly App, to ensure a…
Lightweight and Regulation Friendly – At just 135g, this drone with camera for adults 4K may be even lighter than your phone and does not require FAA…
Palm Takeoff & Landing, Go Controller-Free [1] – Neo takes off from your hand with just a push of a button. The safe and easy operation of this drone…
The control room is located in Bankstown, and the pilots can view live video footage of where the drones are. The NSW police are thrilled to announce that this is the first time this has been done in Australia, and no operator is needed on site, as all of this is being done from a remote location hundreds of kilometers away. They are using DJI Matrice 4-TD drones equipped with cameras that transmit clear footage to the officers on site and in the control room.
Advertisement
These are only deployed when something serious is happening, like when there is a break-in and they can be deployed upwards to get a bird’s eye view of what is happening. They can also track stolen cars from the air, which helps in the recovery of the cars without the dangers involved in high-speed chases. Already, the system has been used to locate a few of stolen automobiles, including one stolen from a motel and driven away in the owner’s SUV. The drone was able to find the abandoned automobile near a river. When a bunch of criminals stole not one, but two cars from an old couple’s home, the police deployed the drone to provide overhead support, and days later they were able to retrieve both vehicles and arrest the perpetrators.
They’ve even been used in fires, detecting blazes throughout the town and sending out timely alerts to firemen who can go in and extinguish them before spreading. They’ve also been utilized in several assaults and other disruptions. In the month after the system was launched on January 8, the drones have been used to respond to several reports, including at least two stolen vehicles, with positive results. Deputy Commissioner Paul Pisanos says so far so good, and he credits the pilot with providing regional officers with more operational support.
The Police Commissioner, Mal Lanyon, and the Police Minister, Yasmin Catley, have made it plain that these drones will only be used in emergency situations, not for regular surveillance. They won’t be flying over backyards seeking for nothing in particular. Lanyon stated unequivocally that the purpose is to achieve some action quickly in response to a crime, not to monitor everything. The drones operate in the same way that police helicopters and planes have for years, but at a fraction of the cost, just $100,000 for the experiment versus thousands per hour to fly a manned aircraft. [Source]
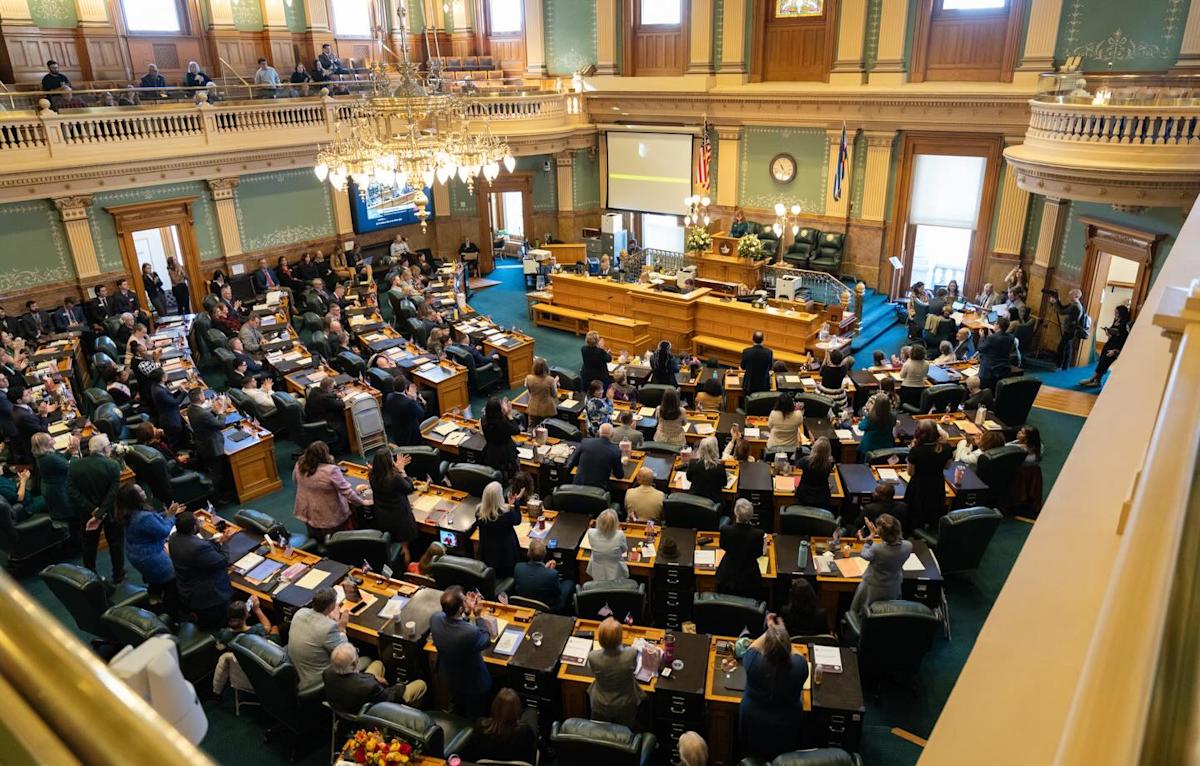
A collective of Colorado lawmakers wants to put an end to “ghost guns” and their rising popularity. Earlier this week, the state’s House Judiciary Committee voted in a 7-4 majority to pass the bill, HB26-1144, along for a decision with the full House of Representatives. The proposed law would “prohibit the use of a three-dimensional printer, or similar technology, to make a firearm or a firearm component.”
Ghost guns are typically made from 3D printers or similar machines without serial numbers, making them virtually impossible to trace and allowing users to skirt the federal requirements for purchasing a firearm. While the bill targets using a 3D printer to make guns, large-capacity magazines and other related components, it even bans possessing and distributing the instructions to manufacture guns in this way. However, these rules would be exempt for federally licensed firearm manufacturers.
“These ghost guns are increasingly found at crime scenes, making it harder for law enforcement to track down a suspect because the gun isn’t traceable,” the bill’s sponsor, Lindsay Gilchrist, said in a press release.
Prior to this proposal, Colorado passed a law in 2023 that banned owning ghost guns or making frames for them. While SB23-279 laid the groundwork, HB26-1144 can be seen as the next step since it’s much more encompassing by targeting ghost guns even before they’re made. According to the bill, first-time violations will be treated as a misdemeanor, while repeat offenses will be upgraded to a felony charge. Looking ahead, HB26-1144 still has to secure a vote from both the Colorado Senate and House of Representatives before being delivered to the governor to be signed into law.
Those seemingly unconnected headlines suggest a media landscape in the midst of transformative change, as popular YouTubers look to diversify their business models, with the threat and promise of increasingly powerful generative AI tools on the horizon.
On the latest episode of TechCrunch’s Equity podcast, Kirsten Korosec, Rebecca Bellan, and I debated what’s next for the creator economy, and whether there will be any room for the next generation of creators to stand out.
Advertisement
“What’s the next saturation point?” Kirsten wondered. “Not all of these folks can go out and spin off products. So then does the pool of successful creators just simply get smaller? Or will something else happen, technologically speaking, or a different medium that will allow them to find an audience to make money off of?”
You can read a preview of our conversation, edited for length and clarity, below.
Anthony: [The news] led our colleague Lauren to do this great piece talking about the creator business model in general, and this sense that they aren’t just relying on ad revenue anymore. I think it’s still a pretty big part of their business, but she broke down a number of the most popular YouTubers and noted that each of them is expanding — usually into e-commerce, but also into other revenue streams.
Mr. Beast, for example, actually has this line of food products, including chocolate, that is making hundreds of millions of dollars and it was actually profitable for him in 2024, whereas his media business was losing money. All that was pretty wild to me.
Advertisement
Techcrunch event
Boston, MA | June 9, 2026
Advertisement
Kirsten: If Mr. Beast can’t be profitable with his media company, who can? To me, that was a stunning stat.
I am not surprised that the whole ad revenue biz game is not working out necessarily for creators and influencers because it’s just reached a saturation point. I guess my big question is, what’s the next saturation point? Not all of these folks can go out and spin off products. So then does the pool of successful creators just simply get smaller? Or will something else happen, technologically speaking, or a different medium that will allow them to find an audience to make money off of?
Rebecca: It’s interesting, there’s a lot of ways you can think about what else could happen, right? Maybe they’ll create digital twins of themselves and put their digital twins into a bunch of different situations that can make them [other kinds of] money.
But again, going back to this not being surprising, these people are now celebrities, right? Someone told me on the phone recently that a lot of [the] younger generation, they don’t know our celebrities, they know TikTok celebrities. And we’ve seen celebrities for years pass off products and make money off of them, right? I used to watch Rachel [Ray], she was a celebrity chef and she sold her EVOO or her olive oil.
Advertisement
We Slow Ventures on [Equity] sometime last year. They have a creator fund and basically what they’re doing is they’ve raised a VC fund to essentially back creators with their businesses, if they have maybe a niche following, maybe they’re really into woodworking and here’s their collection of chisels, I don’t know.
I think it’s an interesting path forward and it’s something that we see as journalists: How do we also try to be creators and make a brand of ourselves that we could diversify our revenue. It sounds horrible to say it out loud like that.
Anthony: I’m smiling, but it’s the smile of somebody whose soul is slowly turning into ash inside.
So we took a break from talking about AI, but I will obligatorily bring AI back into the conversation. Obviously one of the other related developments over the past week or so is that ByteDance, which is the Chinese company that launched TikTok and is still an investor — we won’t get into all of that — they launched a new version of their model, Seedance 2.0, which at least initially was primarily only available to Chinese users.
Advertisement
But you started to see people posting videos generated by Seedance, including this viral video of Brad Pitt fighting Tom Cruise. That prompted both this general conversation of: Is Hollywood doomed? And then more concretely, a bunch of Hollywood studios, including Netflix, sending ByteDance letters being like, “You cannot do this, you’re basically allowing all your users to generate videos using all of our IP, all of our movie stars.” And for a couple of days, there was no response at all from ByteDance, but then they did say, “Sorry, sorry, sorry, for some reason we launched this without any real guardrails, but we’re gonna do better in the future.”
Kirsten: So the timing of this is just perfect because I happen to be editing a story right now that Rebecca wrote. It has nothing to do with Seedance, but it does have to do with AI and filmmaking. So I’m going to give a future ]rops to Rebecca for being timely about that. Rebecca, I know you have a lot to say on that, besides that Hollywood is upset. Is it more complicated than that?
Rebecca: Yeah, definitely. I mean, tying this back to the creators thing, I think that a lot of people are going to be using these tools to produce all kinds of content and we’re just going to be absolutely flooded. And that’s going to be intense.
But when we talk about, whether it’s creating films or ads or just content in general using AI video tools, I think there’s this tension between one, this is going to produce a whole lot of low effort slop versus two, it could also democratize access for a lot of people who don’t have funds or budgets or teams to share a lot of the stories that they want to tell.
Advertisement
And also, if you’re a small business and you want to create a little shampoo ad — to be on the nose about it, because there’s a shampoo ad that’s going viral — or you sell coffee and you want to make a little ad for it, [this] could give you the tools to do that. Is that a bad thing? Is it not a bad thing? Do we need more content in the world? There’s a few avenues to walk down.
Kirsten: Is it a bad thing, Anthony?
Anthony: In terms of the creator side of it, my general feeling is [that] the response to a lot of this kind of slop — frankly, a lot of it is slop, and I think that’s going to continue to be the case — is going to be this valuing of authenticity. And so there is the opportunity for these big creators is be less about the idea of like, “I have digital twins of myself,” but [instead,] “No, I’m the real Mr. Beast, not the digital simulacra wandering around.”
And I think it’s also telling that – of course, every social network has ups and downs, but that OpenAI’s Sora, from what I understand, had skyrocketed at the beginning and then has been struggling to hold on to users more recently, because there is a certain emptiness to the experience when you just feel like there’s not an authentic human being on the other side.
Advertisement
But I think it’s also going to make the landscape much more challenging, both for the established creators to monetize […] and then I think it’s going to be especially hard for new creators because there’s just going to be so much more stuff. Trying to actually break out is going to become super difficult.
Battery life is excellent—lasting about two weeks per charge in our tests—and unlike Oral-B, the 4100 shuts off after the two-minute timer. It’s also designed with BrushSync technology, which tracks how long you’ve been using your brush head and how much pressure you’re applying. A light on the handle and a beep remind you when it’s time for a replacement—a thoughtful touch.
Unlike the Oral-B brush’s standard black and white, the Sonicare 4100 also comes in pink, azure blue, and dark forest green, which might not seem like much, but even the smallest pop of color can make a mundane task feel a little less … mundane.
Best Oscillating
WIRED
High-power motor
Built-in 2-minute timer with quadrant pulses
Small round brush head to reach molars
Durable build
TIRED
Shorter battery life than its competitors
Can feel intense
The Oral-B Pro 1000 has been around since 2012, outlasting and outperforming flashier models because it’s powerful and priced right. The high-power motor stays focused on your teeth, so you won’t feel that hand-numbing vibration along the handle. If you’re switching from a manual toothbrush, the intensity might be startling initially, but you’ll adjust.
With just one button and three brushing modes (Daily Clean, Whiten, and Sensitive), the Pro 1000 keeps it simple. A built-in timer pulses every 30 seconds to remind you to move to another quadrant of your mouth, with a triple pulse at the two-minute mark. Unlike some competitors, it won’t shut off automatically, which is handy if you like to keep brushing. Oral-B says the battery lasts about a week, but we squeezed out 10 days in testing. That’s decent, though not as long as some other models.
Advertisement
Like all of Oral-B’s electric brushes, the Pro 1000 uses an oscillating brush head, which is a small, circular design that gets between teeth more effectively than larger oval-shaped bristles. Round brush heads tend to be easier to maneuver for those with smaller jaws, and they reach the back of the farthest molars. Though we haven’t tried all of them, most Pro models are a good bet.