

Crypto World
Crypto prices today (Feb. 23): SOL, HYPE, ZEC decline sharply as BTC falls below $65K


Crypto prices today fell as Bitcoin dropped below $65,000 and altcoins posted steeper losses amid rising tariff uncertainty. The crypto market opened the week under pressure. Total market capitalization fell 4.2% in the past 24 hours to $2.3 trillion. Bitcoin…

I entered the crypto market at a time when Bitcoin traded around $6,000 — yes, that long ago. Back then, it existed in a no man’s land between experimentation and finance, and the market reacted to headlines or influential voices in a knee-jerk manner.
That wasn’t just my impression. Years later, a study analyzing Bitcoin and Dogecoin during the 2020–2021 cycle found statistically significant increases in price and trading volume on days when Musk posted about cryptocurrencies. The effect was especially pronounced for Dogecoin, whose volatility response was more than ten times stronger than that of Bitcoin.
Fast forward to today, and something feels different. Big news still happens. Prices still rise and fall. But the way the market responds has clearly changed. Below, I try to break down what’s actually different.
Headlines Used to Be the Market
Earlier crypto cycles were defined by immediacy. Liquidity was thinner, derivatives were far less dominant in price discovery, and positioning was far more visible in spot markets. As a result, price action clustered tightly around the moment news broke.
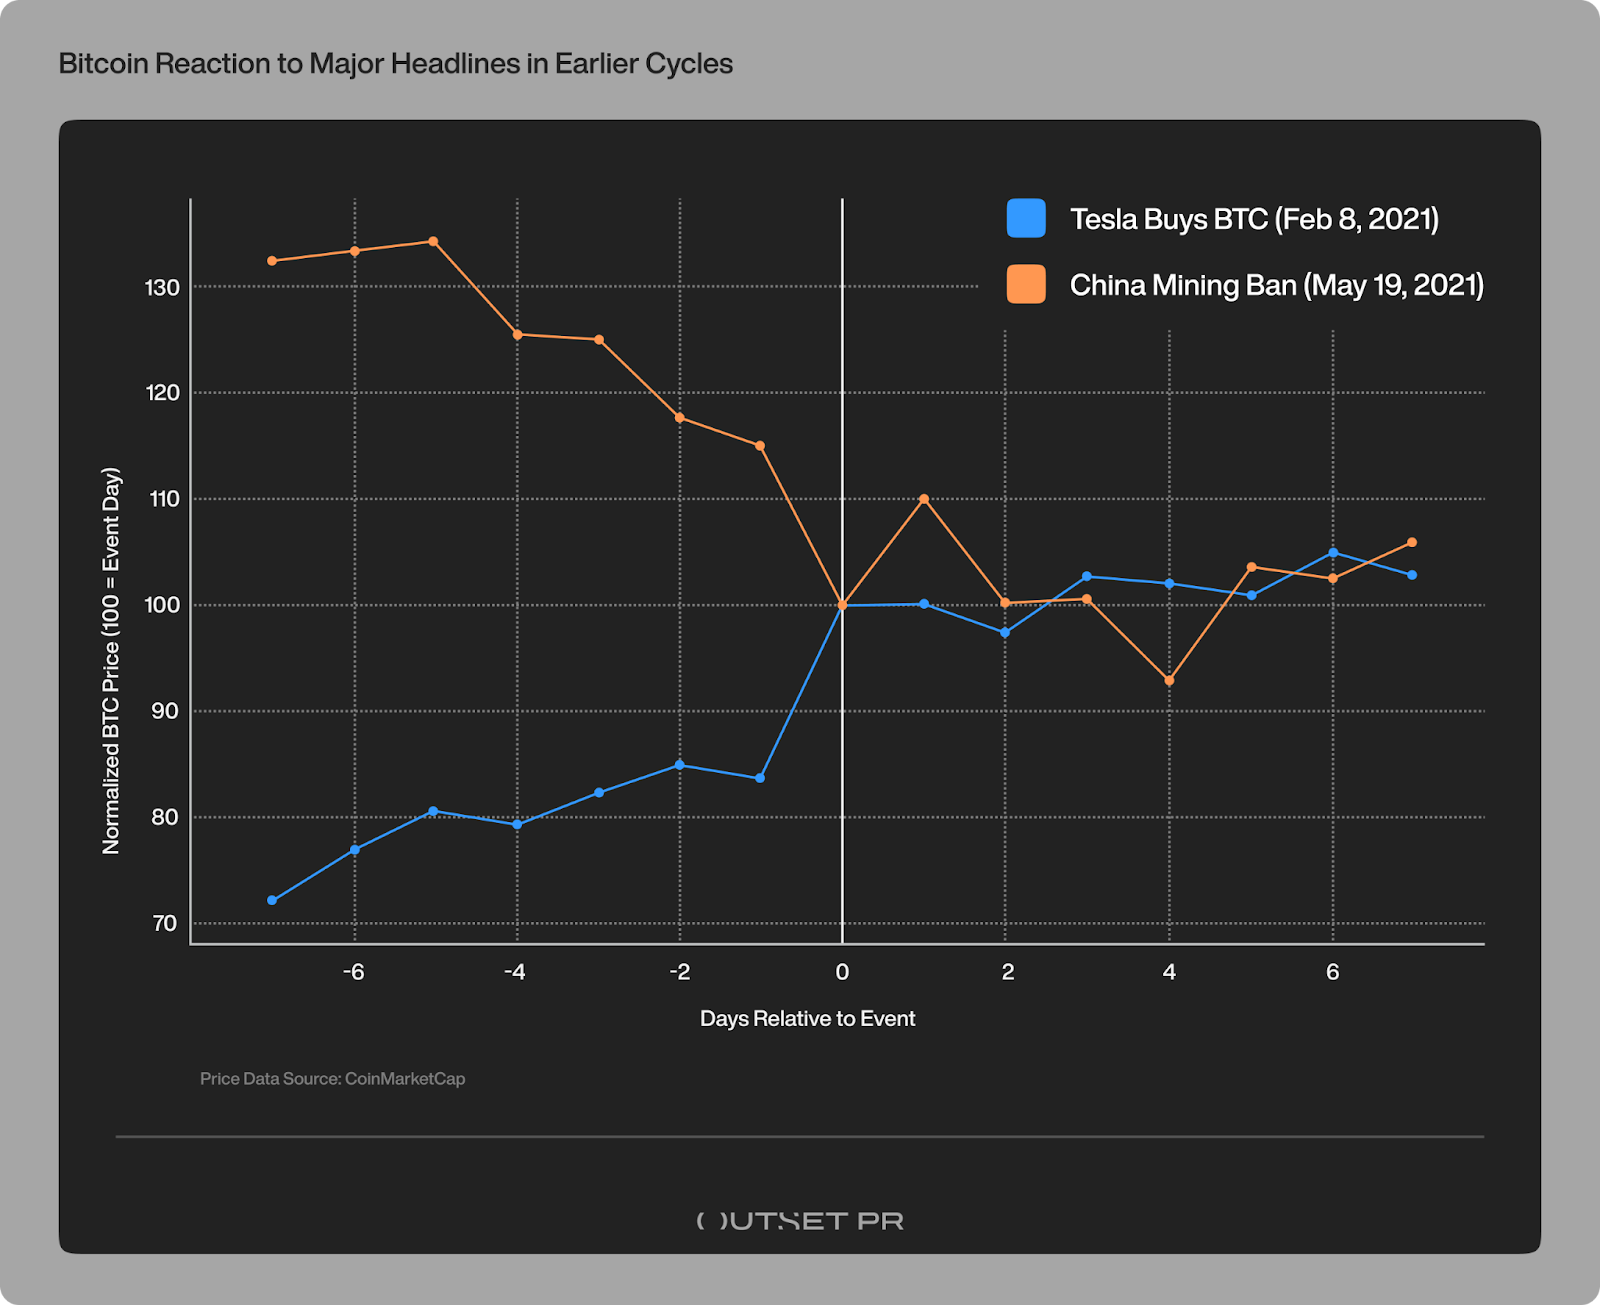
To assess whether Bitcoin’s reactions to news were immediate or gradual, I compared price behavior around major headlines across different market cycles. I selected two high-impact events from earlier cycles and two events of comparable significance from the post-2024 halving period. For each case, I tracked price movements before and after the news and normalized the data to focus on reaction patterns rather than absolute price levels.
In February 2021, Tesla disclosed that it had purchased $1.5 billion worth of Bitcoin, which was trading around $38,000. Within hours of the announcement, the price surged more than 15% in a single session to the level above $44,000. There was little ambiguity in how the market interpreted the news. The headline itself was the catalyst.
The same dynamic worked in reverse just a few months later. In May 2021, as China intensified its crackdown on Bitcoin mining, Bitcoin fell from roughly $40,000 to near $30,000 in a matter of days. Headlines triggered panic selling, forced liquidations, and cascading declines that felt sudden and overwhelming. Price didn’t drift lower — it collapsed.
In those markets, volatility wasn’t an exception. It was the baseline.

How the Current Cycle Handles Big News
Can we say Bitcoin no longer reacts to news? Not exactly. But the way it reacts has clearly changed.
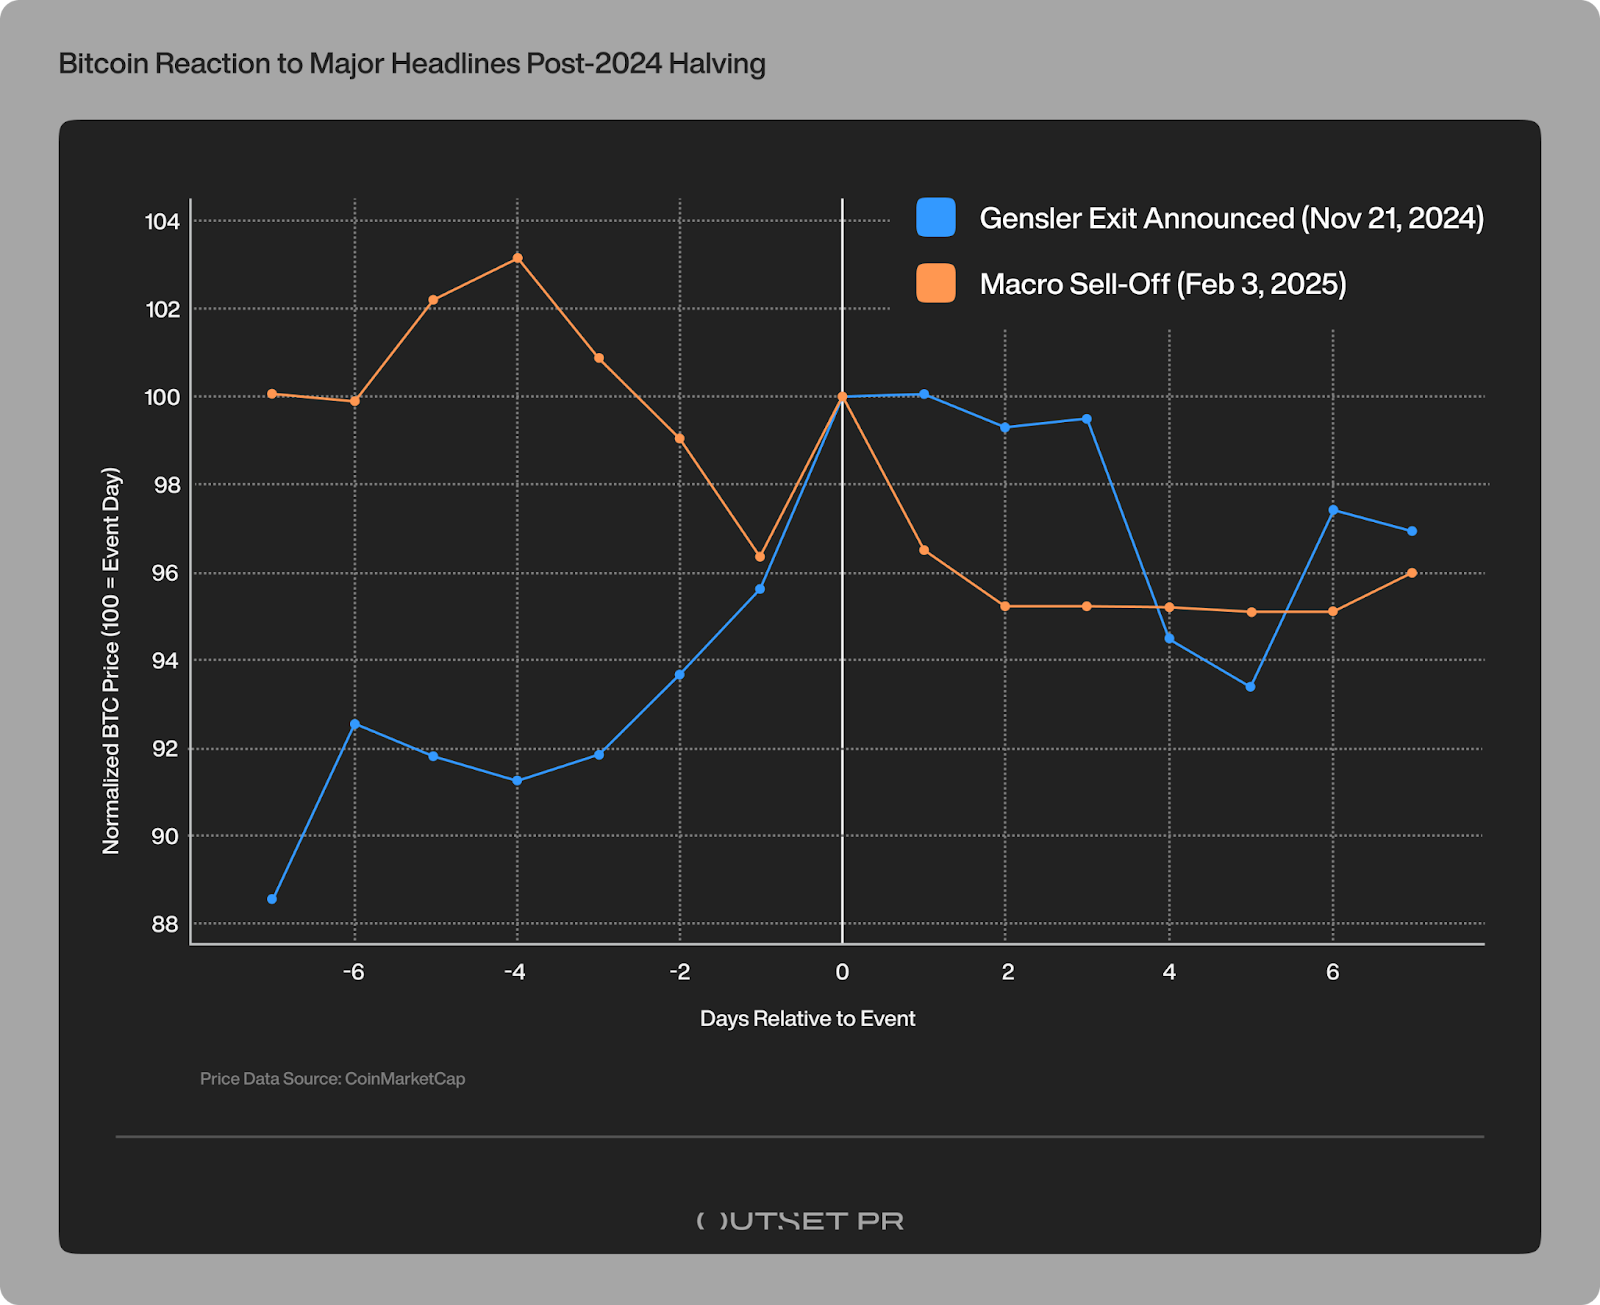
Take the regulatory shift surrounding Gary Gensler’s departure as Chair of the U.S. Securities and Exchange Commission — widely viewed as a meaningful inflection point for the crypto industry.
In November 2024, when news of his impending exit became public, Bitcoin was trading in the mid-$80,000s. Over the following weeks, price pushed higher to the $100,000 level. But the move unfolded gradually, with much of the appreciation taking place before the leadership change became official in January 2025.
There was neither a single breakout candle, nor sudden repricing at the moment of confirmation. Instead, the market embraced the development as part of a broader, already-expected regulatory shift.
A similar pattern emerged during the February 2025 macro-driven sell-off. As U.S. tariff announcements and rising global risk pushed markets into a risk-off mode, Bitcoin slipped from just above $100,000 to the mid-$90,000s. The decline was real, but measured and spread over several sessions rather than concentrated in a single shock. Unlike the China ban in 2021, there was no panic cascade and no sense of structural failure.Price fell, but it did so calmly.
Volatility Spread Out Over Time
The contrast is telling. In 2021, major headlines produced immediate double-digit moves jostled around the news itself. In the current cycle, developments of similar importance have resulted in multi-day trends, with price often moving ahead of official announcements.
Bitcoin didn’t stop rising and falling. The charts point to a different shape of volatility — with smoother price moves and fewer headline-driven extremes. Market reactions no longer reflect that wide-eyed, hair-scratching surprise, but are increasingly driven by positioning, liquidity, and expectations.
In short, Bitcoin didn’t stop reacting — it stopped overreacting.
Where the Reaction Went
Much of the current market’s adjustment happens away from the visible spot price. Large players now use futures and options to build and hedge exposure. Capital flows in and out via spot Bitcoin ETFs, while big trades move through OTC desks rather than hitting the spot market right away. Together, these channels mute the black-and-white reactions that once defined earlier crypto cycles.
Large players and whales are still there, but their influence no longer reveals itself through obvious spot-market shocks. They can reposition quietly, change exposure without immediately forcing price to respond.
It feels like the market has finally buried its emotional, headline-driven reactions in the past and matured toward a quieter process of repricing risk.
This shift is unfolding against a very different macro backdrop: tighter global liquidity, fewer expectations of automatic bailouts, and monetary policy focused on restraint rather than stimulus. Bitcoin, increasingly treated as a macro asset and accessed through regulated channels like ETFs, now responds more to liquidity conditions and capital flows than to isolated news events.
If you’re still expecting every major headline to trigger an instant breakout or crash, the market can feel broken. Step back, though, and a different picture emerges — one where the noise hasn’t vanished, but it no longer leads the story. What remains is a market learning to price risk with patience.

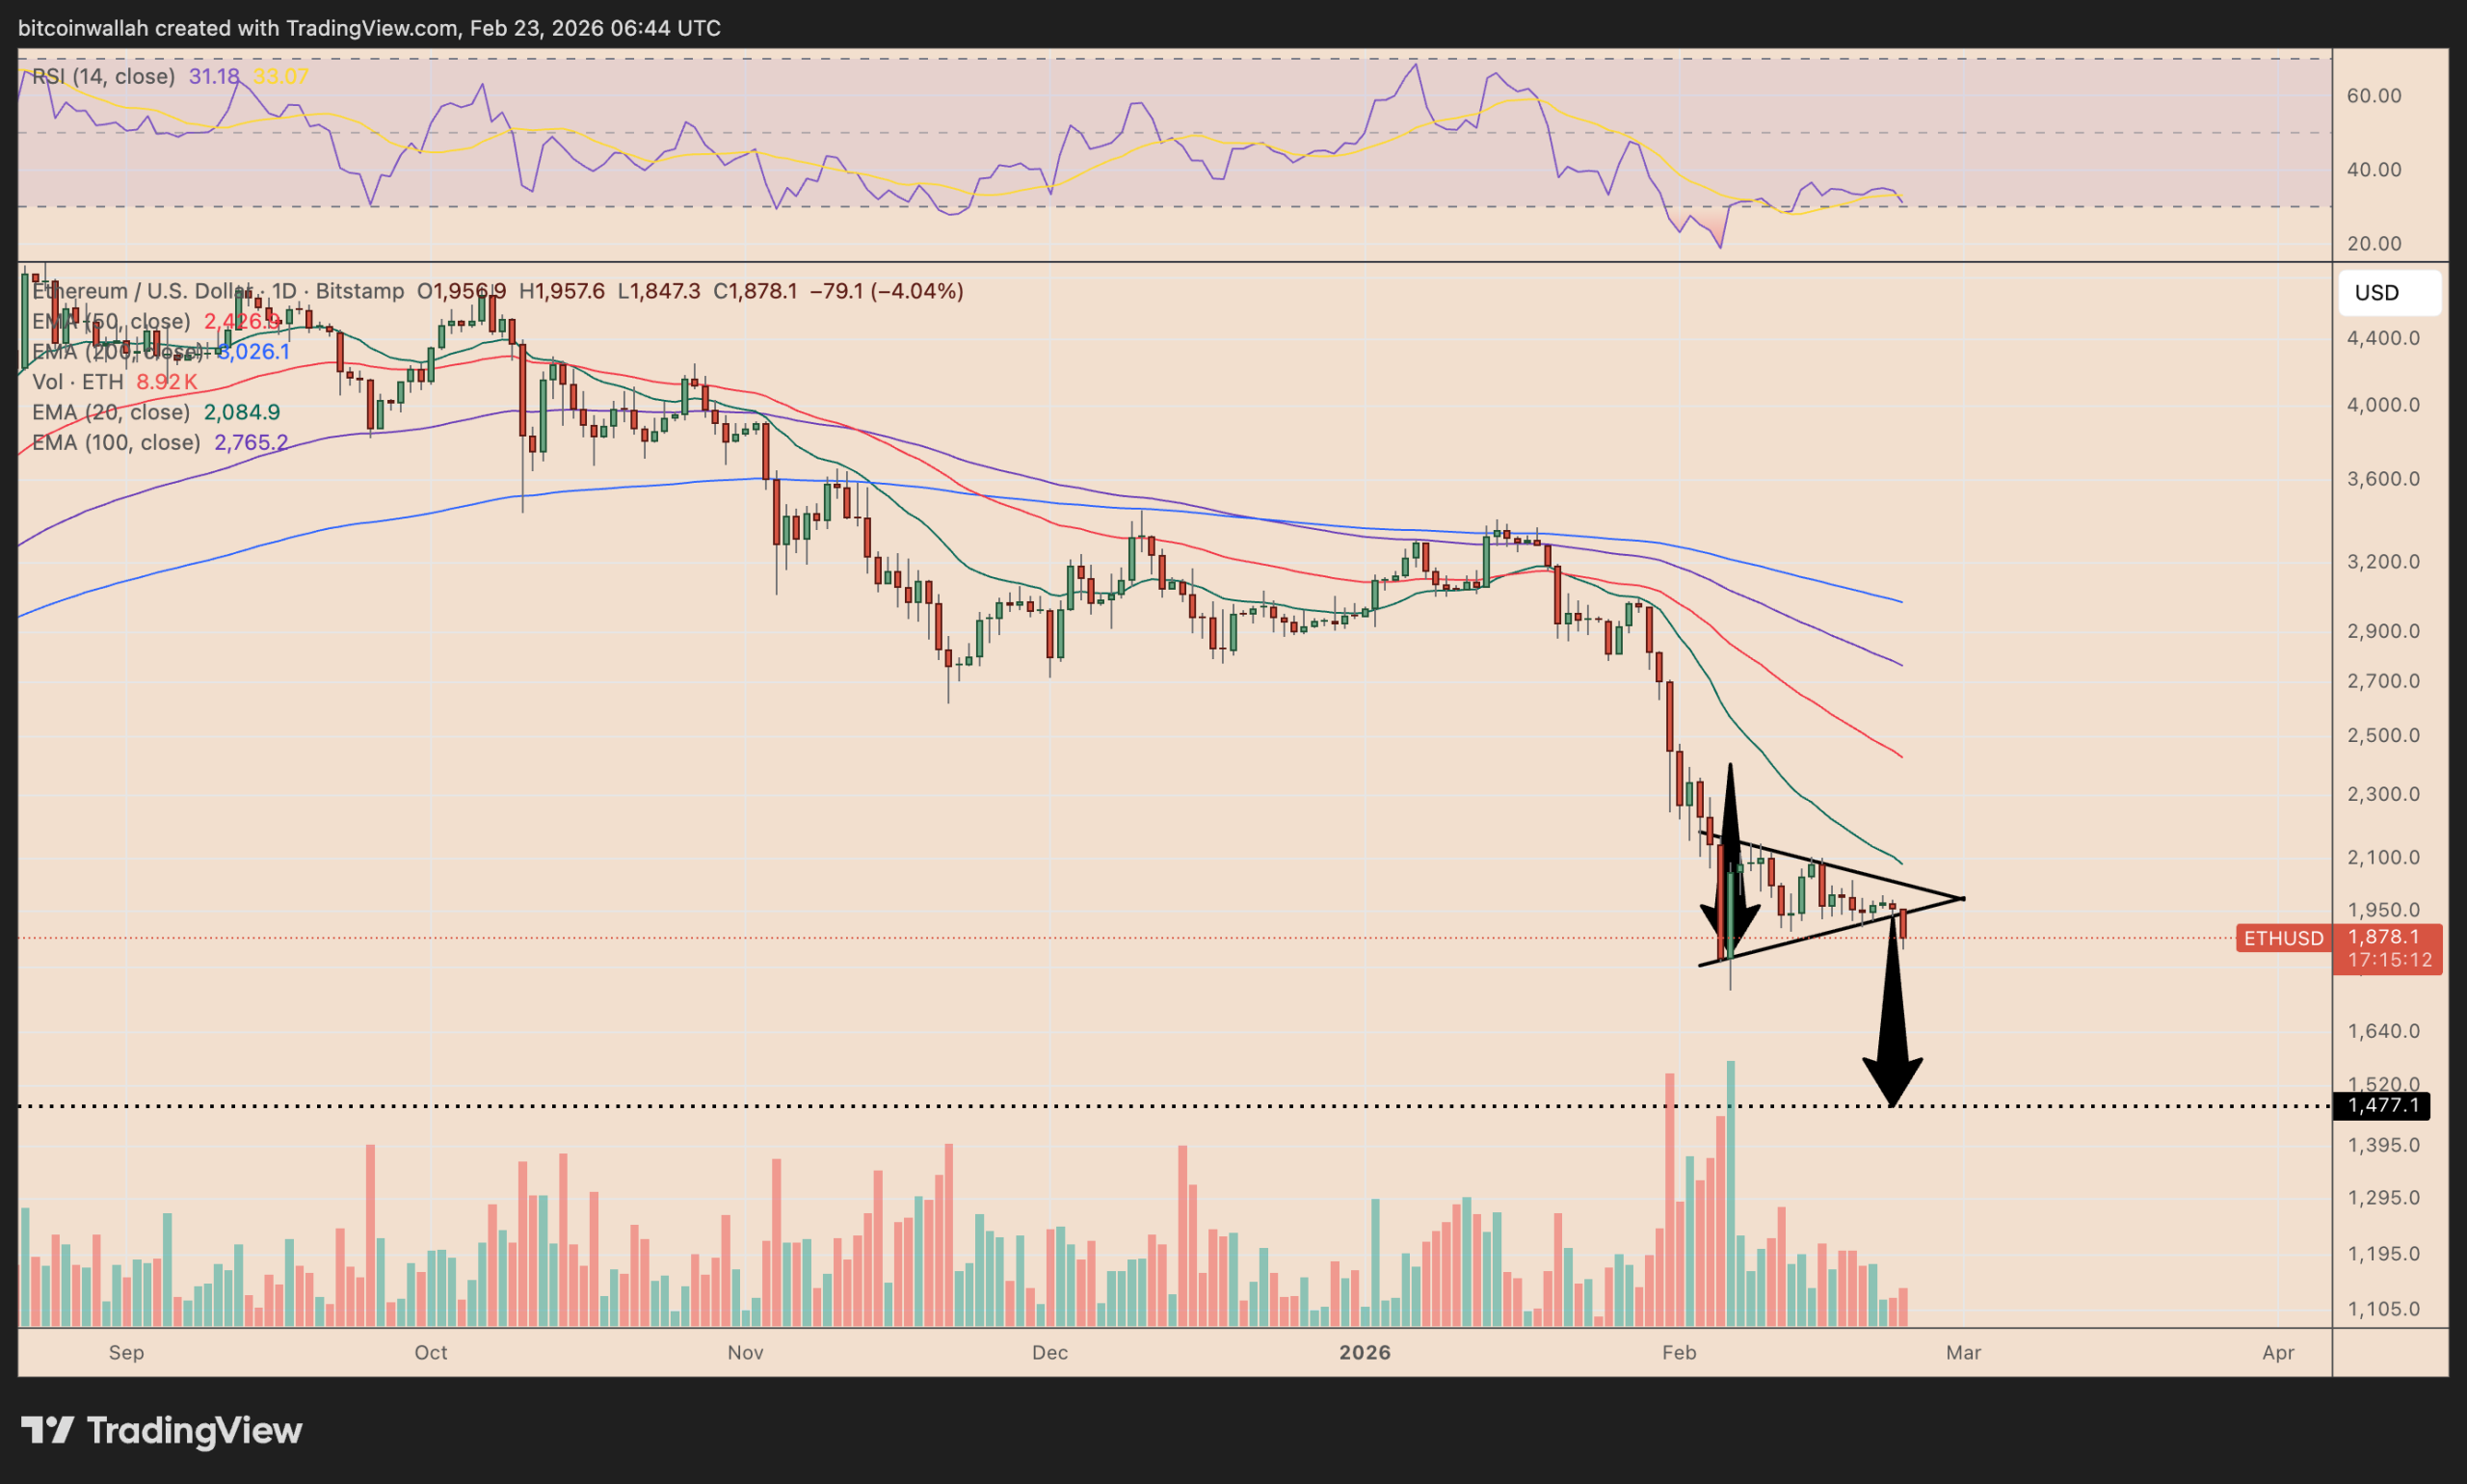
Ethereum’s Ether (CRYPTO: ETH) is facing a pivotal moment as it tests the $1,500 psychological level, with technical patterns suggesting a potential continuation to the downside. A bear pennant breakdown has emerged, supported by rising volume and a shift in risk sentiment that has weighed on the broader crypto market. Monday’s session saw ETH slide sharply, dipping to around $1,850 amid nerves around tariffs and macro headwinds. If the breakdown persists, traders expect the price to retrace toward $1,475 by late February or early March, aligning with the measured move implied by the pattern. Bulls will need to reclaim key support to alter the trajectory.
Key takeaways
- Ethereum is in the breakdown phase of a bear pennant, signaling potential further weakness.
- The chart-based downside target sits near $1,475, likely by late February or early March if current dynamics hold.
- The move was accompanied by rising volumes, indicating conviction behind the breakout from the pennant’s lower boundary.
- Vitalik Buterin’s ongoing ETH sales plans add a supply-side headwind, with roughly 9,000 ETH sold since early February and a 3,500 ETH withdrawal from Aave noted on-chain.
- February’s ETH price decline of about 18.5% aligns with the distribution activity cited in on-chain trackers.
- Historically, founder-led transfers have coincided with pronounced price moves, underscoring the potential impact of large.
Tickers mentioned: $ETH
Sentiment: Bearish
Price impact: Negative. The breakdown美元 appears to be extending ETH’s downside trajectory and testing key support at $1,500.
Market context: The current wave sits within a broader crypto risk-off environment, where de-risking and macro headwinds shape near-term price action and liquidity across altcoins.
Market context: The move sits within a broader de-risking mood across crypto markets, where macro volatility and on-chain activity around founder distributions shape near-term price dynamics.
Why it matters
The technical setup around ETH points to a larger narrative about how chart patterns interact with market psychology and on-chain flows. A breach of the pennant’s lower boundary, when accompanied by higher volume, often signals that selling pressure is prevailing and could lead to a measured move down to the pennant’s projected target. If ETH cannot defend the $1,500 zone, traders may push the road map toward $1,475, a level that marks a critical psychological barrier as well as a liquidity threshold for a number of market participants.
Beyond chart mechanics, the ongoing cadence of founder-led distributions adds another layer of complexity. Vitalik Buterin’s reported plan to liquidate significant ETH holdings to fund ecosystem work has become a recurring talking point for traders, especially when paired with on-chain data showing sizable sales. While these transfers do not guarantee price outcomes, they contribute to a sense of overhang that can amplify negative sentiment during drawdowns. Historical episodes—such as the May 2021 transfers of tens of thousands of ETH before previous downturns, and the November 2021 move to Kraken that preceded a period of price cooling—highlight how large, scheduled liquidations can sway market mood even when overall fundamentals remain intact.
The intersecting pressures—technical breakdowns, on-chain supply dynamics, and macro risk-off tendencies—mean the market will likely hinge on the next few price ticks. For ETH holders, the key question is whether buyers re-emerge to defend the $1,500 floor and force a reversal, or if sellers maintain zone control and push toward the lower pennant target. The presence of a nearby 20-day exponential moving average around $2,085 also gives bulls a potential benchmark to reclaim should a relief rally materialize, potentially invalidating the bearish scenario if crossed with momentum.
For additional context on chart patterns and the potential for sub-$2,000 ETH scenarios, readers can review related analysis that outlines classic patterns suggesting more downside risk for ETH in the near term.
The broader market backdrop remains intricate. A sustained risk-off environment can amplify the impact of on-chain activity like founder sales, while a shift in macro rhetoric or renewed appetite for risk could flip sentiment and alter the short-term trajectory for ETH and other major altcoins. As traders weigh these factors, the next few weeks will be pivotal in determining whether the price stabilizes above critical supports or tests lower targets outlined by the pennant framework.
What to watch next
- Observe ETH price action when approaching $1,500: does it hold as support or break lower?
- Monitor any further ETH distributions from Kanro and related wallets, and whether remaining holdings (~7,350 ETH) are scheduled for sale.
- Track on-chain activity from Arkham Intelligence and Lookonchain for changes in sell tempo and new large transfers.
- Watch the price reaction relative to the 20-day EMA near $2,085 as a potential bullish trigger if crossed with volume.
- Assess broader macro signals and ETF/derivative flows that could influence risk sentiment in the coming weeks.
Sources & verification
- Vitalik Buterin’s Jan. 30 statement about selling 16,384 ETH via Kanro to fund ecosystem work.
- Arkham Intelligence on-chain tracking of approximately 9,000 ETH sold since early February and a 3,500 ETH withdrawal from Aave.
- Lookonchain commentary noting accelerated ETH sales in February.
- Historical references to May 2021 and Nov. 2021 large ETH transfers and subsequent price movements.
- Related analysis: Ethereum price chart patterns indicating sub-$2K scenarios.
ETH bears eyes sub-$1,500 test as pennant breakdown deepens
Ethereum’s Ether (CRYPTO: ETH) remains in focus as the coin tests a critical support band near $1,500, with a bear pennant breakdown shaping the near-term risk-reward. A fresh wave of selling pressure emerged after the price slipped to around $1,850 amid tariff-related jitters and a broader de-risking environment. The breakdown has been underscored by rising trading volumes, suggesting that market participants are stepping in with conviction behind the move. The immediate downside target—derived from the pennant’s height—points toward roughly $1,475 by late February or early March, a level that also aligns with the psychological trap of the $1,500 mark.
For bulls, the key denominator is not just the price but the dynamics of support and momentum. Reclaiming the pennant’s lower boundary would be a first sign of stability, but a sustained rally above the 20-day exponential moving average, currently near $2,085, would be required to invalidate the bearish outlook. Until such a reversal pattern emerges, the market faces a test of the lower bound, with the pattern’s traditional objective offering a plausible path toward a deeper correction.
On-chain developments have amplified the narrative. Vitalik Buterin has signaled ongoing ETH liquidations to support long-term ecosystem initiatives, with 16,384 ETH slated for withdrawal via Kanro as part of a broader “mild austerity” posture by the Ethereum Foundation. Independent trackers have observed ongoing distributions—roughly 9,000 ETH sold since early February and a notable 3,500 ETH withdrawal from Aave—raising questions about the role of founder-level supply in the current price action. The market should not ignore these signals, especially given the historical context where large, founder-controlled transfers have coincided with meaningful price moves.
Beyond the mechanics of the price chart and on-chain activity, investors should consider the broader ecosystem implications. If ETH continues to see elevated selling from founder addresses, there could be a persistent overhang that slows upside attempts and makes any rebound more fragile. Conversely, any signs of demand returning—whether from improved macro sentiment, higher risk appetite, or supportive on-chain activity—could reawaken buyers and target the key resistance around $2,000 and beyond. The next few weeks will be decisive in determining whether the bears maintain control or a stabilization forms that could reframe Ethereum’s path in the near term.
Related: Ethereum price: Classic chart pattern puts sub-$2K ETH in focus

Strategy founder Micahel Saylor has hinted that the firm may be set to execute its 100th Bitcoin purchase as the flagship crypto continues to sink.
Summary
- Michael Saylor’s “The Orange Century” post signals a potential 100th Bitcoin purchase as Strategy’s total holdings reach 717,131 BTC.
- Bitcoin remains nearly 48% below its $126,080 peak.
- Strategy has continued buying for 12 straight weeks, funded by debt and equity financing.
Saylor shared a cryptic X post on Sunday with the caption “The Orange Century” alongside a screenshot from StrategyTracker, which lists all the previous purchases the company has executed since it began buying Bitcoin in August 2020.
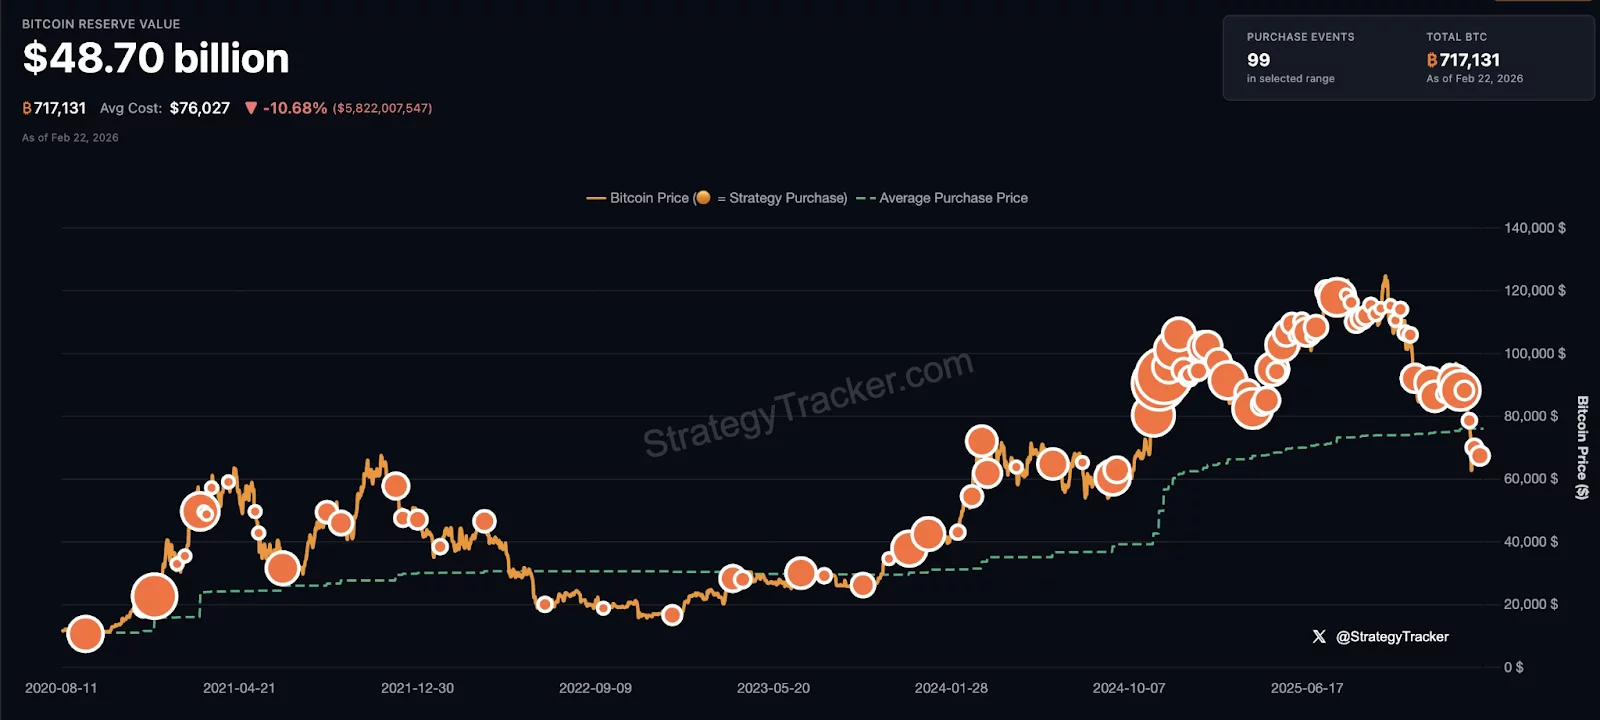
Markets largely view such posts from Saylor as a signal that the company is preparing to announce another Bitcoin purchase, as has been the case on multiple occasions in the past.
To date, Strategy has acquired 717,131 BTC at an average price of $76,027 across 99 Bitcoin purchases, which means it is now gearing up for what would mark its 100th acquisition.
Strategy has continued buying Bitcoin over the past six years, even during periods of extreme volatility. The company views Bitcoin as a long-term inflation hedge and store of value, and Saylor remains characteristically undeterred, continuing to double down on his maximalist conviction despite the latest drawdowns.
Strategy has consistently acquired Bitcoin over the past 12 weeks.
Bitcoin price is down nearly 48% from its all time high of $126,080, but despite the challenging market conditions, Strategy has relied on a complex array of financial maneuvers, including convertible debt and equity offerings, to fund its ongoing Bitcoin accumulation strategy.
Strategy shares, in the meantime, have tested investor conviction and are down over 61% over the past six months. However, it was up nearly 950% since its first purchase buy according to data from Google Finance.
The company’s aggressive Bitcoin treasury model has even sparked concerns that it may face refinancing pressure if Bitcoin price weakness persists. But Saylor has assured investors that the firm could withstand a drawdown to $8,000 per coin without jeopardizing its balance sheet, arguing that Strategy’s leverage remains manageable relative to the size of its Bitcoin holdings.
At press time, Strategy’s total holdings are valued at over $47 billion based on current prices, with paper losses of 13.62%.


The United Arab Emirates has established one of the most defined regulatory frameworks for crypto exchanges. Dubai’s Virtual Assets Regulatory Authority issues licenses, while Abu Dhabi’s Financial Services Regulatory Authority regulates platforms operating in the Abu Dhabi Global Market. The clarity has drawn international platforms seeking formal authorization rather than operating in regulatory gray zones.
Just last week, on February 12, 2026, perpetuals-focused trading platform Flipster joined the growing list, securing in-principle approval from VARA through its local entity, Flipster FZE. It’s the first big regulatory green light for the exchange in the UAE, paving the way for regulated spot trading to start with more products likely to follow once full licensing clears.
BeInCrypto spoke with Benjamin Grolimund, General Manager at Flipster FZE, to dig into the decision: why the UAE became Flipster’s debut regulated market, the internal efforts undertaken to strengthen compliance standards, and what this says about where the competitive landscape for exchanges is heading in 2026.
Building Within a Defined Framework
Securing in-principle approval signals Flipster’s commitment to building a long-term presence in the UAE, according to Grolimund. Indeed, the UAE’s regulatory clarity was central to the decision.
Grolimund sees that rather than responding to crypto reactively, Dubai established a dedicated supervisory authority with defined expectations for operators. He told BeInCrypto:
“The UAE combines regulatory clarity with economic ambition. That clarity matters. Regulatory predictability is a competitive advantage, particularly for an exchange planning long-term expansion.”
Geography also factored into the equation. The UAE connects major financial centers across Asia and Europe, offering exchanges a regulated base from which to serve multiple markets. For a platform expanding beyond one region, that positioning carries operational advantages.
Grolimund added:
“There is also a long-term orientation to how digital infrastructure is being built in the Middle East. Digital assets are part of broader economic diversification efforts, not treated as a passing cycle. That environment supports sustainable growth rather than volatility-driven expansion.”
Institutionalizing Readiness
Progressing from in-principle approval toward full authorization required operational discipline beyond product expansion.
Preparing for supervised activity in the UAE meant formalizing governance structures, refining risk assessment methodologies, and clarifying reporting lines aligned with VARA’s expectations. Monitoring systems were enhanced, onboarding controls strengthened, and accountability mapped across product, engineering, legal, and compliance teams.
“Growth under supervision demands clarity of accountability,” Grolimund said.
In his view, operating in the UAE required embedding regulatory alignment into core processes rather than treating compliance as an external layer. Accountability structures were clarified, risk controls strengthened, and reporting frameworks aligned early in the process.
Flipster has also established a physical presence in Dubai, relocating talent from global offices and hiring locally. The license, he emphasized, is not being treated as a convenience structure.
“Some companies treat licensing as an expansion milestone. We see it as the starting point of building something durable.”
Performance Under Supervision
The in-principle approval allows Flipster FZE to move toward spot trading as its initial licensed activity in the UAE. As regulatory licensing becomes standard among global exchanges, the distinction increasingly lies in how platforms operate once supervision begins.
Flipster built its infrastructure for active traders, prioritizing deep liquidity and efficient execution across perpetual futures markets. Grolimund said entering a regulated jurisdiction does not change that foundation. It raises the standards around it.
“Entering a regulated market does not change our focus on performance,” he said. “It challenges us to maintain speed and product sharpness while operating with stronger governance.”
Rather than treating compliance as a separate layer, he described the objective as integrating governance into the operating core. Matching engines, liquidity systems, and risk controls must function within clearly defined escalation pathways and reporting structures.
“Speed without structure does not last,” Grolimund affirmed.
From Cycles to Structure
Looking at the larger picture, Grolimund said the UAE is expected to serve as a foundational regulated market within Flipster’s broader expansion strategy over the next several years. The immediate priority is progressing from in-principle approval to full authorization and sustaining operations under VARA’s oversight.
The move reflects a broader recalibration across the exchange sector. As structured regulatory regimes expand, licensing is becoming a baseline requirement rather than a differentiator. The distinction may lie in whether platforms can sustain liquidity and execution quality while operating under supervision.
“Our investment in the UAE reflects how we intend to approach every market we enter,” Grolimund said.

Machi Big Brother was also partially wrecked as ETH’s price dropped by $200.
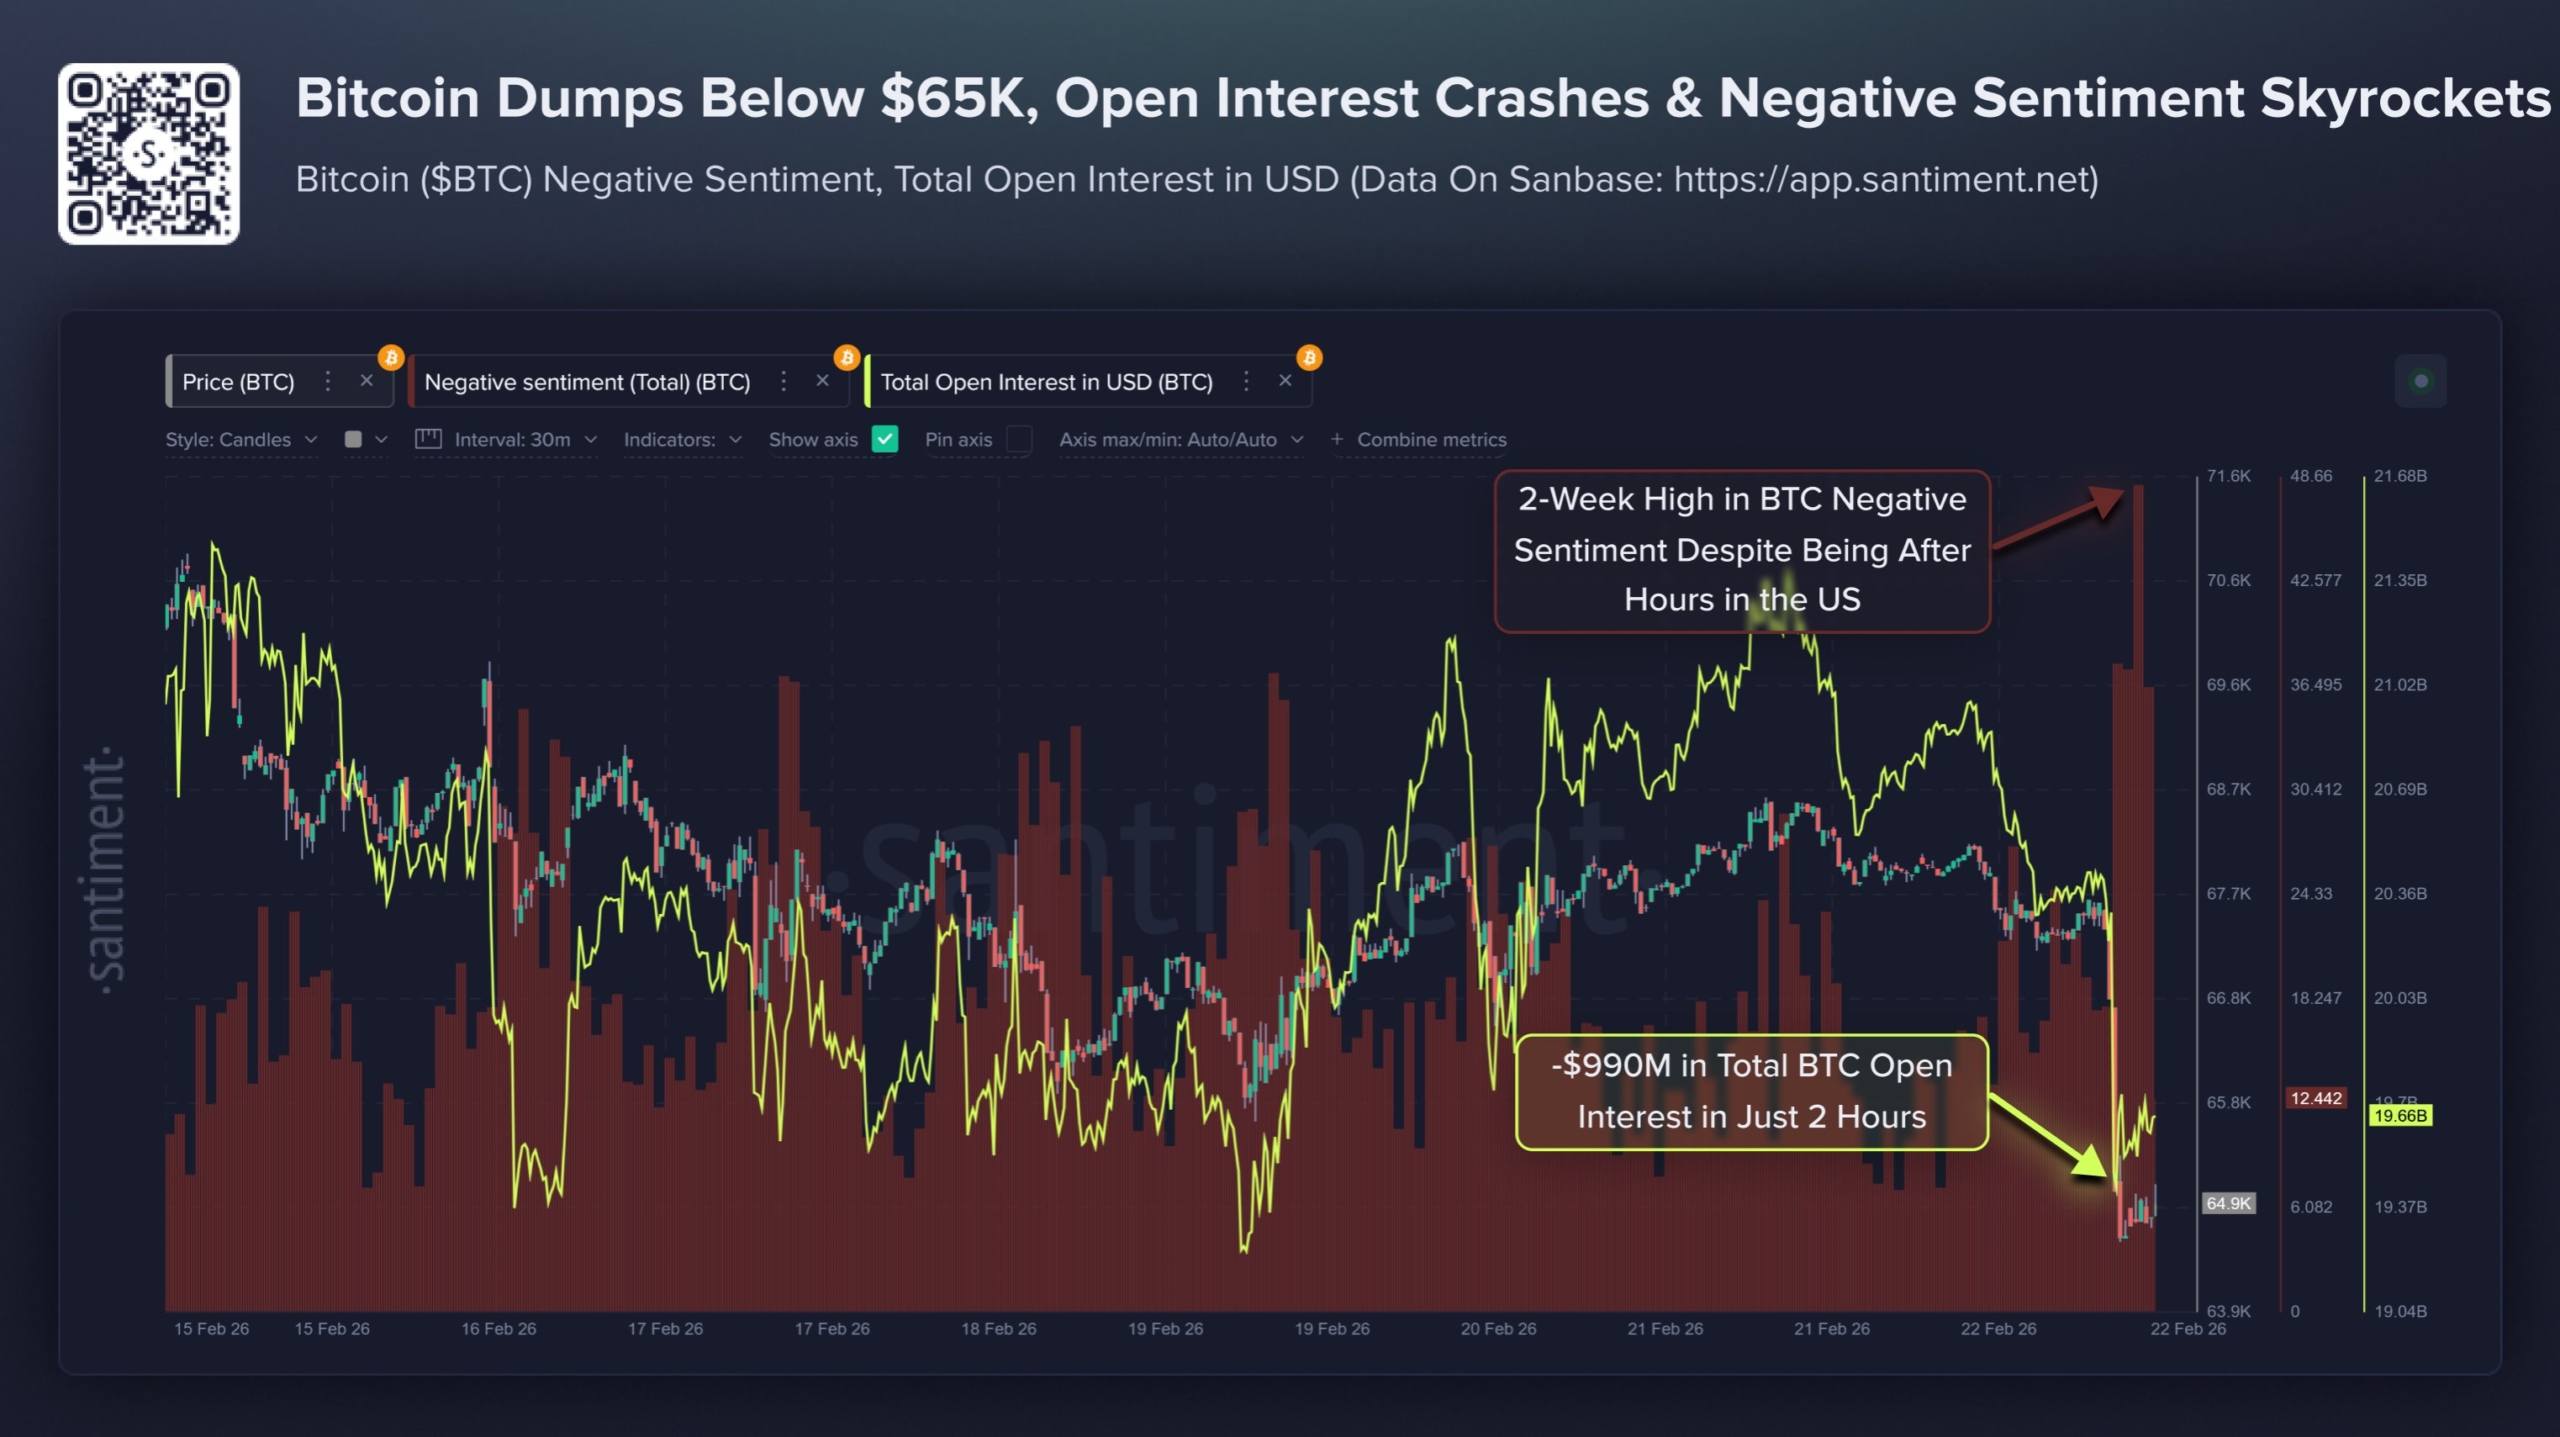
It was another sharp drop for bitcoin earlier this morning when the asset plunged to its lowest level in over two weeks at under $64,500.
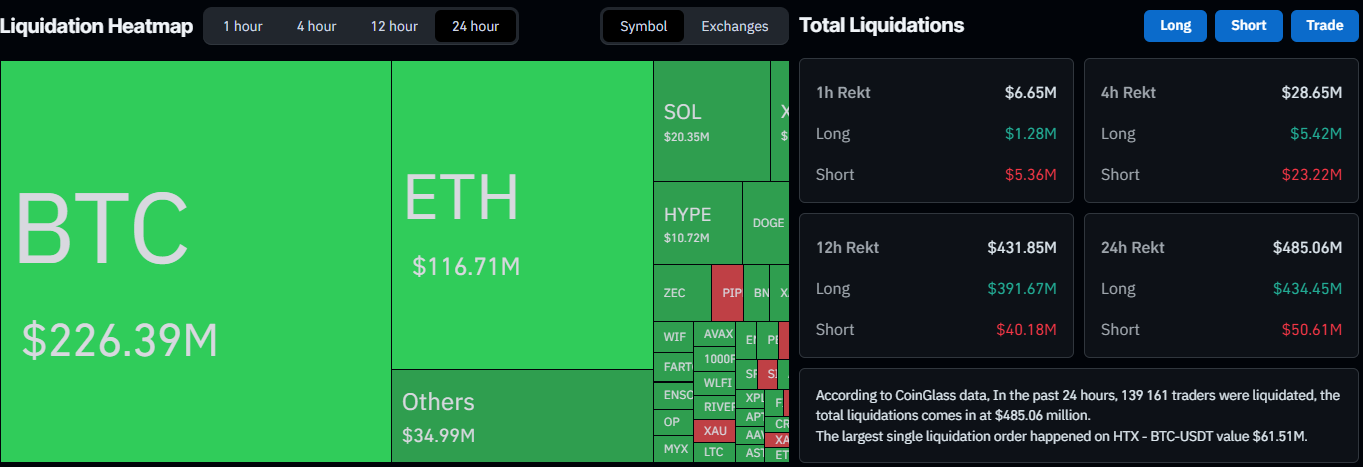
Given the extent and speed of the crash, the total value of wrecked positions skyrocketed within hours to almost $500 million. Within this timeframe, almost 140,000 traders were wrecked, according to data from CoinGlass. However, one case in particular raised a few eyebrows.
An unknown whale was wrecked for $61.51 million in the past day during BTC’s painful drop. The liquidation took place on HTX and involved the BTC/USDT trading pair.
Another whale that was hit during the dip was Machi Big Brother – the Taiwanese-American entrepreneur and former musician, whose real name is Jeffrey Huang.
Data from Lookonchain shows that he was partially liquidated on his ETH position. CryptoPotato reported a few days ago that his entire crypto portfolio had fallen below $1 million, posting a loss of around $28 million.
Although that amount has risen to over $28.8 million following the latest liquidation, he continues to build on his Ethereum longs, now holding 1,700 tokens, worth $3.2 million.
ETH’s price was rejected at $2,000 over the weekend and plunged to $1,850 for the first time since the February 6 crash, when it bottomed at $1,750.
You may also like:
The market just crashed, and Machi(@machibigbrother) was partly liquidated again.
But he keeps adding to his $ETH long position.
He now holds 1,700 $ETH($3.21M), with a liquidation price of $1,818.74.
His total loss has passed $28.8M.https://t.co/P6lglcgpyo pic.twitter.com/t9cEDpOzQ1
— Lookonchain (@lookonchain) February 23, 2026
Binance Free $600 (CryptoPotato Exclusive): Use this link to register a new account and receive $600 exclusive welcome offer on Binance (full details).
LIMITED OFFER for CryptoPotato readers at Bybit: Use this link to register and open a $500 FREE position on any coin!
Ethereum’s native token, Ether (ETH), is on track to test and potentially break the $1,500 support level in the coming days.
Key takeaways:
-
Ethereum has entered the breakdown phase of its prevailing bearish continuation pattern.
-
ETH price may decline below $1,500 by early March amid founder-led selling.
ETH bear pennant breakdown targets $1,475
On Monday, ETH’s price dropped by more than 5.60% to about $1,850 amid a broader de-risking sentiment led by nervousness surrounding tariffs.
In doing so, the biggest altcoin broke below the lower trendline of its prevailing bear pennant pattern, with rising volumes indicating traders’ conviction behind the breakdown move.

A bear pennant breakdown typically resolves when the price falls by as much as the previous downtrend’s height.
Applying the same principle to ETH’s charts would bring its downside target to $1,475, close to the psychological support level of $1,500, by the end of February or early March.
Related: Ethereum price: Classic chart pattern puts sub-$2K ETH in focus
The bulls must therefore reclaim the pennant’s lower trendline as support, followed by a continued rally above the 20-day exponential moving average (20-day EMA, the green line) at $2,085, which may invalidate the bearish outlook.
Vitalik Buterin will likely sell more ETH soon
Ethereum co-founder Vitalik Buterin’s planned ETH sales have not helped the bulls regain their footing in February.
On Jan. 30, Buterin said he would withdraw and sell 16,384 ETH via his Kanro entity to fund ecosystem work, open-source software and other long-term initiatives during an Ethereum Foundation “mild austerity” phase.
Since early February, onchain tracker Arkham Intelligence has flagged about 9,000 ETH sold in batches, with the pace picking up again over the past 48 hours after a 3,500 ETH withdrawal from Aave.
Vitalik Buterin “is selling ETH faster again,” said onchain monitoring resource, Lookonchain, on Monday.

Ethereum’s price has dropped 18.55% so far in February, aligning with Buterin’s ETH distribution. The overhang could grow if he liquidates the remaining ~7,350 ETH.
History shows how founder-linked supply, including Ethereum Foundation treasury transfers, can amplify bearish sentiment among traders.
For instance, the May 2021 35,000 ETH transfers (about $125 million at that time) preceded a 50% ETH price drop within weeks.
Later, the foundation transferred another 20,000 ETH ($95 million) to Kraken on Nov. 11, 2021, a move that, in hindsight, coincided with Ether’s price peaking near $4,700 before the next leg lower.
Such conditions further increase ETH’s odds of hitting its pennant target below $1,500 in the coming days.
This article does not contain investment advice or recommendations. Every investment and trading move involves risk, and readers should conduct their own research when making a decision. While we strive to provide accurate and timely information, Cointelegraph does not guarantee the accuracy, completeness, or reliability of any information in this article. This article may contain forward-looking statements that are subject to risks and uncertainties. Cointelegraph will not be liable for any loss or damage arising from your reliance on this information.
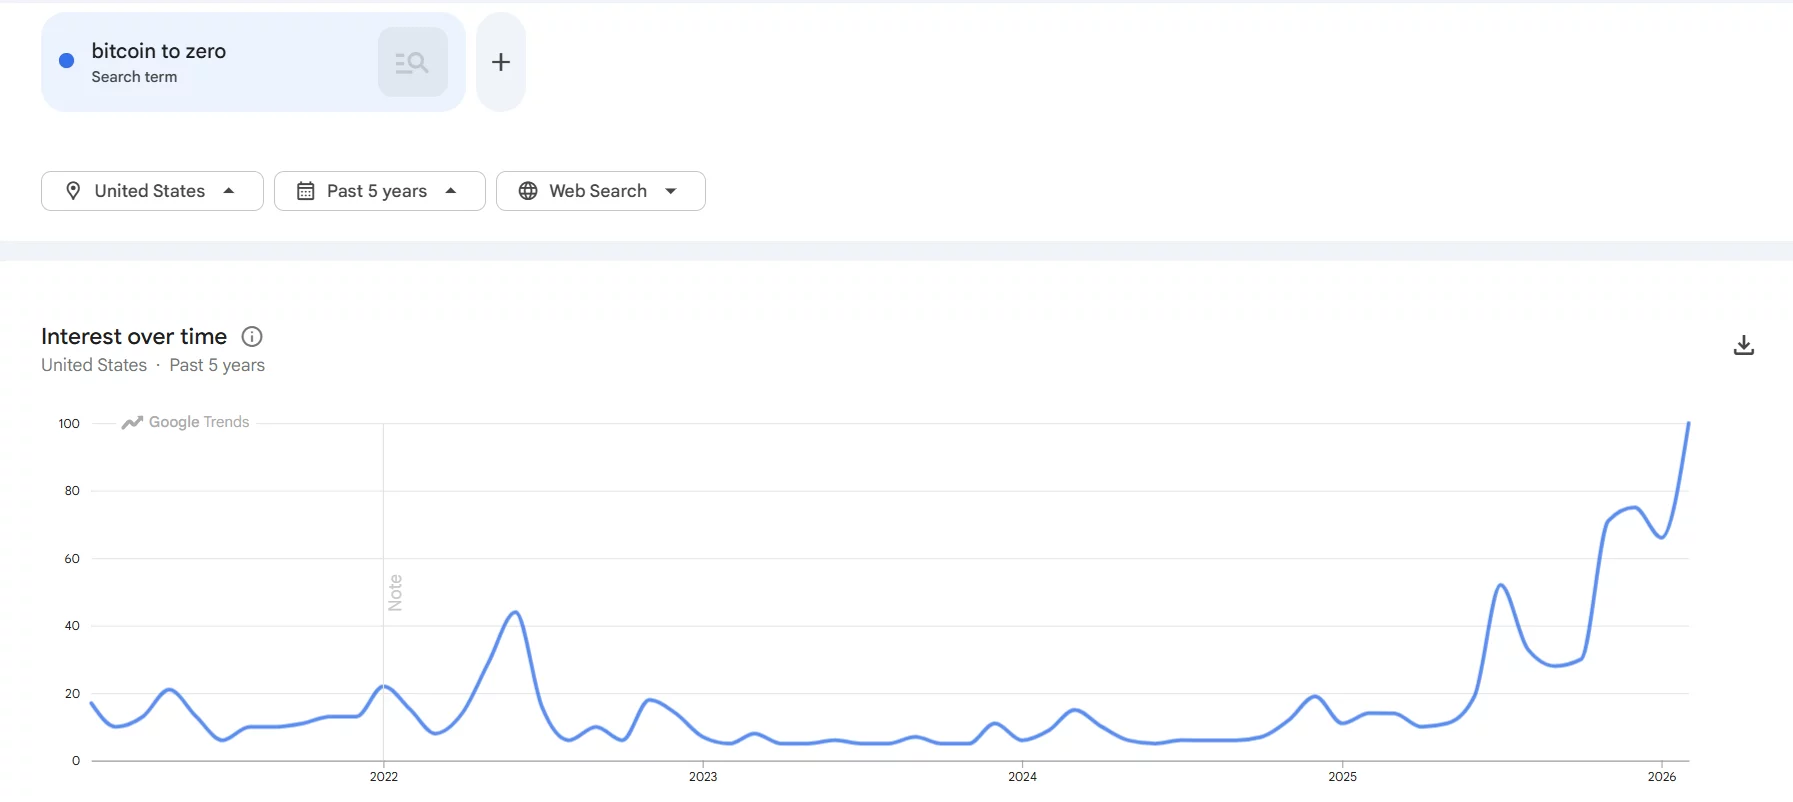
Search interest for “Bitcoin to zero” has surged sharply in the United States, according to Google Trends data over the past five years, as Bitcoin remains under pressure in a downtrend.
Summary
- U.S. Google searches for “Bitcoin to zero” have surged to a record high, hitting a peak score of 100 in early 2026, signaling rising retail fear.
- Similar spikes occurred during prior market drawdowns, but the current jump is stronger than previous peaks.
- Bitcoin is trading near $65,950, holding above $64,000 support but struggling below $68,000 resistance, with technical indicators pointing to short-term weakness.
The latest reading shows the search term spiking to its highest level on record, reaching a peak score of 100 in early 2026.
The chart shows that similar spikes occurred during prior drawdowns, including in 2022 and briefly in 2025. However, the current move is notably stronger than previous peaks.

For most of 2023 and early 2024, interest remained muted, reflecting a calmer market environment. The sudden rise suggests growing retail anxiety as Bitcoin (BTC) consolidates after a sharp decline.
Historically, extreme “Bitcoin to zero” searches have coincided with periods of capitulation or heightened fear.
Bitcoin chart signals caution as fear spikes
On the daily chart, Bitcoin is trading near $65,950. This month, Bitcoin has traded in a tight and choppy range following an early February sell-off that briefly pushed the price toward the low-$60,000 region.
After that sharp drop, BTC staged a modest rebound but has since struggled to break above the $68,000 area, with multiple daily candles showing rejection near the short-term moving average.
Price is trading below the 20-day simple moving average, which sits around $68,278. The upper Bollinger Band is near $72,458, while the lower band is around $64,098.
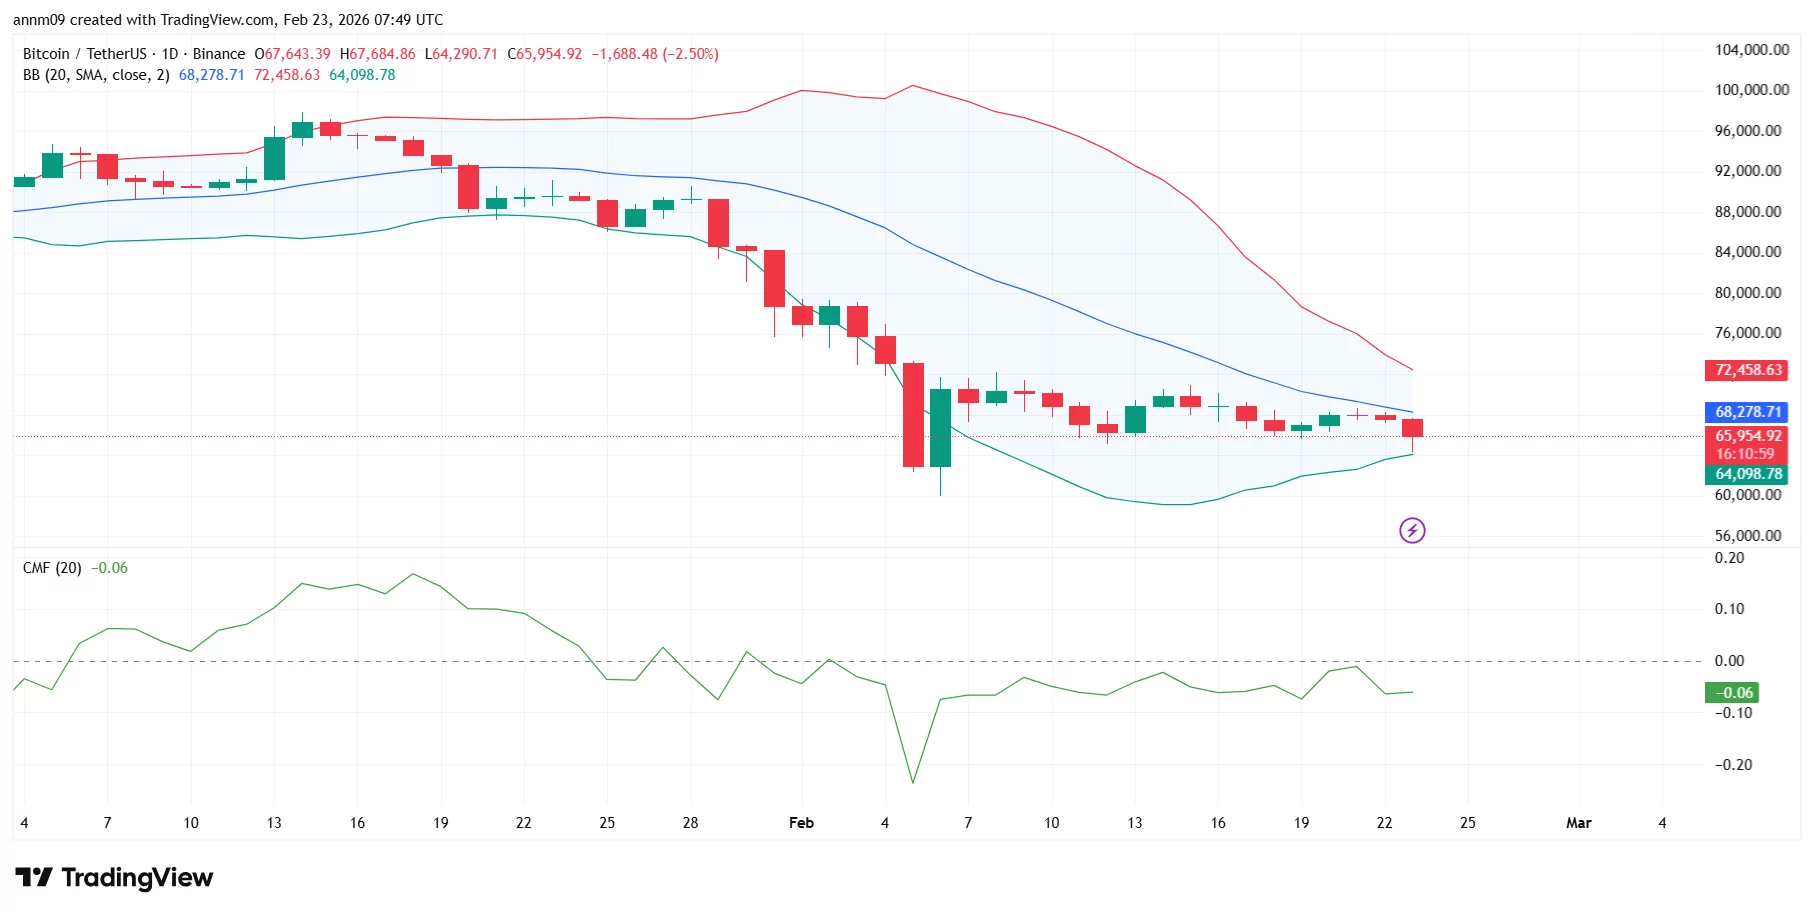
Bitcoin is currently pressing close to the lower Bollinger Band, suggesting short-term weakness. The Chaikin Money Flow indicator is slightly negative at -0.06, signaling mild capital outflows but not extreme selling pressure.
Immediate support sits near $64,000, aligned with the lower Bollinger Band and recent consolidation lows. A breakdown below that level could open the door toward the $60,000 psychological area. On the upside, initial resistance is near $68,300 at the 20-day moving average. Stronger resistance is seen around $72,500, which marks the upper Bollinger Band and a prior breakdown zone.
Overall, Bitcoin remains range-bound in the short term but structurally weak unless it reclaims the $68,000–$72,000 region.


Missouri lawmakers have advanced a strategic Bitcoin reserve bill that would allow the state treasurer to “accept gifts, grants, donations, bequests, or devises of bitcoin from eligible Missouri residents or a governmental entity.”
Summary
- Missouri’s HB 2080 would create a Bitcoin Strategic Reserve Fund funded primarily through donations.
- Bitcoin held in the fund must remain in cold storage for at least five years.
House Bill 2080 was introduced by Rep. Ben Keathley last month, was subsequently referred to the House Commerce Committee on Feb. 19, and is now pending a committee Hearing.
According to official documents, the bill seeks to establish a “Bitcoin Strategic Reserve Fund” funded primarily by “gifts, grants, donations, bequests, or devises of bitcoin,” but also includes a provision allowing the state treasurer to “invest, purchase, and hold cryptocurrency using state funds.”
All funds received would be stored in cold storage and held for at least five years “from the date that the bitcoin enters the state’s custody”, after which the bitcoin “may be transferred, sold, appropriated, or converted to another cryptocurrency.”
The treasurer can contract with a qualified, independent, United States-based third-party cryptocurrency entity to assist in the creation, maintenance, operation, and administration of the fund’s security, and would be required to publish a biennial report.
Once the bill clears the House Commerce Committee, it will be forwarded to the full House chamber, where it will have to be debated and approved by a majority vote before it may be passed and sent to the Senate for committee review, floor consideration, and a final vote.
HB 2080 is a successor to HB 1217, introduced early last year by Rep. Ben Keathley, with the only notable difference being that it has been referred to the House Commerce Committee instead of the Special Committee on Intergovernmental Affairs, where it previously stalled and ultimately died in committee.
If passed, Missouri will join Texas, New Hampshire, and Arizona in advancing state-level Bitcoin reserve frameworks, out of which Texas and New Hampshire allow direct public fund investments, while Arizona’s law restricts the reserve to Bitcoin acquired through seized and forfeited assets rather than new taxpayer allocations.

BTC’s price tumbled in hours to a 17-day low as analyst outlined the next key support levels.
It almost felt inevitable after the latest developments on Trump’s tariff front that bitcoin’s price would eventually head south after a relatively calm weekend.
Recall that the US Supreme Court ruled that many of the POTUS’s tariffs imposed in the past year were illegal, determining that he should have been unable to use the IEEPA (a 1977 emergency law) to levy taxes on imports from almost all countries.
Aside from calling the Court’s decision a “disgrace,” President Trump announced a 10% temporary global tariff under Section 122 – a law that was never used before. A day later, he ramped up this taxation to 15%.
As it happened several weeks ago during the most intense verbal battle for Greenland, the impact on bitcoin wasn’t immediate. At the time, the tariff threats between the US and the EU took place mostly during the weekend, and BTC stood still.
However, once the legacy futures markets opened on Sunday afternoon, bitcoin slumped by several grand within an hour or so. This scenario repeated on February 22/23 when the cryptocurrency plunged from $67,800 to a 17-day low of $64,350 (on Bitstamp). It found some support there and now sits close to $66,000.
If there’s another substantial leg down, BTC’s next key support levels could be at $58,500, $54,440, and $41,500, according to Ali Martinez, who cited the BTC holder cost basis.
Bitcoin $BTC holder cost basis highlights three key support levels:
• $58,467
• $54,439
• $41,488 pic.twitter.com/fievX4HpdA— Ali Charts (@alicharts) February 22, 2026
You may also like:
The altcoins followed suit, with many dropping by over 5% within the same timeframe. The total value of liquidated positions has jumped to almost $500 million on CoinGlass. Longs are responsible for rouhgly 90% of that amount.
Santiment also weighed in on BTC’s latest crash, indicating that the open interest has dropped to just $19.5 billion after the latest liquidation cascade, which is “under half of the 2026 peak of $38.3 billion back on January 14.”
The analytics company added that the social media FUD among retail investors has “quickly gone into FUD mode, which can historically help propel a quick rebound.”
Binance Free $600 (CryptoPotato Exclusive): Use this link to register a new account and receive $600 exclusive welcome offer on Binance (full details).
LIMITED OFFER for CryptoPotato readers at Bybit: Use this link to register and open a $500 FREE position on any coin!
Key takeaways
-
Unlike phishing attacks that defraud victims quickly, pig-butchering scams build long-term emotional trust before introducing fraudulent crypto investment opportunities.
-
From casual outreach and relationship building to fake profits, escalating deposits and blocked withdrawals, each step is carefully designed to deepen commitment.
-
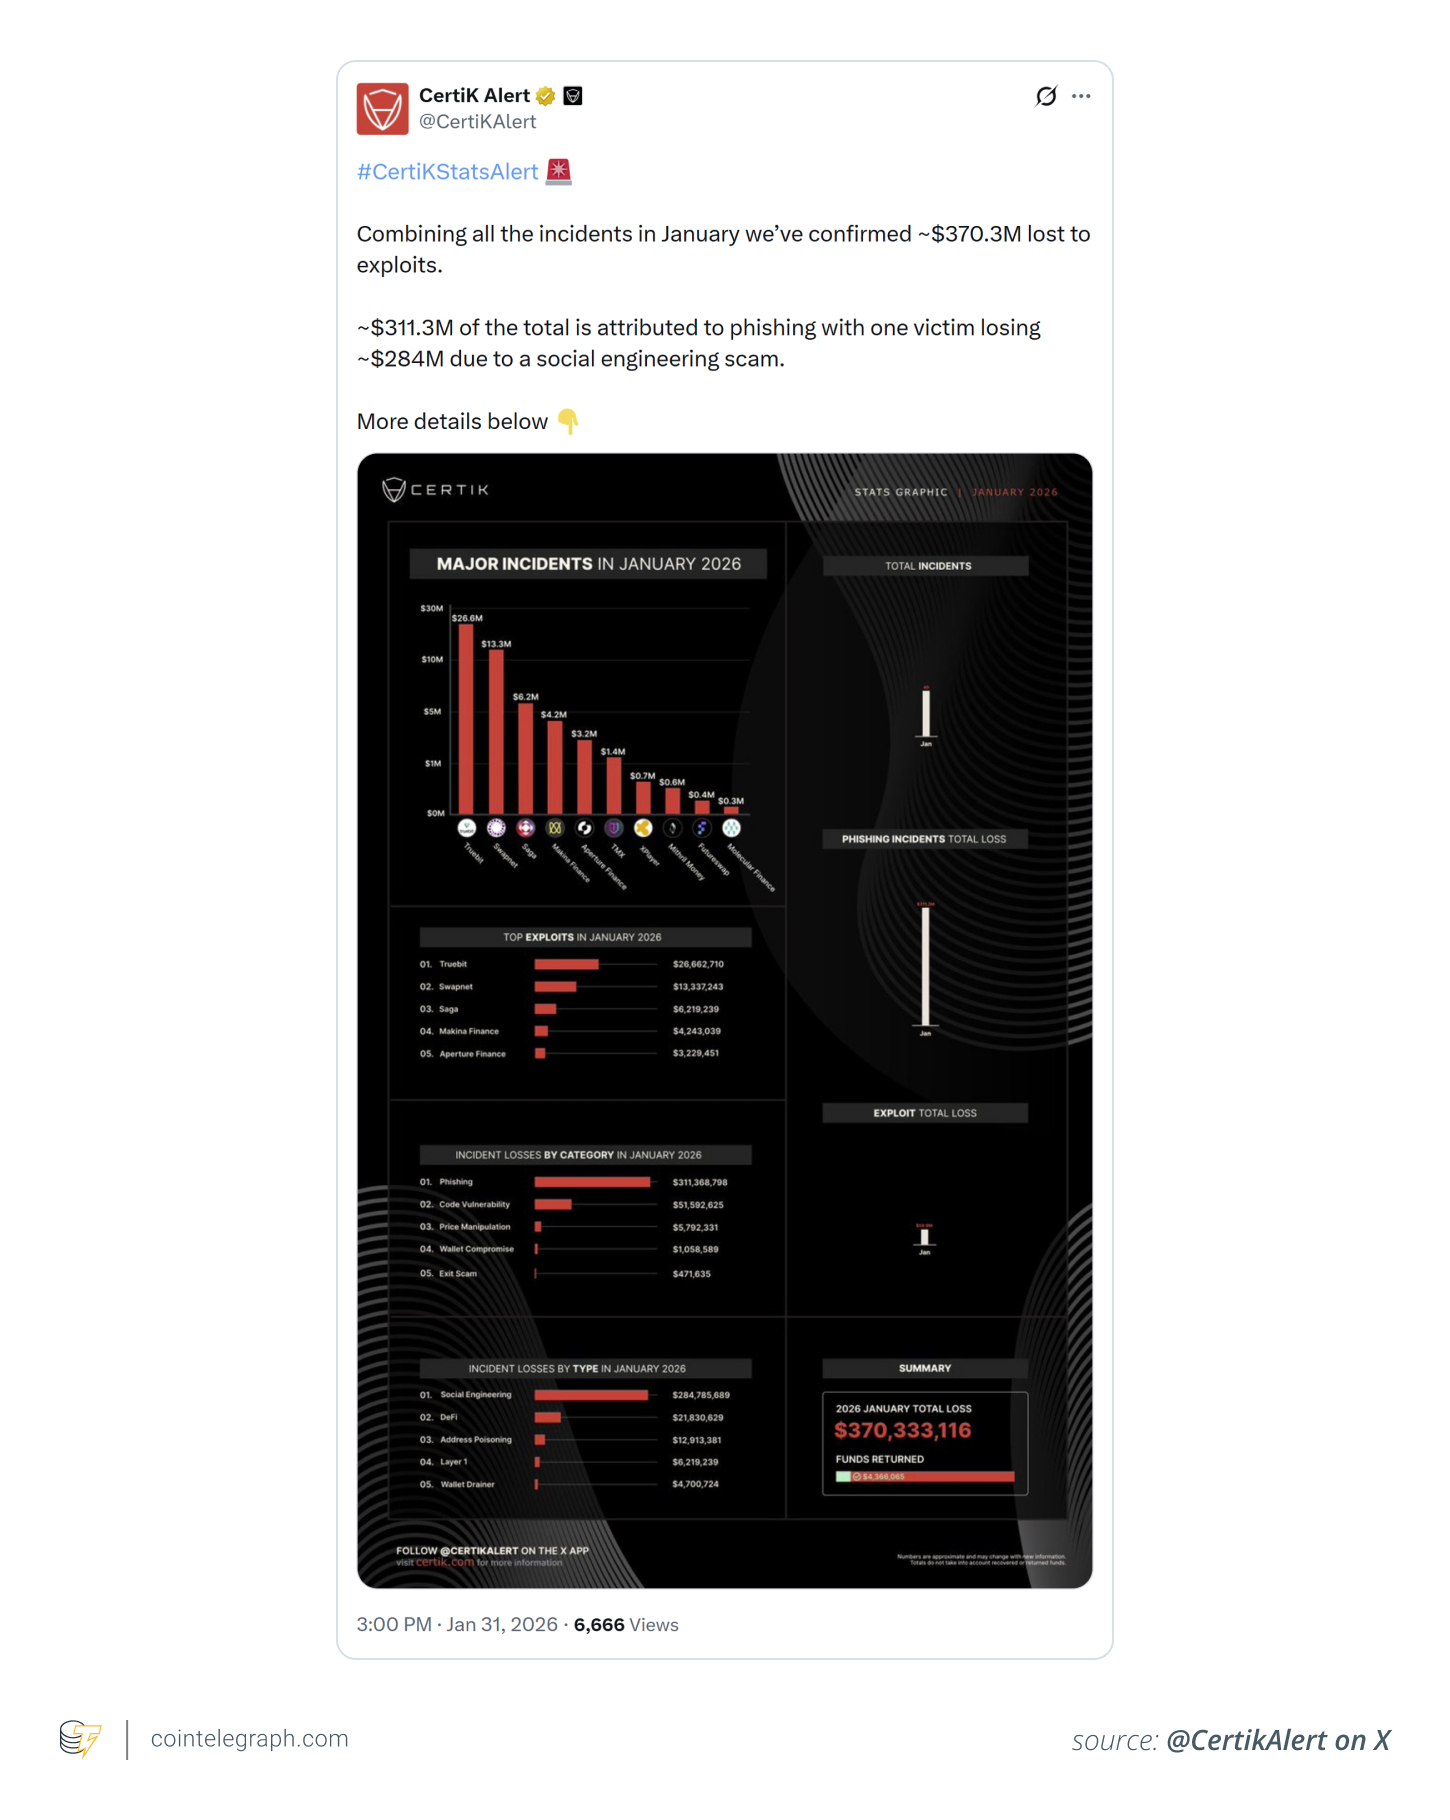
Blockchain security firm CertiK reported $370.3 million in scam-related losses in January 2026 alone, with social engineering tactics accounting for the majority.
-
Authorities are targeting scam networks and laundering operations, yet cross-border jurisdictional issues and encrypted communications complicate crackdowns.
Pig-butchering frauds involve a long-drawn, methodical approach in which scammers instill confidence in their targets and later exploit it for monetary gain. Over the last few years, such schemes have proliferated within the crypto sector, making traders fearful of losing their funds. These frauds have reshaped how regulators and law enforcement view crypto-enabled crime.
This article explores how pig-butchering crypto scams manipulate victims through long-term relationship building and the exploitation of emotional trust using fabricated investment platforms. It explains the psychological tactics scammers use, how funds are extracted over time and why these schemes have become one of the fastest-growing global crypto fraud models.
Defining a pig-butchering scam
Pig-butchering derives from the Chinese expression “Sha Zhu Pan,” which refers to nurturing a target like livestock prior to slaughter. Applied to fraud, it entails scammers forging deep personal connections over extended periods. They then coax victims into sending funds to a deceptive digital currency venture.
While typical phishing tactics rely on urgency and alarm, pig-butchering scams hinge on persuasion and persistence. Scammers assume roles such as a confidant, adviser or financial consultant, methodically building trust before executing the scheme.
Did you know? Some victims interact with scammers for several months before investing, making pig-butchering one of the longest-running and most emotionally manipulative forms of online financial fraud.
Breaking down the scam process
Understanding each stage of a pig-butchering scam reveals how emotional manipulation and financial deception are woven together to trap victims:
-
First outreach: Perpetrators typically initiate contact with victims through dating platforms, professional networks like LinkedIn, social media such as Instagram, messaging services like Telegram or unsolicited SMS messages. The introductory message is designed to lower suspicion and often appears accidental or casual.
-
Fostering connection: Over subsequent days or weeks, the scammer nurtures a bond with the victim by sharing “manufactured” anecdotes, routine details and “professional” achievements. Many scammers impersonate successful digital asset traders and finance experts.
-
Unveiling the opportunity: Eventually, the scammers shift the conversation to investing. They claim to know a high-return crypto trading strategy or to have access to insider knowledge or a private investment platform. They show victims screenshots of fake profits and guide them to professional-looking fraudulent websites.
-
Early modest returns: Scammers encourage individuals to start with minimal investments. The system may display swift “earnings” to build trust. Occasionally, scammers allow small withdrawals to make the platform appear legitimate.
-
Intensification: As the victim’s trust in the scammers increases, they are encouraged to invest larger amounts. Scammers may advise victims to take bank loans, withdraw savings or even borrow from friends.
-
Blocked withdrawals and exit: When victims attempt to retrieve the amount “deposited,” the system blocks access and demands additional “charges.” Thereafter, the scammers vanish.
Did you know? Law enforcement agencies in the US and Europe have begun freezing crypto wallets linked to pig-butchering rings, sometimes recovering partial funds through coordinated blockchain tracing efforts.
Using trust as a psychological weapon
The core feature that sets pig-butchering scams apart is their reliance on psychological and emotional exploitation. Fraudsters target vulnerabilities such as:
-
Feelings of isolation or a strong need for connection and affection
-
Economic difficulties combined with the hope of gaining quick wealth
-
Authority bias, which refers to the tendency to rely on perceived experts
-
Trust in apparent evidence of success.
Perpetrators intentionally spend time in the buildup phase rather than pushing for quick action. An extended period of interaction deepens the victim’s sense of attachment and loyalty. When the moment arrives to send money, many victims genuinely feel they are partnering with a dependable ally or close companion.
The emotional layer complicates the path to recovery, both financially and psychologically.
Did you know? Pig-butchering exploits proceed through complex laundering chains involving multiple wallets, cross-chain bridges and over-the-counter (OTC) brokers before funds are cashed out.
Assessing the magnitude of the problem
Fraud involving cryptocurrency has seen a sharp rise in recent times. According to blockchain security company CertiK, scammers stole $370.3 million in January 2026 alone, the largest single-month total in nearly a year. Of that amount, phishing and social engineering tactics accounted for about $311 million, a category that frequently includes pig-butchering operations.

This uptick followed prominent crypto security breaches in 2025, particularly the Bybit exchange hack in February, which contributed to $1.5 billion in overall losses during that period.
Significant court outcomes further demonstrate the scale of these crimes. In early 2026, Daren Li, a dual citizen of China and St. Kitts and Nevis, received a 20-year federal prison sentence in the US for leading an extensive cryptocurrency fraud network. According to prosecutors, his actions defrauded victims of more than $73 million, with accomplices setting up fake websites and using front companies.

Dimensions of crypto-related frauds
Trading in digital currencies does not always result in fraud. However, crypto trading has its own unique dynamics.
-
Swiftness and finality: Crypto transactions become permanent once confirmed. Unlike card-based payments, no central authority can reverse the transfer of funds.
-
Global reach: Fraudsters often operate in networks that span national borders. Crypto enables seamless cross-border transfers independent of conventional finance.
-
Convincing interfaces: Scam websites have grown more sophisticated. Like legitimate platforms, they may feature dynamic pricing, user dashboards and support functions.
-
Obfuscation using stablecoins and decentralized finance: To obscure the trail of funds involved in these scams, assets are often swapped into stablecoins or routed through decentralized systems.
While blockchain transparency assists investigators, stolen assets may pass through a chain of addresses before an investigation begins.
Countermeasures to curb pig-butchering scams
Security agencies have taken steps to deter pig-butchering scams, which can be devastating for victims. Entities such as the US Secret Service and Homeland Security are strengthening joint efforts through anti-crime units focused on financial offenses.
Recent cases demonstrate that investigative agencies are pursuing not only individual scammers but also laundering networks and shell companies that facilitate the movement of funds. However, enforcement faces several challenges:
-
Jurisdictional complexity
-
Use of encrypted communications
-
Scam compounds operating in loosely regulated regions
-
Reports of forced labor in some Southeast Asian scam centers.
The global nature of these operations requires a coordinated international response.
Red flags to watch for
Awareness remains the first line of defense against fraudulent activities. Common warning signs include:
-
Unsolicited investment advice from online acquaintances
-
Pressure to move conversations off mainstream apps
-
Assurances of consistent high returns with low risk
-
Requests to deposit crypto on unfamiliar platforms
-
Demands for “tax” or “unlock” fees before withdrawals.
Before investing in any platform, verify through independent sources that it is credible.
Cointelegraph maintains full editorial independence. The selection, commissioning and publication of Features and Magazine content are not influenced by advertisers, partners or commercial relationships.

Mexico latest: US tourists stranded and told to ‘seek shelter’ after cartel drug lord El Mencho killed by military

Southern Cross Radio-Seven West CEO departs on eve of first financial results

Why Crypto’s ‘Buy the Rumor’ Mantra No Longer Works


-

 Video7 days ago
Bitcoin: We’re Entering The Most Dangerous Phase
-

 Crypto World6 days ago
Can XRP Price Successfully Register a 33% Breakout Past $2?
-

 Video3 days ago
XRP News: XRP Just Entered a New Phase (Almost Nobody Noticed)
-

 Fashion3 days ago
Weekend Open Thread: Boden – Corporette.com
-

 Sports6 days ago
GB's semi-final hopes hang by thread after loss to Switzerland
-

 Politics1 day ago
Baftas 2026: Awards Nominations, Presenters And Performers
-
 Tech6 days ago
The Music Industry Enters Its Less-Is-More Era
-

 Business5 days ago
Infosys Limited (INFY) Discusses Tech Transitions and the Unique Aspects of the AI Era Transcript
-

 Entertainment5 days ago
Kunal Nayyar’s Secret Acts Of Kindness Sparks Online Discussion
-

 Video6 days ago
Financial Statement Analysis | Complete Chapter Revision in 10 Minutes | Class 12 Board exam 2026
-

 Tech5 days ago
Retro Rover: LT6502 Laptop Packs 8-Bit Power On The Go
-
 Sports4 days ago
Clearing the boundary, crossing into history: J&K end 67-year wait, enter maiden Ranji Trophy final | Cricket News
-

 Business20 hours ago
Mattel’s American Girl brand turns 40, dolls enter a new era
-

 Business16 hours ago
Law enforcement kills armed man seeking to enter Trump’s Mar-a-Lago resort, officials say
-

 Entertainment4 days ago
Dolores Catania Blasts Rob Rausch For Turning On ‘Housewives’ On ‘Traitors’
-

 Business5 days ago
Tesla avoids California suspension after ending ‘autopilot’ marketing
-

 Politics6 days ago
Eurovision Announces UK Act For 2026 Song Contest
-

 Tech15 hours ago
Anthropic-Backed Group Enters NY-12 AI PAC Fight
-

 NewsBeat14 hours ago
Armed man killed after entering secure perimeter of Mar-a-Lago, Secret Service says
-

 Crypto World5 days ago
WLFI Crypto Surges Toward $0.12 as Whale Buys $2.75M Before Trump-Linked Forum