

Crypto World
Single BTC trader loses $61 million on HTX as price dives 4%
Bitcoin’s price losses on Monday wiped out a massive leveraged bullish bet.
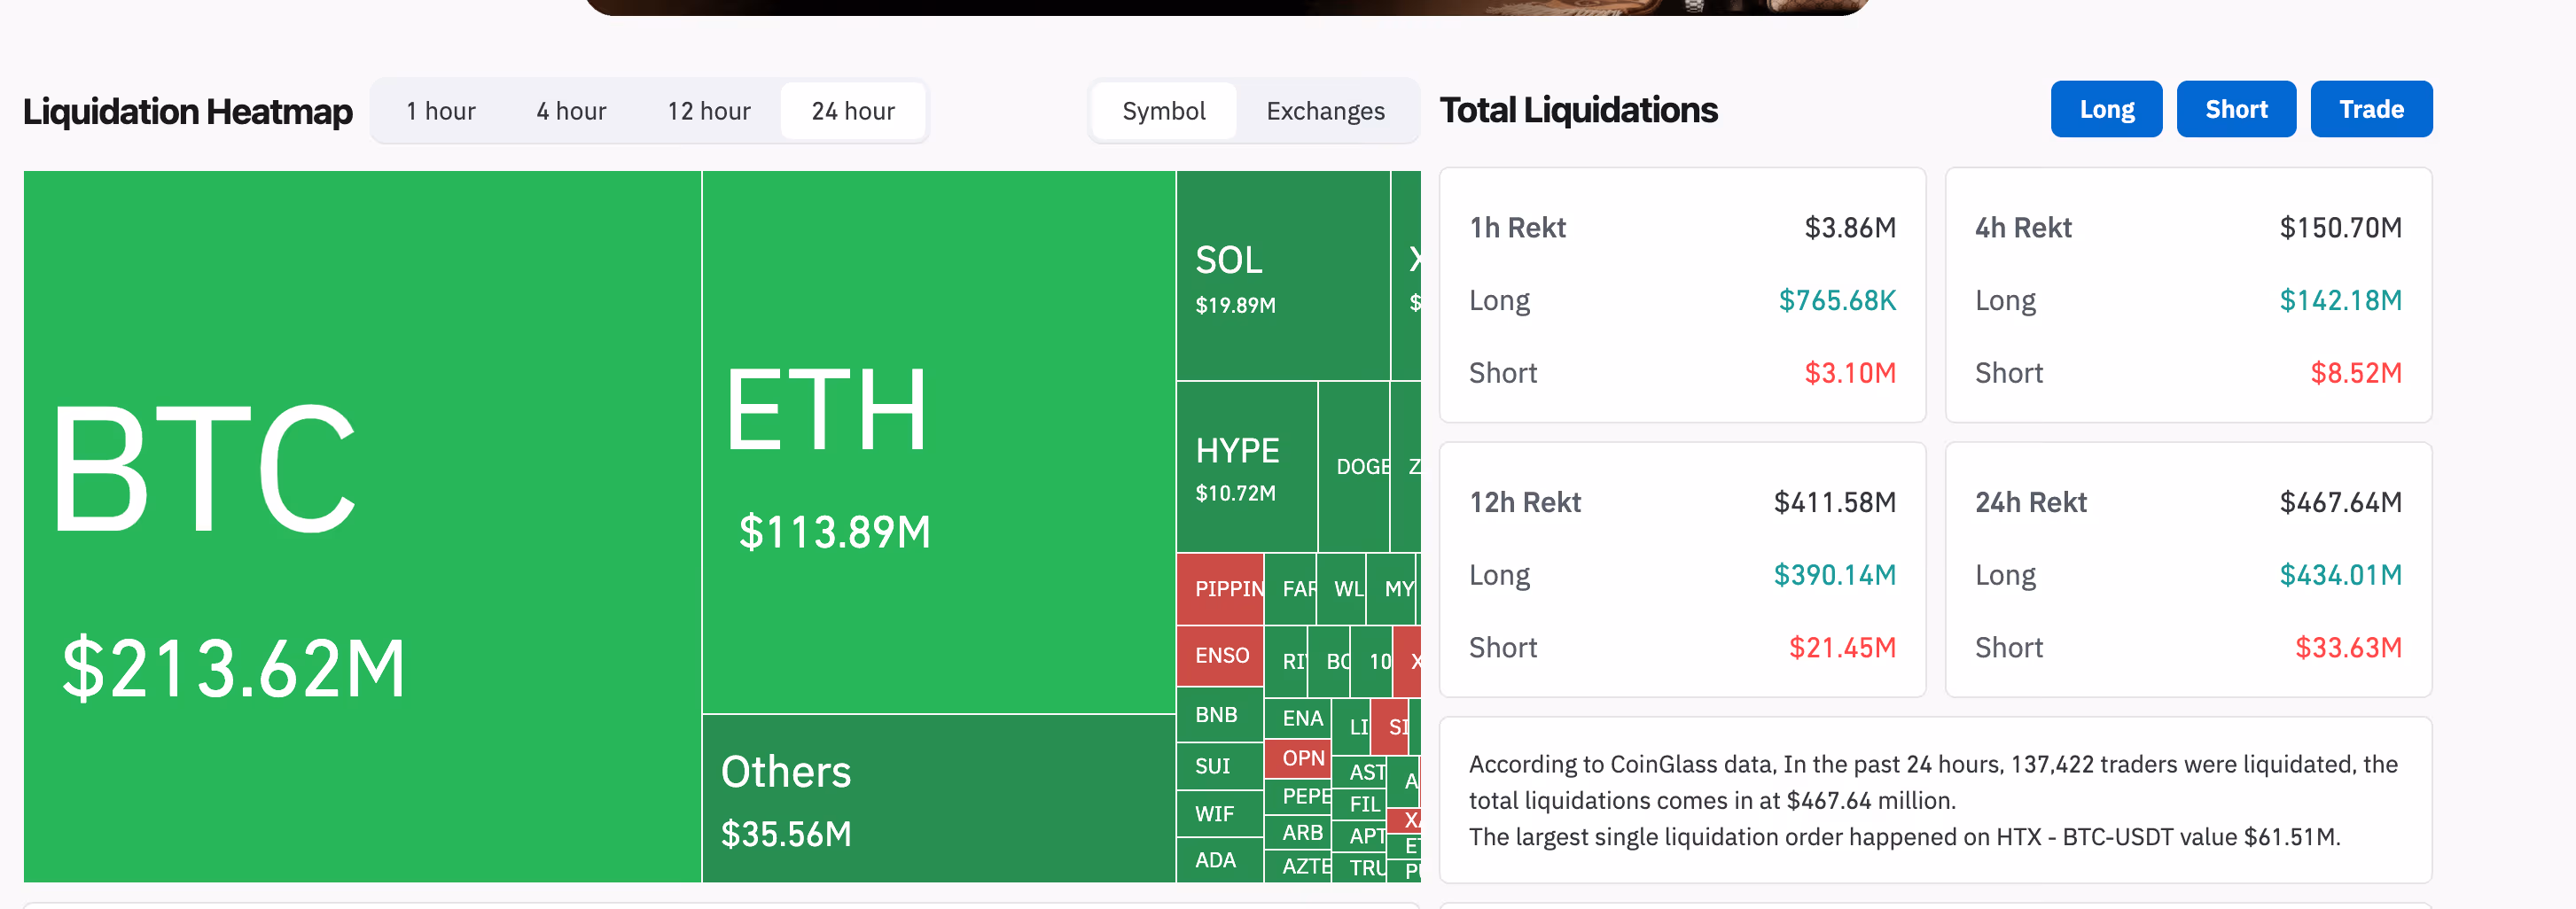
The trade worth $61.5 million was forcibly closed by cryptocurrency exchange HTX, marking the largest single liquidation in the past 24 hours, according to data source Coinglass.
The so-called liquidation happened as bitcoin slid from Saturday’s $68,600 high back to $64,400, erasing the weekend’s gains in a matter of hours. CoinDesk reached out to HTX for comment.

The outsized hit — large enough to suggest a concentrated whale or fund position rather than a retail margin call — landed amid a broader wipeout that saw $467.64 million in total liquidations across 137,422 traders, according to CoinGlass. Long positions accounted for $434 million of that, roughly 93% of the total, pointing to a market that was still positioned for upside heading into the week and got flushed when bids disappeared.
Bitcoin futures alone saw $213.62 million in forced closures, followed by ether (ETH) at $113.89 million and solana (SOL) at $19.89 million. Hyperliquid’s HYPE token added another $10.72 million, a notable figure for an asset outside the usual top-five liquidation leaderboard.
Fear reigns supreme
The selloff dragged Alternative.me’s Crypto Fear and Greed Index back to 5 out of 100, a reading categorized as “extreme fear” that has only been matched three times since the index launched in 2018: August 2019, June 2022, and earlier this month during bitcoin’s slide to $60,000.
Glassnode data reinforces the stress. The firm said Monday that the seven-day moving average for net realized losses among recent bitcoin buyers was still running near $500 million per day, meaning short-term holders are continuing to capitulate even after the initial February flush.
“While the intensity has cooled, the broader regime still signals a market under pressure,” Glassnode noted, “with participants in the base formation phase continuing to capitulate.”
Bitcoin now sits 48% below its October all-time high of $126,000 and 5.5% below its 2021 bull-market peak of $69,000 — a level that once felt like the ceiling and now looks like a floor that keeps getting tested. Monday’s wreckage cleared leverage but the pattern remains intact: traders reload longs into every bounce, and the market keeps punishing them for it.


$TRUMP, $MELANIA plunged ~90–93% from peaks, wiping out retail while insiders took profits.
Summary
- Official $TRUMP and $MELANIA are down about 91–99% from highs, with $TRUMP near $3.7 and $MELANIA around $0.12 after the selloff.
- Market trackers estimate more than $4.3b in retail losses, while roughly 45 whale and insider wallets extracted about $1.2b by selling into early hype.
- On-chain data shows early wallets rotated into stables before liquidity thinned, and large unlock schedules plus concentrated holdings now overhang prices and may add further selling pressure.
Cryptocurrency tokens bearing the Trump brand name have declined sharply from their peak values, with the primary token falling approximately 92% and a related token experiencing similar losses, according to market data and on-chain tracking services.
The tokens, which reference U.S. President Donald Trump and associated branding, attracted significant retail investor participation following their launch before experiencing steep price declines, according to reports from cryptocurrency market analysts.
On-chain data indicates that a limited number of early wallet addresses realized substantial profits before the price decline accelerated, according to blockchain tracking services. Transaction records show that certain addresses transferred significant token holdings into stablecoin assets during the early trading period, while subsequent purchasers experienced losses as market liquidity decreased.
The token structure included locked allocations scheduled for gradual release over time, according to project documentation. Market analysts have noted that the release of these locked tokens could create additional selling pressure as supply enters circulation.
The price collapse has prompted calls for regulatory examination from market observers and investor advocacy groups in multiple jurisdictions. Questions have been raised regarding the marketing practices and token economic structures employed in the launches, particularly concerning projects associated with public figures.
Trading activity and social media discussion increased as losses mounted, with some token holders criticizing project operators and alleging preferential treatment for early participants. The token launches have renewed debate regarding the risks associated with celebrity-endorsed cryptocurrency projects.
Several cryptocurrency exchanges and market makers have reportedly begun implementing stricter listing criteria and enhanced scrutiny for projects with similar token distribution models, according to industry sources.
Blockchain data shows that addresses identified as early participants continue to hold token positions that have not yet been liquidated, according to on-chain analytics providers. The presence of these holdings represents potential future selling pressure on token prices.
The tokens were launched with promotional campaigns emphasizing brand association, though specific marketing claims and project promises were not independently verified at the time of launch. Retail participation was substantial during the initial trading period, according to transaction volume data.
Regulatory authorities in several countries have been contacted by investor groups requesting investigation into the token launches, though no formal enforcement actions have been announced as of this report.

Bitcoin’s recent price action reflects renewed weakness after failing to sustain momentum above the $70K region. The rejection at this key psychological threshold has shifted short-term sentiment back toward caution, as sellers regained control and forced the price beneath recent daily lows.
Bitcoin Price Analysis: The Daily Chart
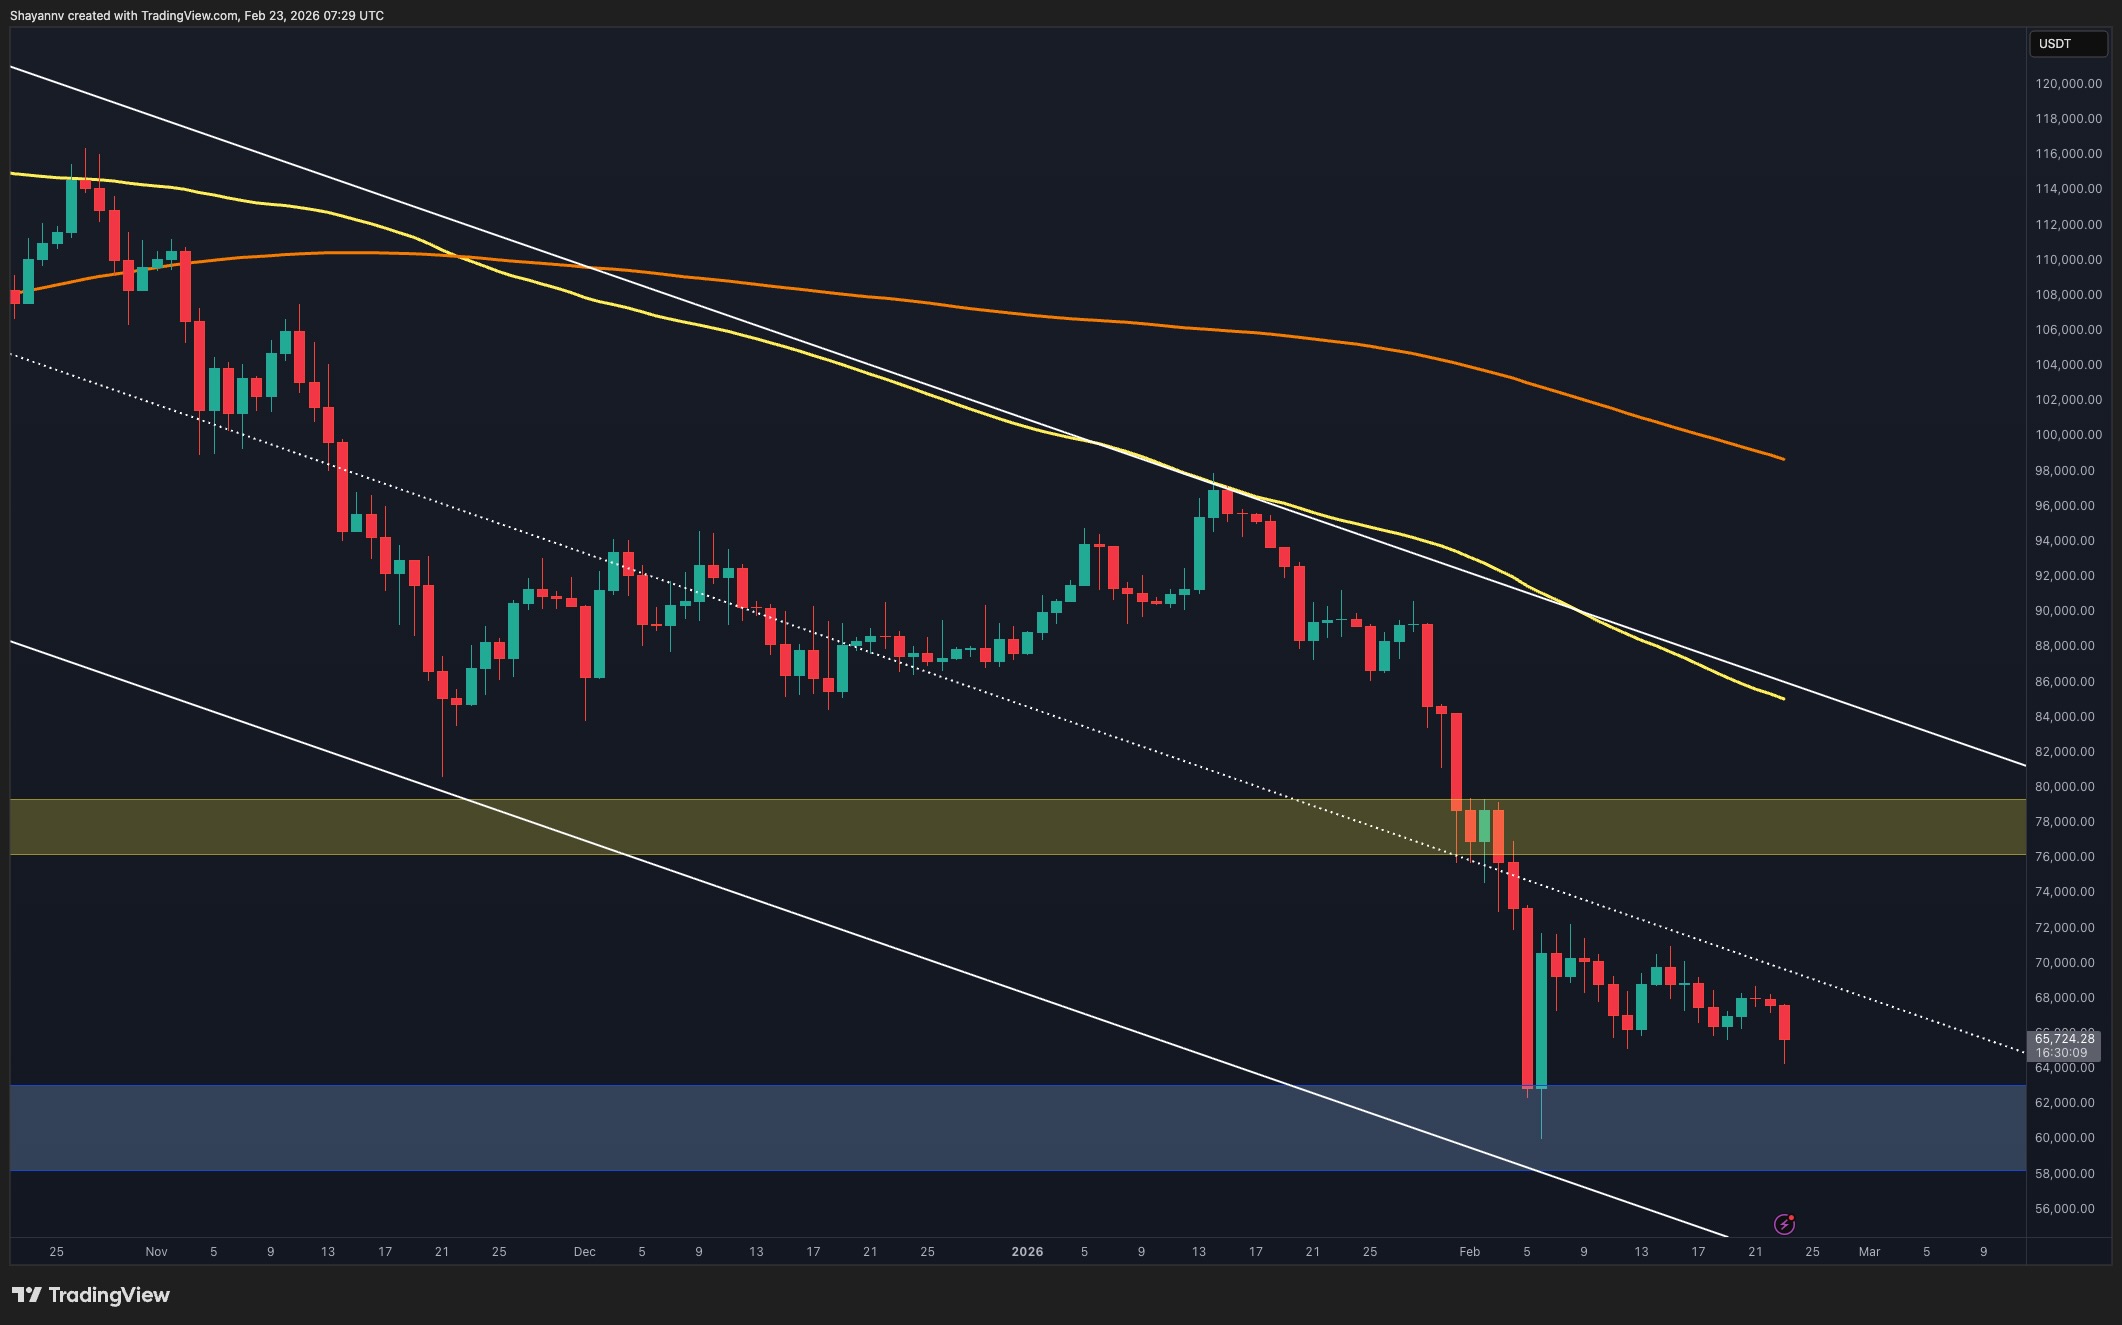
On the daily timeframe, BTC recently faced a clear rejection at the $70K threshold, where selling pressure intensified and pushed the asset back below the recent daily lows. This breakdown highlights the continued presence of sellers at higher levels and reinforces the fragile nature of the current recovery attempts.
With the price slipping back under short-term structure, the market appears to be lacking strong bullish momentum. At this stage, Bitcoin is likely to remain in a broader consolidation phase between the $60K support zone and the $75K resistance area. A decisive breakout beyond either boundary will be required to establish the next sustained directional move, while continued rejection near $70K keeps the short-term bias cautious.
BTC/USDT 4-Hour Chart
On the 4-hour timeframe, Bitcoin had been compressing inside a symmetrical triangle following the sharp bounce from the $60K low. That structure has now resolved to the downside, with the price breaking below the ascending support trendline and accelerating lower.
The breakdown confirms short-term bearish continuation and shifts focus back toward the lower boundary of the broader demand area. Any rebound toward the underside of the broken triangle support or toward the $74K–$76K prior supply region would likely be viewed as a corrective retest unless buyers can generate strong follow-through.
At the moment, short-term structure favors sellers, and the market is searching for a new equilibrium level after the failed compression.

Sentiment Analysis
The liquidation heatmap shows a dense liquidity cluster above the current price around the $69K–$70K region, which previously acted as a magnetic zone during consolidation. This cluster absorbed the price multiple times before the recent drop, highlighting how overhead liquidity continues to cap upside attempts.
At the same time, slight liquidity bands have formed below the market in the $62K–$65K range. The recent sharp move downward tapped into part of this liquidity pocket, triggering liquidations and fueling volatility. The presence of remaining liquidity beneath the current price suggests that further sweeps cannot be ruled out, especially if momentum remains weak.
Overall, Bitcoin is positioned between overhead liquidity that acts as resistance and lower liquidity pockets that may attract price in the short term. The interaction with these zones, combined with the broader bearish channel structure, will determine whether Bitcoin stabilizes above $60K or extends its corrective phase deeper.

Binance Free $600 (CryptoPotato Exclusive): Use this link to register a new account and receive $600 exclusive welcome offer on Binance (full details).
LIMITED OFFER for CryptoPotato readers at Bybit: Use this link to register and open a $500 FREE position on any coin!
Disclaimer: Information found on CryptoPotato is those of writers quoted. It does not represent the opinions of CryptoPotato on whether to buy, sell, or hold any investments. You are advised to conduct your own research before making any investment decisions. Use provided information at your own risk. See Disclaimer for more information.


Bitdeer (BTDR) a Singapore-based bitcoin mining and AI infrastructure company has reduced its bitcoin treasury stash to zero, marking a sharp break from the miner playbook of hoarding coins as a signal of conviction seen by the likes of Strategy (MSTR).
The company reported BTC holdings of zero as of Feb. 20, excluding customer deposits. It produced 189.8 BTC on their weekly update and sold the entire amount. Instead of positioning bitcoin as a balance sheet reserve, Bitdeer is turning production into liquidity.
Bitdeer said the decision to sell bitcoin should not concern the broader market, in a post on X, noting it is evaluating multiple powered land acquisition opportunities and believes it is prudent to prepare liquidity now, while continuing to grow hash rate and mine more bitcoin for shareholders.
Operationally, growth remains intact for the company. Bitdeer mined 668 bitcoin in January, up 430% year over year, and increased its self mining hash rate to 63.2 EH per second (EH/s), with total proprietary hash rate reaching 65.1 EH/s.
Bitdeer is accelerating its push into AI infrastructure, rolling out NVIDIA GB200 NVL72 systems in Malaysia and advancing conversions of several sites in the U.S. and Europe from crypto mining to AI data centers.
AI expansion is far more capital intensive than incremental mining buildouts, requiring large scale GPU clusters and data center upgrades.
Bitdeer recently priced a $325 million convertible notes offering and a $43.5 million equity raise to fund datacenter expansion, HPC and AI cloud growth, and ASIC development.
Unlike bitcoin mining, which is tied to price cycles and halvings, AI and HPC contracts can offer more predictable revenue streams. The pivot also represents an attempt by miners to be valued less as leveraged bitcoin proxies and more as digital infrastructure and AI plays.
Peers are moving in the same direction. Riot Platforms (RIOT) recently sold $200 million worth of bitcoin to fund operations and AI expansion. While Bitfarms (BITF) are dropping its “bitcoin company” identity and doubled down on AI in the U.S. MARA Holdings (MARA) is also expanding into HPC and AI through a planned 64% stake in France based Exaion.
Bitdeer shares are down 1% in pre-market, trading at $7.70 per share.

TLDR:
- Brazil’s Central Bank plans to finalize institutional VASP regulations within the 2026–2027 regulatory horizon.
- Companies like Ripple, Fireblocks, and BitGo will be directly affected by the incoming institutional VASP framework.
- Existing crypto firms operating in Brazil will have 270 days to report their activities to the Central Bank.
- Brazil’s Receita Federal is preparing a 3.5% tax on stablecoin flows used as dollar proxies for payments.
Brazil’s Central Bank is moving forward with a regulatory framework for institutional virtual asset service providers (VASPs) before 2027.
These firms build and operate crypto infrastructure for other businesses, not retail users. Companies like Fireblocks, BitGo, Ripple, and Wintermute fall under this category.
Antônio Marcos Guimarães, deputy head of the bank’s Regulation Department, confirmed the plans during a live broadcast on February 9, marking another step in Brazil’s growing crypto oversight agenda.
Framework Takes Shape from Market Consultations
The demand to regulate institutional VASPs came directly from the crypto industry itself. During public consultations, market participants urged the Central Bank to address this segment formally.
The regulator acknowledged the request but chose to tackle stablecoins and other pressing matters first. Now, the 2026-2027 window is reserved for institutional VASP oversight.
Guimarães made the bank’s direction clear during the February 9 broadcast. “The Central Bank is finalizing the authorization criteria for companies that already operate,” he said.
He added that those firms “will have 270 days to inform the Central Bank” of their activities. He also confirmed that “in the 2026-2027 horizon, we intend to advance in the regulation of institutional PSAVs (B2B).”
The Central Bank’s plan involves creating a negotiation model between authorized entities. Under this model, qualifying companies could serve as liquidity and infrastructure providers.
This structure differs significantly from traditional brokerage setups common in retail crypto markets. The approach reflects how institutional crypto operations actually function at scale.
Brazil has already taken steps to bring commercial banks into the crypto space in 2026. New rules streamlining bank participation in crypto markets were rolled out earlier this year.
The institutional VASP framework builds directly on that regulatory momentum. Together, these measures are shaping a more structured and transparent crypto environment across Brazil.
Technical Complexity Slows But Does Not Stop Regulatory Progress
One reason the Central Bank delayed institutional VASP regulation was the sector’s technical complexity. Guimarães explained that the complexity stems from “the nature of the operation of these companies.”
He noted there is “no brokerage system that organizes operations,” and that “trading takes place in a decentralized environment based on private networks and shared technological infrastructure.” That reality made standard regulatory tools difficult to apply without significant modification.
Transactions among institutional VASPs settle without a central intermediary organizing trades. This decentralized dynamic across private networks creates real challenges for monitoring and reporting.
The Central Bank recognized early that a tailored approach was necessary here. As a result, regulators studied the sector carefully before committing to a formal framework.
Brazil’s national revenue service, Receita Federal, is also preparing related measures. It is reportedly working on a 3.5% tax targeting stablecoin flows used as dollar-pegged payment proxies.
That proposal adds another layer to Brazil’s evolving digital asset policy. Both developments reflect a coordinated push toward broader crypto market governance.
The institutional VASP framework still has time to develop before the 2027 deadline arrives. Market participants and regulators will likely engage further as specific rules take shape.
Brazil’s methodical, consultation-driven approach continues to attract attention across the global crypto industry.

Ripple’s XRP joined the rest of the market in the past day, with another crash displaying continued weakness within a broader descending structure, as upside attempts repeatedly fail to generate sustained momentum. The price is now trading within a clearly defined range, awaiting a decisive breakout to determine the next directional move.
Ripple Price Analysis: The Daily Chart
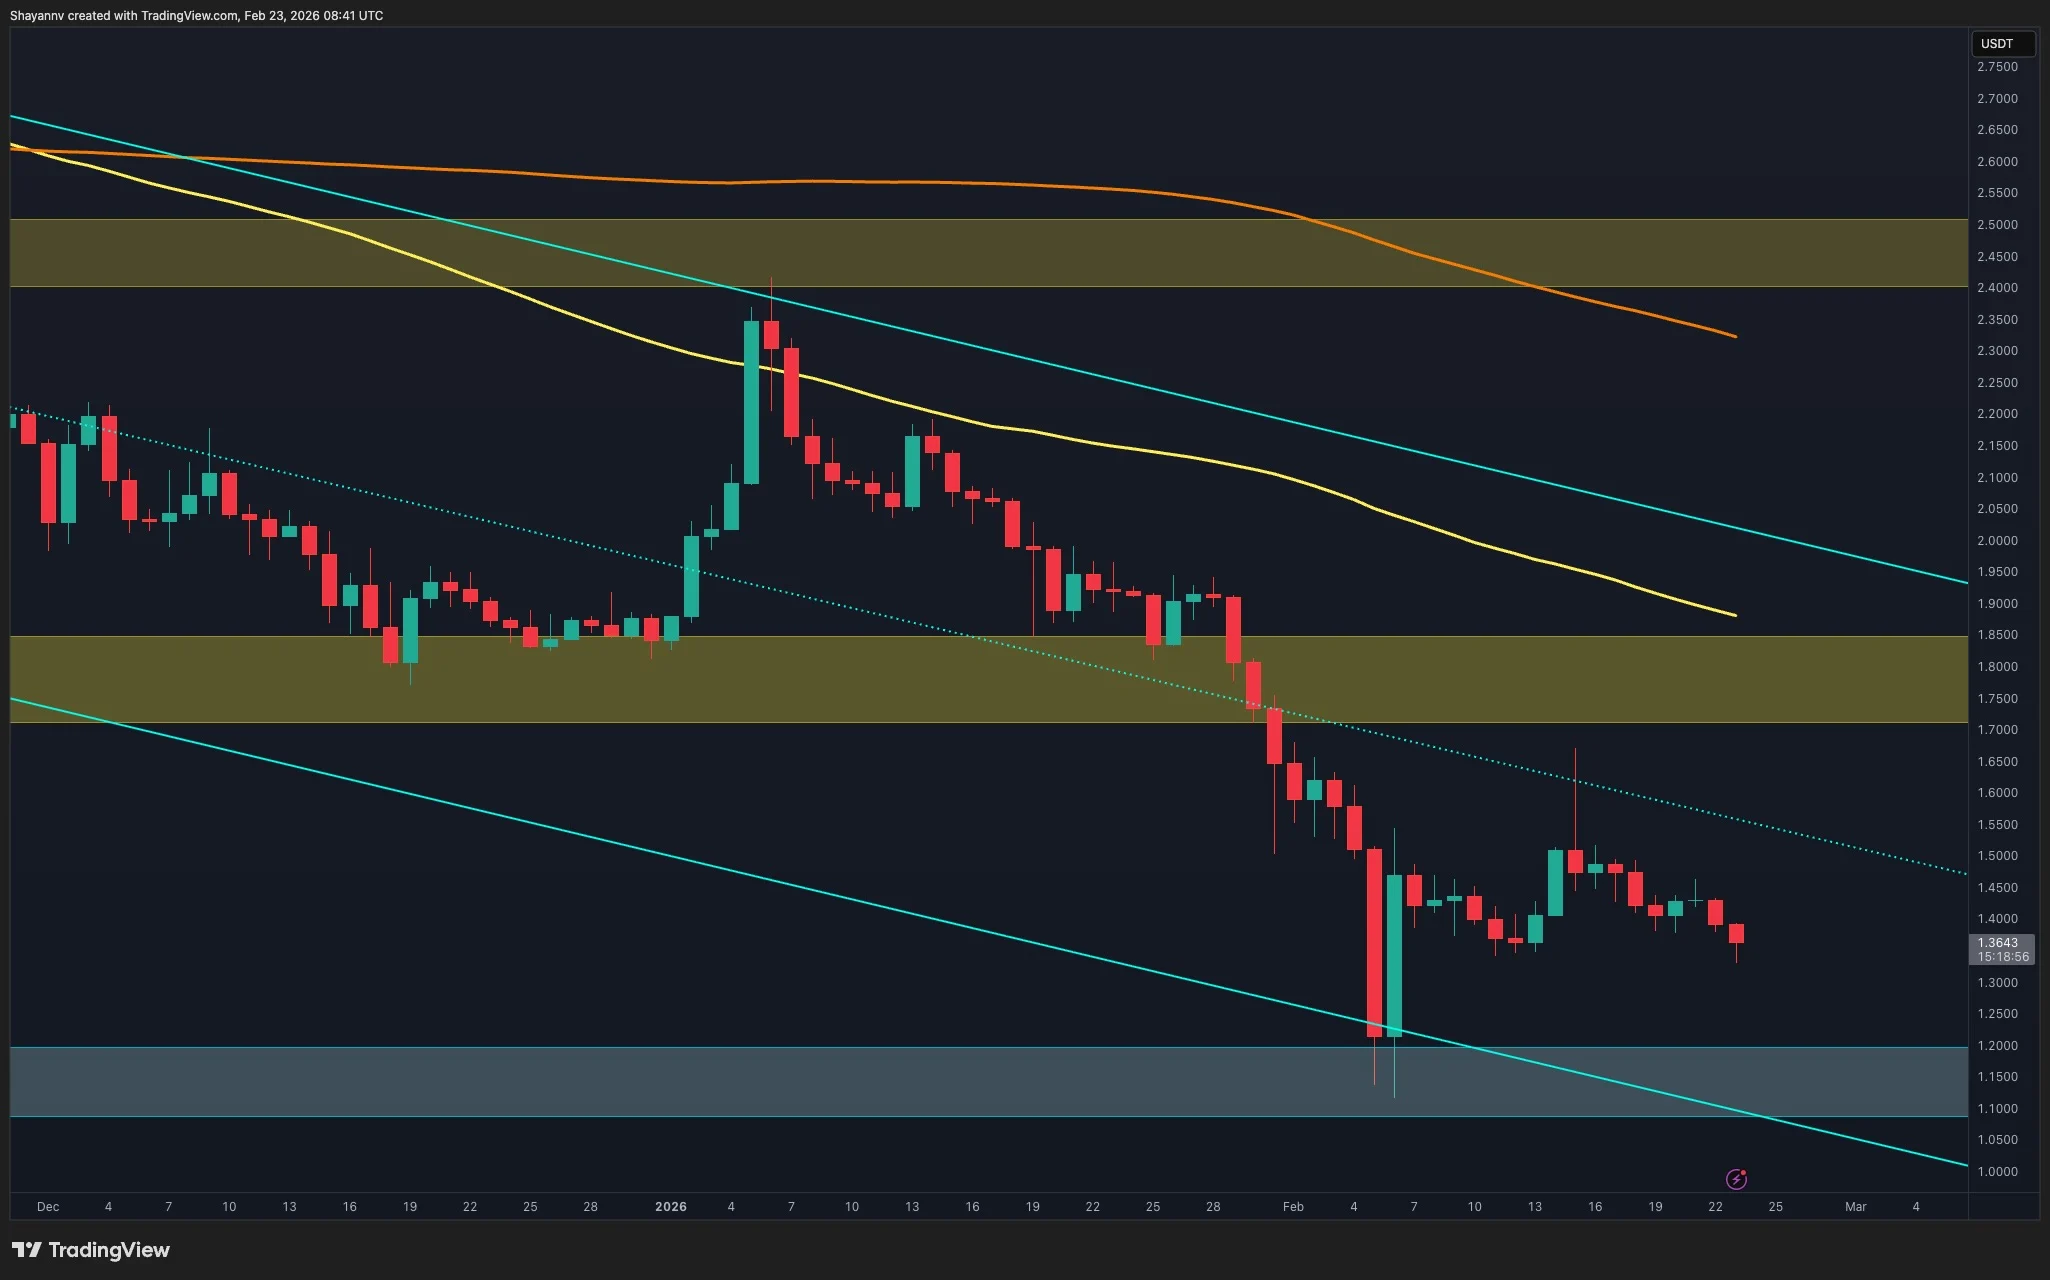
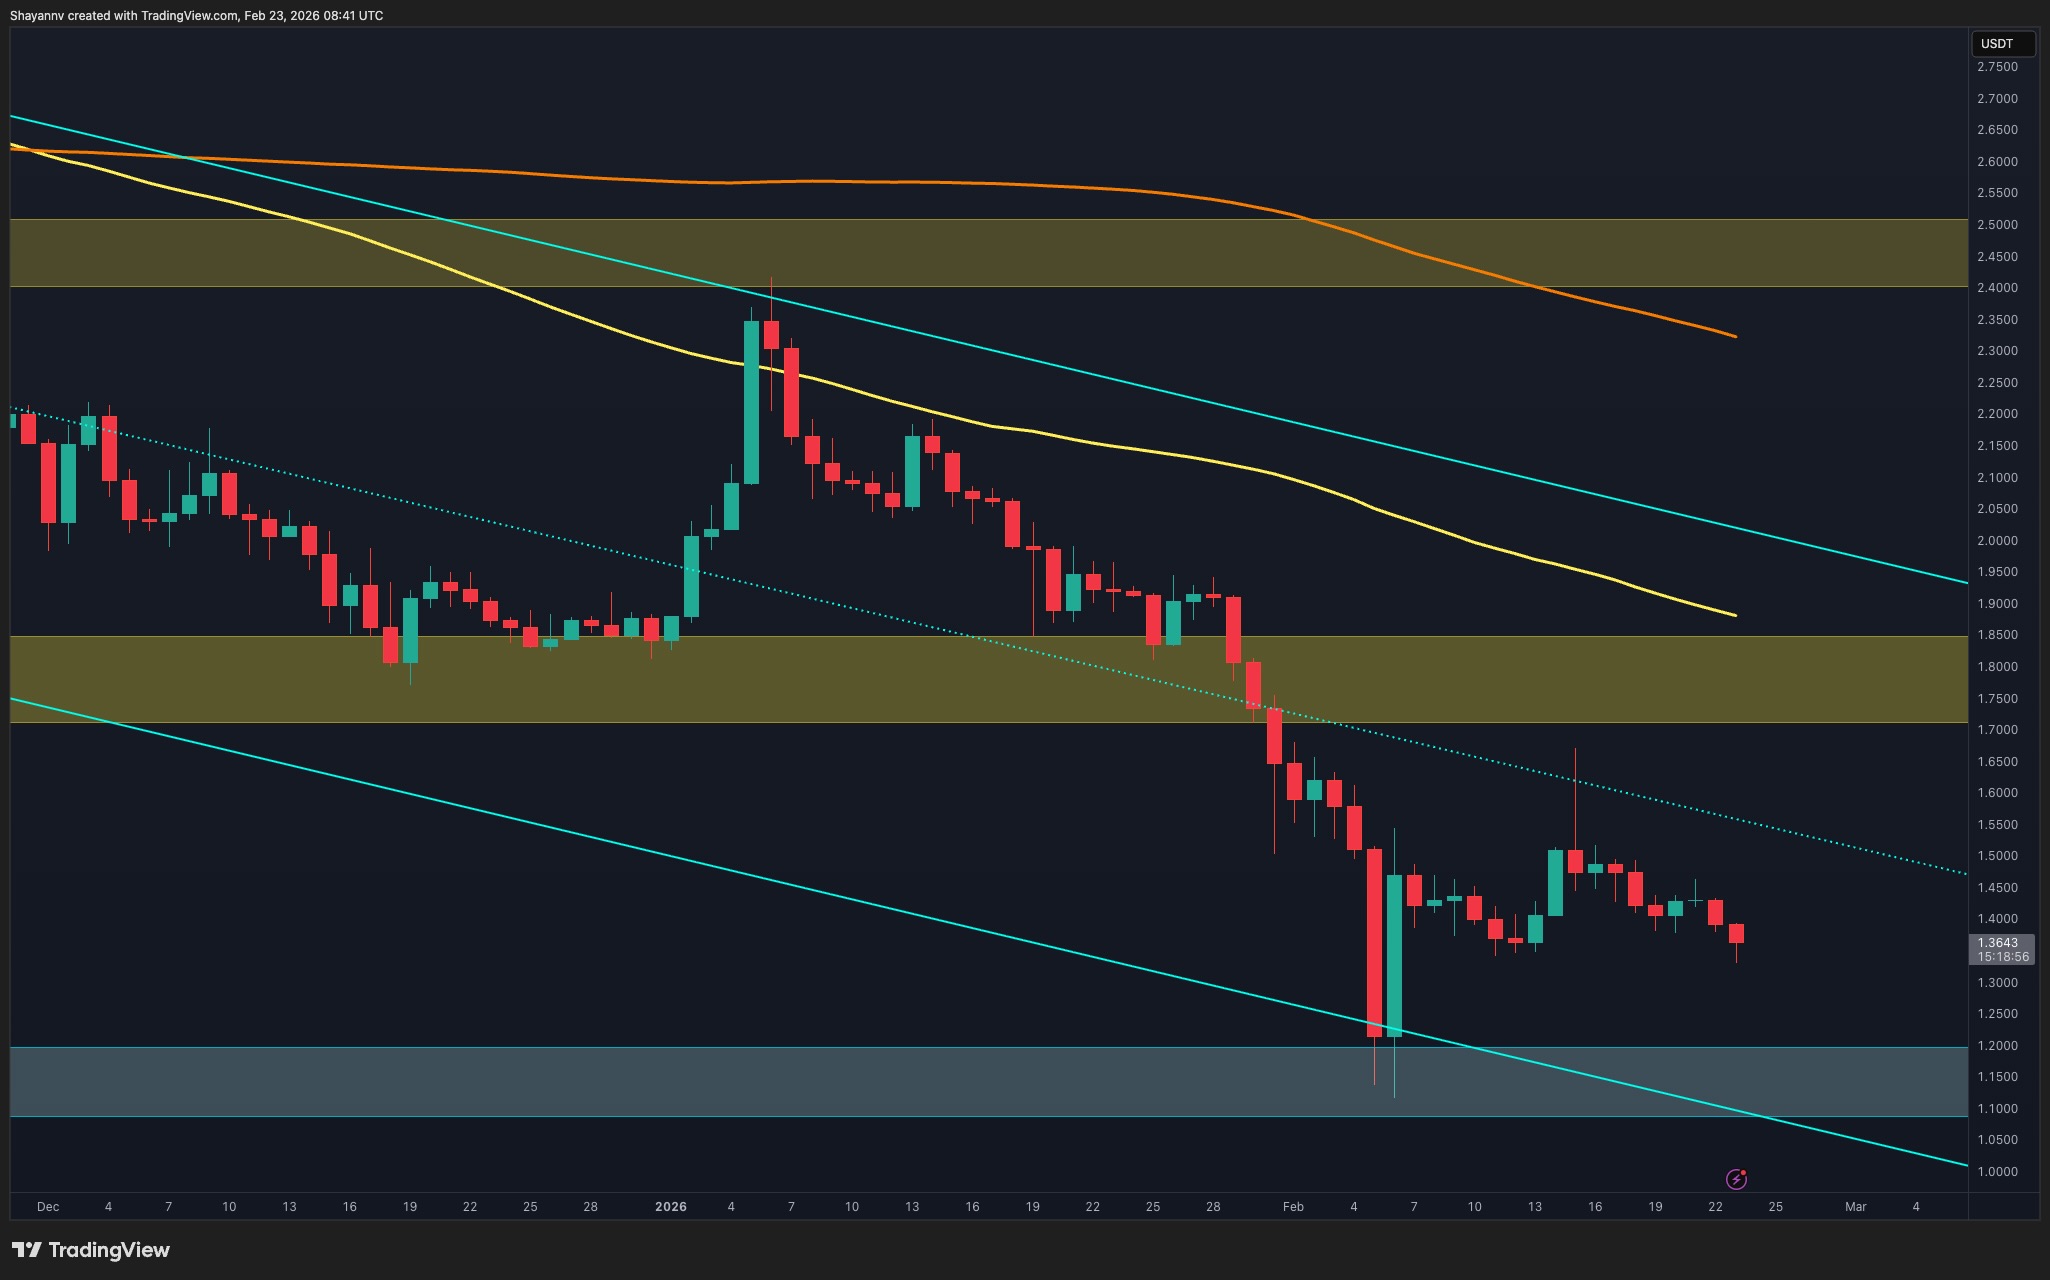
On the daily timeframe, XRP attempted to break above the channel’s middle boundary of $1.60 but failed to sustain the move. The brief push beyond this midline resulted in a liquidity sweep, where buy-side liquidity was taken before sellers stepped back in and drove the asset lower. This false breakout highlights the presence of supply overhead and confirms that bullish momentum remains fragile.
Following the rejection, the price rotated back into the established range and continues to fluctuate between the upper supply zone and the lower demand base. The structure now suggests ongoing consolidation rather than immediate trend reversal. Unless XRP can decisively reclaim and hold above the channel’s middle boundary, the market is likely to remain range-bound, with liquidity hunts on both sides shaping short-term volatility.
XRP/USDT 4-Hour Chart
On the 4-hour timeframe, XRP remains structurally bearish, trading inside a well-defined descending structure. After the failed daily breakout and liquidity sweep, the price resumed its downward trajectory and continues to form lower highs and lower lows within the channel boundaries.
The recent bounce from the lower demand zone near the $1.10–$1.20 region was sharp but corrective in nature. The asset is now consolidating around the $1.35–$1.40 area, which previously acted as intraday support.
As long as XRP remains below the channel’s mid-structure and the $1.50 zone, upside attempts are likely to face selling pressure. A move toward the $1.50–$1.55 supply region would be considered a corrective retest unless accompanied by strong momentum and a structural break. On the downside, losing the current support cluster would expose the lower boundary of the channel and increase the probability of another liquidity sweep below recent lows.

Binance Free $600 (CryptoPotato Exclusive): Use this link to register a new account and receive $600 exclusive welcome offer on Binance (full details).
LIMITED OFFER for CryptoPotato readers at Bybit: Use this link to register and open a $500 FREE position on any coin!
Disclaimer: Information found on CryptoPotato is those of writers quoted. It does not represent the opinions of CryptoPotato on whether to buy, sell, or hold any investments. You are advised to conduct your own research before making any investment decisions. Use provided information at your own risk. See Disclaimer for more information.
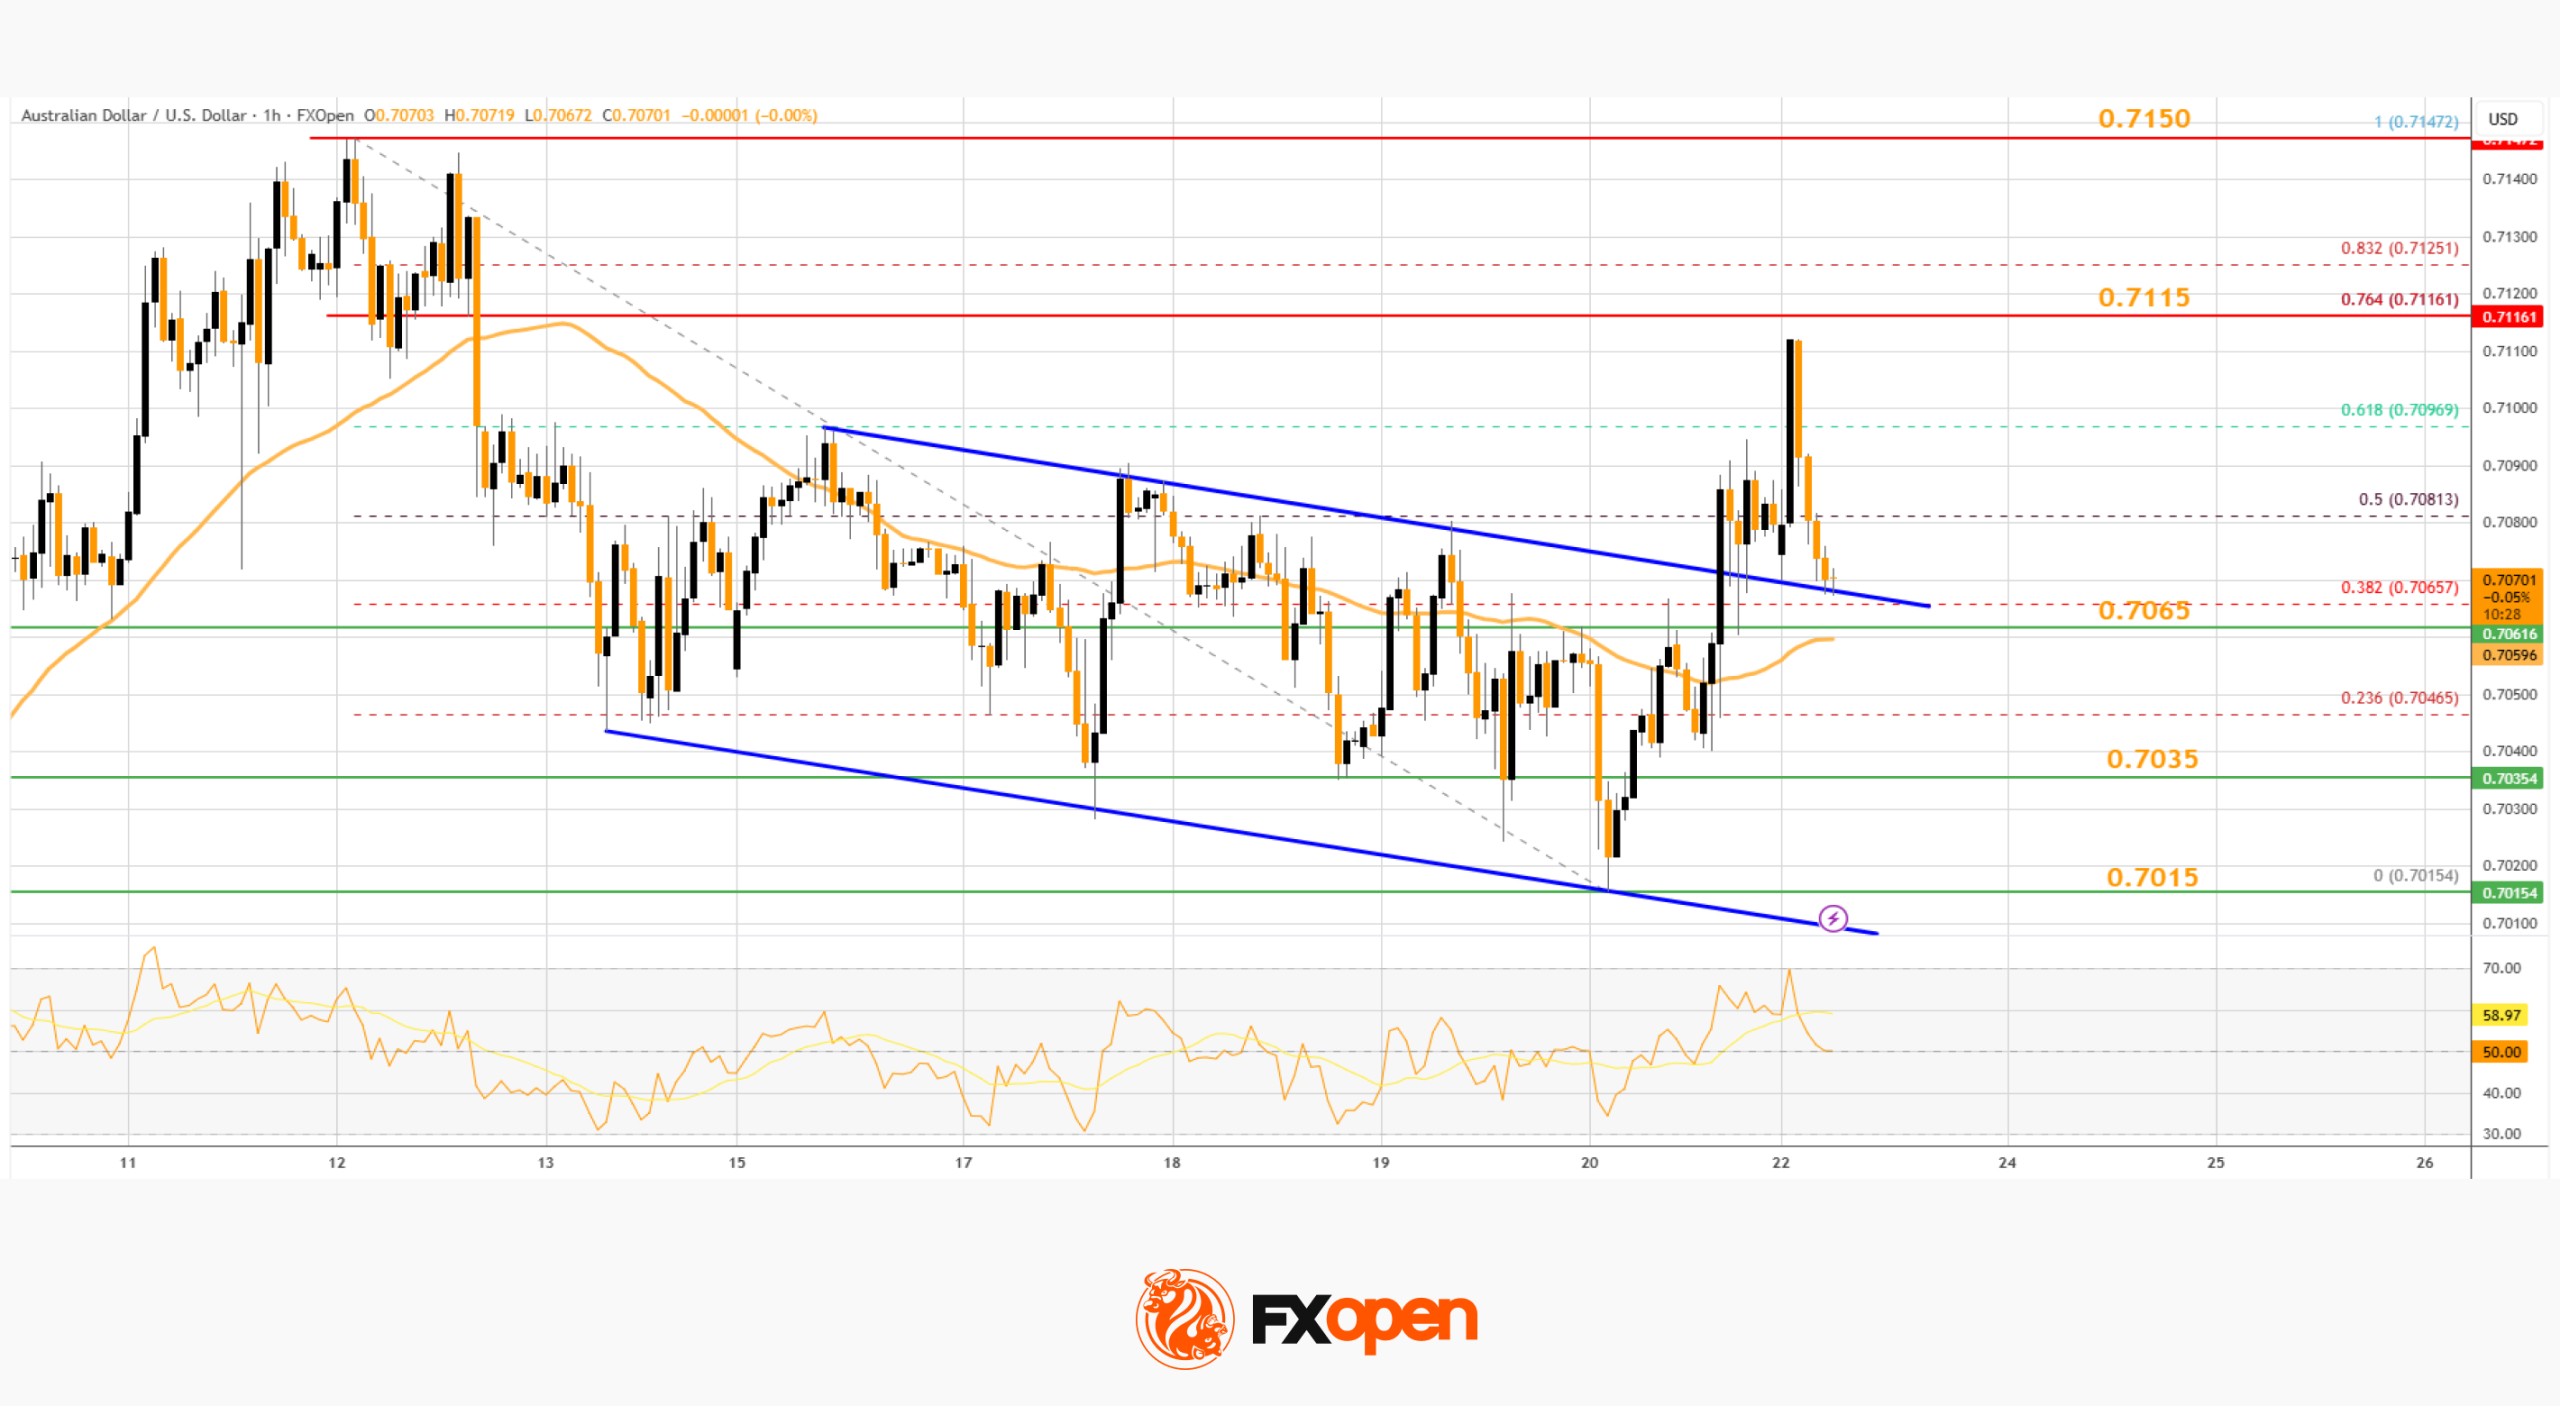
AUD/USD is attempting a fresh increase from 0.7015. NZD/USD is consolidating and could aim for a move above 0.6000 in the short term.
Important Takeaways for AUD/USD and NZD/USD Analysis Today
· The Aussie Dollar remained supported above 0.7000 and recovered losses against the US Dollar.
· There was a break above a key declining channel with resistance at 0.7070 on the hourly chart of AUD/USD at FXOpen.
· NZD/USD is consolidating above 0.5965 and 0.5950.
· There was a break above a declining channel with resistance at 0.5960 on the hourly chart of NZD/USD at FXOpen.
AUD/USD Technical Analysis
On the hourly chart of AUD/USD at FXOpen, the pair formed a base above 0.7000. The Aussie Dollar started a decent increase above 0.7035 against the US Dollar to enter a short-term positive zone.
There was a break above a key declining channel with resistance at 0.7070. The bulls even pushed the pair above the 61.8% Fib retracement level of the downward move from the 0.7147 swing high to the 0.7015 low and the 50-hour simple moving average.
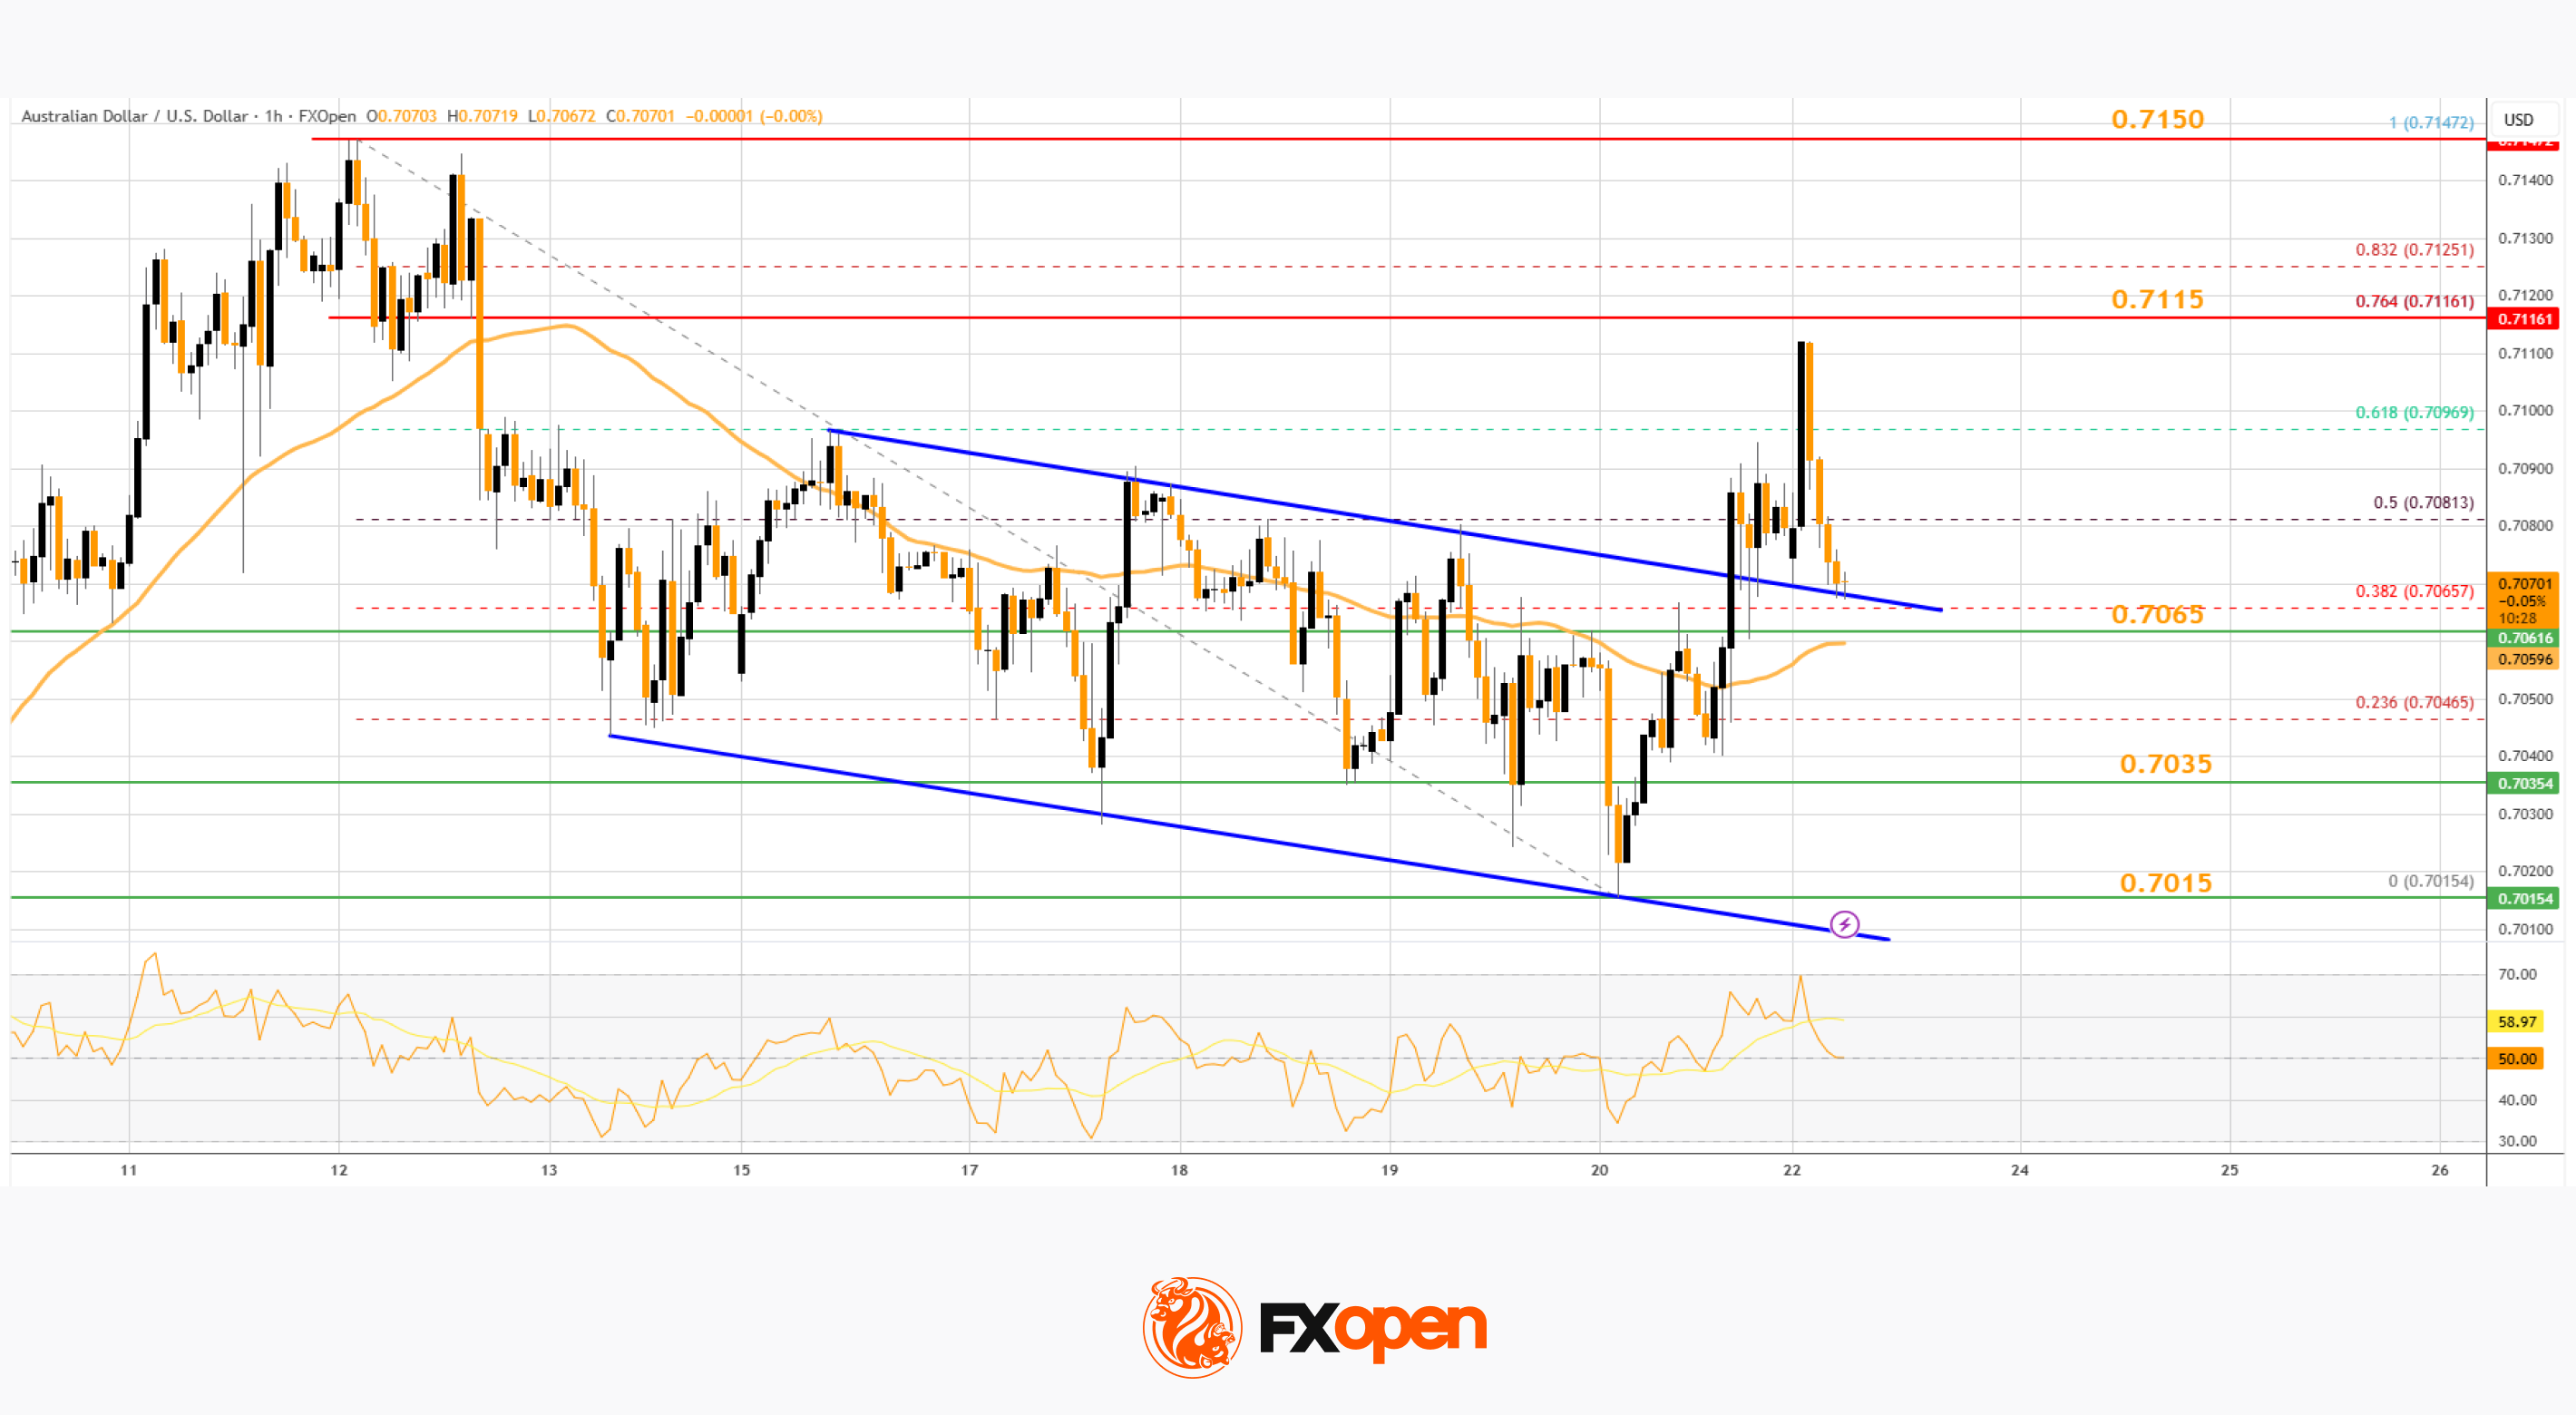
The AUD/USD chart indicates that the pair could struggle to clear the 76.4% Fib retracement at 0.7115. The first major hurdle for the bulls could be 0.7150.
An upside break above 0.7150 might send the pair further higher. The next major target might be 0.7220. Any more gains could clear the path for a move toward 0.7300. If there is no close above 0.7115, the pair might start a fresh decline.
Immediate bid zone could be near 0.7065 and the 50-hour simple moving average. The next area of interest is 0.7035. If there is a downside break below 0.7035, the pair could extend its decline toward 0.7015. Any more losses might signal a move toward 0.6965.
NZD/USD Technical Analysis
On the hourly chart of NZD/USD on FXOpen, the pair also followed AUD/USD. The New Zealand Dollar failed to stay above 0.6020 and corrected gains against the US Dollar.
The pair dipped below 0.5965 and the 50-hour simple moving average and 0.5830. A low was formed at 0.5937, and the pair is now attempting to recover losses. There was a move above the 50% Fib retracement level of the downward move from the 0.6052 swing high to the 0.5937 low.
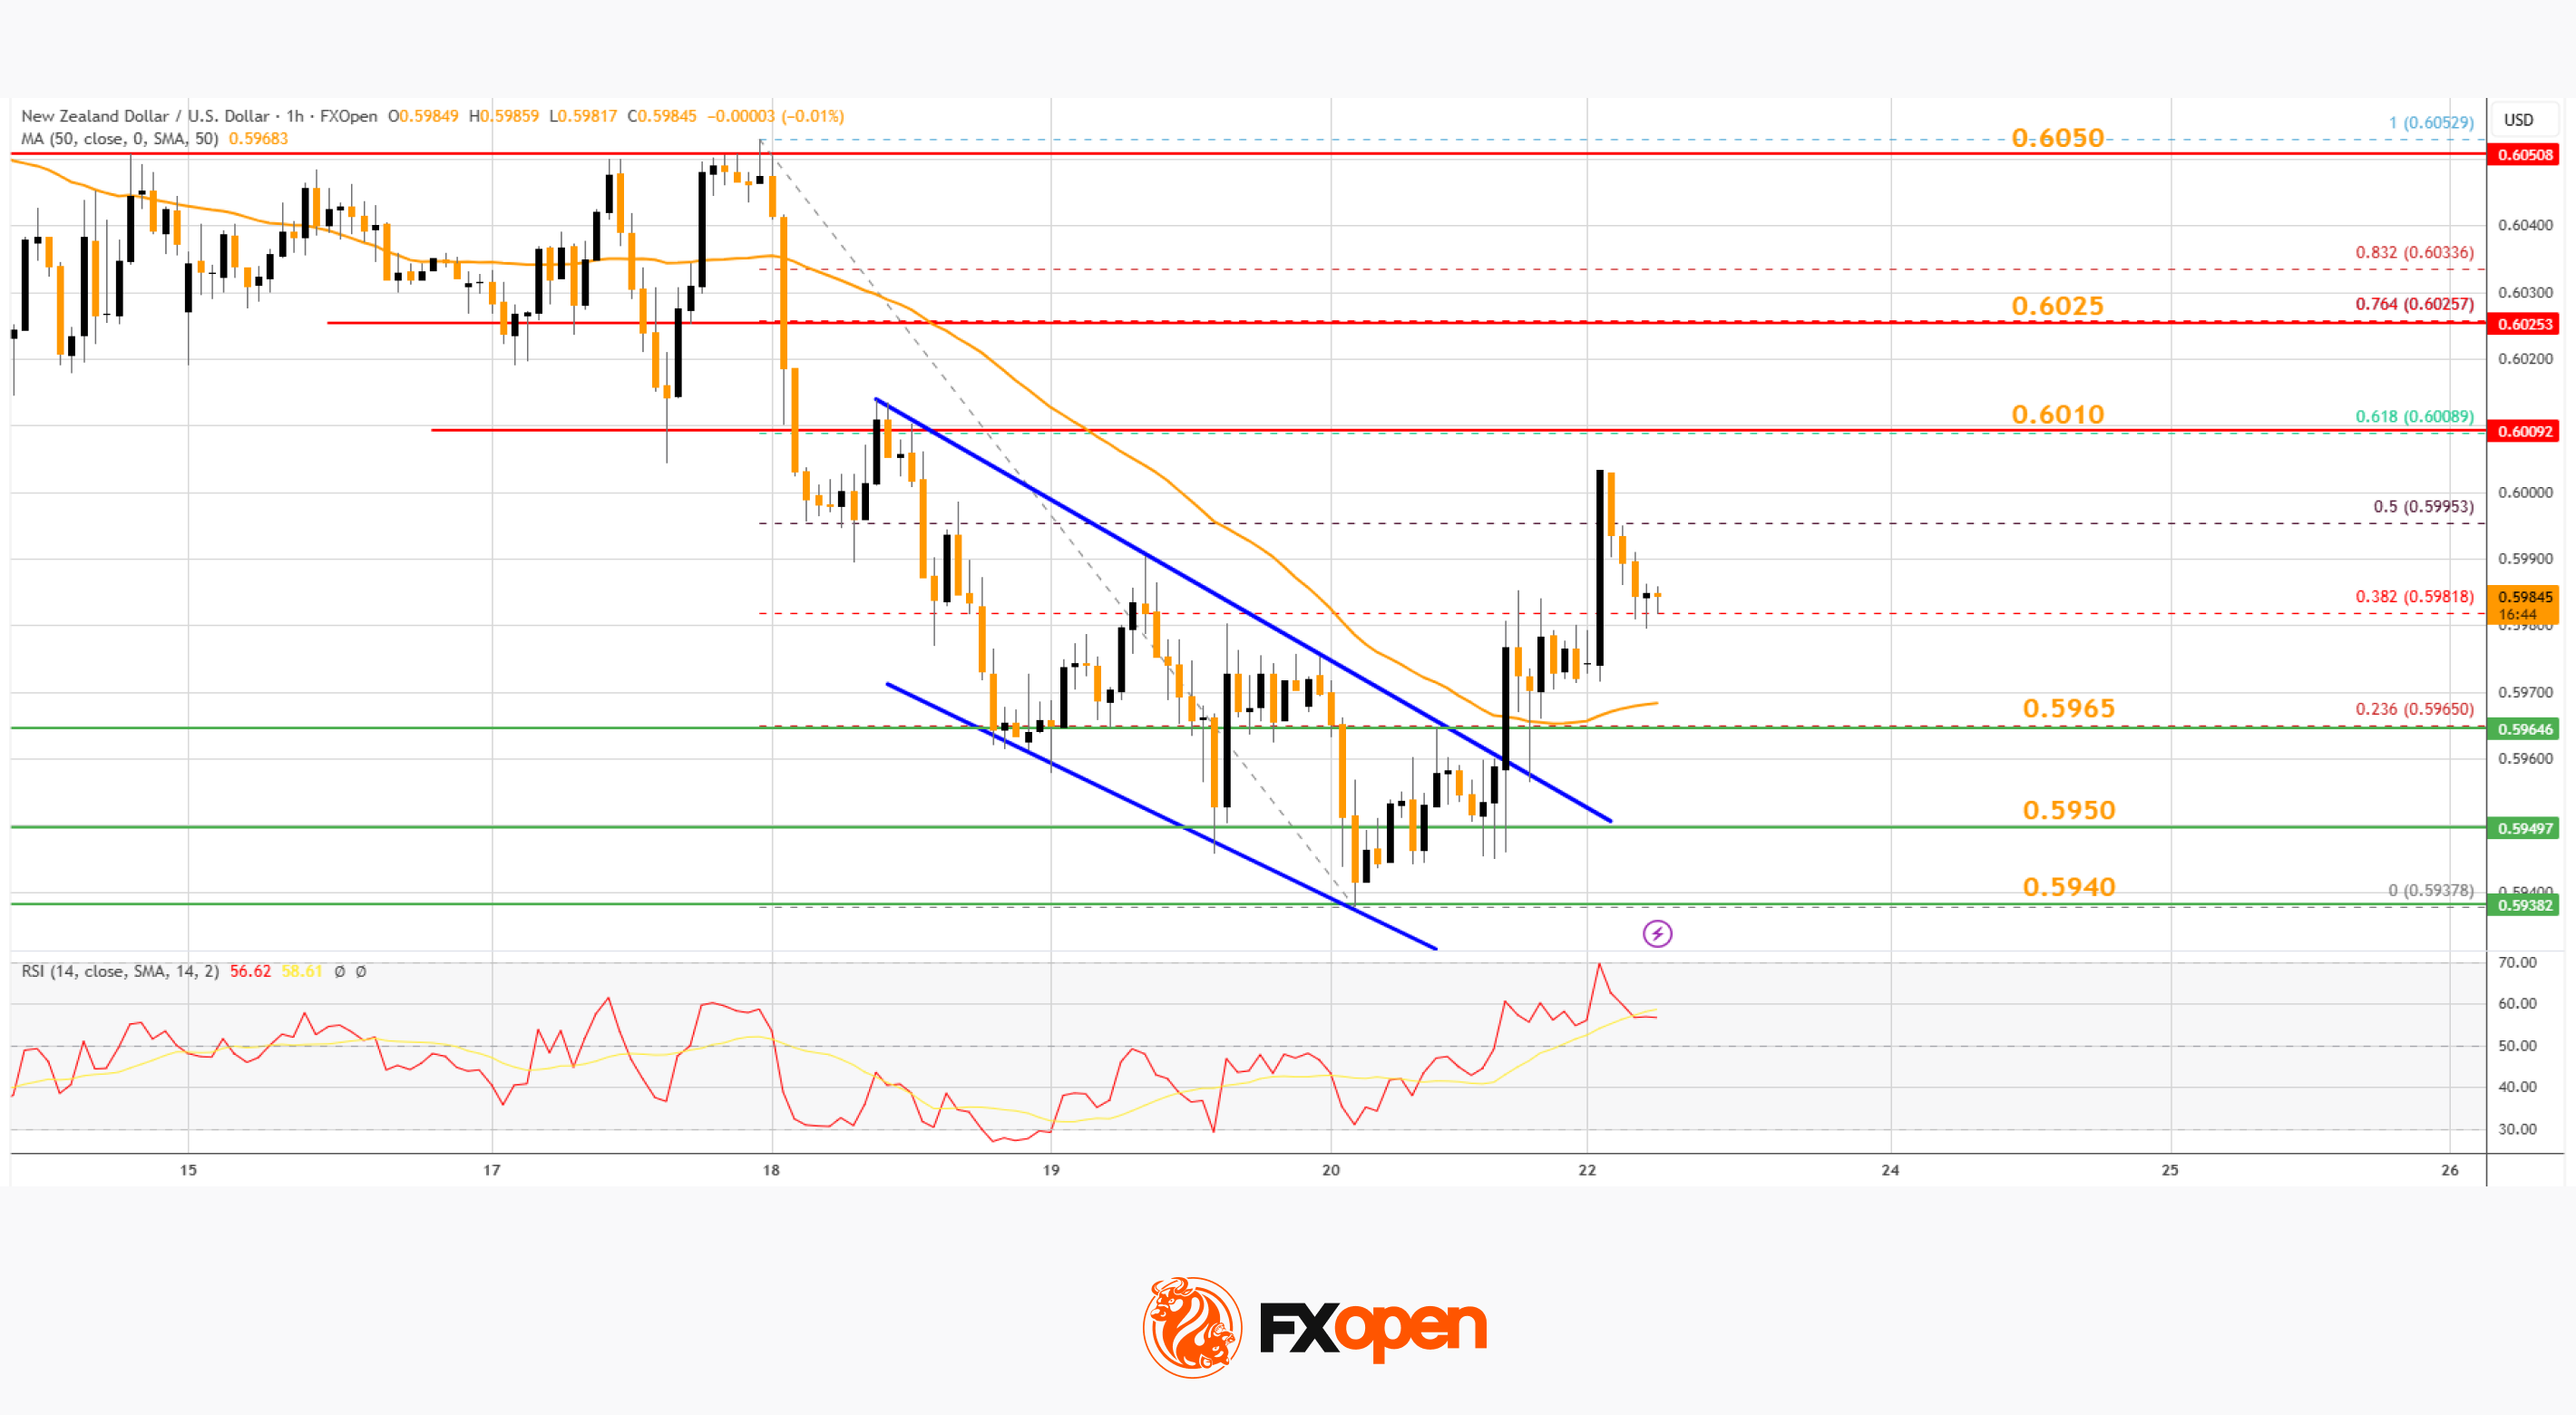
Besides, there was a break above a declining channel with resistance at 0.5960. The NZD/USD chart suggests that the RSI is above 50, signaling a short-term positive bias. On the upside, the pair is facing resistance near 0.6010.
The next major hurdle for buyers could be near the 76.4% Fib retracement at 0.6025. A clear move above 0.6025 might even push the pair toward 0.6050. Any more gains might clear the path for a move toward the 0.6122 pivot zone in the coming sessions.
On the downside, there is support forming near 0.5965 and the 50-hour simple moving average. If there is a downside break below 0.5965, the pair might slide toward 0.5940. Any more losses could lead NZD/USD into a bearish zone to 0.5900.
Trade over 50 forex markets 24 hours a day with FXOpen. Take advantage of low commissions, deep liquidity, and spreads from 0.0 pips (additional fees may apply). Open your FXOpen account now or learn more about trading forex with FXOpen.
This article represents the opinion of the Companies operating under the FXOpen brand only. It is not to be construed as an offer, solicitation, or recommendation with respect to products and services provided by the Companies operating under the FXOpen brand, nor is it to be considered financial advice.


The week will be dominated by earnings reports from crypto-related companies, though the repercussions of the U.S. Supreme Court’s decision on tariffs on Friday are also likely to ripple through markets.
Miners including MARA Holdings (MARA) and Hut 8 (HUT) are on the roster, and will fuel the conversation over diversification into high-performance computing centers and support for AI. Also on the AI front, Nvidia (NVDA), a maker of chips for the AI industry and the world’s largest publicly traded company by market capitalization, reports earnings on Wednesday.
Circle Internet (CRCL), issuer of the second-largest stablecoin, USDC, is also on Wednesday’s list.
In the wider economy, a number of U.S. Federal Reserve policymakers are set to make speeches in the coming days. And don’t forget the U.S.-Iran talks, which resume on Geneva on Thursday even as both sides build up their military preparations.
What to Watch
(All times ET)
- Crypto
- Macro
- Feb. 23, 8:00 a.m.: Fed Governor Christopher Waller gives a speech on the economic outlook at the National Association for Business Economics.
- Feb. 23, 10:00 a.m.: U.S. Dallas Fed Manufacturing Index for February (Prev. -1.2)
- Feb. 24, 8:15 a.m.: U.S. ADP employment change weekly (Prev. 10.25K)
- Feb. 24, 9 a.m.: S&P Case-Shiller home price YoY (Prv. 1.4%)
- Feb. 24, 10:00 a.m.: U.S. CB consumer confidence est. 86 (Prev. 84.5)
- Feb. 24, 1:00 p.m.: U.S. money supply for January (M2) (Prev. $22.4T)
- Feb. 25, 5:00 a.m.: Eurozone core inflation rate YoY final est. 2.2% (Prev. 2.3%)
- Feb. 25, 4:30 p.m.: U.S. Fed balance sheet for week ending Feb. 25 (Prev. $6.61T)
- Feb. 25, 8:30 p.m.: Bank of Japan Board Member Hajime Takata gives a speech at a meeting with local leaders in Kyoto
- Feb. 26, 8:30 a.m.: U.S. initial jobless claims for week ending Feb. 21 (Prev. 206K)
- Feb. 26, 10:00 a.m.: U.S. Fed Vice Chair for Supervision Michelle Bowman to testify before the U.S. Senate Committee on Banking, Housing and Urban Affairs.
- Feb. 26, 6:50 p.m.: Japan Tokyo core CPI YoY for February est. 2% (Prev. 2%)
- Feb. 27, 8:00 a.m.: German inflation rate YoY prelim. for February (Prev. 2.1%)
- Feb. 27, 8:30 a.m.: U.S. PPI MoM for January est. 0.3% (Prev. 0.5%); Core PPI MoM est. 0.3% (Prev. 0.7%)
- Feb. 27, 8:30 a.m.: U.S. PPI YoY for January est. 2.9% (Prev. 3%)
- Feb. 27, 8:30 a.m.: Canada GDP growth rate annualized for Q4 (Prev. 2.6%); QoQ (Prev. 0.6%)
- Earnings (Estimates based on FactSet data)
- Feb. 24: Cipher Mining (CIFR), pre-market, $0.03
- Feb. 25: Circle Internet (CRCL), pre-market, $0.16
- Feb. 25: Core Scientific (CORZ), post-market, -$0.18
- Feb. 25: Hut 8 (HUT), pre-market, -$0.13
- Feb. 25: Nvidia (NVDA), post-market, $1.50
- Feb. 26: MARA Holdings (MARA), post-market, -$0.11
- Feb 26: TeraWulf (WULF), post-market, -$0.15
- Feb. 26: American Bitcoin (ABTC), pre-market, $0.01
- Feb. 26: Figure Technologies (FIGR), post-market,$0.20
- Feb. 26: Sui Group (SUIG), post-market, $0.01
- Feb. 26: Block (XYZ), post-market, $0.49
Token Events
- Governance votes & calls
- Feb. 23: DYdX Foundation to host its February analyst call.
- Feb. 26: Lido DAO to host a tokenholder update call.
- Feb. 26: Maple Finance to host an investor call.
- Uniswap DAO is voting to enable protocol fees across all V3 pools and eight layer-2 networks. Voting ends Feb. 23.
- ZKsync DAO is voting to allocate $4.1 million in ZK tokens for the 2026 audit reimbursement program (ZARP v2) to fund forward-looking protocol security audits and retroactively reimburse eligible 2025 costs. Voting ends Feb. 23.
- GMX DAO is voting to neutralize CEX supply overhang by restructuring liquidity, setting a temporary $5 buy-wall, and pausing staking rewards until the token price reaches $90. Voting ends Feb. 24.
- The Sandbox DAO is voting to pause operations and transfer control to the project team to realign with “The Sandbox 3.0”. The proposal is currently facing ~98% opposition from voters. Voting ends Feb. 25.
- Decentraland DAO is voting to create a customizable “Windfall Lotto Scene” template for land owners. Voting ends Feb. 25.
- Unlock DAO is voting to delegate 2 million UP from the treasury to seven active community members to reliably secure a quorum on future proposals. Voting ends Feb. 26.
- Unlocks
- Feb. 25: Humanity (H) to unlock 4.37% of its circulating supply worth $17.71 million.
- Feb. 28: Grass (GRASS) to unlock 13.15% of its circulating supply worth $10.09 million.
- Feb. 28: Jupiter (JUP) to unlock 7.94% of its circulating supply worth $39.34 million.
- March 1: to unock 1.13% of its circulating supply worth $40.97 million.
- Token Launches
Conferences
The final week of February 2026 is shaping up to be a pivotal stretch for the altcoin market, with key technical setups, token unlocks, and network upgrades driving investor focus. While broader crypto sentiment remains cautious, some tokens still show potential for gains.
BeInCrypto has analysed three such altcoins that the investors should watch as February comes to an end.
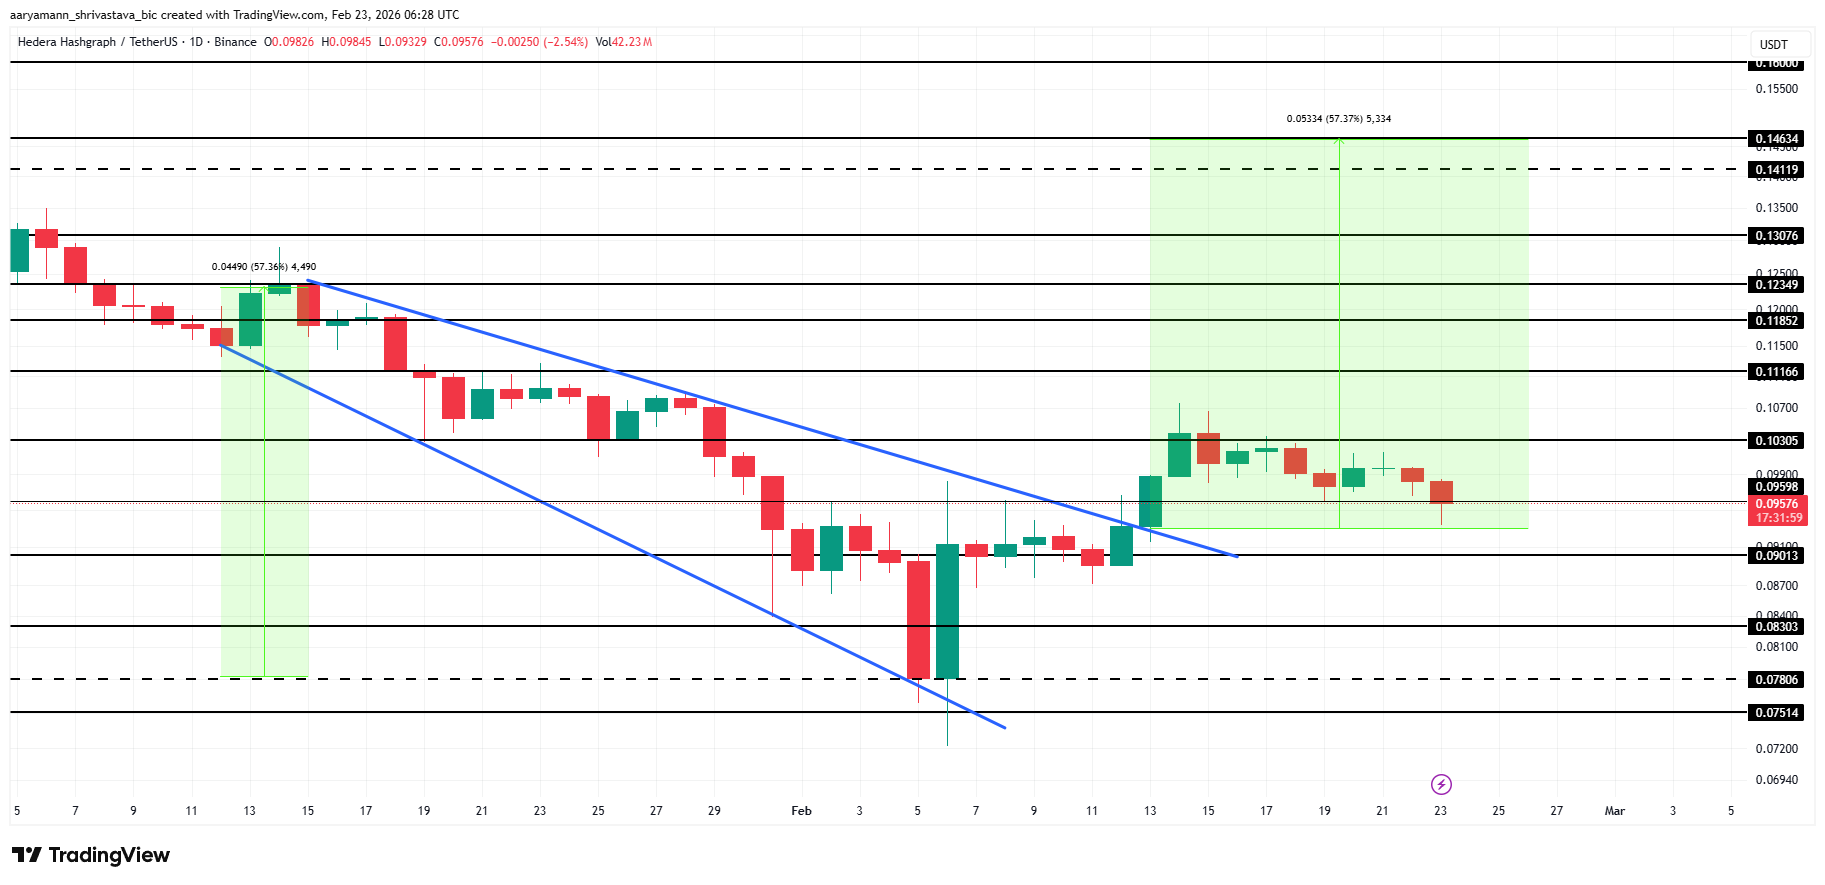
Hedera (HBAR)
HBAR price is trading at $0.0959 at the time of writing, holding just above immediate support at the same level. The altcoin recently broke out of a bullish technical pattern but has not confirmed the move. Weak crypto market momentum has limited follow-through buying.
Muted market sentiment has kept HBAR subdued despite recent technical strength. However, Hedera announced in December 2025 a shift from cloud bucket storage to block nodes to improve network data access. Node operators have three months starting in February before the June upgrade. Infrastructure improvements can influence long-term token valuation.

If sentiment improves, HBAR price could break above $0.1030 and advance toward the projected 57% breakout target. Sustained buying would confirm bullish continuation. However, failure to gain momentum could push HBAR below $0.0901 support. A decline toward $0.0830 would invalidate the bullish outlook.
Sui (SUI)
SUI is a key cryptocurrency to watch this week as 53.82 million tokens are set to unlock. The release represents 0.54% of the total supply and is valued at more than $47.2 million. Token unlock events can increase volatility as additional circulating supply impacts short-term price action.
SUI price is trading at $0.891, while the Money Flow Index sits in the oversold zone. Oversold conditions often signal selling exhaustion and potential reversal setups. If investors absorb the new supply, SUI could exit its three-week consolidation range and break above $1.060, targeting $1.326.
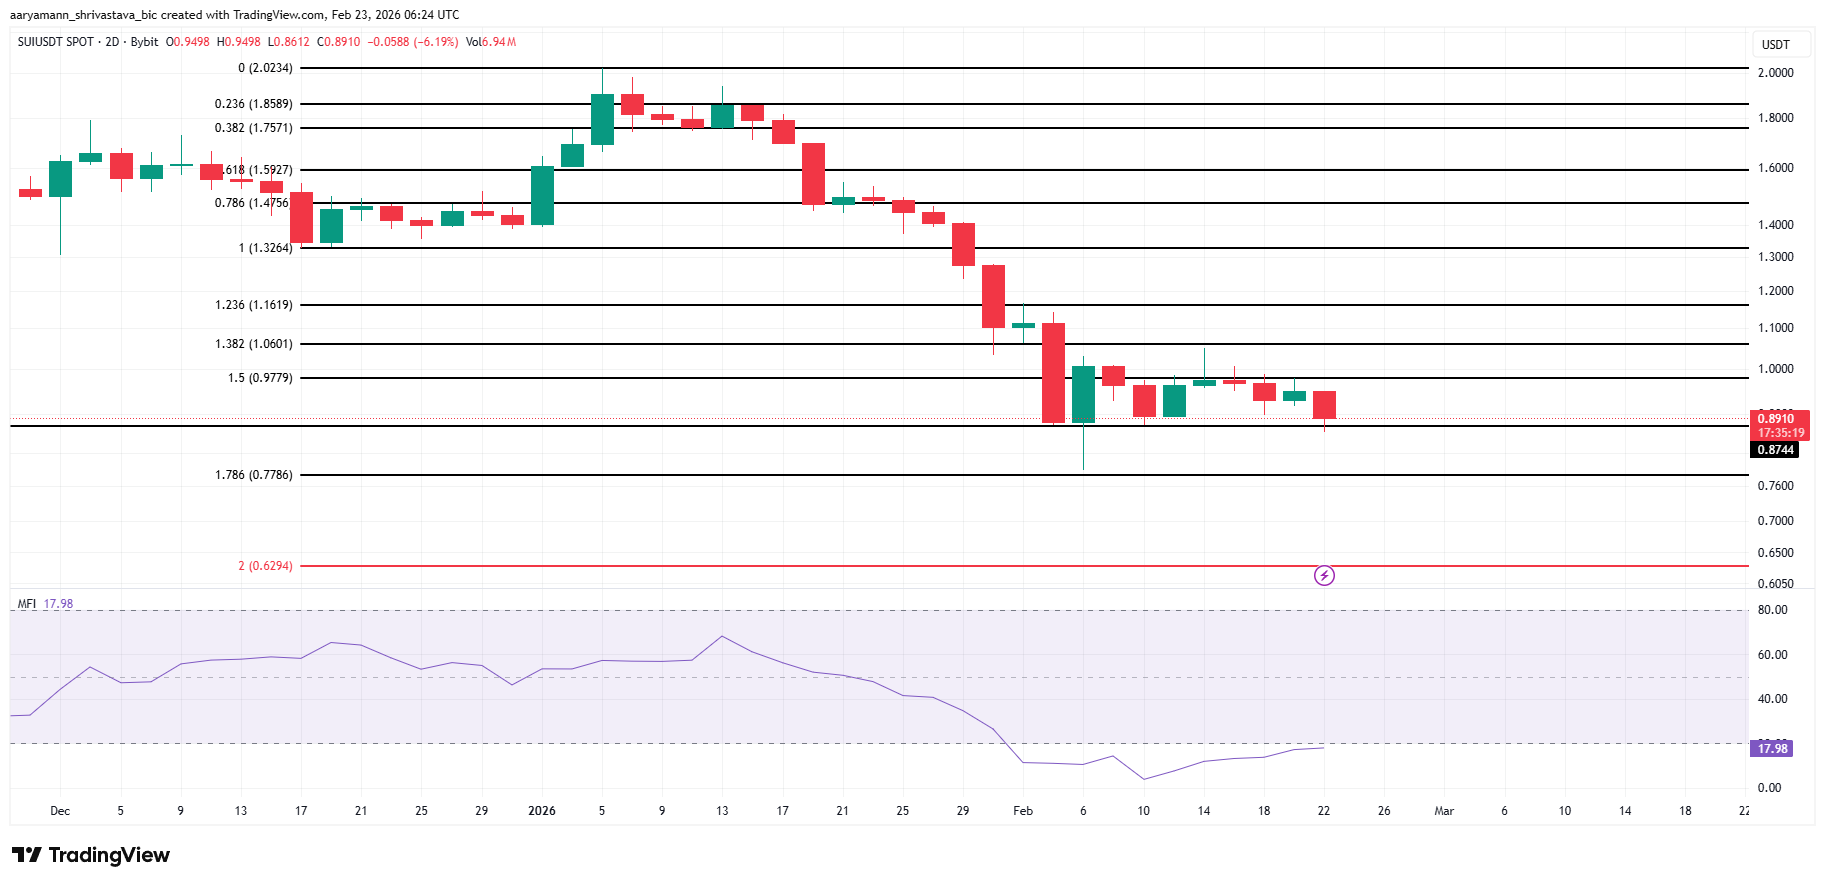
However, downside risks remain if demand fails to match incoming supply. Losing the $0.874 support would signal renewed bearish pressure. In that case, the SUI price could decline toward $0.778. A deeper correction may extend losses to $0.629 if broader crypto market sentiment weakens further.
Kite (KITE)
KITE has consistently printed new all-time highs throughout February, drawing strong trader attention. The altcoin currently trades at $0.257 after reaching a fresh ATH of $0.288 last week. Sustained buying momentum and elevated trading volume have supported its upward price trajectory.
KITE remains roughly 12.3% below its recent peak, keeping bullish momentum intact. Technical structure suggests continued upside if capital inflows persist. A decisive breakout above $0.288 could attract additional momentum traders. In that scenario, KITE price may extend gains toward the next projected resistance at $0.328.
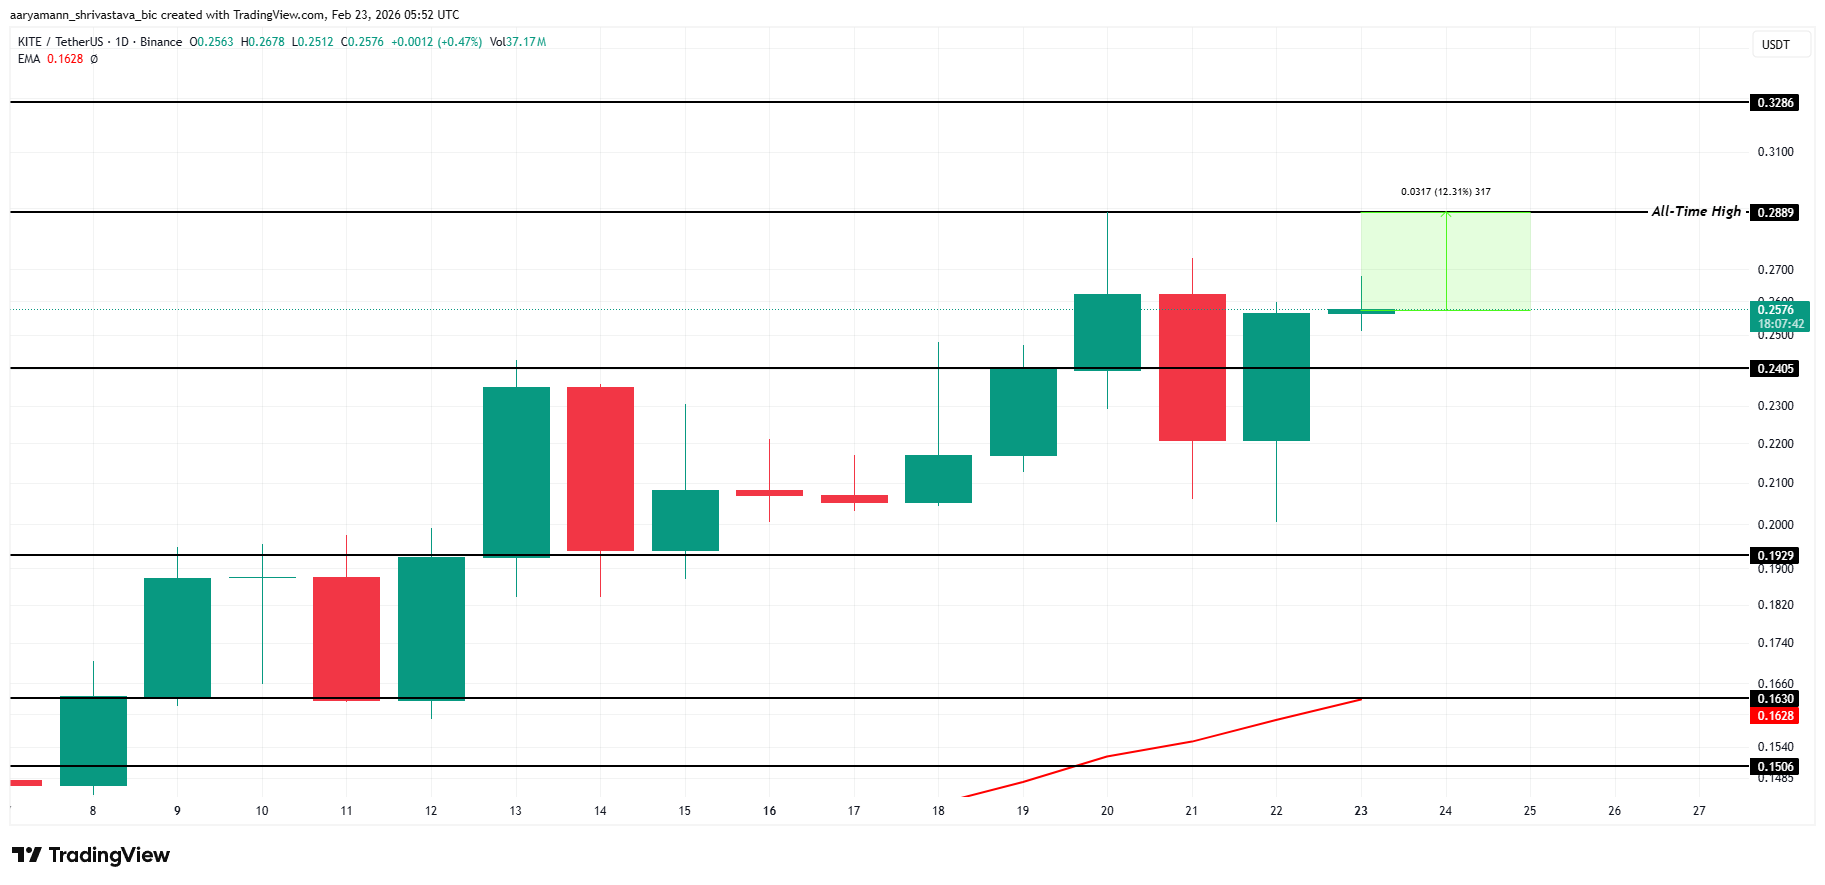
However, short-term profit booking could trigger corrective pressure. A decline below $0.240 would indicate weakening bullish control. The more critical level sits at $0.192 support. Losing that threshold would signal a broader trend reversal and increase the probability of an extended downside phase.

Currency markets opened on Monday with the US dollar under pressure, as traders assessed weekend developments related to US tariff policy. According to Reuters:
→ On Friday, the Supreme Court ruled that President Trump’s sweeping tariffs exceeded his authority.
→ In response, the US president criticised the court and introduced a blanket 15% import levy. Trump also insisted that higher-tariff agreements with trade partners should remain in force.
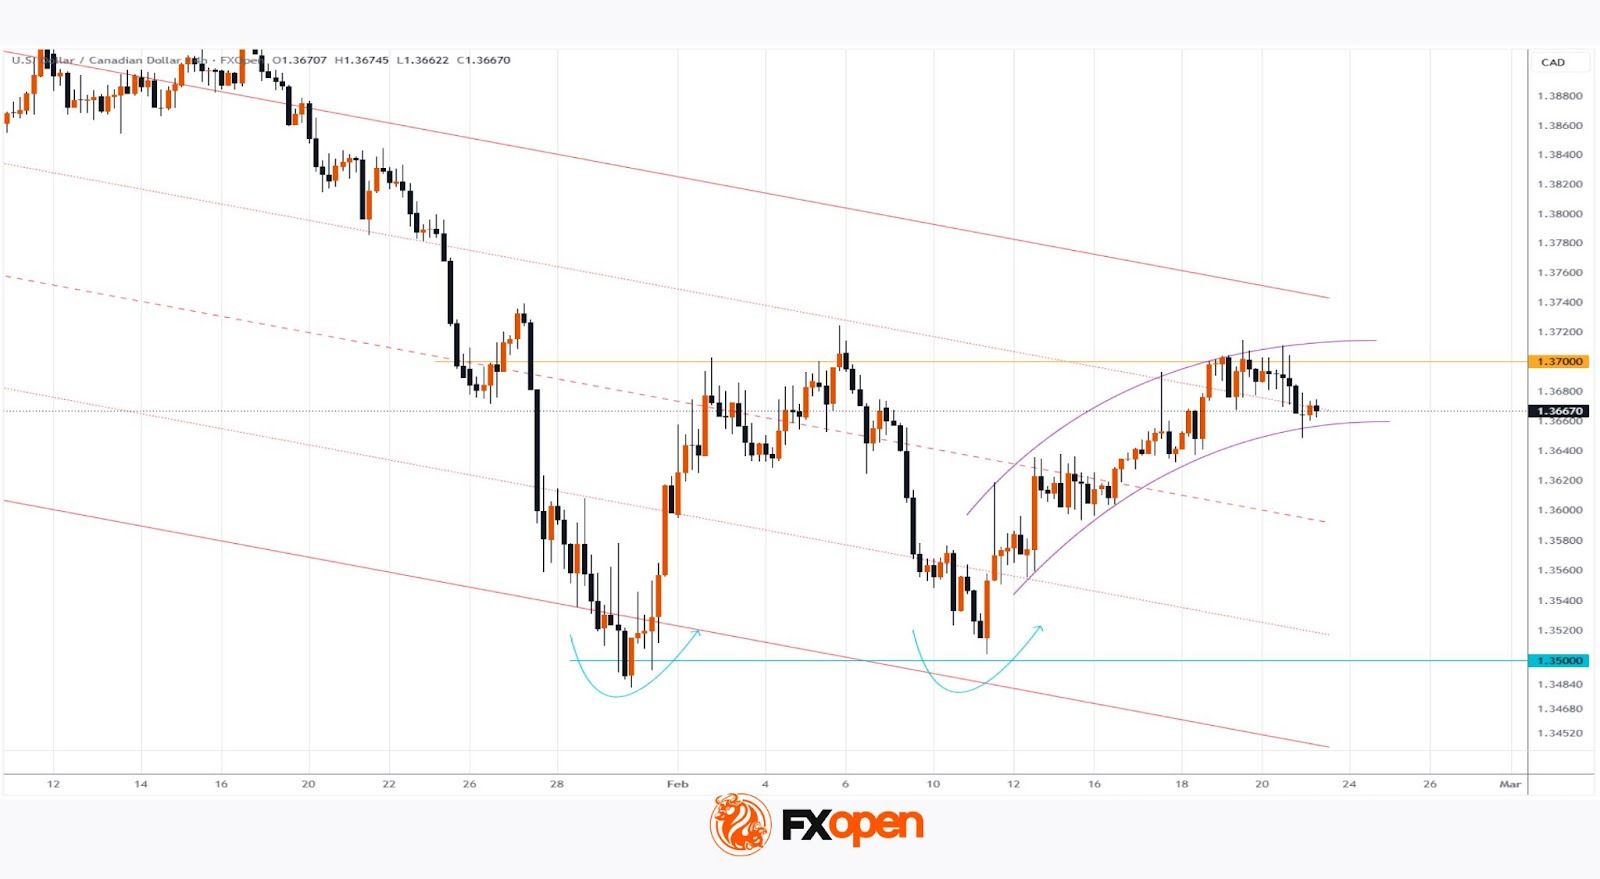
Against this backdrop, USD/CAD slipped below the 1.3660 level today. This comes despite the upward move observed since 11 February (marked by purple lines), which developed after Canadian inflation slowed from 2.7% to 2.4%. The weaker inflation data weighed on the Canadian dollar, as markets began pricing in the possibility of future interest rate cuts by the Bank of Canada.
Technical Analysis of the USD/CAD Chart
When analysing USD/CAD on 29 January (with the market trading near the psychological 1.3500 level), we:
→ highlighted the presence of a long-term descending channel;
→ noted that price was close to its lower boundary, which could act as support;
→ considered a rebound scenario.
Since then, USD/CAD has formed two bullish reversals near the 1.3500 area. However, on both occasions bullish momentum appeared to fade around 1.3700.
The current price action resembles a rounding top pattern, suggesting that sellers may soon attempt to regain control and push towards the lower purple boundary in an effort to resume the broader long-term downtrend.
Trade over 50 forex markets 24 hours a day with FXOpen. Take advantage of low commissions, deep liquidity, and spreads from 0.0 pips (additional fees may apply). Open your FXOpen account now or learn more about trading forex with FXOpen.
This article represents the opinion of the Companies operating under the FXOpen brand only. It is not to be construed as an offer, solicitation, or recommendation with respect to products and services provided by the Companies operating under the FXOpen brand, nor is it to be considered financial advice.
Crypto World
Missouri Introduces Bitcoin Strategic Reserve Fund Bill to Expand State-Level Crypto Holdings
TLDR:
- Missouri HB 2080 would create a Bitcoin Strategic Reserve Fund managed by the State Treasurer under RSMo Chapter 30.
- Bitcoin donated to the fund must be held for a minimum of five years before it can be sold, transferred, or converted.
- The bill requires all Missouri government entities to accept Department of Revenue-approved cryptocurrency for taxes and fees.
- A biennial report detailing Bitcoin holdings, dollar value, security threats, and fund growth would be required under the bill.
Missouri’s 103rd General Assembly has introduced House Bill 2080, sponsored by Representative Keathley. The bill proposes creating a Bitcoin Strategic Reserve Fund within the state treasury under RSMo Chapter 30.
If passed, the State Treasurer would manage the fund and accept Bitcoin donations from eligible Missouri residents.
The bill also allows government agencies to accept cryptocurrency for tax and fee payments. This marks a notable step in state-level digital asset policy.
How the Bitcoin Strategic Reserve Fund Would Work
The bill defines Bitcoin as a decentralized digital asset operating without a central authority. Under the proposed law, the State Treasurer would serve as custodian of the Bitcoin Strategic Reserve Fund.
Contributions may come through gifts, grants, donations, bequests, or devises from Missouri residents or governmental entities.
Once Bitcoin enters state custody, it must remain held for a minimum of five years. After that mandatory period, the treasurer may transfer, sell, appropriate, or convert the assets. This holding requirement aims to prevent short-term speculation with public digital assets.
Security protocols are a core part of the bill’s framework. The treasurer would be required to use cold storage and other secure custodial technologies.
A qualified, U.S.-based third-party cryptocurrency entity may also be contracted to support fund security.
To maintain transparency, the treasurer must conduct regular audits and publish biennial reports. These reports must detail total Bitcoin holdings, U.S. dollar equivalents, fund growth, transactions, security threats, and eligible conversion amounts. Reports are due before December 31 of each even-numbered year.
Crypto Payments and Donor Recognition Under the Proposal
Beyond the reserve fund, the bill introduces broader cryptocurrency acceptance across Missouri. Section 30.1030 requires all governmental entities to accept approved cryptocurrency for taxes, fees, fines, assessments, and other charges. The Department of Revenue would determine which cryptocurrencies qualify.
Service fees tied to cryptocurrency transactions may be passed on to the payer. This gives government entities flexibility while still opening the door to digital asset payments. The bill does not specify which cryptocurrencies outside Bitcoin would qualify for this use.
The bill also creates a recognition program for donors. Upon request, the State Treasurer may issue a certificate of acknowledgment to individuals or organizations that contribute Bitcoin. Significant contributions could receive additional public recognition through a formal honors program.
Donor eligibility remains at the treasurer’s discretion. If a donor is found ineligible, their Bitcoin must be returned. The bill strictly prohibits transactions involving foreign countries, entities outside Missouri, or parties known to engage in illegal activities.
Only U.S.-based partners may assist in fund operations. Rulemaking authority granted under the bill would become void if related legislative oversight provisions are later ruled unconstitutional.

Trump-branded crypto sinks 92% from peak amid insider profit, probes

Boris Johnson Accused Of Attention Seeking Over Ukraine War

LeBron James endorses Jaylen Brown for MVP

Smart energy pays enters the US market, targeting scalable financial infrastructure

Why Israel is blocking foreign journalists from entering

Bitcoin: We’re Entering The Most Dangerous Phase

How to Build Wealth | Smart Loans & Asset Planning | Telugu Podcast | CFP Ram Prasad | Part – 1

Yellow coin? The hot new crypto? Uh.. yes please?! #animation

Do it on the HOLI, financial problems will go away…|#ytshortsvideo #facts #viralshorts #ytstudioes
-
 Video7 days ago
Bitcoin: We’re Entering The Most Dangerous Phase
-

 Crypto World6 days ago
Can XRP Price Successfully Register a 33% Breakout Past $2?
-

 Video3 days ago
XRP News: XRP Just Entered a New Phase (Almost Nobody Noticed)
-

 Fashion3 days ago
Weekend Open Thread: Boden – Corporette.com
-

 Sports6 days ago
GB's semi-final hopes hang by thread after loss to Switzerland
-

 Politics1 day ago
Baftas 2026: Awards Nominations, Presenters And Performers
-
 Tech6 days ago
The Music Industry Enters Its Less-Is-More Era
-

 Business5 days ago
Infosys Limited (INFY) Discusses Tech Transitions and the Unique Aspects of the AI Era Transcript
-

 Entertainment5 days ago
Kunal Nayyar’s Secret Acts Of Kindness Sparks Online Discussion
-

 Video6 days ago
Financial Statement Analysis | Complete Chapter Revision in 10 Minutes | Class 12 Board exam 2026
-

 Tech5 days ago
Retro Rover: LT6502 Laptop Packs 8-Bit Power On The Go
-
 Sports4 days ago
Clearing the boundary, crossing into history: J&K end 67-year wait, enter maiden Ranji Trophy final | Cricket News
-

 Business21 hours ago
Mattel’s American Girl brand turns 40, dolls enter a new era
-

 Business17 hours ago
Law enforcement kills armed man seeking to enter Trump’s Mar-a-Lago resort, officials say
-

 Entertainment4 days ago
Dolores Catania Blasts Rob Rausch For Turning On ‘Housewives’ On ‘Traitors’
-

 Business5 days ago
Tesla avoids California suspension after ending ‘autopilot’ marketing
-

 Tech16 hours ago
Anthropic-Backed Group Enters NY-12 AI PAC Fight
-

 Politics6 days ago
Eurovision Announces UK Act For 2026 Song Contest
-

 NewsBeat15 hours ago
Armed man killed after entering secure perimeter of Mar-a-Lago, Secret Service says
-

 Crypto World5 days ago
WLFI Crypto Surges Toward $0.12 as Whale Buys $2.75M Before Trump-Linked Forum