

Crypto World
What’s Next for XRP After Monday’s Flash Crash?
Ripple’s XRP joined the rest of the market in the past day, with another crash displaying continued weakness within a broader descending structure, as upside attempts repeatedly fail to generate sustained momentum. The price is now trading within a clearly defined range, awaiting a decisive breakout to determine the next directional move.
Ripple Price Analysis: The Daily Chart
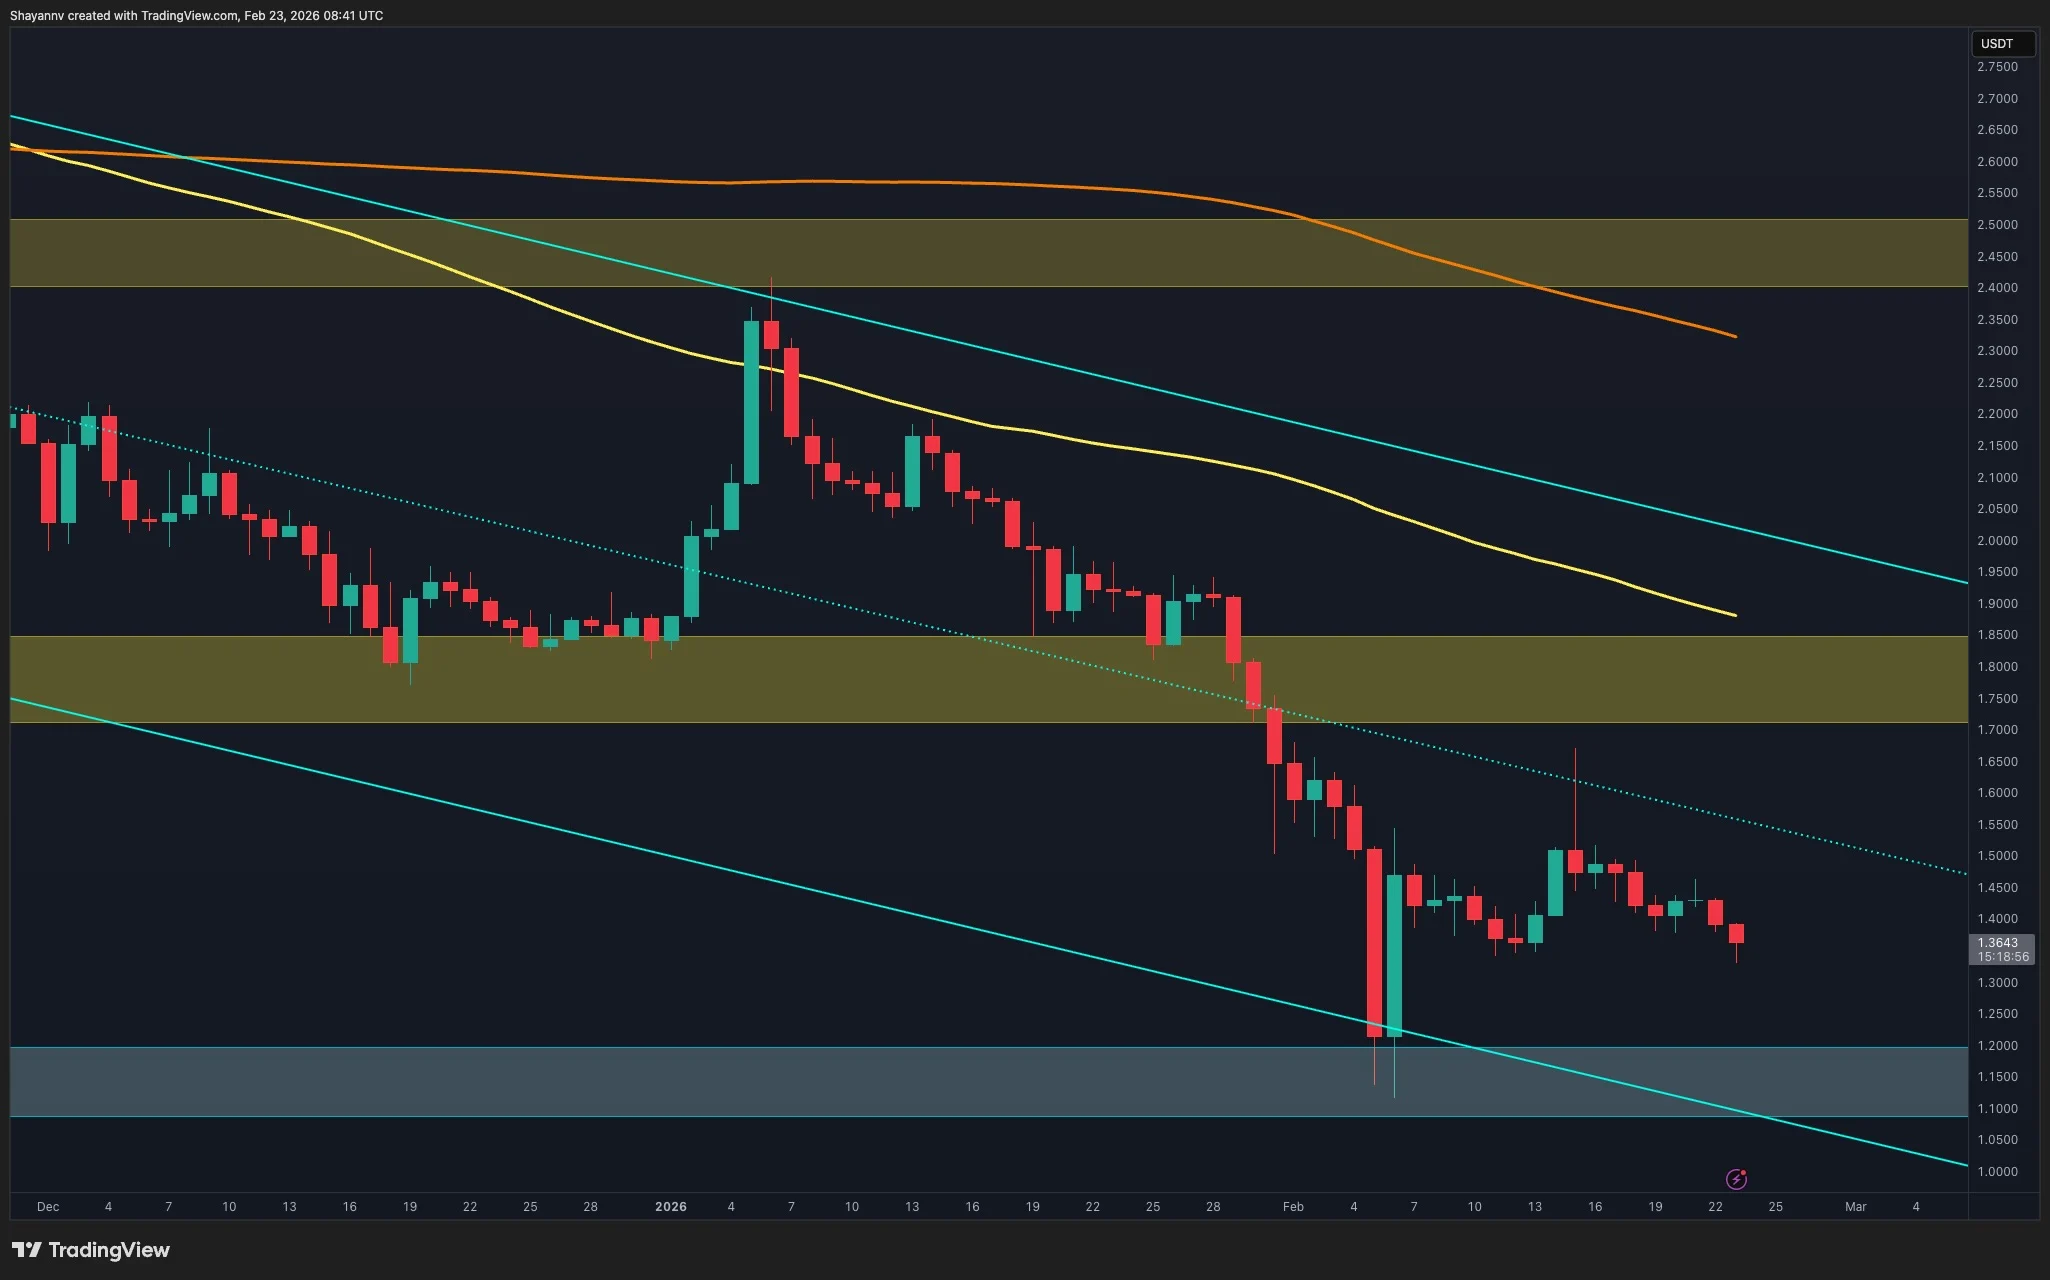
On the daily timeframe, XRP attempted to break above the channel’s middle boundary of $1.60 but failed to sustain the move. The brief push beyond this midline resulted in a liquidity sweep, where buy-side liquidity was taken before sellers stepped back in and drove the asset lower. This false breakout highlights the presence of supply overhead and confirms that bullish momentum remains fragile.
Following the rejection, the price rotated back into the established range and continues to fluctuate between the upper supply zone and the lower demand base. The structure now suggests ongoing consolidation rather than immediate trend reversal. Unless XRP can decisively reclaim and hold above the channel’s middle boundary, the market is likely to remain range-bound, with liquidity hunts on both sides shaping short-term volatility.
XRP/USDT 4-Hour Chart
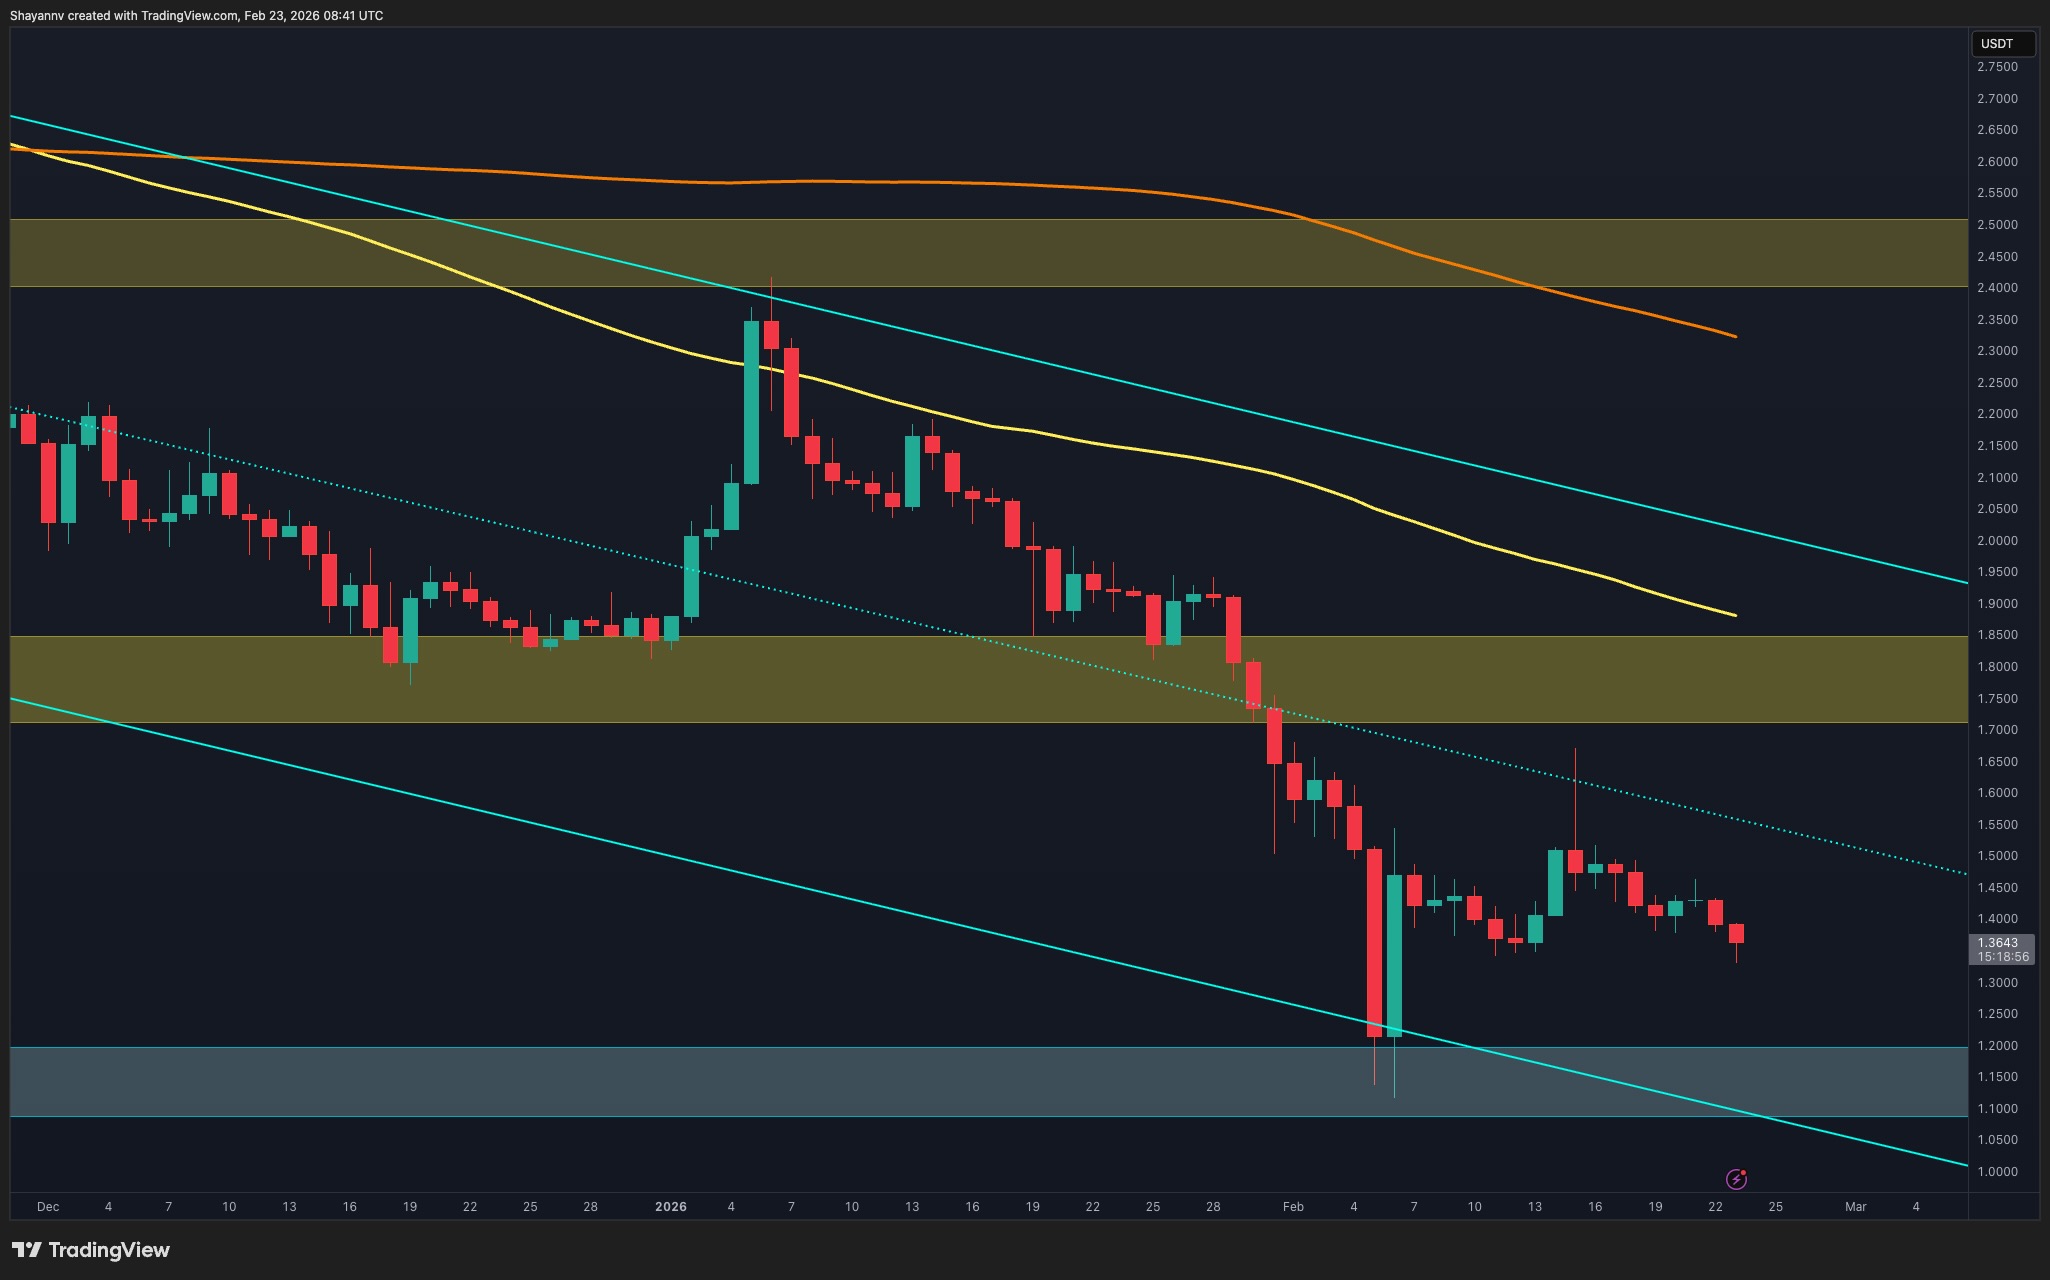
On the 4-hour timeframe, XRP remains structurally bearish, trading inside a well-defined descending structure. After the failed daily breakout and liquidity sweep, the price resumed its downward trajectory and continues to form lower highs and lower lows within the channel boundaries.
The recent bounce from the lower demand zone near the $1.10–$1.20 region was sharp but corrective in nature. The asset is now consolidating around the $1.35–$1.40 area, which previously acted as intraday support.
As long as XRP remains below the channel’s mid-structure and the $1.50 zone, upside attempts are likely to face selling pressure. A move toward the $1.50–$1.55 supply region would be considered a corrective retest unless accompanied by strong momentum and a structural break. On the downside, losing the current support cluster would expose the lower boundary of the channel and increase the probability of another liquidity sweep below recent lows.

Binance Free $600 (CryptoPotato Exclusive): Use this link to register a new account and receive $600 exclusive welcome offer on Binance (full details).
LIMITED OFFER for CryptoPotato readers at Bybit: Use this link to register and open a $500 FREE position on any coin!
Disclaimer: Information found on CryptoPotato is those of writers quoted. It does not represent the opinions of CryptoPotato on whether to buy, sell, or hold any investments. You are advised to conduct your own research before making any investment decisions. Use provided information at your own risk. See Disclaimer for more information.

Pi Network Coin price has suffered a harsh reversal in the past few days, moving from last week’s high of $0.2050 to the current $0.1580. It has slipped to its lowest level since February 14.
Summary
- Pi Network Coin price has retreated by 23% from its highest point this month.
- The decline happened as investors booked profits amid the ongoing crypto crash.
- It also happened as the first anniversary failed to address key issues.
Pi Coin (PI) token has dropped by over 23% from its highest point this month and 90% from its all-time high. This retreat has pushed its market cap from over $19 billion to $1.4 billion.
Pi Coin price has dropped amid profit-taking
Pi Network has slumped because of the broader crypto market crash that has affected Bitcoin (BTC) and other altcoins. Bitcoin dropped below $65,000, while top altcoins like LayerZero, Hyperliquid, Mantle, and Lighter fell by nearly 10% in the last 24 hours.
The retreat is also happening as investors book profits after the recent surge. Pi Network was up by 60% between its lowest and highest levels this month as traders waited for the first anniversary of the mainnet launch. It also jumped amid optimism that Kraken will list it soon.
The other potential reason for the sell-off is that the team’s address on the future did not address key issues. This address focused on priorities like boosting it utility growth and the upcoming KYC-as-a-Service, which will see it compete with World and Humanity Protocol.
However, the video did not address pressing issues that have led to a crash. For example, it did not talk on tokenomics, including the ongoing token unlocks and the fact that it does not have a deflation mechanism like token burns.
The developers also did not talk about ways to make it a decentralized network where the community votes on key issues. Today, all decisions are made by the team, while the obscure Pi Foundation holds billions of tokens.
Additionally, they did not address the future plans on exchange listings as Pi is only available in a handful of exchanges.
Pi Network Coin price technical analysis
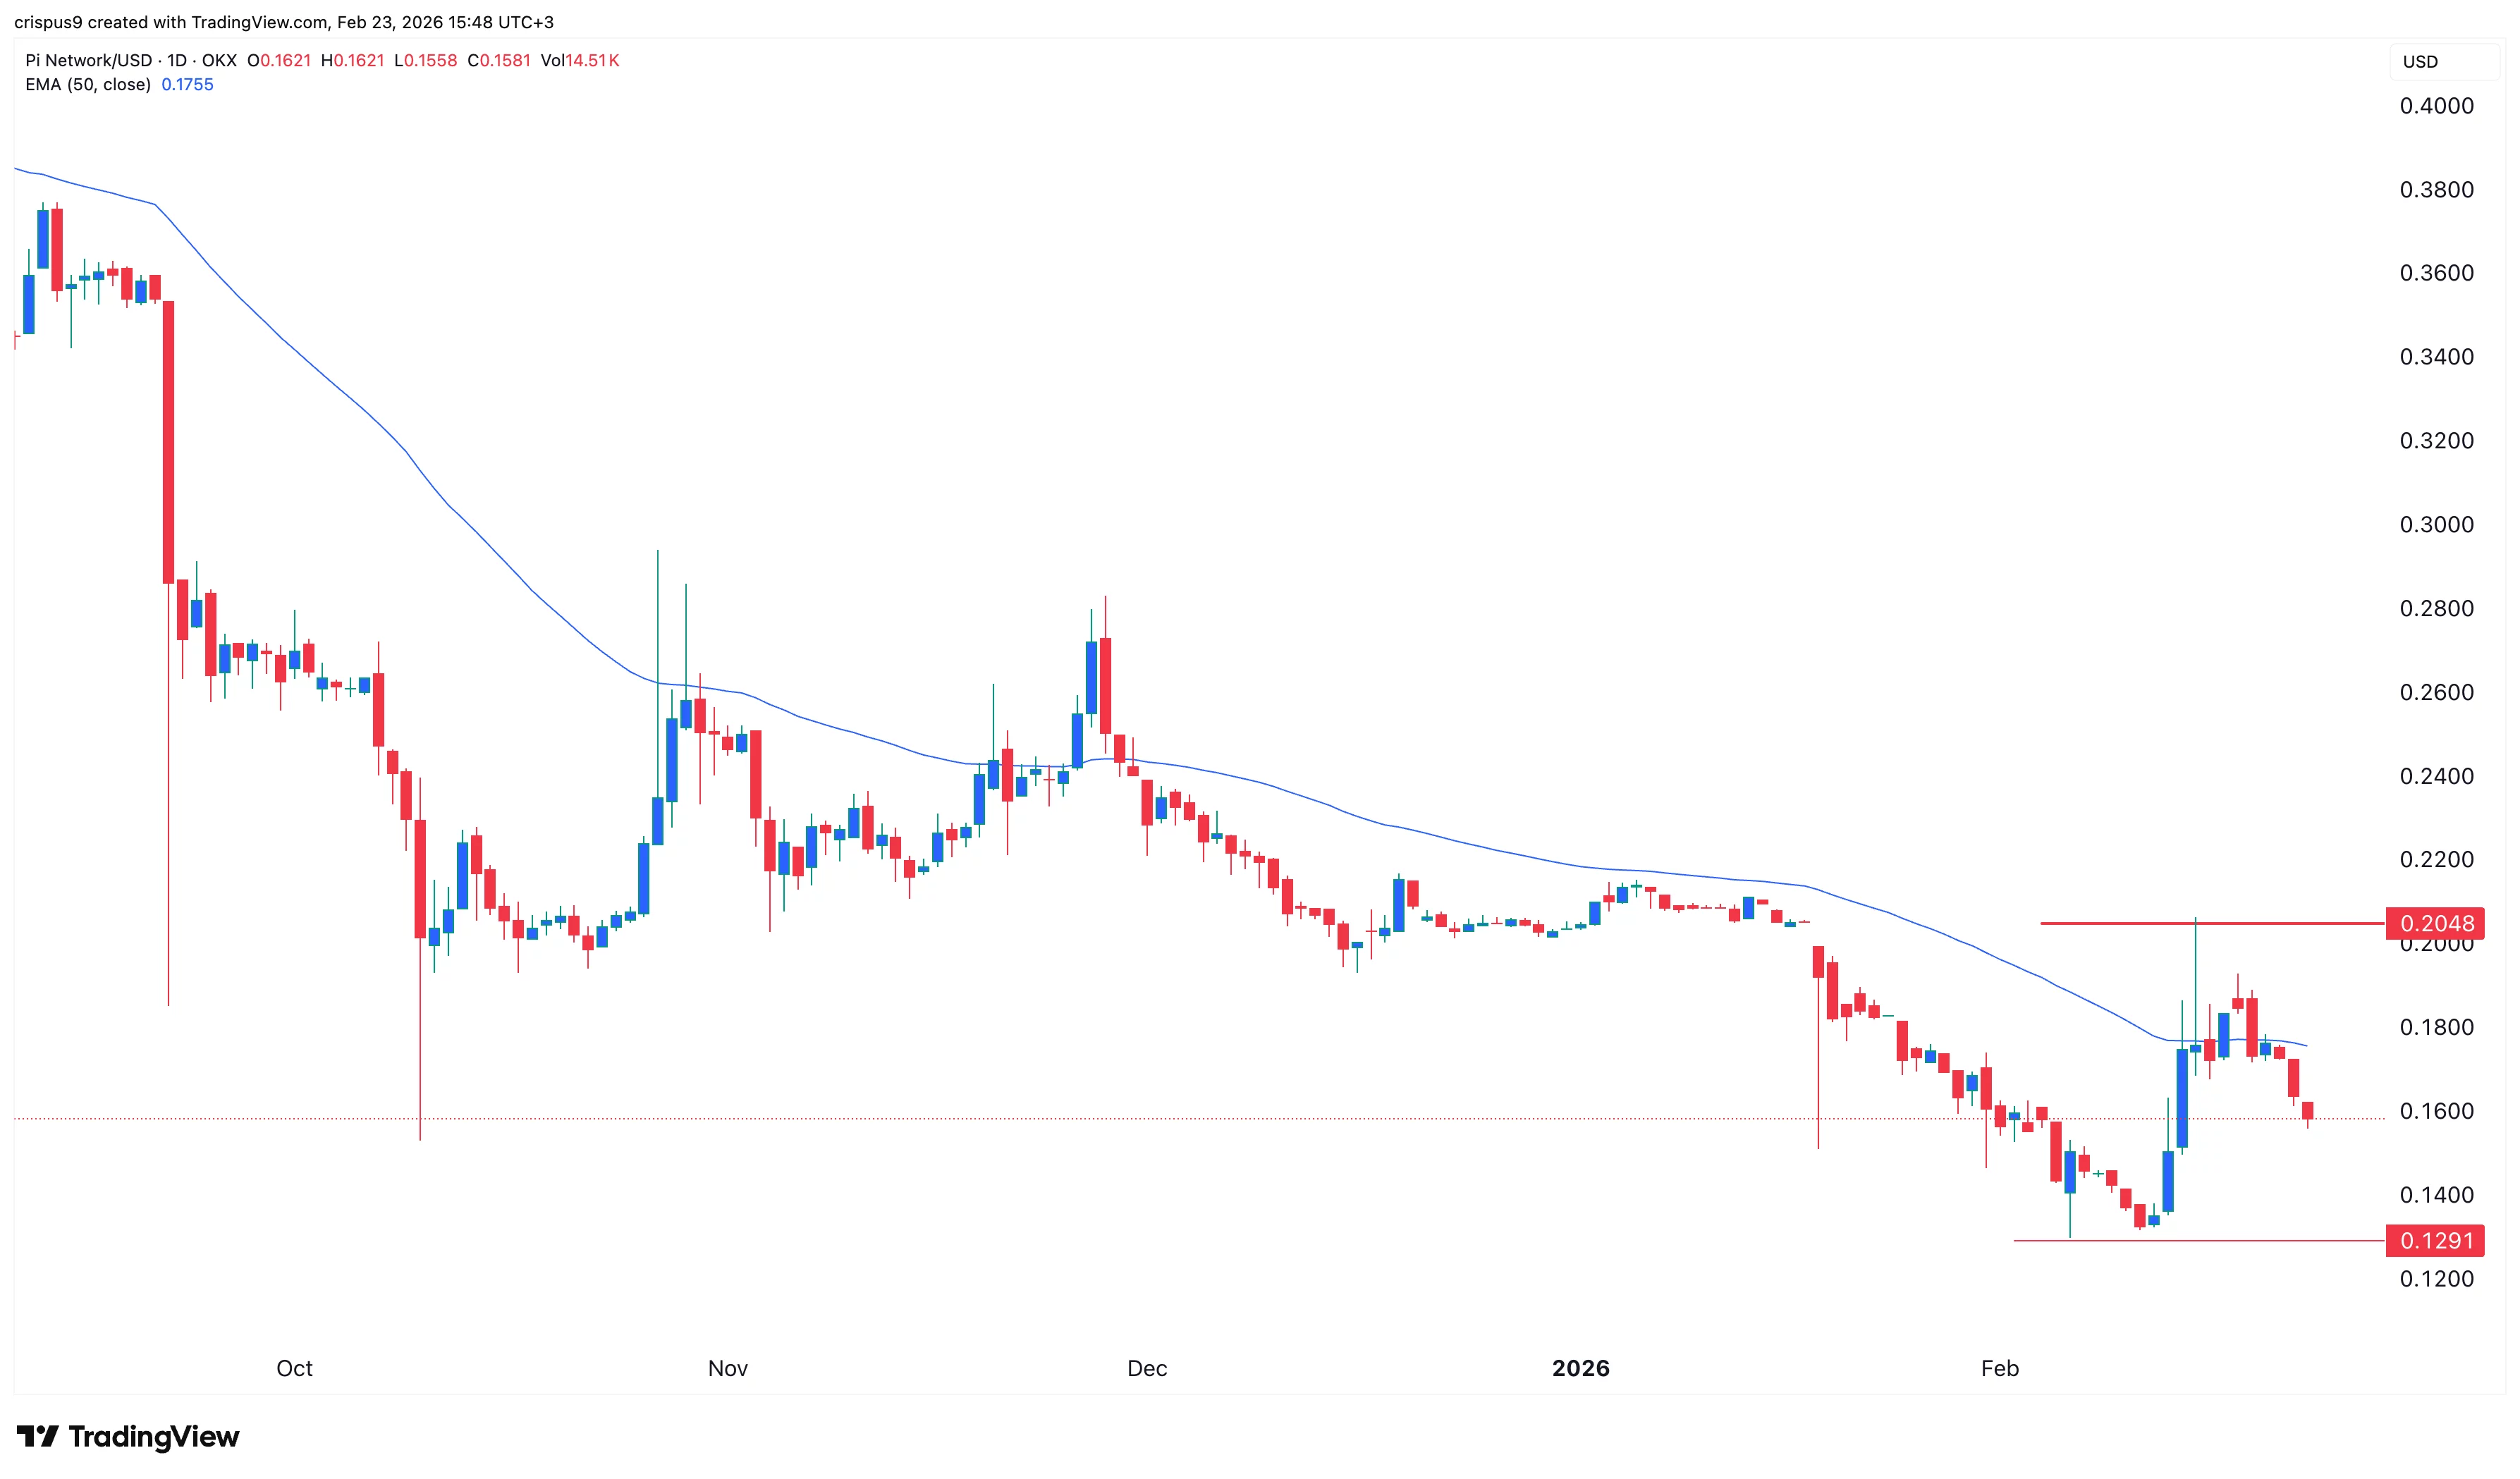
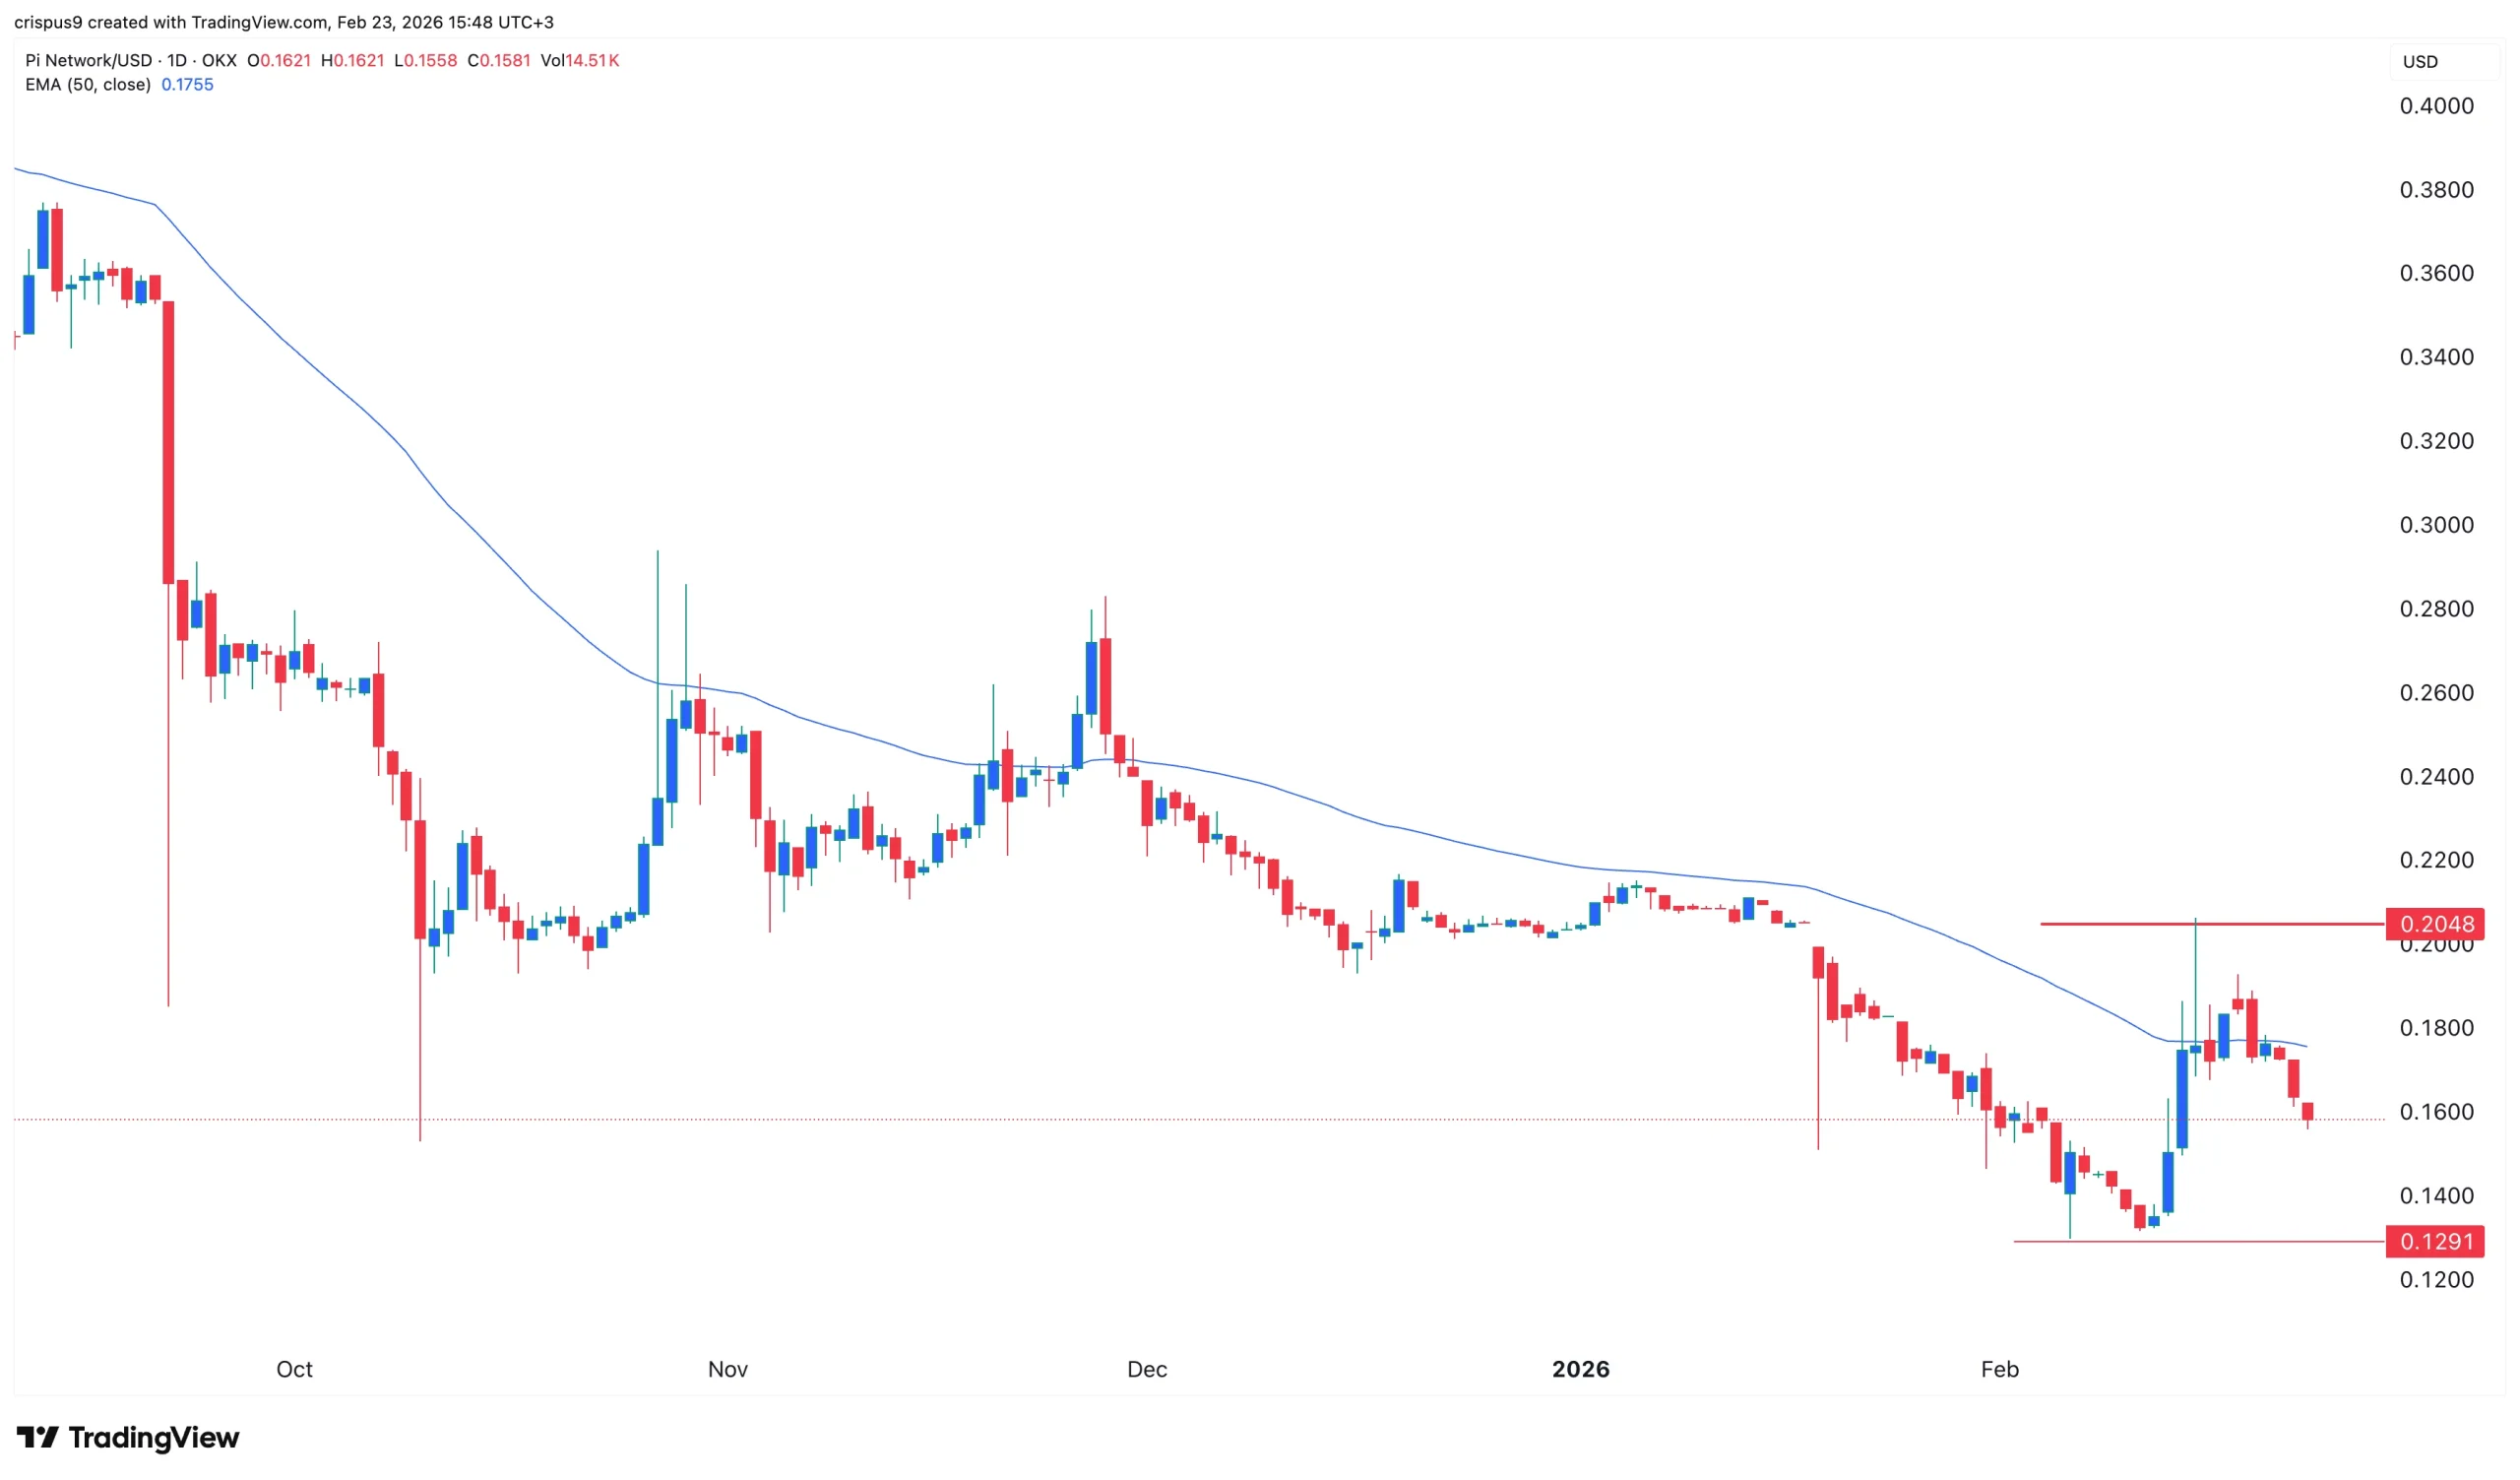
The daily timeframe chart shows that the Pi Coin price has slipped in the past few days. After peaking at $0.2050 last week, it has dropped to $0.1600.
The coin has remained below the 50-day moving average and the Supertrend indicator. It has also slumped below the Ichimoku cloud indicator.
The most likely Pi Network price forecast is bearish, with the next key target being the year-to-date low of $0.1290. A move to that level may be bullish as it will be a double-bottom pattern whose neckline is at $0.2050. On the other hand, dropping below that level will invalidate the bullish outlook and point to more downside to $0.100.

Strategy (formerly MicroStrategy) Chairman Michael Saylor has hinted on X that the firm is poised to execute its 100th Bitcoin acquisition, marking a symbolic milestone nearly six years after the company began its aggressive treasury reserve policy.
The upcoming purchase follows a persistent buying streak, with the firm accumulating assets consistently over the downturn despite trading conditions that have placed its massive position $12.4 billion underwater.
Key Takeaways
- Strategy currently holds 717,131 BTC acquired at an average cost of $76,027 per coin, totaling an investment basis of over $54 billion.
- Michael Saylor teased the milestone with a “StrategyTracker” chart captioned “The Orange Century,” indicating the firms’s 100th distinct purchase is imminent.
- The accumulation continues despite unrealized losses, with Bitcoin trading near $64,700 compared to the firm’s break-even price.
Strategy has accumulated its holdings through 99 separate transactions since August 2020.
While spot Bitcoin ETFs log their fifth straight week of outflows, implying cooling institutional demand, Saylor’s firm continues to absorb supply aggressively.
The company’s persistence highlights a divergence between short-term institutional flows and high-conviction long plays by corporate treasuries.
Discover: The best crypto to diversify your portfolio with
The Orange Century: The Accumulation Stats of Michael Saylor
In his latest X post on Saturday, Saylor shared a chart from the firm’s “StrategyTracker” with the caption “The Orange Century.”
For those who have followed Michael Saylor closely over the past few years, a formal Form 8-K filing announcing a completed acquisition could be just around the corner.
According to company data, the firm has purchased Bitcoin consistently over the 2020s so far, including a purchase every month since November 2024. A purchase this week would mark the 100th total buy event since the strategy began.
The firm now controls 717,131 BTC, approximately 3.4% of the total 21 million supply cap, valued at around $47.5. However, the aggressive buying at market peaks has pushed the average cost per coin to $76,027.
With Bitcoin trading below $67,000 as traders buy crash protection, the treasury faces significant unrealized losses.
Despite this price action, the company remains committed to its dollar-cost averaging strategy, leveraging capital markets to finance continued accumulation.
Dilution Concerns and Strategic Pivots
To sustain this buying pressure, Strategy has evolved its financing approach. Fortune reports that the firm has shifted toward issuing preferred stock to raise capital, a move analysts warn could turn the company into a “dilution machine” relative to Bitcoin per share (BPS) metrics.
The company issued $7 billion in preferred stock in 2025 alone, carrying high dividend obligations.
While Bitcoin hashrate shows a V-shaped recovery signaling network health, Strategy’s balance sheet is under scrutiny as it navigates $6 billion in debt maturities due in 2028.
The firm plans to “equitize” this convertible debt over the coming years, potentially increasing share counts further to protect the Bitcoin stack.
Discover: The best new crypto in the world
Corporate Treasury Implications
Strategy’s influence has inspired other entities to hedge with crypto, seen in smaller scale executions like the Consensys and Sharplink ETH treasury holdings.
However, no other public entity approaches Strategy’s scale.
As the firm approaches its 100th purchase, the market watches closely to see if Saylor can maintain shareholder value while managing heavy debt loads in a sub-$70,000 Bitcoin environment.
The post Michael Saylor Hints at Strategy’s 100th Bitcoin Purchase Milestone appeared first on Cryptonews.
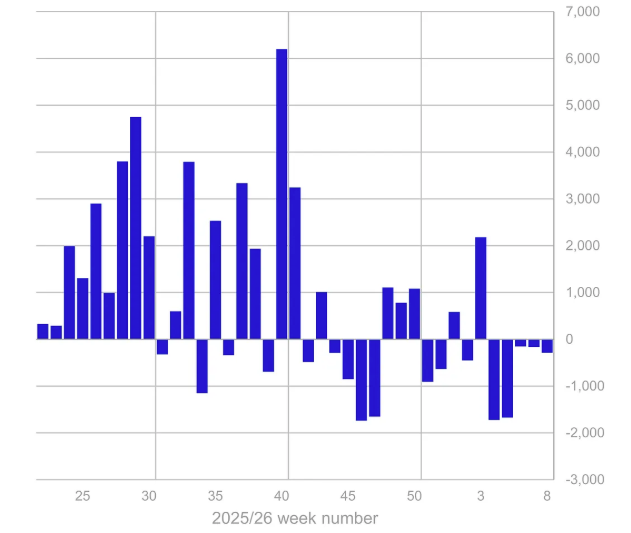
Crypto investment products recorded $288 million in outflows last week, extending their losing streak to five consecutive weeks — the longest stretch of exits since the launch of US spot Bitcoin exchange-traded funds (ETFs) in 2024.
The latest withdrawals bring cumulative outflows to $4 billion, according to CoinShares’ Monday report. Despite the sustained downturn, total outflows remain below the $6 billion recorded over the same period last year, said James Butterfill, head of research at CoinShares.

Trading activity in crypto ETPs fell to $17 billion last week, the lowest since July 2025, reflecting growing investor apathy, Butterfill said.
Bitcoin funds led weekly outflows as shorts draw inflows
Bitcoin (BTC) remained the key driver of negative sentiment in crypto funds, accounting for $215 million of last week’s outflows.
In contrast, short-Bitcoin products attracted $5.5 million in inflows — the largest of any crypto asset — signaling persistent bearish sentiment. Year to date, Bitcoin ETPs have recorded the deepest net outflows among major assets, totaling about $1.3 billion.

Ether (ETH) funds followed the trend with outflows of $36.5 million, bringing year-to-date losses to almost $500 million. XRP (XRP) and Solana (SOL) funds saw minor inflows totaling $3.5 million and $3.3 million, respectively.
CoinShares cuts Bitcoin ETP fee amid weak investor interest
CoinShares paired the weak flows backdrop with a pricing move aimed at making its products more competitive.
On Monday, the company announced a permanent cut to the management fee on its flagship CoinShares Bitcoin ETP (BITC), lowering it to 0.15%, effective immediately. One of Europe’s largest Bitcoin ETPs, BITC, launched in January 2021 with a base fee of 0.98%.
Related: Polymarket odds of Bitcoin under $55K at 72% as BTC market cap dives
“This fee reduction reflects our conviction that accessible pricing must be structural, not promotional,” CoinShares CEO and co-founder Jean-Marie Mognetti said.
Spot Bitcoin ETFs see signs of rising activity on Friday
After a series of trading volume declines since early February, US spot Bitcoin ETFs saw a shift in dynamics Friday, with volumes rising to $3.7 billion from $2.4 billion a day earlier, according to SoSoValue data.
The session brought modest inflows of $88 million, leaving the week in the red with $315.9 million in outflows.

Following a five-week streak of outflows totaling $3.8 billion, the ETFs now report cumulative year-to-date outflows of $4.5 billion.
Magazine: Did a Hong Kong fund kill Bitcoin? Bithumb’s ‘phantom’ BTC: Asia Express

TLDR
- Nvidia made over $8 billion in new stock investments in Q4 2025
- Intel is now Nvidia’s largest holding at 60% of its portfolio after a $5 billion buy
- Nvidia took new positions in chip-design firm Synopsys and networking company Nokia
- Nvidia fully exited Arm Holdings after a failed takeover attempt
- CoreWeave stayed in the portfolio but shrank from 86% to 13% of total weight
Nvidia’s investment portfolio went through a major overhaul in the fourth quarter of 2025. The chipmaker added three new positions and exited four others, according to its latest 13F filing with the SEC.
The filing covers holdings as of December 31, 2025, and was disclosed in February 2026. Nvidia’s stock is up 1.78% year to date.
Intel Takes the Top Spot
The biggest move was a 214.8 million-share stake in Intel, worth $5 billion at $23.28 per share. Intel now makes up 60.48% of Nvidia’s total disclosed portfolio.
Nvidia first announced the Intel investment in September 2025 as part of a product partnership. The two companies plan to develop custom data center and personal computing products together.
Under the deal, Nvidia will use Intel’s CPU technology and x86 ecosystem inside its AI platforms. The partnership also gives Nvidia access to U.S.-based chip manufacturing.
Intel’s stock has climbed more than 44% since Nvidia announced the investment.
New Bets on Synopsys and Nokia
Nvidia’s second-largest new position is in Synopsys, a chip-design software company. Nvidia bought 4.8 million shares in December 2025 at $414.79 each, spending around $2 billion.
Synopsys provides electronic design automation software used to build semiconductors. Its stock dropped sharply in September 2025 after it reported weak earnings.
HSBC recently downgraded Synopsys to “hold” and cut its price target from $545 to $455. The bank pointed to limited near-term growth and pressure on its core business lines heading into 2026.
Nvidia also invested roughly $1 billion in Nokia. The Finnish company now supplies networking equipment to data centers and cloud providers, a long way from its mobile phone roots.
Nokia makes up 8.21% of Nvidia’s portfolio, its fourth-largest holding. Nvidia CEO Jensen Huang described the telecom sector as “critical national infrastructure” when the investment was announced in October 2025.
Arm Is Out, CoreWeave Holds Steady
Nvidia fully exited its stake in Arm Holdings during Q4 2025. Nvidia had previously attempted to acquire Arm but was blocked by regulators.
CoreWeave, the cloud computing company, stayed in the portfolio with 24.2 million shares unchanged. However, its weight dropped from 86.44% in Q3 to just 13.27% in Q4 after the large Intel purchase.
CoreWeave stock is up 129% since its March 2025 IPO. Nvidia first bought in before the company went public.
Nvidia also sold its full positions in Applied Digital, Recursion Pharmaceuticals, and WeRide. A small stake in Yandex remains unchanged.

Crypto World
Tariff travails resurface, bitcoin holders prepare for declines: Crypto Daybook Americas
By Omkar Godbole (All times ET unless indicated otherwise)
Tariff uncertainty is back to haunt markets, and it’s no surprise bitcoin traders are chasing downside protection.
On Friday, the U.S. Supreme Court ruled against President Donald Trump’s emergency tariffs from April last year. Within a few hours, Trump had announced fresh tariffs, invoking a law that allows an import levy of up to 15% for 150 days to address “international payment problems.”
That’s confirmation the president still sees “tariffs” as the most beautiful word in the English dictionary. It also means trade-related uncertainty is here to stay, posing a headwind to risk assets, including bitcoin.
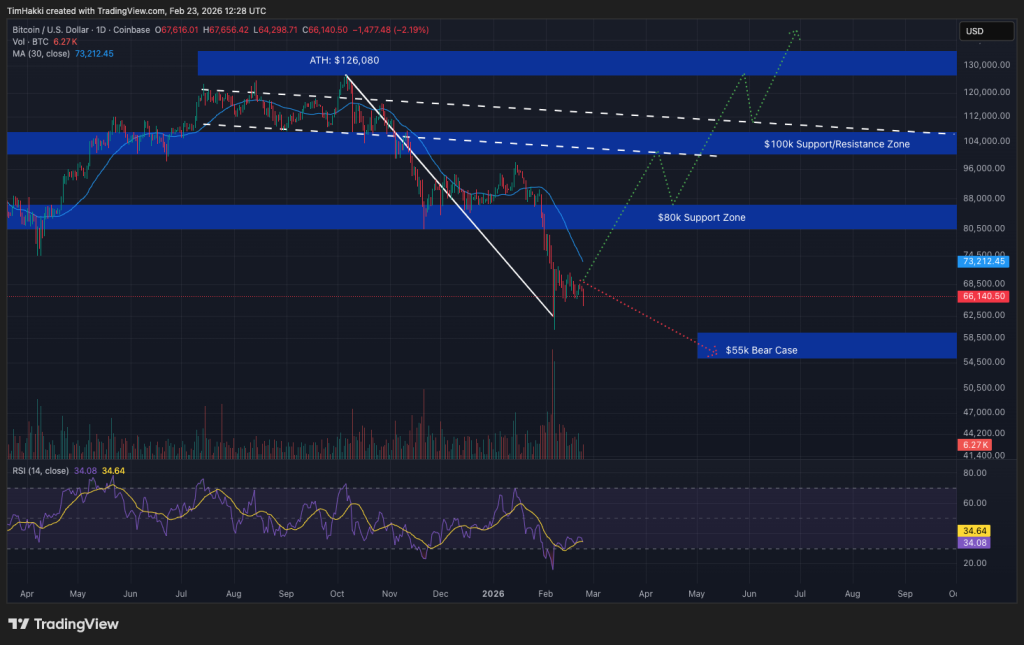
Bitcoin traders reacted accordingly. Since Friday, put options at strike prices of $58,000, $60,000 and $62,000 have seen the largest increases in open interest, or the number of active contracts, on Deribit. This is a clear sign traders are positioning for declines. A put option protects against price losses.
Bitcoin fell to a low of $64,481 early Monday after whipsawing around $66,000 over the weekend. The drop came amid reports of a whale, or large BTC holder, moving sizable amounts of bitcoin to an exchange, possibly for sale. Since then, the price has recovered to over $66,000.
Ether (ETh) also recovered from Asian-session lows near $1,856 even as blockchain data pointed to faster sales by Ethereum co-founder Vitalik Buterin.
Trade tensions could dominate sentiment this week, with Nvidia’s earnings potentially adding to market volatility. Analysts pinned hopes on the potential stabilisation of spot bitcoin ETF flows to support the market.
“A flattening of outflows would suggest institutional selling is maturing. Continued contraction would reinforce the defensive regime,” Timothy Misir, the head of research at BRN, said in an email.
“For now, liquidity defines the environment. Supply persists. Conviction is thin. The market is waiting for either macro relief or structural demand to re-emerge,” he said.
In traditional markets, Goldman Sachs raised its fourth-quarter Brent crude oil forecast to $60 and WTI to $56 per barrel, citing lower-than-expected OECD stockpiles. Crude prices have been buoyant lately due to fears of full-blown military conflict between the U.S. and Iran. A sharp rise in oil prices could add to inflation worldwide and weigh on risk assets. Stay alert!
Read more: For analysis of today’s activity in altcoins and derivatives, see Crypto Markets Today
What to Watch
For a more comprehensive list of events this week, see CoinDesk’s “Crypto Week Ahead“.
- Crypto
- Feb. 23: Alchemy Chain’s testnet is scheduled to go live.
- Macro
- Feb. 23, 8:00 a.m.: Fed Governor Christopher Waller gives a speech on the economic outlook at the National Association for Business Economics.
- Feb. 23, 10:00 a.m.: U.S. Dallas Fed Manufacturing Index for February (Prev. -1.2)
- Earnings (Estimates based on FactSet data)
Token Events
For a more comprehensive list of events this week, see CoinDesk’s “Crypto Week Ahead“.
- Governance votes & calls
- Feb. 23: DYdX Foundation to host its February analyst call.
- Feb. 23: Pudgy Penguins to host an Inner Igloo meeting on Discord.
- Uniswap DAO is voting to enable protocol fees across all V3 pools and eight layer-2 networks. Voting ends Feb. 23.
- ZKsync DAO is voting to allocate $4.1 million in ZK tokens for the 2026 Audit Reimbursement Program (ZARP v2) to fund forward-looking protocol security audits and retroactively reimburse eligible 2025 costs. Voting ends Feb. 23.
- Unlocks
- Token Launches
Conferences
For a more comprehensive list of events this week, see CoinDesk’s “Crypto Week Ahead“.
Market Movements
- BTC is down 1.99% from 4 p.m. ET Friday at $66,466.38 (24hrs: -2.67%)
- ETH is down 2.75% at $1,920.06 (24hrs: -3.13%)
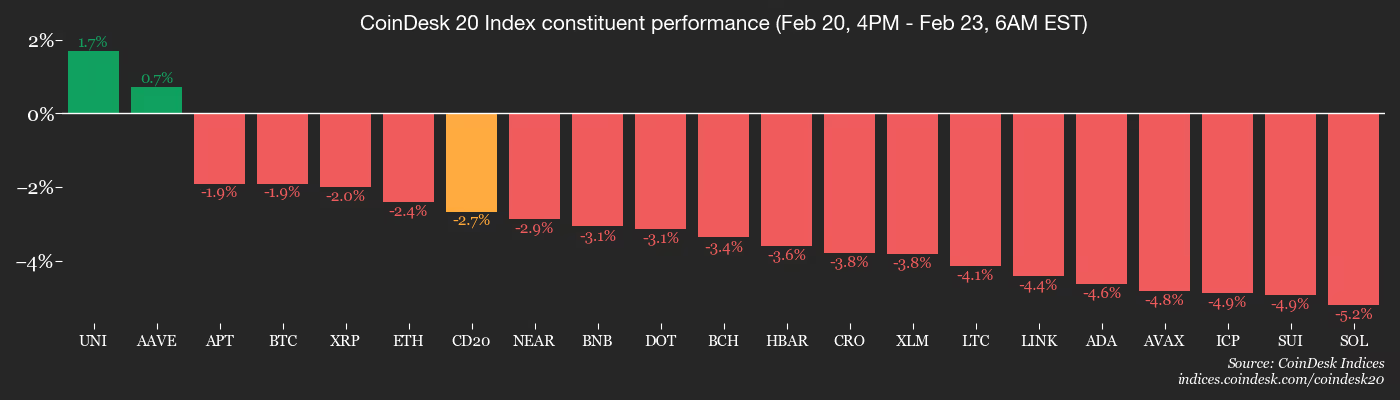
- CoinDesk 20 is down 2.7% at 1,913.13 (24hrs: -2.93%)
- Ether CESR Composite Staking Rate is down 3 bps at 2.76%
- BTC funding rate is at -0.0047% (-5.1531% annualized) on Binance

- DXY is down 0.14% at 97.66
- Gold futures are up 2.03% at $5,184.10
- Silver futures are up 5.41% at $86.79
- Nikkei 225 closed down 1.12% at 56,825.70
- Hang Seng closed up 2.53% at 27,081.91
- FTSE is little changed at 10,682.09
- Euro Stoxx 50 is down 0.07% at 6,127.32
- DJIA closed on Friday up 0.47% at 49,625.97
- S&P 500 closed up 0.69% at 6,909.51
- Nasdaq Composite closed up 0.90% at 22,886.07
- S&P/TSX Composite closed up 0.66% at 33,817.51
- S&P 40 Latin America closed up 1.63% at 3,799.71
- U.S. 10-Year Treasury rate is down 0.8 bps at 4.077%
- E-mini S&P 500 futures are down 0.25% at 6,905.75
- E-mini Nasdaq-100 futures are down 0.41% at 24,965.50
- E-mini Dow Jones Industrial Average Index futures are down 0.25% at 49,551.00
Bitcoin Stats
- BTC Dominance: 58.75% (-0.44%)
- Ether-bitcoin ratio: 0.02888 (-0.21%)
- Hashrate (seven-day moving average): 1,016 EH/s
- Hashprice (spot): $29.02
- Total fees: 1.88 BTC / $127,386
- CME Futures Open Interest: 119,015 BTC
- BTC priced in gold: 12.9 oz.
- BTC vs gold market cap: 4.44%
Technical Analysis

- The chart shows bitcoin’s weekly price swings in candlestick format.
- Long lower wicks on recent candles hint at seller fatigue: Sellers tried to hammer prices downward, but failed.
- This type of pattern after a notable selloff usually sets the stage for price bounces.
Crypto Equities
- Coinbase Global (COIN): closed on Friday at $171.35 (+3.26%), -1.60% at $168.60 in pre-market
- Circle Internet (CRCL): closed at $63.02 (+1.78%), -1.05% at $62.36
- Galaxy Digital (GLXY): closed at $21.20 (-1.99%), -1.84% at $20.81
- Bullish (BLSH): closed at $31.77 (-1.85%), -0.66% at $31.56
- MARA Holdings (MARA): closed at $7.97 (+0.13%), -1.63% at $7.84
- Riot Platforms (RIOT): closed at $15.68 (-3.33%), -1.66% at $15.42
- Core Scientific (CORZ): closed at $17.30 (-3.78%)
- CleanSpark (CLSK): closed at $9.65 (-1.73%), -1.45% at $9.51
- CoinShares Valkyrie Bitcoin Miners ETF (WGMI): closed at $38.85 (-4.53%)
- Exodus Movement (EXOD): closed at $9.86 (-5.37%)
Crypto Treasury Companies
- Strategy (MSTR): closed at $131.05 (+1.24%), -1.55% at $129.02
- Strive (ASST): closed at $8.15 (+0.37%), -2.09% at $7.98
- SharpLink Gaming (SBET): closed at $6.72 (-1.18%), -2.53% at $6.55
- Upexi (UPXI): closed at $0.62 (-7.35%), +4.53% at $0.65
- Lite Strategy (LITS): closed at $1.11 (+0.91%)
ETF Flows
Spot BTC ETFs
- Daily net flows: $88.1 million
- Cumulative net flows: $53.99 billion
- Total BTC holdings ~1.26 million
Spot ETH ETFs
- Daily net flows: $0 million
- Cumulative net flows: $11.55 billion
- Total ETH holdings ~5.66 million
Source: Farside Investors
While You Were Sleeping


Disclosure: This article does not represent investment advice. The content and materials featured on this page are for educational purposes only.
Cloud mining platform KT DeFi positions itself as a compliant, automated solution for global users seeking hardware-free access to digital asset mining.
Summary
- KT DeFi offers leased computing power mining with renewable-energy infrastructure, multi-currency support, and beginner-friendly automation.
- The platform emphasizes security and compliance through 2FA, cold storage, AML/KYC standards, and audits by PwC with insurance from Lloyd’s of London.
- Profitability depends on market conditions, mining difficulty, and hardware efficiency, with earnings settled daily and flexible contract options.
This KT DeFi review provides a comprehensive analysis of the platform’s core functionalities and security mechanisms, and assesses the responsiveness and professionalism of its customer support.
Additionally, the platform provides a detailed step-by-step guide to help users register and understand the platform’s practical usage, enabling them to determine whether KT DeFi is a safe, compliant, and suitable option for crypto mining investment.
What is the KT DeFi platform?
KT DeFi is a globally leading cryptocurrency mining platform operating through an open computing power trading model. Users can participate in digital asset mining by leasing computing power, without purchasing or maintaining mining equipment themselves.
The platform was established in 2019 in London, UK, focusing on decentralized finance (DeFi) infrastructure and cloud computing power services. KT DeFi leverages smart contract technology and risk control models to optimize asset management efficiency, strengthen platform security, and promote regulatory compliance in the digital asset market, providing high-efficiency and stable crypto mining solutions to users worldwide.
Currently, KT DeFi serves over 3 million users across more than 180 countries and regions. Its core services include cloud mining solutions powered by renewable energy and automated yield optimization features, designed to enhance mining efficiency and maximize returns.
What are the advantages of KT DeFi?
- User-friendly interface: Simple, intuitive, and fully automated, suitable for beginners.
- Sustainable operations: Uses renewable energy to reduce electricity costs and improve efficiency.
- Low entry barrier: No need to purchase or maintain mining hardware; mining can be done entirely online.
- 24×7 monitoring and customer support: Ensures security and operational stability.
- Flexible mining strategies: Supports multiple contract durations and strategies to suit user preferences.
- Multi-currency support: Deposit and withdraw BTC, ETH, DOGE, XRP, and other major cryptocurrencies, reducing reliance on a single coin.
Is KT DeFi safe, legal, and profitable?
1. Security framework
KT DeFi employs a multi-layer security system to protect user accounts, funds, and mining operations, including:
- Two-factor authentication (2FA)
- Multi-signature technology
- Cold storage for assets
- SSL encryption for all communications
The platform undergoes annual financial and security audits by PwC and has asset insurance coverage through Lloyd’s of London, further enhancing asset protection and risk management.
2. Compliance and regulatory framework
KT DeFi follows international Anti-Money Laundering (AML) and Know Your Customer (KYC) standards, as well as risk-tiered management principles, ensuring compliance with major jurisdictional regulations. The platform’s regulatory framework includes:
- International AML/KYC standards
- Risk-tiered management mechanisms
- The EU’s European Union MiCA (Markets in Crypto Assets) regulation for a unified and transparent digital asset framework
These measures establish a compliant and transparent operational environment for global users.
3. Profitability analysis
Profitability on KT DeFi depends on several factors:
- Mining hardware efficiency
- Electricity and operational costs
- Mining difficulty and block rewards
- Market price fluctuations
Currently, high-efficiency machines such as ANTSPACE-MD5 and Air-Cooling-Mining-Box-40ft demonstrate superior energy efficiency and stable computing power, offering potential for considerable returns.
How to start mining on KT DeFi
- Register an account
New users can visit the KT DeFi official website and complete the registration process. New users receive a $17 bonus to start mining. - Select a computing power contract
Next, they can choose a smart contract based on their budget and investment period, balancing potential returns with risk. - Deploy and activate mining power
The system automatically allocates mining resources and starts mining. Earnings are settled every 24 hours with no manual operation required. - Manage earnings
Users can withdraw funds or reinvest according to market conditions to maximize returns.
Conclusion
KT DeFi is a legal and compliant cryptocurrency cloud mining platform with a solid operational track record. It has processed billions of dollars in payments and serves over 3 million users. The platform employs multi-layer security measures, including two-factor authentication, cold storage, and SSL encryption, ensuring the safety of funds and mining operations.
From an investment perspective, KT DeFi’s smart computing power contracts offer notable profit potential. Using high-efficiency mining machines such as ANTSPACE-MD5 and Air-Cooling-Mining-Box-40ft, users can achieve relatively stable and considerable daily returns.
Disclosure: This content is provided by a third party. Neither crypto.news nor the author of this article endorses any product mentioned on this page. Users should conduct their own research before taking any action related to the company.

TLDR
- Lucid reports Q4 2025 earnings Tuesday, February 24, with options traders expecting a 14.87% swing either way.
- Analysts forecast a loss of $2.67 per share and revenue of ~$459.5 million, up ~96% year-over-year.
- Lucid announced a 12% U.S. workforce reduction ahead of the print, targeting margin improvements.
- LCID is down 10% year-to-date and holds a consensus Moderate Sell rating from Wall Street.
- Profitability is not expected until 2026–2027 as the Gravity SUV ramp continues.
Lucid Group heads into Tuesday’s Q4 2025 earnings report with its stock under pressure and the options market flashing a warning sign.
Traders are pricing in a 14.87% move in either direction after the release. For context, LCID’s average post-earnings swing over the past four quarters has been 7.73% — making this implied move nearly double the norm.
The stock is down 10% year-to-date, sitting around $9.59, while the broader auto manufacturing segment has climbed 7.1% over the same stretch.
Analysts expect a Q4 loss of $2.67 per share, steeper than the $2.20 loss recorded in Q4 2024. On the revenue side, the forecast sits at roughly $459.5 million — a 96% year-over-year jump.
Despite that growth projection, Lucid has a history of falling short. It has missed revenue estimates multiple times in the last two years, including last quarter when it posted $336.6 million — up 68.3% year-over-year but still below expectations.
Lucid Cuts 12% of U.S. Workforce
Just days before the earnings release, Lucid confirmed it is laying off roughly 12% of its U.S. workforce. The cuts target non-hourly and salaried roles.
Hourly workers at its Arizona manufacturing facility, plus logistics and quality teams, are not part of the reduction. Lucid said the move is aimed at improving gross margins and pushing the company closer to profitability.
Analyst Targets and Ratings
Benchmark analyst Mickey Legg held his Buy rating and $30 price target on Lucid going into the report. He noted Q4 deliveries came in slightly ahead of his estimates and said the focus on Tuesday will be margins tied to the Gravity SUV ramp, cost control, and cash runway.
Legg does not expect the company to reach profitability until 2026 or 2027.
The broader analyst consensus is less upbeat. LCID carries a Moderate Sell rating, drawn from two Hold calls and one Sell over the past three months. The average price target stands at $12.67, implying roughly 30% upside from current levels.
How Peers Fared
General Motors posted a 5.1% revenue decline, missed estimates, but still gained 6.9% after its report. Autoliv topped estimates yet dropped 4.7% — showing that earnings reactions in the auto sector can be unpredictable.
Lucid’s Q4 2025 earnings are scheduled for Tuesday afternoon, February 24.

Despite a dreary backdrop for crypto markets, Gemini co‑founder Tyler Winklevoss remains stubbornly optimistic about the industry. Publicly bullish, he has watched his company’s fortunes wobble as on‑chain data reveal a steady retreat from riskier bets by Winklevoss Capital. An on-chain tracker shows the family office’s Bitcoin exposure shrinking from roughly 23,000 BTC in February 2025 to under 11,000 BTC in February 2026, underscoring a cautious stance amid a broader downturn. Meanwhile, Gemini disclosed a more favorable revenue trajectory for 2025 in an SEC filing, pointing to resilience in user activity even as the firm reorients its business model toward regulated products and custody services. The duality—founder confidence versus a tightening operating environment—frames a pivotal moment for the exchange and its broader ecosystem.
Key takeaways
- Gemini’s leadership reshuffle is underway, with the company confirming a major executive transition and Cameron Winklevoss absorbing several duties previously handled by the COO, as an 8‑K filing indicates.
- Winklevoss Capital’s BTC balance has fallen sharply, from about 23,000 BTC in February 2025 to under 11,000 BTC in February 2026, according to on-chain trackers.
- Gemini’s SEC disclosure projects 2025 net revenue between $165 million and $175 million, up from $141 million in 2024, with roughly 600,000 monthly transacting users—an indicator of user activity despite headwinds.
- The firm is cutting up to 25% of its staff and narrowing its geographic focus to the US and Singapore, exiting the UK, EU, and Australia to streamline operations.
- Bloomberg’s report highlights Gemini’s shrinking market share in January 2026 and signals a pivot toward a CFTC‑regulated prediction markets platform, custody services, and other regulated offerings.
- Market sentiment in the crypto space remains subdued, with miners selling BTC reserves, spot ETFs under pressure, and fear metrics at elevated levels, underscoring a difficult macro backdrop.
Tickers mentioned: $BTC
Sentiment: Bearish
Market context: The sector is contending with a harsh price environment and liquidity constraints. Miners such as Bitdeer have liquidated BTC treasuries, US spot Bitcoin ETFs have bled in recent weeks, and sentiment gauges have sunk to extreme fear, underscoring a challenging macro and liquidity backdrop for crypto businesses.
Why it matters
The sequence of events at Gemini—costs rising sharply, leadership changes, and a strategic pivot toward regulated products—offers a window into how crypto platforms are recalibrating in a strained market. The company’s 8‑K filing confirms a substantial leadership shakeup, with Cameron Winklevoss stepping into expanded operational responsibilities as interim executives assume key financial and legal roles. This shift occurs as the firm emphasizes a pivot toward a CFTC‑regulated prediction markets framework, in addition to custody and credit services. The move reflects a broader industry trend: firms seeking to anchor themselves in regulated domains to navigate an environment of heightened scrutiny and thinning liquidity.
On the capital side, Winklevoss Capital’s on‑chain activity provides a contrasting counterpoint to the public optimism voiced by Tyler Winklevoss. The Bitcoin (CRYPTO: BTC) balance reduction signals a recalibration of risk and a possible shift away from treasury allocations that could constrain future fundraising or growth initiatives. The decline from roughly 23,000 BTC to under 11,000 BTC suggests a deliberate stance on reserve management during a protracted downturn, aligning with a broader pattern of institutions reassessing crypto exposure in a market characterized by volatility and slower transactional growth.
Gemini’s SEC filing paints a more constructive picture of fundamentals. Projected 2025 net revenue of $165–$175 million, up from $141 million in 2024, paired with about 600,000 monthly transacting users, indicates sustained consumer activity and a revenue base that may enable profitable scaling via regulated products. Yet the accompanying rise in operating expenses—anticipated at $520–$530 million versus $308 million a year earlier—highlights the heavy investment needed to retool the business for a compliant, diversified product suite. This cost trajectory underscores the complexity of balancing growth with compliance costs in a highly regulated space.
The market backdrop helps explain why the firm’s pivot has gained attention. Bloomberg’s reporting that Gemini’s spot market share contracted to around 0.1% in January, down from roughly 0.6% in June 2025, underscores the competitive pressures facing mid‑sized exchanges trying to maintain relevance when price action remains volatile and liquidity scarce. The narrative around pivoting away from pure exchange activity toward regulated futures, custody, and other services adds a layer of strategic nuance to a company still seeking scale post‑IPO volatility and in the face of tighter capital markets.
From a sentiment standpoint, the crypto ecosystem has drifted toward risk aversion. While some high‑conviction Bitcoin holders continue to accumulate, the chorus of caution—driven by macro headwinds, regulatory skepticism, and a string of high‑profile corporate restructurings—creates a portrait of a market that values durability and compliance over rapid expansion. The divergence between Winklevosses’ public optimism and the industry’s cautious mood captures a central tension that may define Gemini’s trajectory in the near term: endurance and recalibration over expansion at any cost.
Beyond Gemini, investors and builders are watching whether the CFTC‑regulated prediction markets platform gains traction, whether custody and card offerings scale as intended, and how the firm balances staff costs with growth ambitions. The interplay between front‑line product delivery and back‑end risk controls will be a critical determinant of whether Gemini can reestablish momentum in a market where even the most established players face meaningful headwinds.
What to watch next
- Watch for updates to Gemini’s 8‑K and other regulatory filings that detail the extent of leadership realignment and the status of the COO/CFO/CLO transitions.
- Monitor progress on the planned CFTC‑regulated prediction markets platform, as well as the custody and card services roadmap, to assess how the pivot translates into revenue diversification.
- Track any additional changes to BTC exposure via Winklevoss Capital or related entities, and assess how these moves interact with Gemini’s product strategy and capital needs.
- Note further staff adjustments and regional regrouping announcements, particularly any new US or Singapore initiatives that replace previous international expansions.
- Keep an eye on macro market signals—including ETF flows, miner behavior, and sentiment indices—that could influence the pacing of Gemini’s turnaround efforts.
Sources & verification
- Gemini’s 8‑K filing with the U.S. Securities and Exchange Commission (gemi-20260217.htm).
- Arkham on-chain tracker for Winklevoss Capital’s BTC balance and the decline from ~23,000 BTC to under 11,000 BTC (Arkham explorer: https://intel.arkm.com/explorer/entity/winklevoss-capital).
- Bloomberg report detailing Gemini’s shrinking market share and pivot toward regulated offerings (article linked in the original reporting).
- Cointelegraph reporting on Gemini’s staff reductions and regional focus shift (Feb 5, 2026), and leadership moves (Cameron Winklevoss absorbing COO duties).
- Spot market and investor sentiment references, including mentions of Bitdeer and Fear & Greed Index dynamics covered in the linked articles.
Gemini pivots amid market downturn
Despite a brutal sell‑off in risk assets, Gemini’s leadership remains focused on repositioning the platform for a more regulated, durable business model. The firm’s 8‑K filing confirms a sweeping leadership change, with Cameron Winklevoss assuming a broader operational remit as the company also navigates the departure of its chief operating officer, chief financial officer, and chief legal officer. The immediate implication is a management team recalibrating priorities toward regulated products, custody, and other services designed to build resilience in a market defined by caution and capital tightening. The company’s public messaging has stressed continuity, even as it restructures around a more compliance‑driven product strategy, and in parallel, on‑chain data shows the family office adjusting its Bitcoin holdings in response to changing risk appetites (CRYPTO: BTC).
Gemini’s revenue outlook, reflected in the SEC filing, suggests a company with growing user engagement. The prospect of 600,000 monthly transacting users and a net revenue range of $165–$175 million for 2025 indicates that a significant portion of its business remains anchored in consumer activity, even as costs rise. The pronounced increase in operating expenses signals front‑end investments in compliance, risk management, and product development—areas likely essential to delivering regulated solutions that could attract institutional and retail participants seeking safer exposure.
On the external side, the market’s mood has been persistently bearish, with miners and token holders exhibiting a cautious stance. The Arkham data point on Winklevoss Capital’s BTC balance and the Bloomberg note on Gemini’s shrinking spot market share reflect a sector grappling with liquidity and competition in a landscape where new regulatory frameworks could redefine how exchanges compete. In this context, Gemini’s pivot toward regulated services may be as much a defensive maneuver as it is a strategic reorientation—an effort to align with stricter oversight while leveraging a profitable, compliant product slate that could weather cyclical downturns more effectively than a pure‑play exchange model.
The path forward will hinge on execution: can Gemini scale its custody and regulated product offerings, integrate the predicted markets platform with robust risk controls, and sustain user growth amid ongoing cost discipline? The answers will influence whether Winklevoss’s optimism translates into a durable edge in an era where investors demand transparency, regulatory alignment, and tangible, near‑term value creation from crypto platforms.
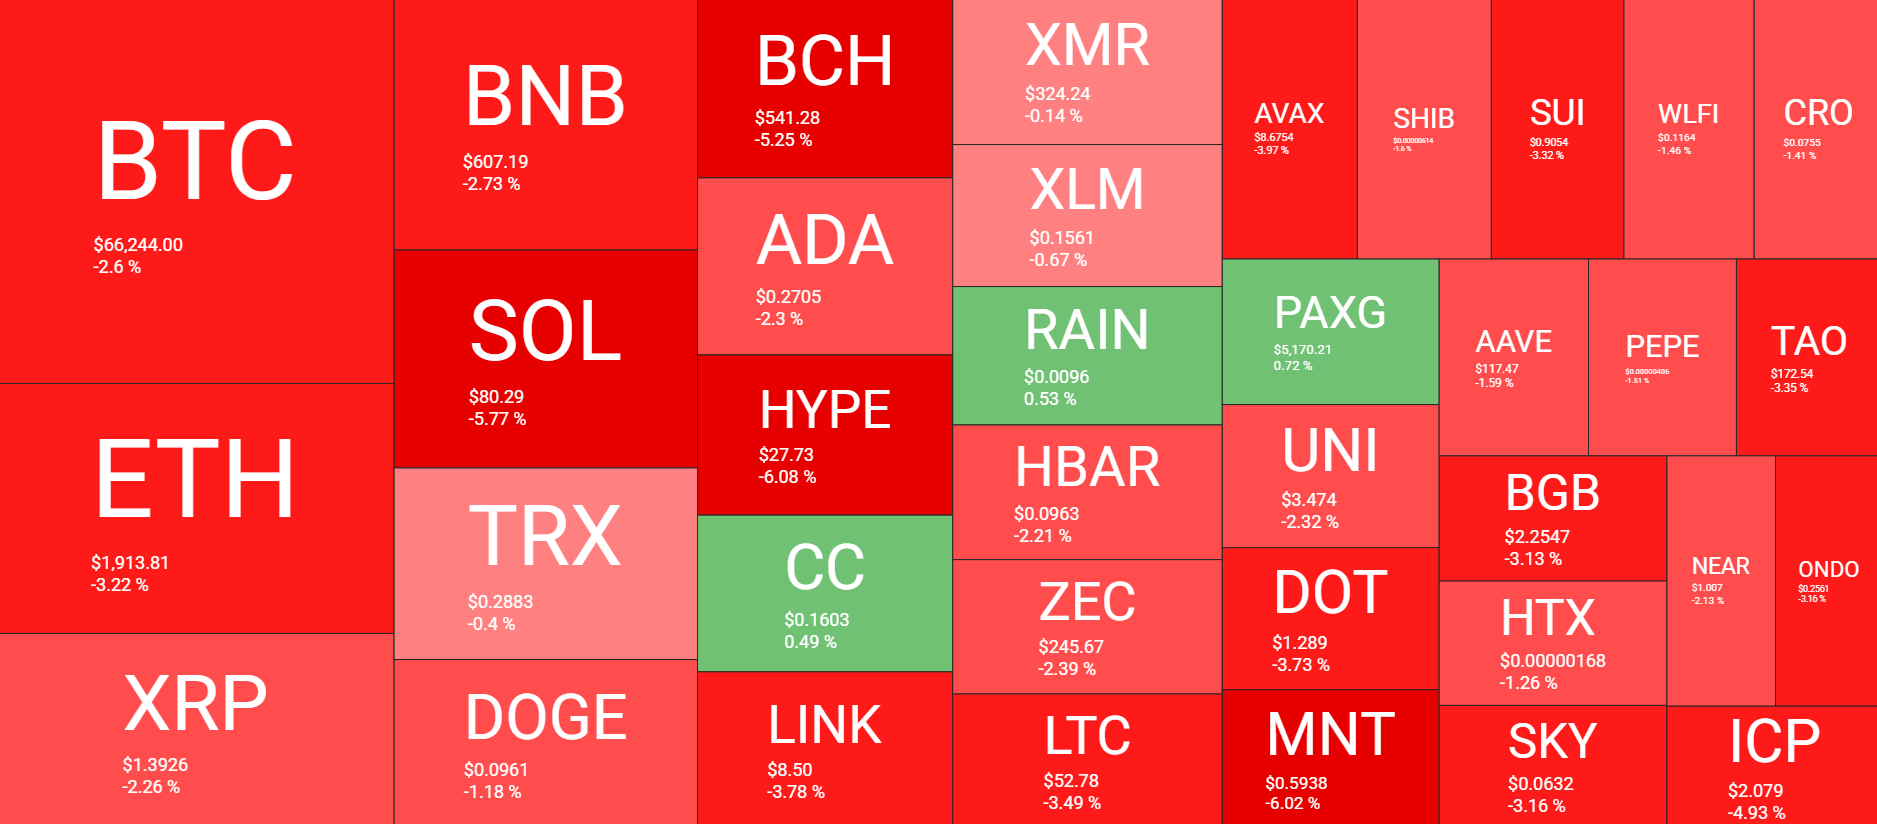
PUMP and HYPE are among the poorest performers, while Pippin has defied the market correction once again.
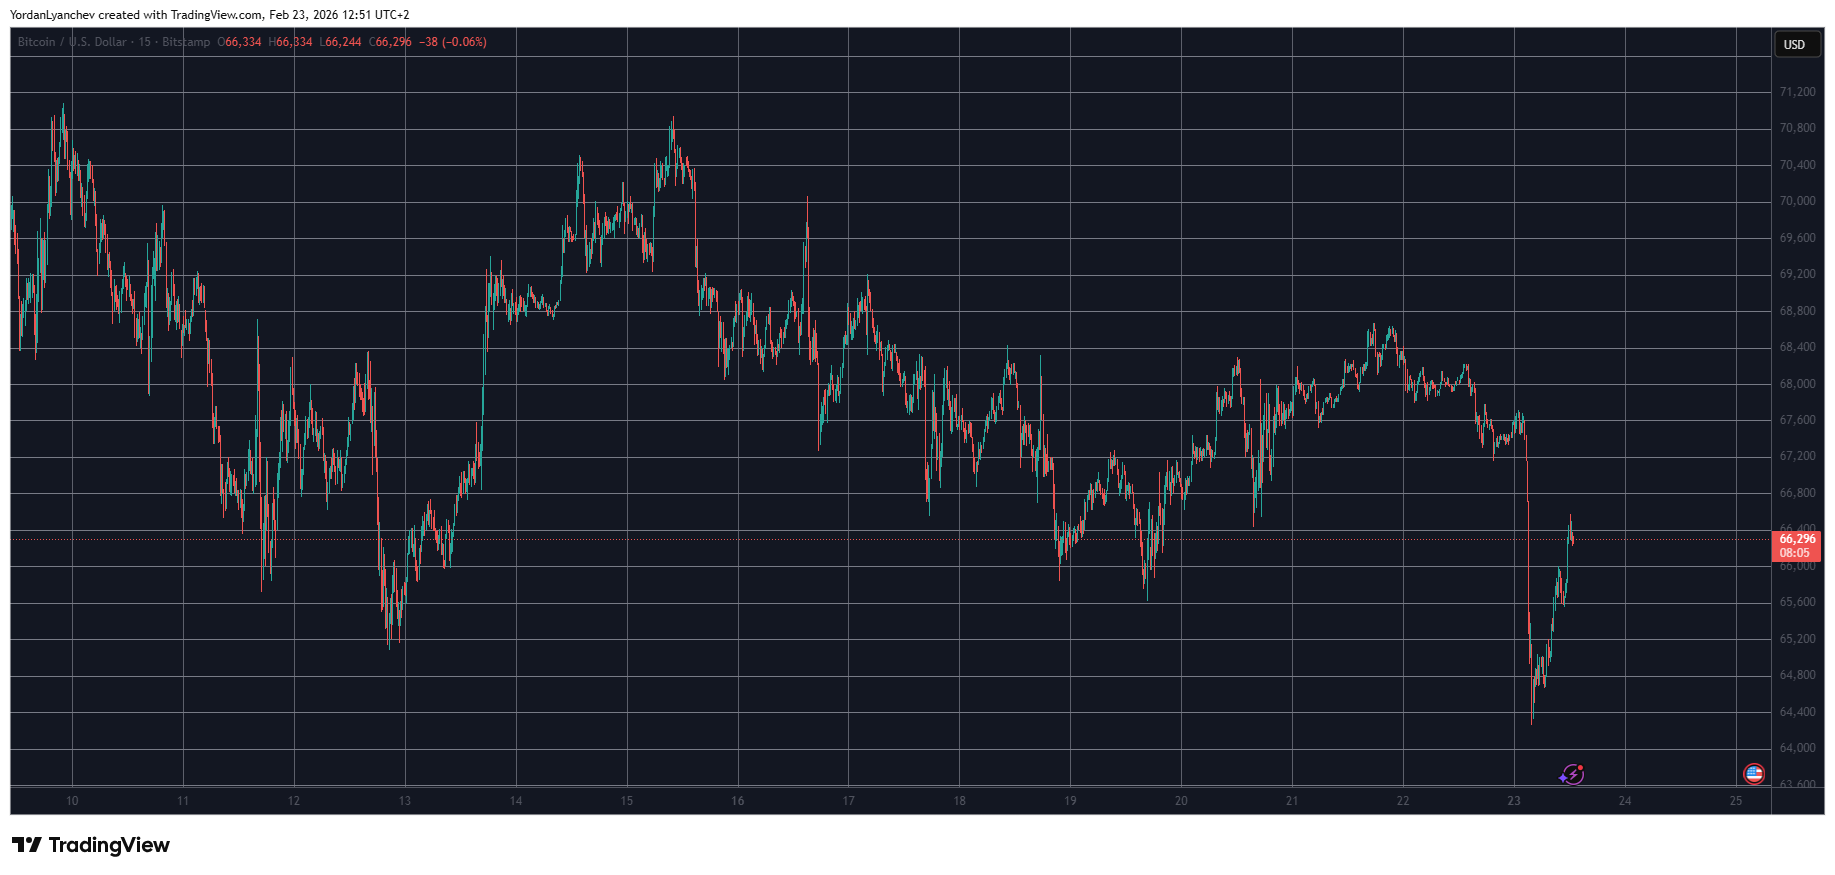
Bitcoin’s weekend calmness came to an end once the legacy futures markets opened, and the asset tumbled below $64,500 for the first time in over two weeks before bouncing back by a couple of grand.
Most altcoins followed suit, with SOL, HYPE, and BCH being among the worst performers from the larger caps.
BTC Dipped Below $64.5K
The previous weekend was a lot more positive for the primary cryptocurrency as it jumped past $70,000 and to almost $71,000 for the first time in about a week. However, the downtrend began on Monday with a rejection and a retracement to under $67,500. After a few unsuccessful rebound attempts, BTC slipped once again on Thursday to $65,600.
The bulls finally intervened at this point and helped bitcoin recover to almost $69,000 during the weekend. It remained in a tight range between $67,500 and $68,500 for most of Saturday and Sunday.
However, there was an elephant in the room that had to be addressed. After the US Supreme Court ruled against some of his tariffs, President Trump imposed a new global taxation of 10%, which he later wanted to raise to 15%.
Although BTC remained unfazed at first, it started to unravel once the legacy futures market opened late on Sunday and early Monday. In the span of an hour or so, bitcoin slumped by four grand to a 17-day low of $64,300, leaving millions in liquidations.
It reacted well to this crash and now sits above $66,000. Nevertheless, it’s still 2.5% down on the day, and its market cap has slipped to $1.325 trillion on CG. Its dominance over the alts stands close to 56.5%.

Alts Bleed Out
Ethereum fell from almost $2,000 to $1,850 before it bounced to just over $1,900 as of now. XRP is down by over 2% to $1.40. BNB, DOGE, ADA, and LINK have marked similar losses. Even more painful declines are evident from BCH, SOL, and HYPE, with losses of up to 6%.
In contrast, PIPPIN has skyrocketed by over 23% daily to over $0.72. The asset has defied the broader market’s correction once again. TON and M are also slightly in the green.
The total crypto market cap, though, has lost over $60 billion and is down to $2.350 trillion on CG.
Binance Free $600 (CryptoPotato Exclusive): Use this link to register a new account and receive $600 exclusive welcome offer on Binance (full details).
LIMITED OFFER for CryptoPotato readers at Bybit: Use this link to register and open a $500 FREE position on any coin!
Disclaimer: Information found on CryptoPotato is those of writers quoted. It does not represent the opinions of CryptoPotato on whether to buy, sell, or hold any investments. You are advised to conduct your own research before making any investment decisions. Use provided information at your own risk. See Disclaimer for more information.


Ethereum founder Vitalik Buterin is offloading ether (ETH) worth millions, adding bearish pressure in an already weak market.
Buterin has sold 1,869 ether, worth $3.67 million, over two days, having withdrawn 3,500 ether from Aave, according to data tracked by blockchain sleuth Lookonchain.
Ether’s price has declined nearly 3% over the past 48 hours, hitting a 20-day low of $1,844 at one point early Monday, CoinDesk data shows. The token has been in a downtrend since hitting a high of over $4,900 in August last year.
Since Feb. 2, Buterin has supposedly sold almost over 8,000 ether. These sales follow a Jan. 30 announcement that he would withdraw and liquidate his 16,384 ether to finance ecosystem development, open-source software and other key initiatives while the Ethereum Foundation enters a “mild austerity” phase.
Still, as of writing, Buterin held over 224,000 ether, worth $429 million, according to Arkham Intelligence.
While Buterin has been trimming his holdings, this supply is being gobbled up by the likes of ShapeShift Founder Erik Voorhees and a whale associated with crypto services provider Matrixport.

Prominent Islamic finance figure Mohd Daud Bakar, two others charged over unlicensed trading

Kevin Hodgson appointed Office Manager at Jorvik Tricycles
Smiths News faces possible pension fund claim for collapsed Tuffnells scheme


-

 Video7 days ago
Bitcoin: We’re Entering The Most Dangerous Phase
-

 Crypto World6 days ago
Can XRP Price Successfully Register a 33% Breakout Past $2?
-

 Video3 days ago
XRP News: XRP Just Entered a New Phase (Almost Nobody Noticed)
-

 Fashion3 days ago
Weekend Open Thread: Boden – Corporette.com
-

 Sports6 days ago
GB's semi-final hopes hang by thread after loss to Switzerland
-

 Politics1 day ago
Baftas 2026: Awards Nominations, Presenters And Performers
-
 Tech6 days ago
The Music Industry Enters Its Less-Is-More Era
-

 Business6 days ago
Infosys Limited (INFY) Discusses Tech Transitions and the Unique Aspects of the AI Era Transcript
-

 Entertainment5 days ago
Kunal Nayyar’s Secret Acts Of Kindness Sparks Online Discussion
-

 Video6 days ago
Financial Statement Analysis | Complete Chapter Revision in 10 Minutes | Class 12 Board exam 2026
-

 Tech5 days ago
Retro Rover: LT6502 Laptop Packs 8-Bit Power On The Go
-
 Sports4 days ago
Clearing the boundary, crossing into history: J&K end 67-year wait, enter maiden Ranji Trophy final | Cricket News
-

 Business1 day ago
Mattel’s American Girl brand turns 40, dolls enter a new era
-

 Business20 hours ago
Law enforcement kills armed man seeking to enter Trump’s Mar-a-Lago resort, officials say
-

 Entertainment5 days ago
Dolores Catania Blasts Rob Rausch For Turning On ‘Housewives’ On ‘Traitors’
-

 Business5 days ago
Tesla avoids California suspension after ending ‘autopilot’ marketing
-
 NewsBeat3 hours ago
‘Hourly’ method from gastroenterologist ‘helps reduce air travel bloating’
-

 Politics6 days ago
Eurovision Announces UK Act For 2026 Song Contest
-

 Tech20 hours ago
Anthropic-Backed Group Enters NY-12 AI PAC Fight
-

 NewsBeat18 hours ago
Armed man killed after entering secure perimeter of Mar-a-Lago, Secret Service says