

Crypto World
Domino’s Pizza (DPZ) Stock Rises on Strong Q4 Results and 14% Dividend Hike

TLDR
- U.S. same-store sales grew 3.7% in Q4, beating analyst estimates of 3.47%
- Revenue hit $1.54B, up 6.4% year-over-year and $20M above expectations
- EPS came in at $5.35, slightly below the consensus estimate of $5.37–$5.39
- Quarterly dividend raised by more than 14%, the latest in a string of increases
- DPZ stock climbed as much as 6% at Monday’s open following the results
Domino’s Pizza had a busy Monday morning. The pizza giant posted Q4 results that sent its stock climbing nearly 6% at the open, fueled by strong domestic sales, a dividend hike, and its 32nd consecutive year of international same-store sales growth.
U.S. same-store sales rose 3.7% for the quarter. That beat analyst expectations of 3.47% growth, driven by value-focused promotions and new menu items.
International same-store sales told a slightly different story. Growth came in at 0.7% for the quarter per Investing.com, or 1.9% according to Seeking Alpha’s figures, both reflecting pressure in markets like Australia and Japan where competition is fierce and demand has been soft.
Total revenue for Q4 reached $1.54 billion, a 6.4% increase from the same period last year. That came in roughly $20 million ahead of what analysts had penciled in.
Earnings per share landed at $5.35, up from $4.89 a year earlier — a 9.4% jump. But it missed the consensus estimate, which ranged between $5.37 and $5.39 depending on the source.
The stronger profit figure was helped by $80 million in share buybacks during the year, which reduced the weighted average share count.
Dividend Boost
Domino’s raised its quarterly dividend by 14.4%. That’s a meaningful bump and came alongside what the company described as company-wide profit growth of 9%.
Revenue growth was supported by a 1.7% increase in food basket pricing, higher franchisee profits, and improved sales in both domestic and international markets.
Margin Pressure
Not everything moved in the right direction. The U.S. company-owned store gross margin narrowed sharply, falling 540 basis points to 15.5%. Higher insurance, labor, and food costs were to blame.
Overall gross margin, which includes international markets, told a better story — expanding 50 basis points to 39.7%.
CEO Russell Weiner pointed to the company’s “Hungry for MORE” strategy as the driver behind the results. “In 2025 we demonstrated that when we execute our Hungry for MORE strategy, it delivers MORE sales, MORE stores, and MORE profits,” he said.
Looking ahead, Weiner said the company expects to “meaningfully increase” its market share in the U.S. quick-service pizza category in 2026.
DPZ stock has declined 15.6% over the past 12 months. The stock was trading at $403.04 in premarket on Monday, up 4.8% at that point.


Crypto World
Solana Company starts building high-speed infrastructure to prepare SOL for next ‘super cycle’
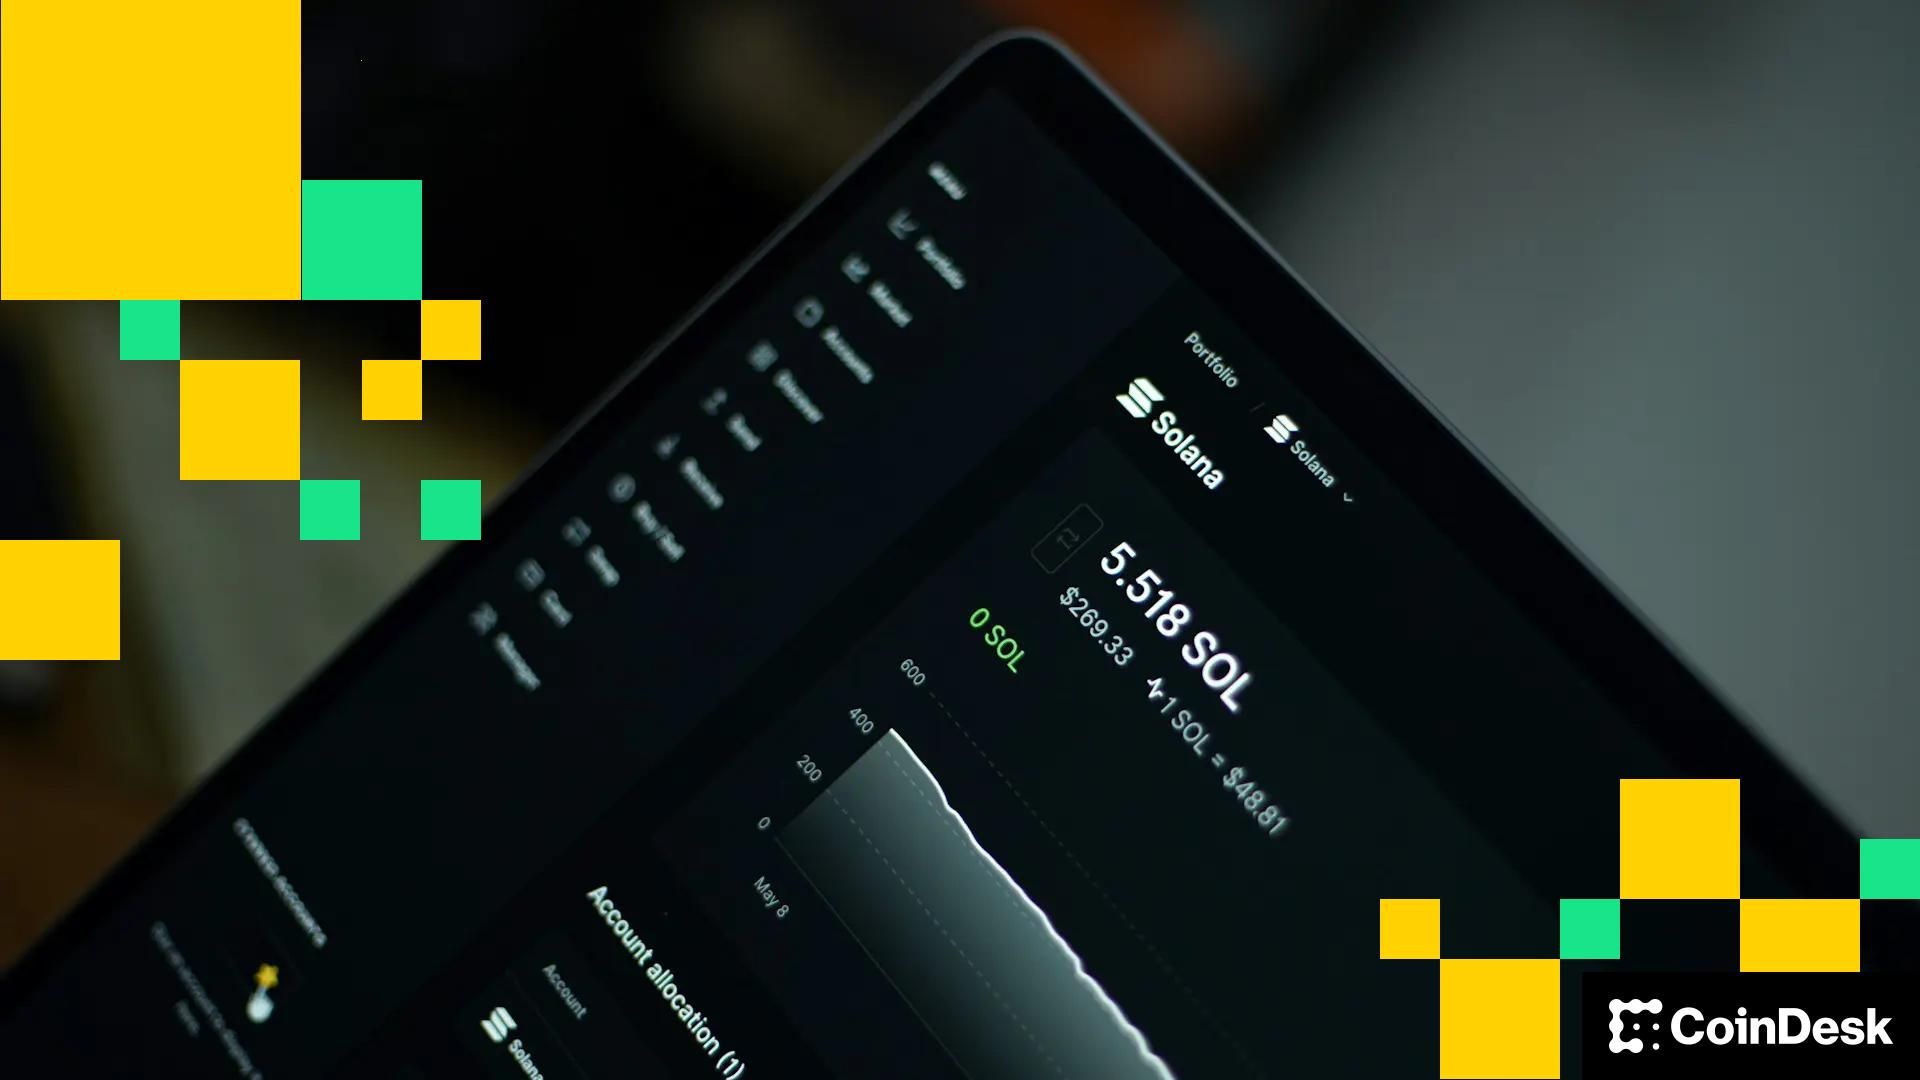

Solana Company (HSDT) said it plans to build a high-speed infrastructure network across the Asia-Pacific region to support the growth of the Solana blockchain and diversify its revenue streams.
The initiative, called the “Pacific Backbone,” will connect Seoul, Tokyo, Singapore and Hong Kong with a low-latency cluster designed to support staking, validation and trading services on Solana.
The move targets institutional demand across the region, which has become a hotspot for crypto adoption, cross-border payments and digital asset development.
The buildout aims to make Solana’s infrastructure more accessible and reliable for market makers, high-frequency traders, and financial institutions, according to a press release.
The company said the project will begin immediately, with performance optimization and additional product launches expected in the next 12 to 18 months. These include DeFi tools, liquid staking, automated market makers and execution services tailored to traditional finance firms entering the space.
Joseph Chee, CEO of Solana Company, said the expansion will help prepare for what he called Solana’s “next super cycle.”
The goal is to reduce reliance on external service providers, reduce latency, and provide a compliant infrastructure that meets institutional requirements in regulated markets.
Solana, the firm said, processes over 3,500 transactions per second and supports millions of daily active wallets. Solana Company is currently the second-largest Solana treasury firm, with 2.3 million SOL, or over $180 million, in its treasury.
Solana Company’s shares are down 13.3% in today’s trading session to $1.76, amid a wider cryptocurrency market drawdown. Solana itself is down nearly 6% in the last 24-hour period, while BTC is down more than 4%.
CoinDesk has reached out to Solana Company for comment but hasn’t heard back at the time of writing.


- Polygon price rose about 5% in the past 24 hours.
- The token continues to hold above $0.10.
- A surge in transactions, stablecoin adoption and POL burning is helping price gains.
Polygon (POL), formerly MATIC, has stabilized above the $0.10 support level despite ongoing market volatility.
As macroeconomic and geopolitical headwinds pressure Bitcoin and Ethereum prices lower, POL is showing great resilience.
The token has gained in the past 24 hours and trends among top performers on the day, outpacing several of its layer 2 peers. Can bulls reclaim key levels and push higher despite overall market weakness?
Why is Polygon price up today?
POL’s uptick today includes a notable rise to intraday highs above $0.11. The token revisited prices around $0.10 but showed resilience amid its bounce from under the psychological level.
Bitcoin’s dip to $65k looks to have allowed for some capital rotation into small cap tokens, including POL.
While this looks to be a plausible reason for the bounce, Polygon’s upward move largely stems from recent momentum, helped by robust stablecoin volume and deflationary dynamics.
The L2 has seen a huge leap in terms of USDC transactions on the network, leading to Ethereum scaling solutions.
.@USDC activity is exploding on Polygon
(#1 chain for transactions) pic.twitter.com/76xh4jenGP
— Polygon | POL (@0xPolygon) February 13, 2026
DeFiLlama data shows the stablecoin market cap on Polygon stood at around $3.26 billion at the time of writing.
Analysts have noted that more than 100 million POL tokens have been burned on the Polygon network.
The token burn means a cut in circulating supply and potential upward price pressure.
In the past 30 days, about 32.6 million POL have been burned, slashing net issuance.
“Every transaction on Polygon generates fees,” the team wrote on X. “ From each fee: base fees are burned and priority fees are shared among validators, block producers, and stakers.”
The more activity there is, the more fees generated and the more POL burned and permanently removed from circulation. The token’s price could strengthen long-term amid this move.
POL price forecast
Polygon price appears to be riding the above bullish catalysts.
Trading volume rose more than 30% in the past 24 hours on Monday, hitting over $84 million.
In terms of short-term price forecast, POL currently eyes resistance at $0.12. This aligns with the horizontal hurdle of an ascending triangle pattern, and points to a potential uptick to highs of $0.30.
If bulls strengthen above $0.14 and decisively breach $0.20, continuation amid broader market gains will help galvanize this trajectory.
A breakdown of a similar outlook however, saw Polygon’s token plummet to recent lows. In this case, rejection at $0.12 or $0.14 could fuel further declines, with bears likely to eye $0.09 as the initial target.

Ethereum price continues to weaken after losing key value levels, with bearish market structure increasing the probability of a breakdown toward new yearly lows.
Summary
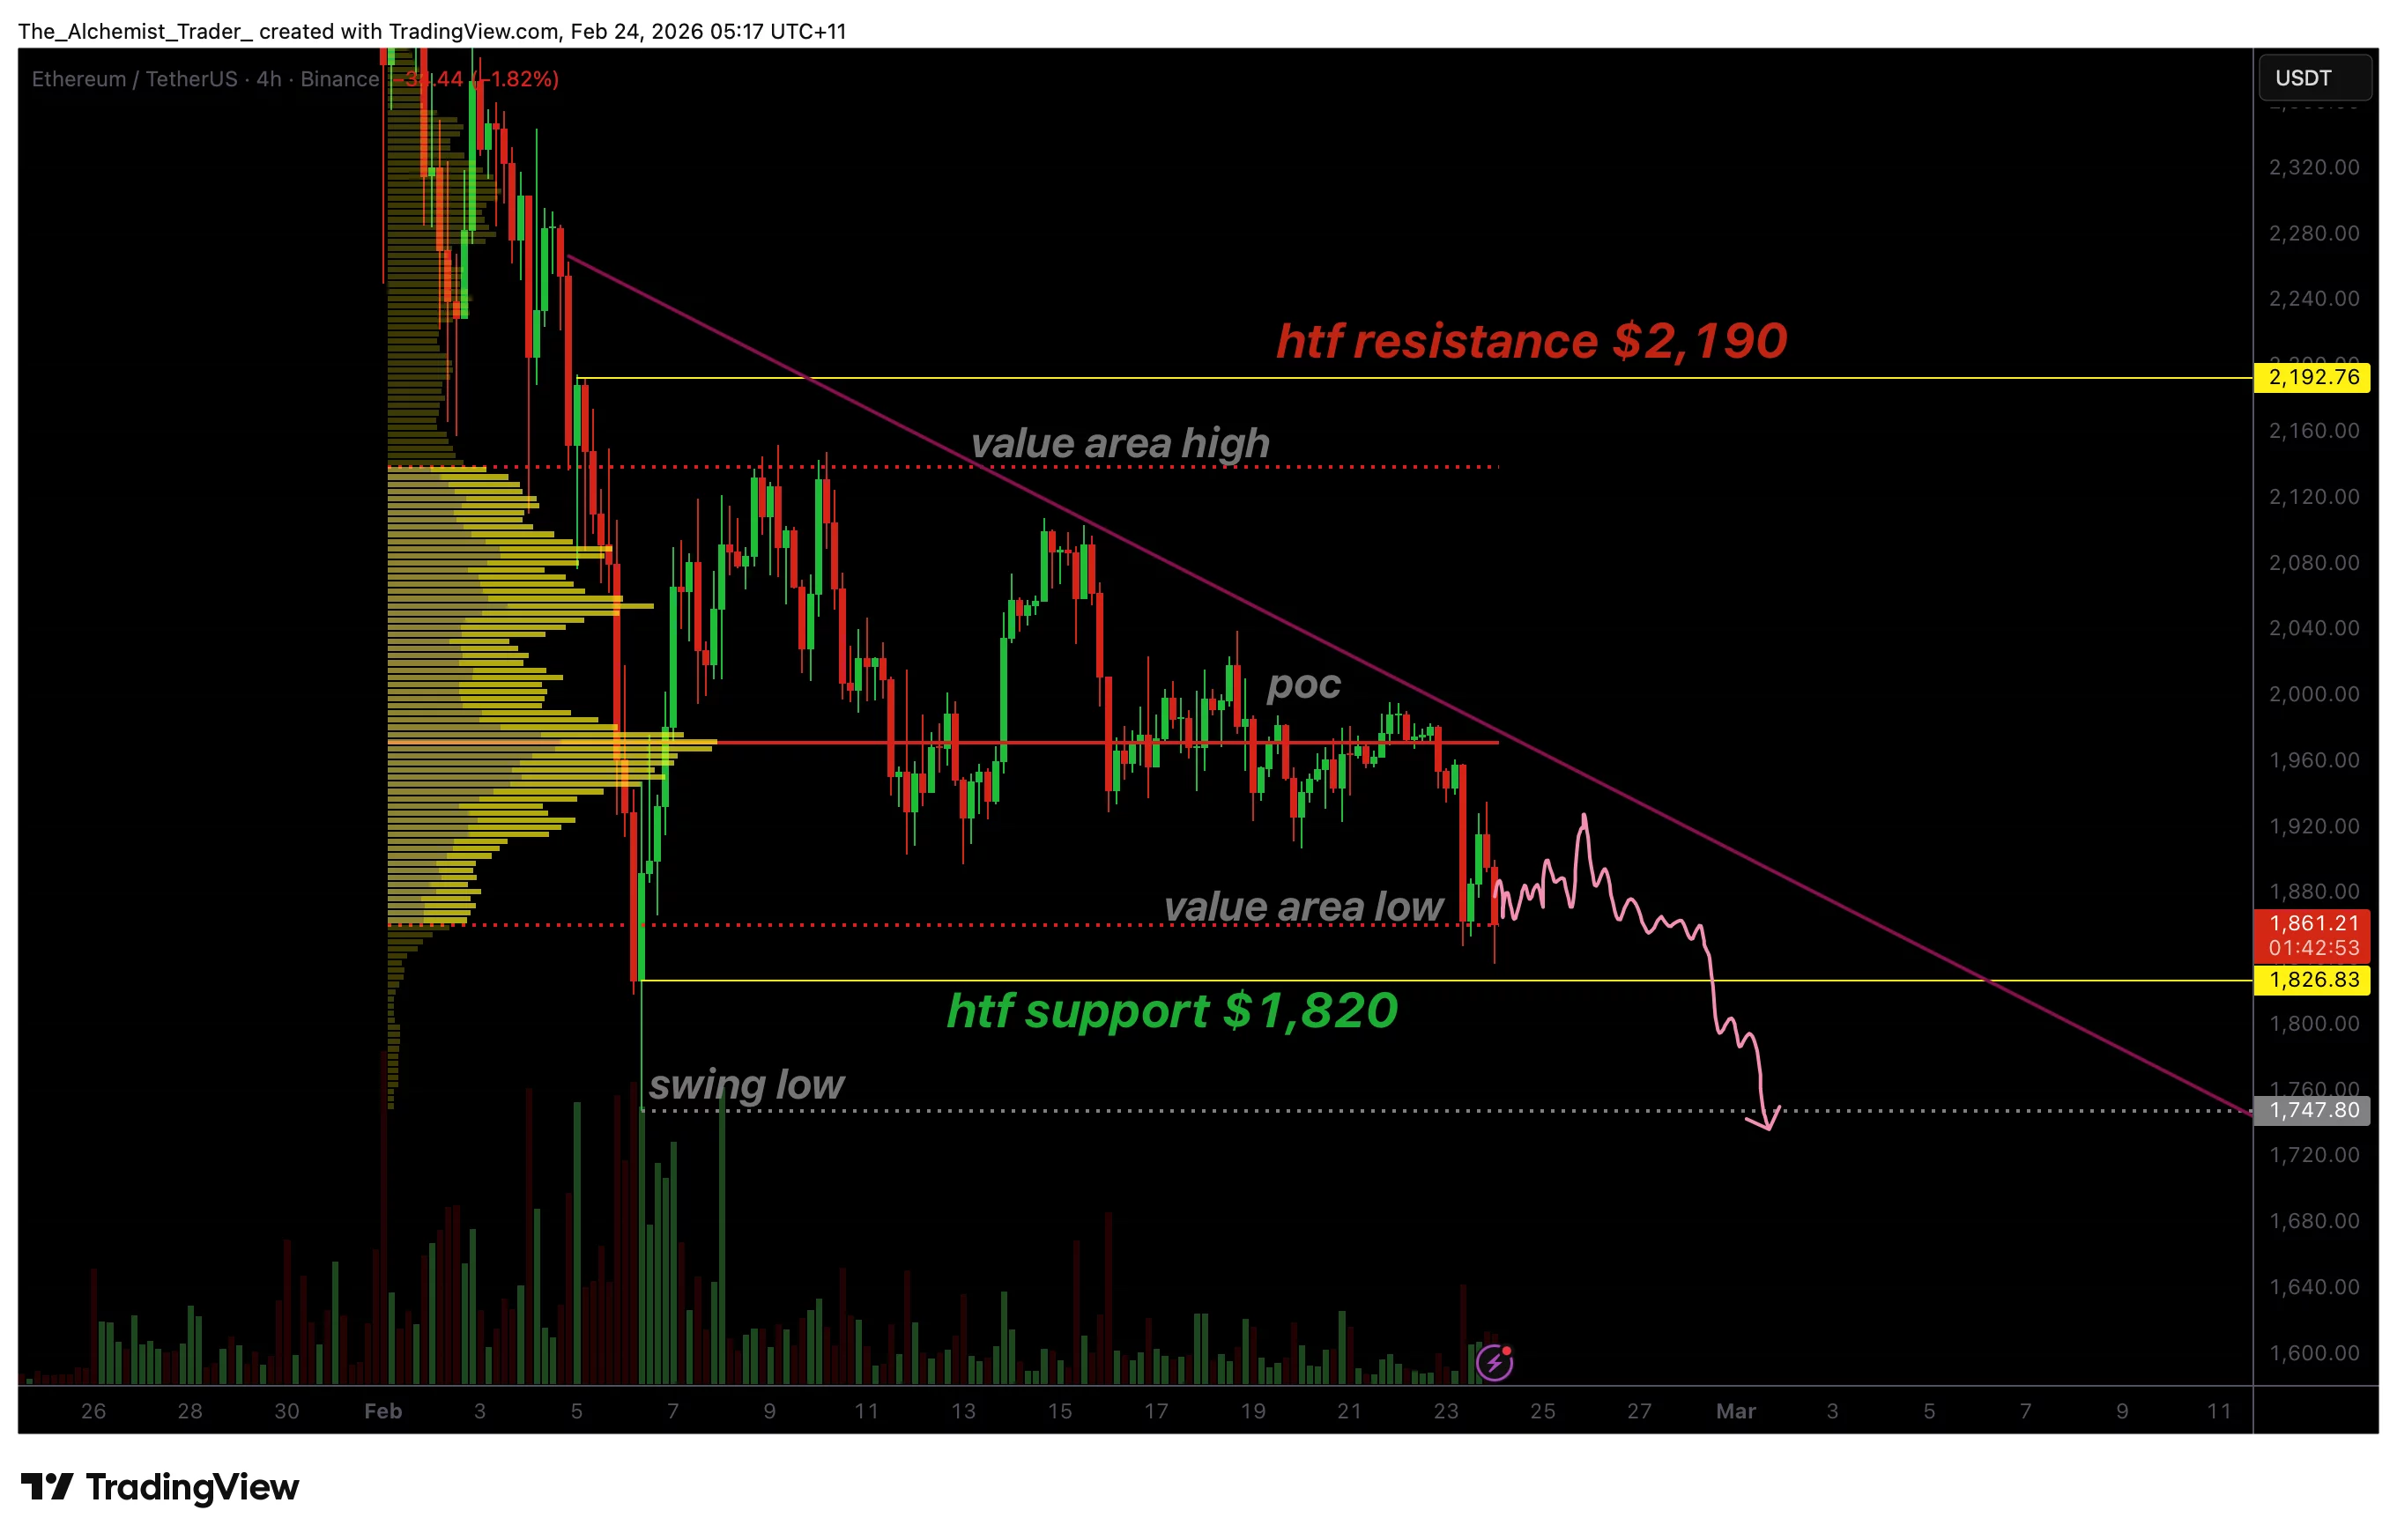
- Ethereum forming consecutive lower highs confirms bearish structure
- Loss of point of control signals value shifting lower
- Breakdown below $1,820 could trigger move toward $1,740 yearly lows
Ethereum (ETH) price action remains under sustained pressure as technical signals continue to point toward a dominant bearish market structure. Since losing the value area high, Ethereum has consistently printed lower highs, confirming a trend of weakening bullish momentum and increasing seller control across multiple timeframes.
Recent price developments further reinforce this bearish outlook. Ethereum has now lost acceptance around the point of control (POC), a critical level that previously represented fair value within the trading range. Following this breakdown, price rotated lower into the value area low, positioning the market dangerously close to a major high-timeframe support zone near $1,820.
With momentum fading and structural weakness continuing to develop, traders are increasingly watching whether Ethereum can defend this support or if the market is preparing to establish a new yearly low.
Ethereum prive key technical points
- Consecutive lower highs confirm bearish structure: Sellers maintain control since loss of value area high
- Point of control lost: Market acceptance shifting lower within the range
- $1,820 support critical: Breakdown could trigger move toward $1,740 and new yearly lows
Ethereum’s technical outlook shifted decisively bearish following the loss of the value area high. Since that event, price has repeatedly failed to reclaim higher value, forming a clear sequence of lower highs, a classic indication of trend continuation to the downside.
Markets often reveal directional intent through value migration. In Ethereum’s case, value has progressively moved lower, suggesting that participants are willing to transact at decreasing price levels. This behavior reflects declining demand rather than temporary volatility.
The recent loss of the point of control adds further confirmation to this trend. The POC typically acts as a balance area between buyers and sellers, and losing it often signals a transition from consolidation into directional expansion. Ethereum’s rejection and subsequent move into the value area low suggest that sellers remain firmly in control of short-term market dynamics.
High-timeframe support at $1,820 under pressure
The next major battleground for Ethereum lies at the high-timeframe support near $1,820. This region represents one of the final structural supports preventing a deeper corrective phase. Price has already begun probing liquidity near this level, highlighting its importance as a decision zone.
Support levels tend to weaken after multiple tests, particularly when approached under bearish momentum. Ethereum’s current approach toward $1,820 is occurring alongside declining structure and limited bullish follow-through, increasing the likelihood that support may eventually give way.
If buyers fail to generate a strong reaction at this level, the market could transition into accelerated downside movement. A confirmed breakdown below $1,820 would signal acceptance beneath major support and open the path toward lower liquidity zones.
$1,740 emerges as next downside target
Should Ethereum lose the $1,820 level, the next logical technical objective sits near the $1,740 region. This area aligns with historical demand and represents a deeper corrective target within the broader bearish framework.
A move toward $1,740 would likely mark the establishment of a new yearly low, reinforcing the continuation of Ethereum’s high-timeframe downtrend. In trending markets, new lows often occur once key support fails, as liquidity beneath prior extremes becomes an attractive target for price discovery.
Importantly, this scenario does not necessarily imply panic selling but rather a continuation of structural rebalancing. Markets frequently revisit lower support zones before establishing long-term accumulation phases.
What to expect in the coming price action
From a technical, price action, and market structure perspective, Ethereum remains bearish while trading below lost value levels. As long as lower highs continue to form and the $1,820 support remains under pressure, the probability favors further downside expansion.
A confirmed loss of $1,820 would likely trigger a move toward $1,740 and potentially establish a new yearly low, while any recovery would require Ethereum to reclaim higher value zones and restore bullish momentum.


A lending pool belonging to YieldBlox, a “DAO-managed money market,” has suffered a hack on the Stellar blockchain, with losses valued at over $10 million.
Script3, the developer of YieldBlox, announced the loss, which happened shortly after midnight (UTC) on Sunday, pointing to oracle manipulation as the cause.
Hacker addresses holding a total of 48 million XLM worth $7.5 million have been frozen on the Stellar blockchain.
Read more: ‘Bad actor’ Circle slammed for letting stolen $3M USDC sit unfrozen
Reflector, the firm behind the oracle in question, said its product “quoted correct prices,” pointing to market illiquidity as the cause of the mispricing.
In a thread posted to X, Reflector describes how the attacker targeted the illiquid USTRY/USDC market on Stellar’s exchange.
The pool’s market maker had “pulled all available liquidity… at some point,” and leading up to the exploit, there was less than $1 hourly volume.
According to the thread, the attacker pushed the price of USTRY from approximately $1.05 to over $100 in a single trade. They then used overvalued USTRY collateral to borrow against, withdrawing $10.2 million of assets.
A total of 61 million XLM and 1 million USDC were borrowed from the YieldBlox pool, according to DeFi security firm Decurity. Most of the USDC was bridged back to Ethereum, and 48 million XLM has been frozen.
YieldBlox Security Council sent an on-chain message to the hacker’s Ethereum address, offering a 10% bounty if the remaining funds are returned. The message offers to provide instructions on how to return the 48 million XLM held in the frozen addresses.
Stellar’s XLM experienced a sharp drop in price shortly after the hack, but has since fully recovered.
Weekend wipeout
After a fairly quiet couple of weeks for DeFi hacks, this weekend saw over $18 million worth of assets stolen.
On Saturday morning, IoTeX Bridge suffered a suspected private key compromise, with losses initially estimated at $8 million.
Security researcher Weilin Li observed the attacker “minted [a] huge amount of IOTX token” before “depositing to Binance for selling”.
However, an update from IoTeX revised the estimated “exploit impact” down to just $2 million. It called the incident “a sophisticated, long-planned attack by professional actors targeting multiple chains.”
Read more: Binance, OKX, HTX, Bybit, Kraken cited in ICIJ scam probe
According to blockchain auditor Peckshield, funds were bridged to bitcoin via THORChain.
THORChain has previously come under fire for profiting off the transfer of illicit funds. A notable example being last year’s $1.5 billion ByBit hack, the laundering of which ZachXBT estimated THORChain profited $200,000.
Got a tip? Send us an email securely via Protos Leaks. For more informed news, follow us on X, Bluesky, and Google News, or subscribe to our YouTube channel.
Further pump to $1.20 or crash to $0.10: what are PIPPIN’s next targets?
The latest developments on the tariff front stirred by US President Donald Trump seem to have negatively impacted the broader cryptocurrency market, with Bitcoin (BTC), Ethereum (ETH), and many other well-known digital assets charting losses for the day.
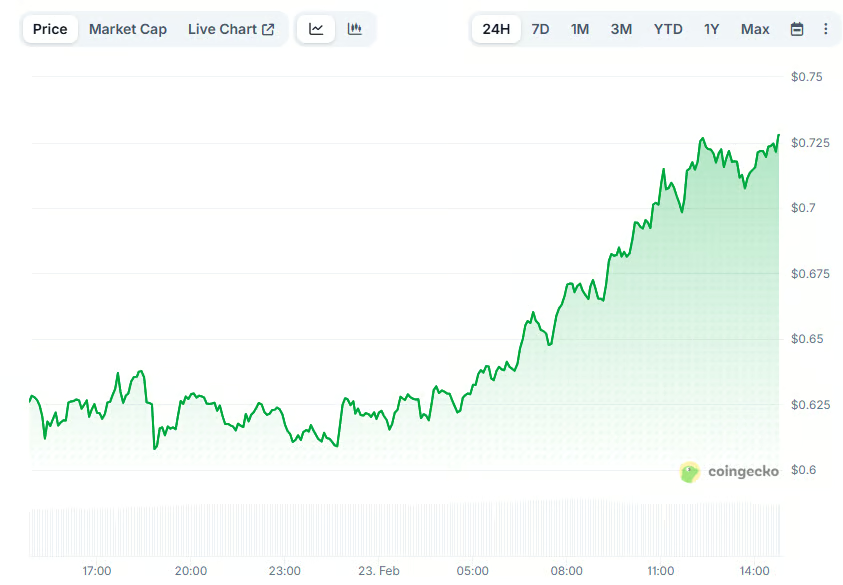
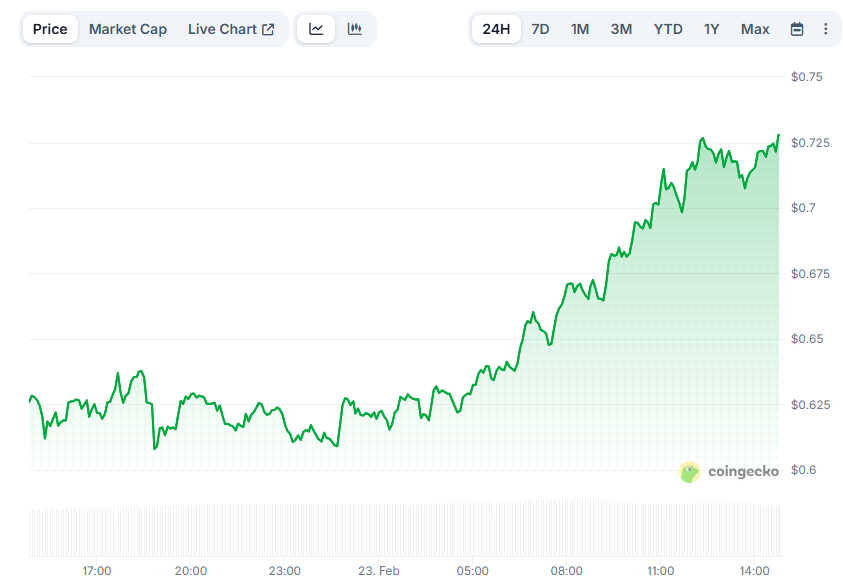
However, the meme coin pippin (PIPPIN) defied the latest carnage by posting a double-digit increase for that timeframe.
Top Performer Again
The meme coin was the talk of the town at the start of the month, surging to an all-time high of around $0.76 on February 15. It then underwent a sharp correction, but the past 24 hours have delivered another notable upswing.
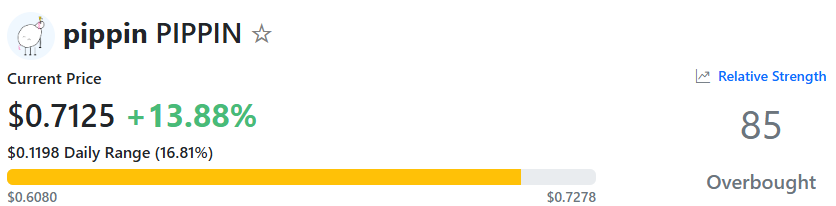
PIPPIN spiked by 20%, briefly exceeding $0.72 before stabilizing at around $0.71 (per CoinGecko’s data). Its market capitalization once again surpassed $700 million, bringing the asset back into the top 100 cryptocurrencies. As of press time, PIPPIN is the 81st-largest in the entire market and ranks seventh in the meme coin niche.
Some market observers believe the price may rally even more in the short term. X user Blockchainedbb recently predicted that the asset could experience enhanced volatility in the following weeks but eventually rise to as high as $1.20. They also described the zone around $0.50 as a “great” buying opportunity.
X user Satori chipped in, too, claiming that PIPPIN has become one of their “best plays lately.” According to the analyst, while maxis remained committed to BTC and waited for the next cycle to unfold, capital shifted elsewhere.
For his part, Sjuul | AltCryptoGems argued that the former resistance at $0.50 has turned into support, and expects the price to push back into its ATH zone again.
You may also like:
Of course, there are plenty of pessimists and critics who continue to voice their concerns. Crypto GVR, for instance, predicted that PIPPIN may soon fall below $0.10. Prior to that, X users va00sa and Shual warned that insiders control a large portion of the meme coin’s supply, allowing them to easily manipulate the price.
Is the Rally Sustainable?
Traders hoping to make fortunes overnight and considering whether to deal with PIPPIN should keep in mind that meme coins are infamous for their extreme volatility. Tokens in this category are often driven by pure hype speculation rather than solid fundamentals or real use cases, which means they can witness severe price drops in a very short period of time.
PIPPIN’s Relative Strength Index (RSI) also indicates that it might be time for a pullback. The technical analysis tool is often used by traders to spot possible trend reversals. It ranges from 0 to 100, and readings above 70 suggest the price has risen too much over a brief span and may be due for a correction. Conversely, values below 30 are considered bullish territory. As of this writing, the RSI stands at around 85.
Binance Free $600 (CryptoPotato Exclusive): Use this link to register a new account and receive $600 exclusive welcome offer on Binance (full details).
LIMITED OFFER for CryptoPotato readers at Bybit: Use this link to register and open a $500 FREE position on any coin!
Cardano price has entered a critical phase after confirming a bearish breakdown. The token has already lost key support, and the technical structure now points toward deeper downside risk. Yet, even as large holders continue selling and avoid re-entering, smaller investors are aggressively buying the dip.
This creates a dangerous split in the market. Whales appear to be stepping aside, while retail investors are stepping in. The key question now is whether retail is buying the bottom — or walking into the next leg lower.
Whales Dump 120 Million ADA Before Breakdown — And Still Refuse to Buy Back
Cardano’s recent price drop of nearly 5% over the past 7 days did not come without warning. The largest whale cohort holding between 100 million and 1 billion ADA began reducing holdings days before the head-and-shoulders breakdown happened.
Want more token insights like this? Sign up for Editor Harsh Notariya’s Daily Crypto Newsletter here.
On February 19, this group held about 2.54 billion ADA. By February 23, their holdings had fallen to 2.42 billion ADA. This represents a drop of around 120 million ADA, roughly 30 million.
This selling started even before the head-and-shoulders breakdown confirmed on February 22. In other words, whales reduced exposure while the pattern was still forming, suggesting they anticipated further downside. More importantly, whales have not started buying back.
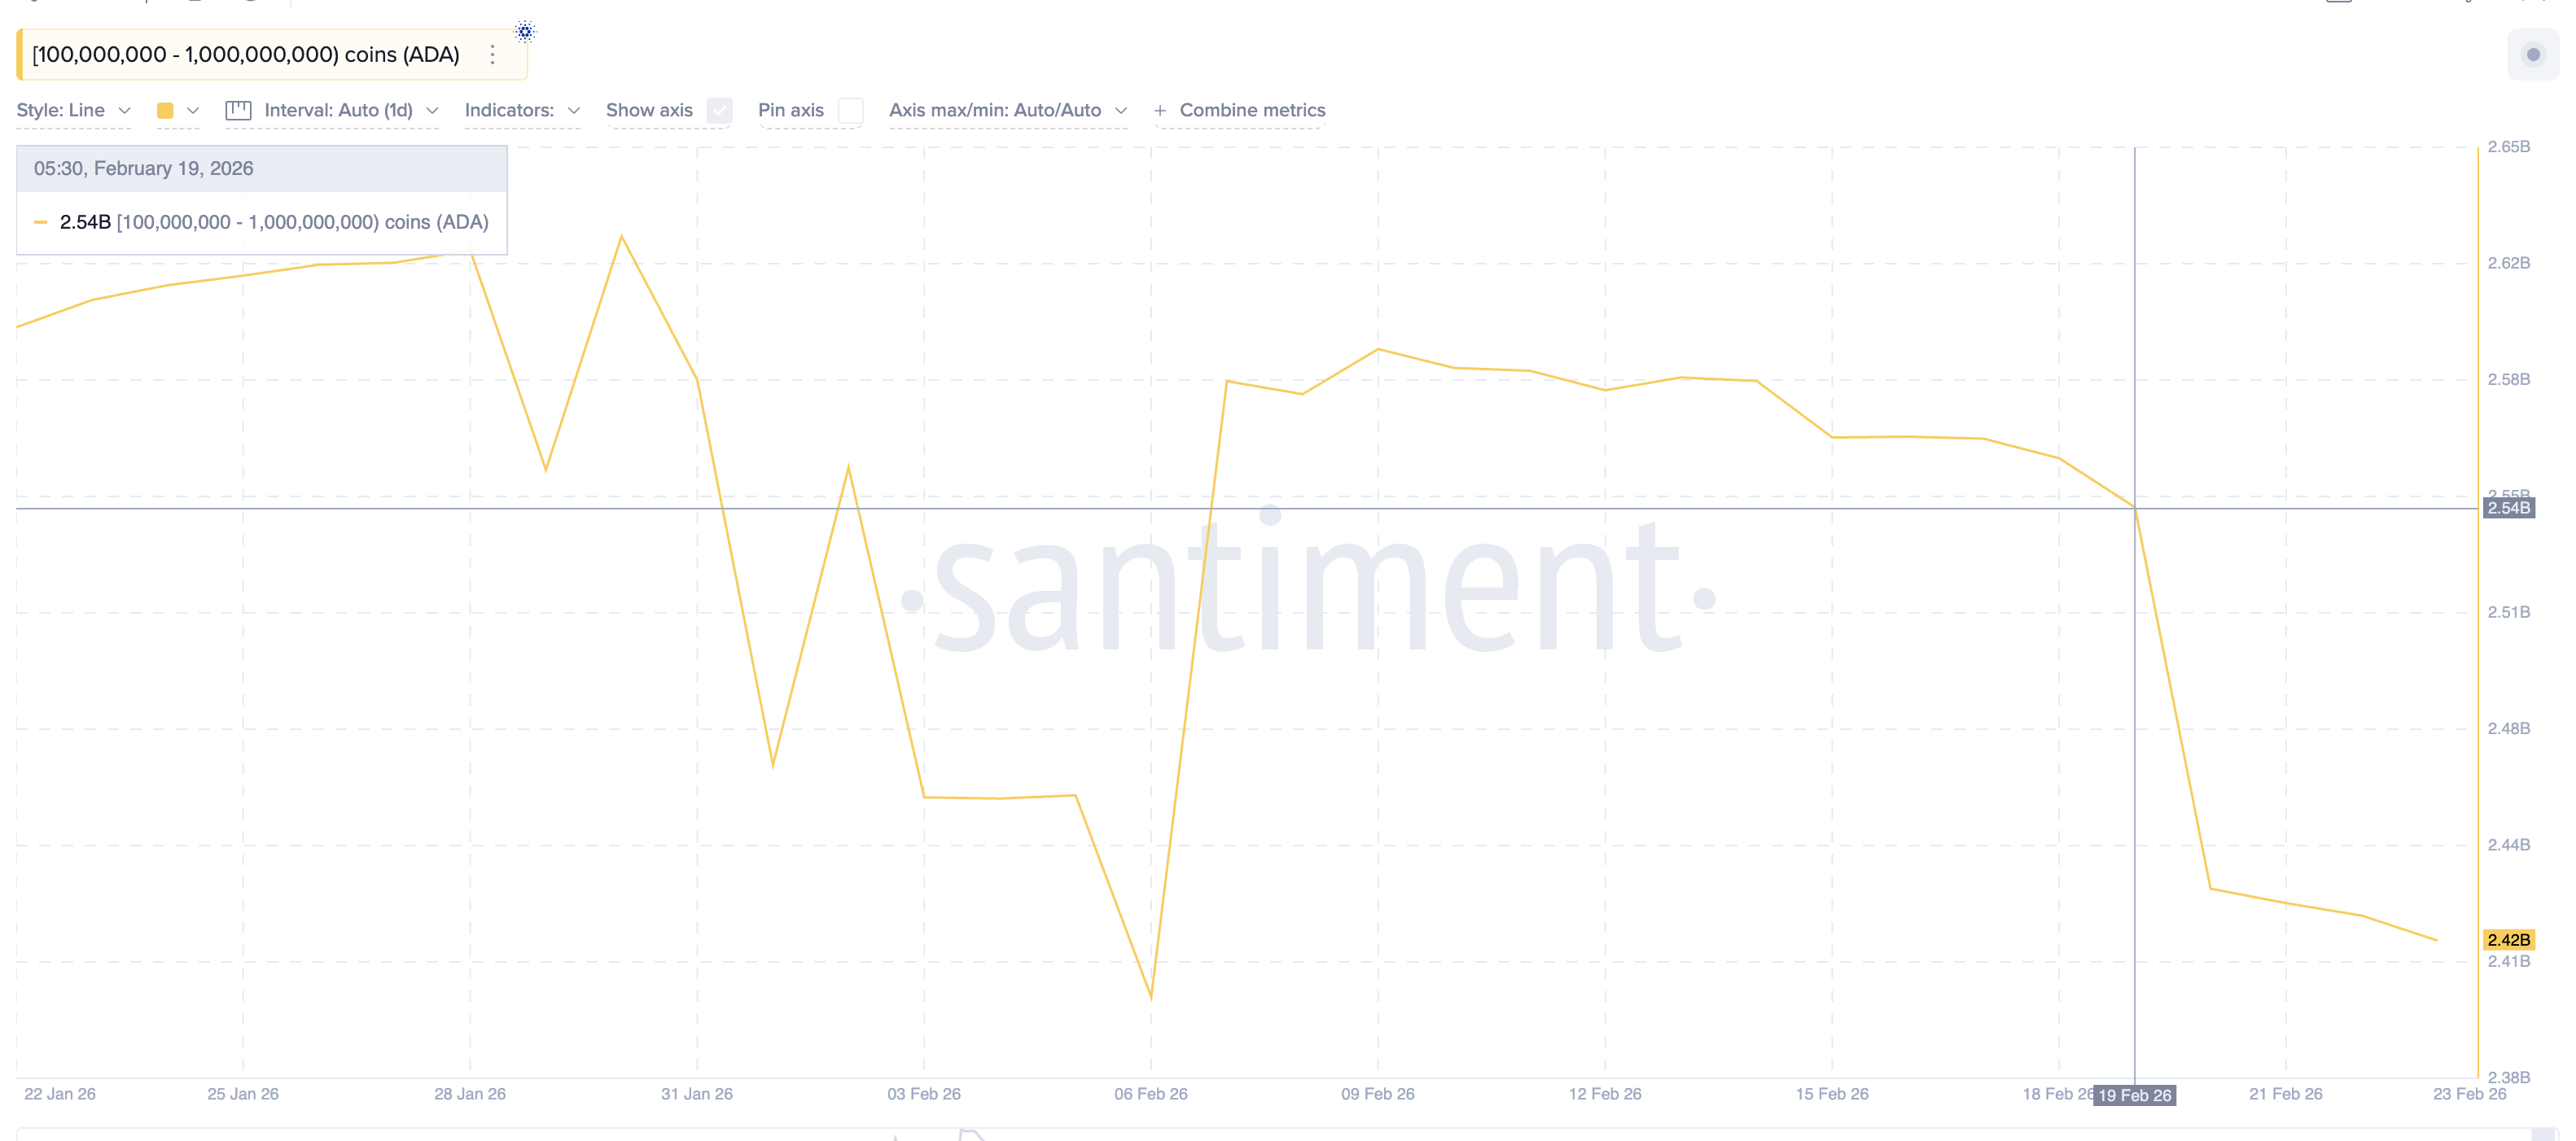
This absence of accumulation matters more than the selling itself. When large investors expect a recovery, they typically begin re-accumulating near support levels. Their refusal to do so signals continued caution.
This raises a critical question. If whales are staying away, why are smaller investors suddenly stepping in aggressively?
Retail Buying Surges 640% Even As Profitability Signals More Downside Risk
Exchange flow data reveals a dramatic shift in retail behavior. On February 21, ADA exchange outflows totaled around $344,450. By February 23, outflows surged to $2.55 million. This marks a massive 640% increase in just two days.
Exchange outflows happen when investors withdraw coins into private wallets. This usually signals buying and holding rather than preparing to sell. Retail investors are clearly buying the dip as whales have been clearly selling.
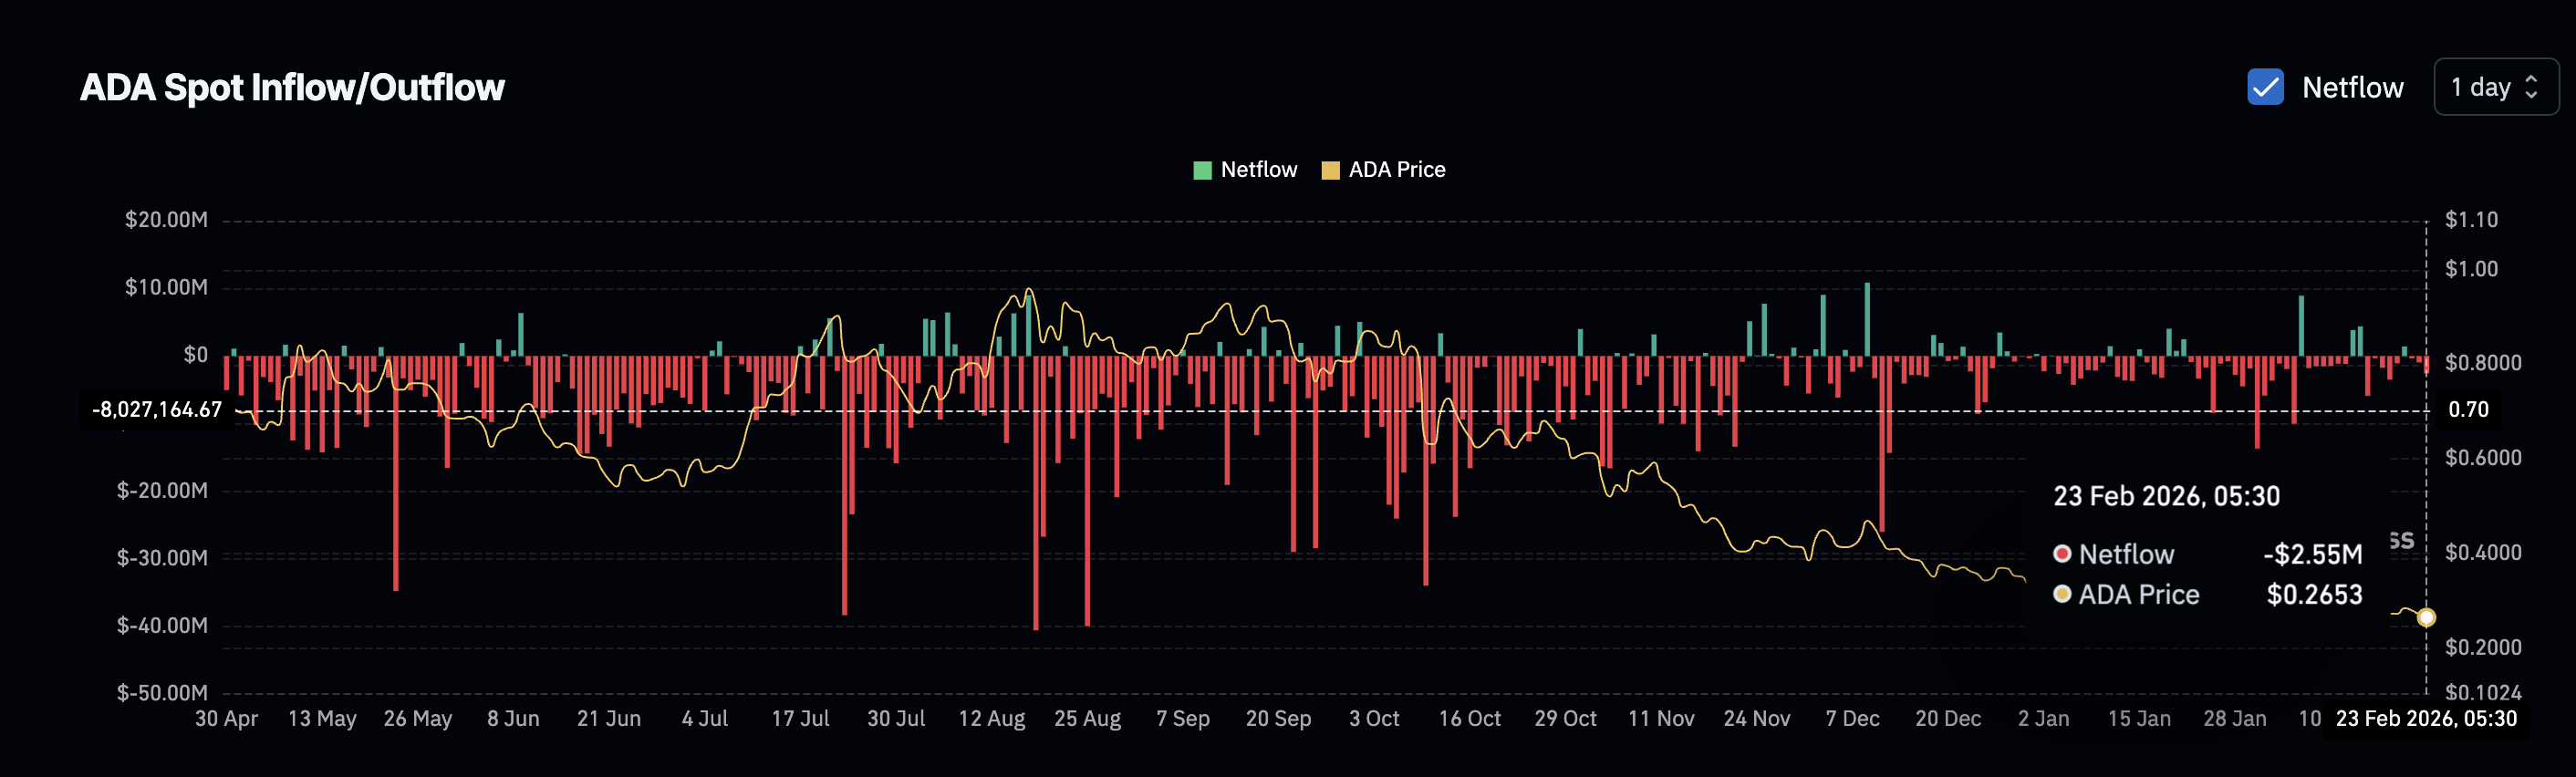
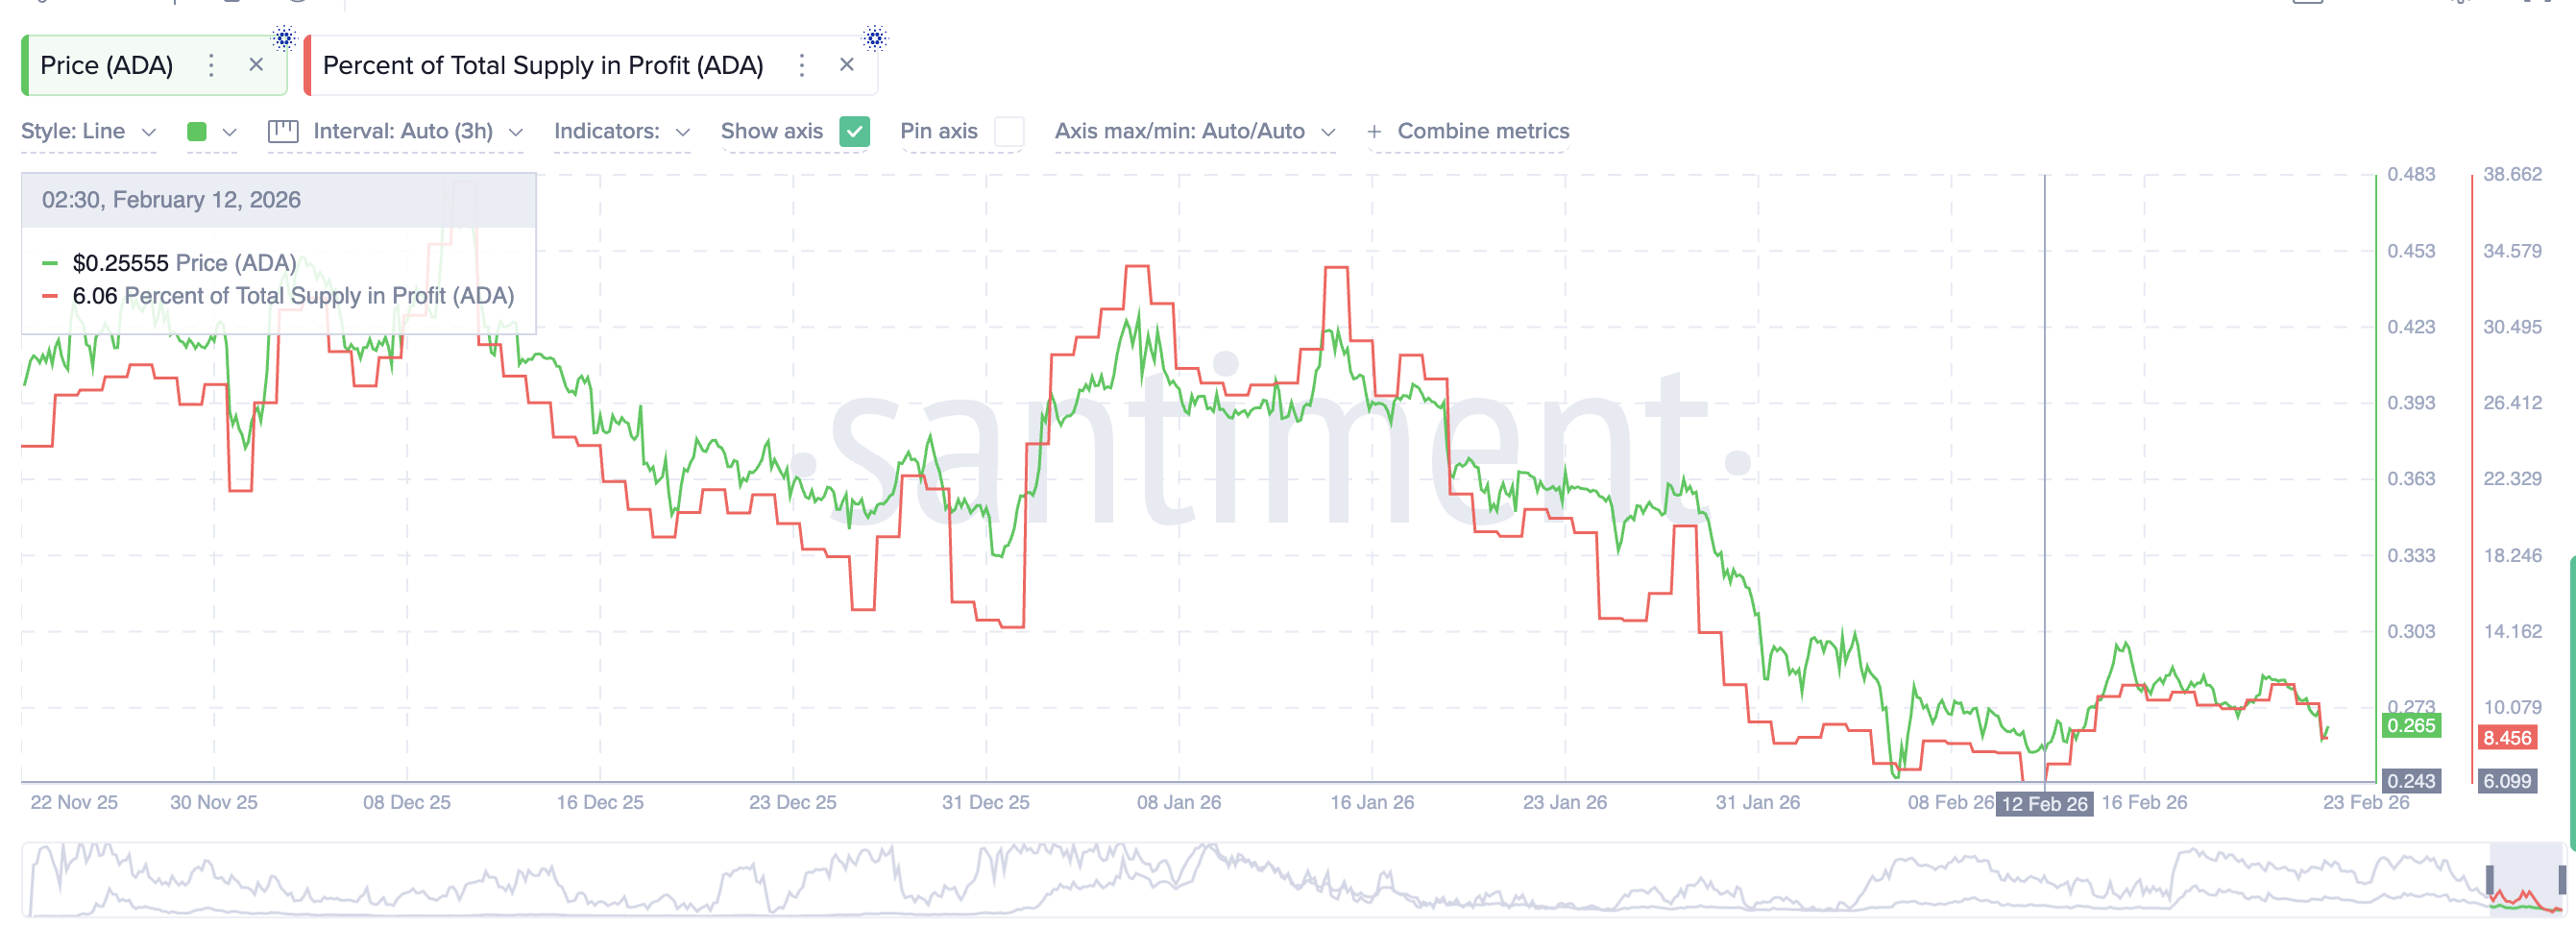
However, another key metric suggests the correction may not be finished yet. The Percent of Total Supply in Profit indicator shows how much of the circulating supply is currently profitable. This metric dropped to just 6.06% on February 12, marking its lowest level in three months.
It later recovered to around 11% before the breakdown and now sits near 8.45%. Even though profitability remains low, it is still about 40% higher than the recent bottom. This matters because markets often continue falling when profitability remains above extreme capitulation levels.
This suggests Cardano may still have room to decline further.
This creates a clear contradiction. Retail investors are accumulating aggressively, but profitability and whale positioning both signal continued caution. The ADA price chart now shows exactly how this conflict could resolve.
Cardano Price Targets $0.23 Unless Bulls Reclaim Critical Resistance
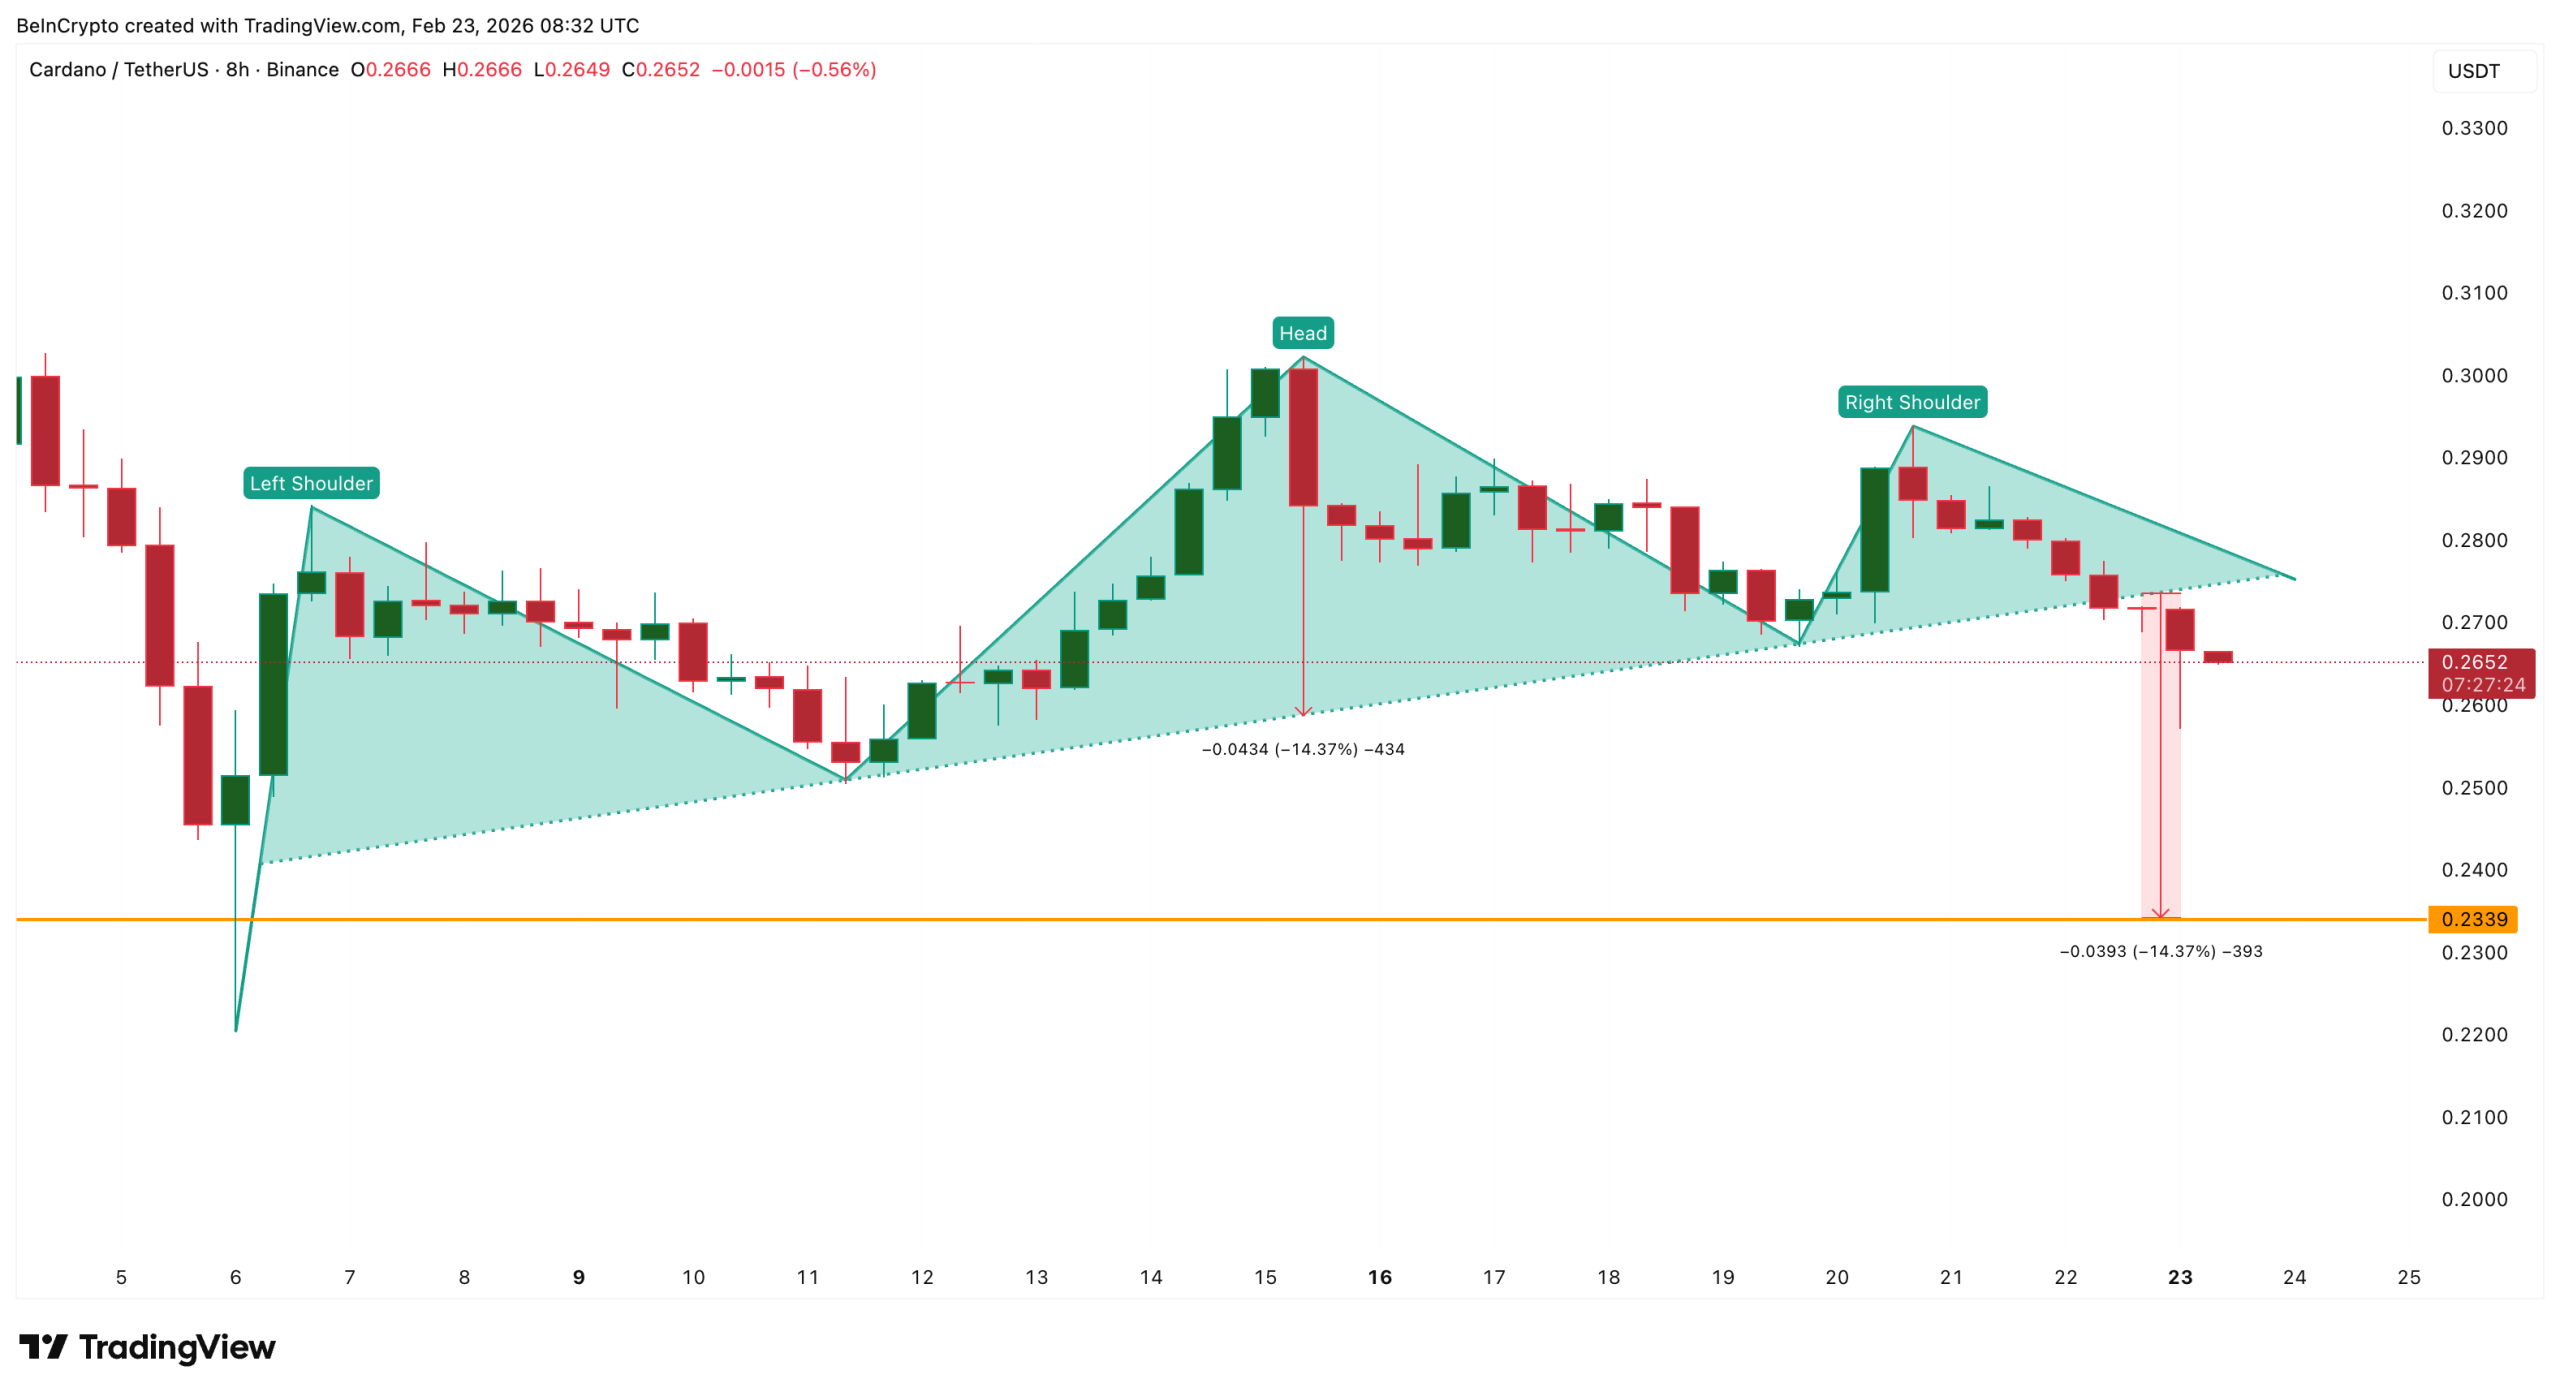
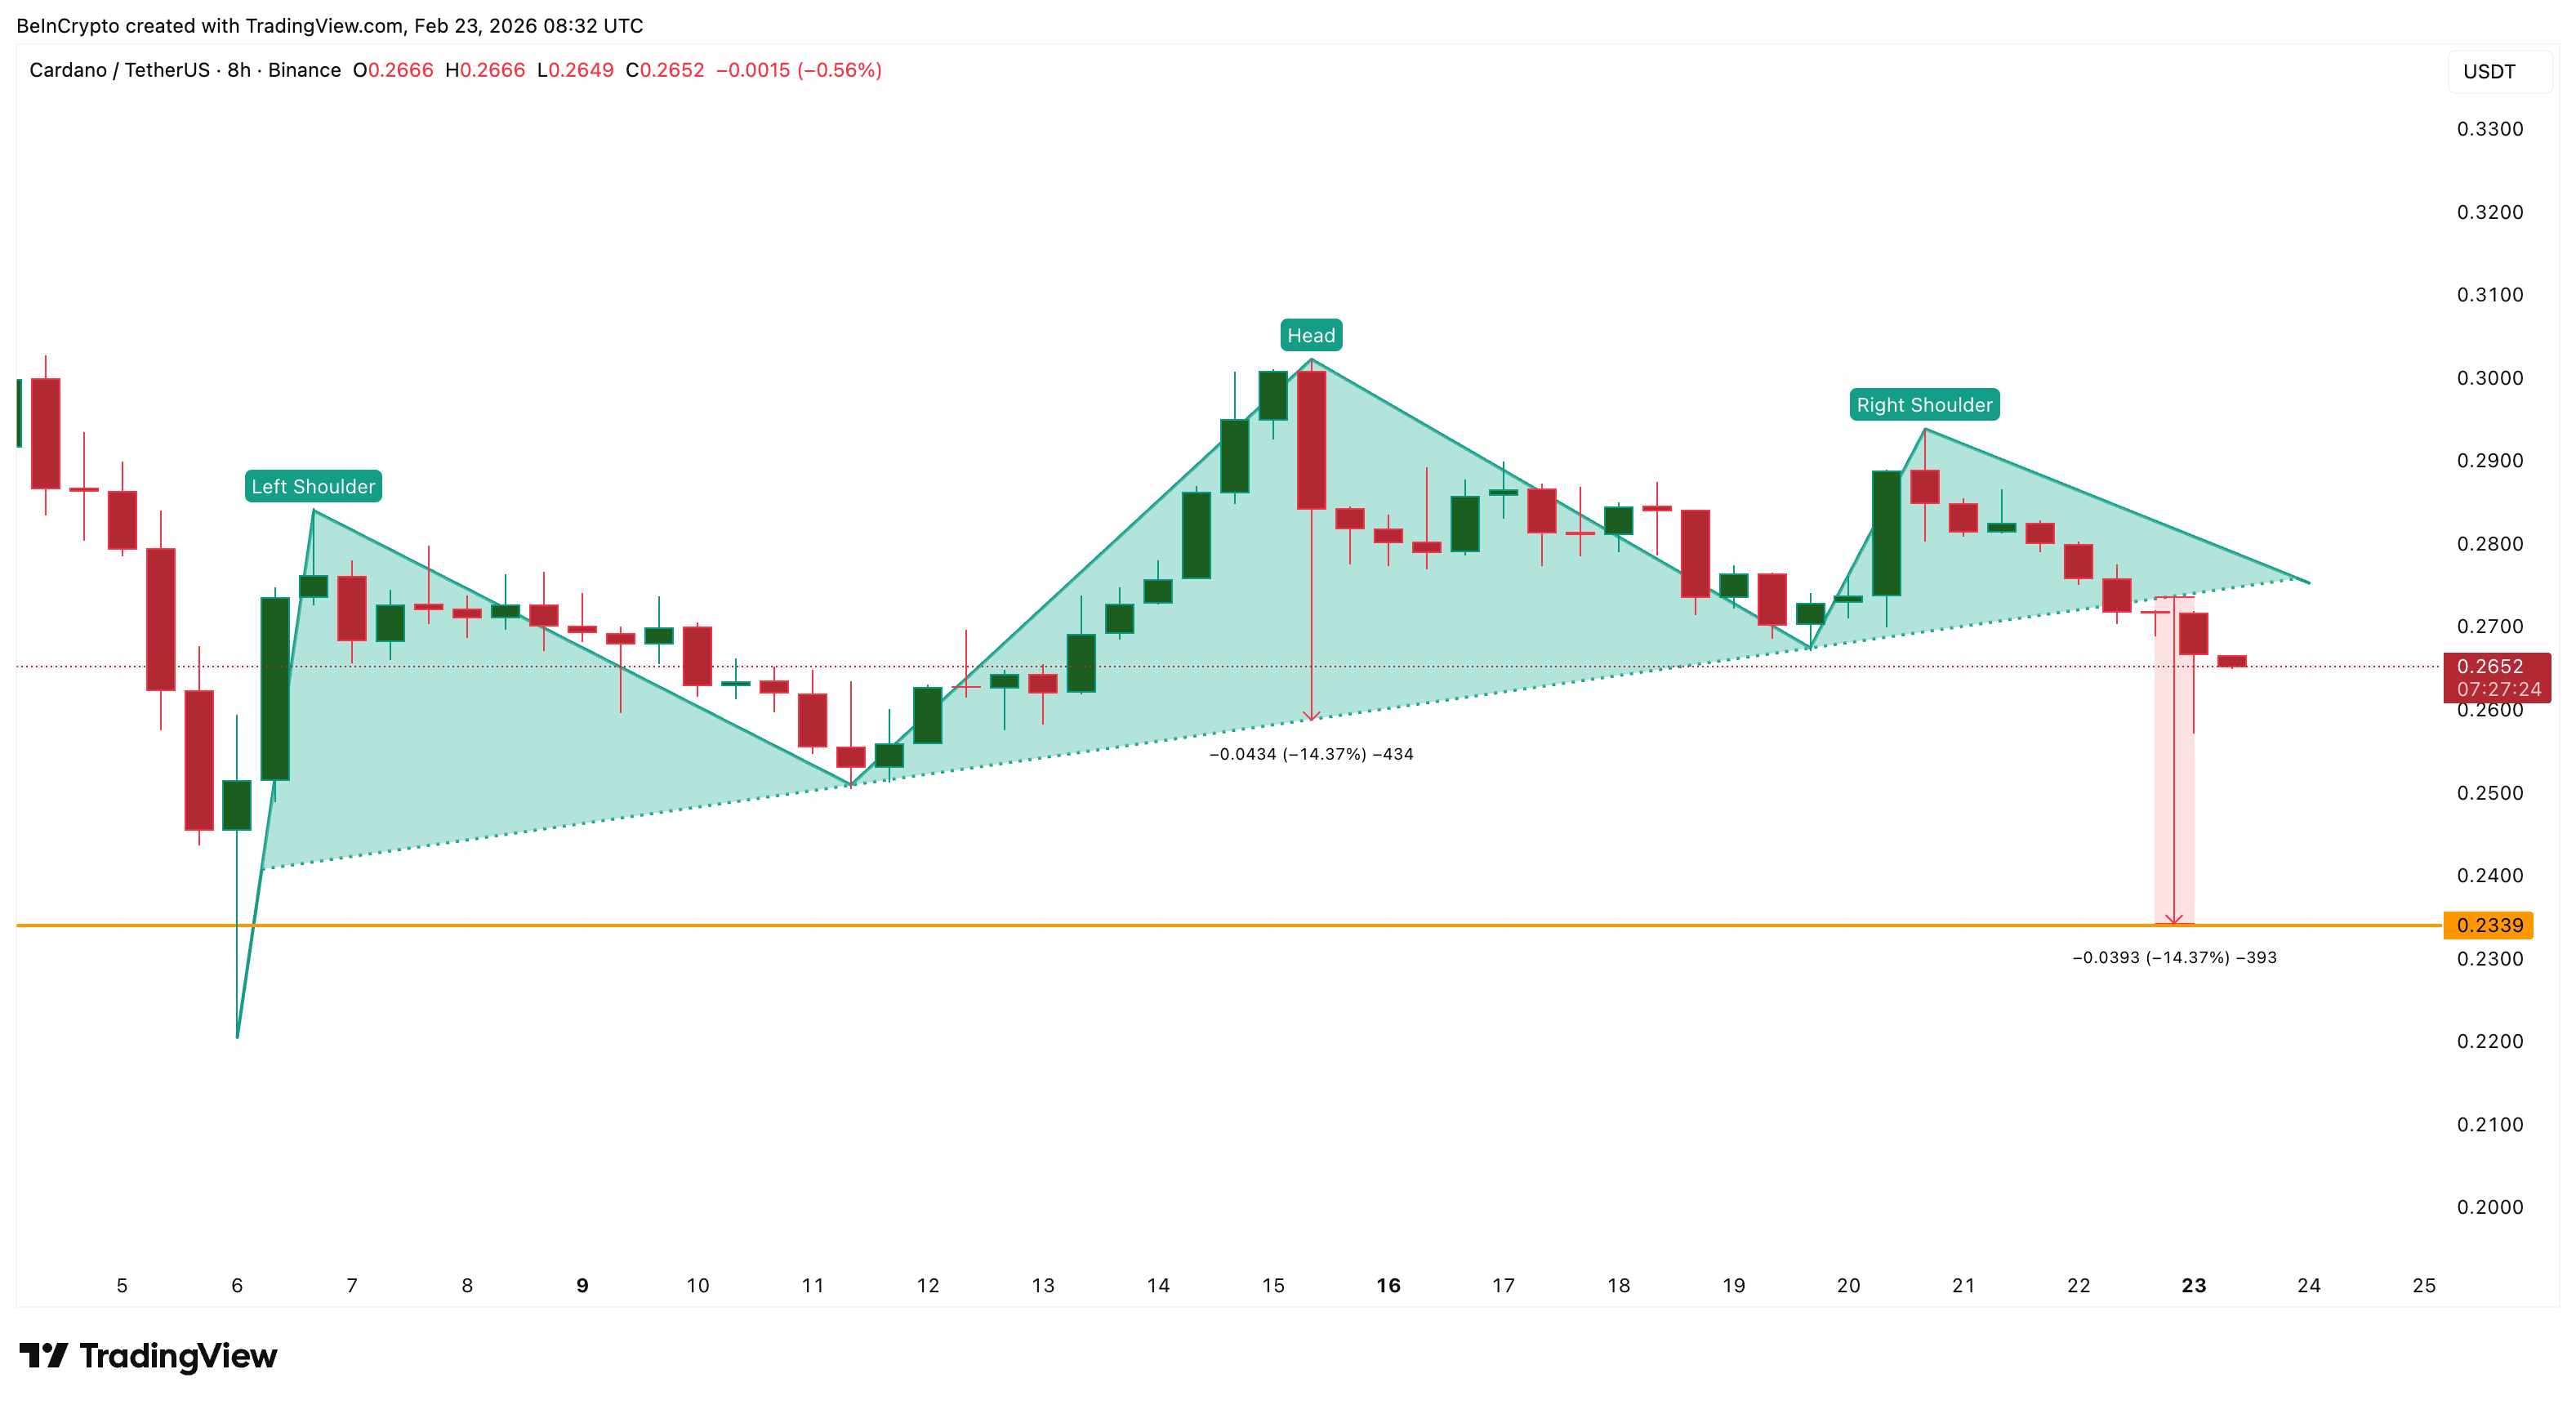
Cardano has now confirmed a breakdown from a head-and-shoulders pattern on the 8-hour chart. This pattern typically signals a shift from accumulation to distribution and often leads to further downside.
Cardano recently lost the key support level at $0.266 and is now trading near $0.265. This level has already failed to provide a strong recovery. Even the Smart Money Index (SMI), which tracks the positions of informed investors, is diverging from the signal line as the ADA price broke support. This pattern aligns with whale skepticism and suggests an immediate rebound might not be on the cards, as retail thinks.
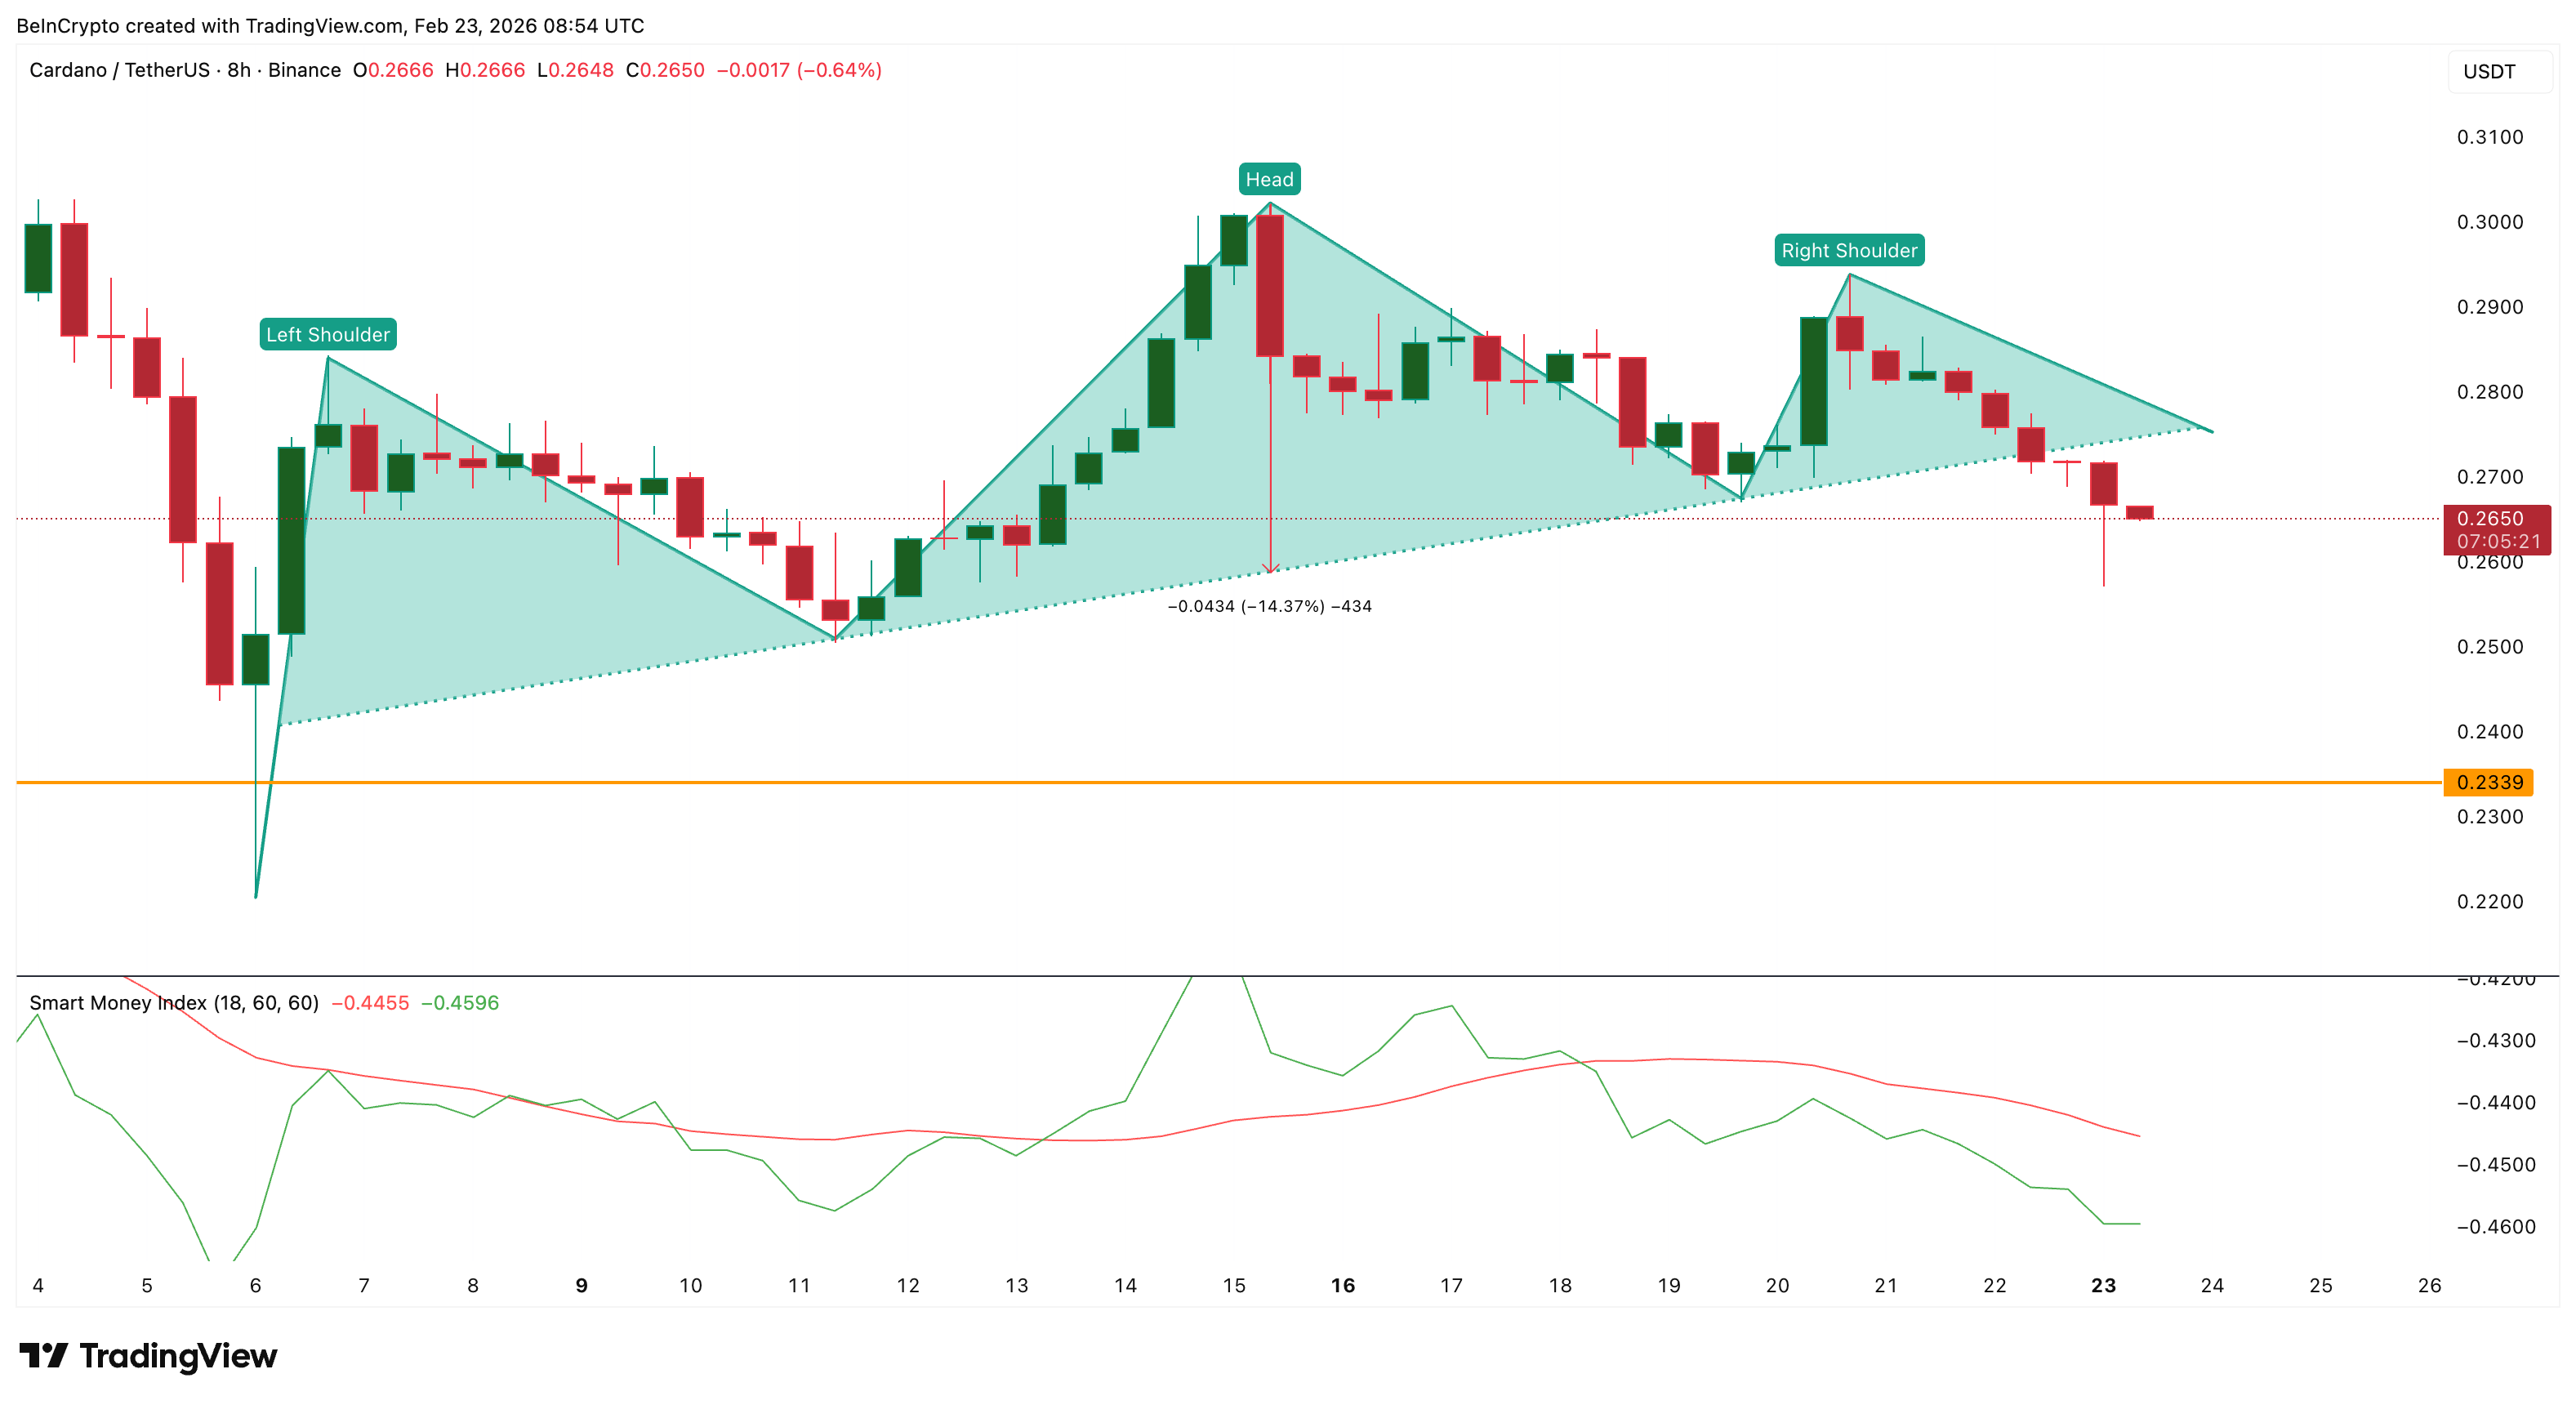
The next immediate support sits near $0.259.
If this level breaks, Cardano could fall toward $0.233. This represents an additional 12% downside from current levels and aligns with the full projection of the breakdown pattern. The broader structure remains bearish unless Cardano can reclaim higher resistance levels.
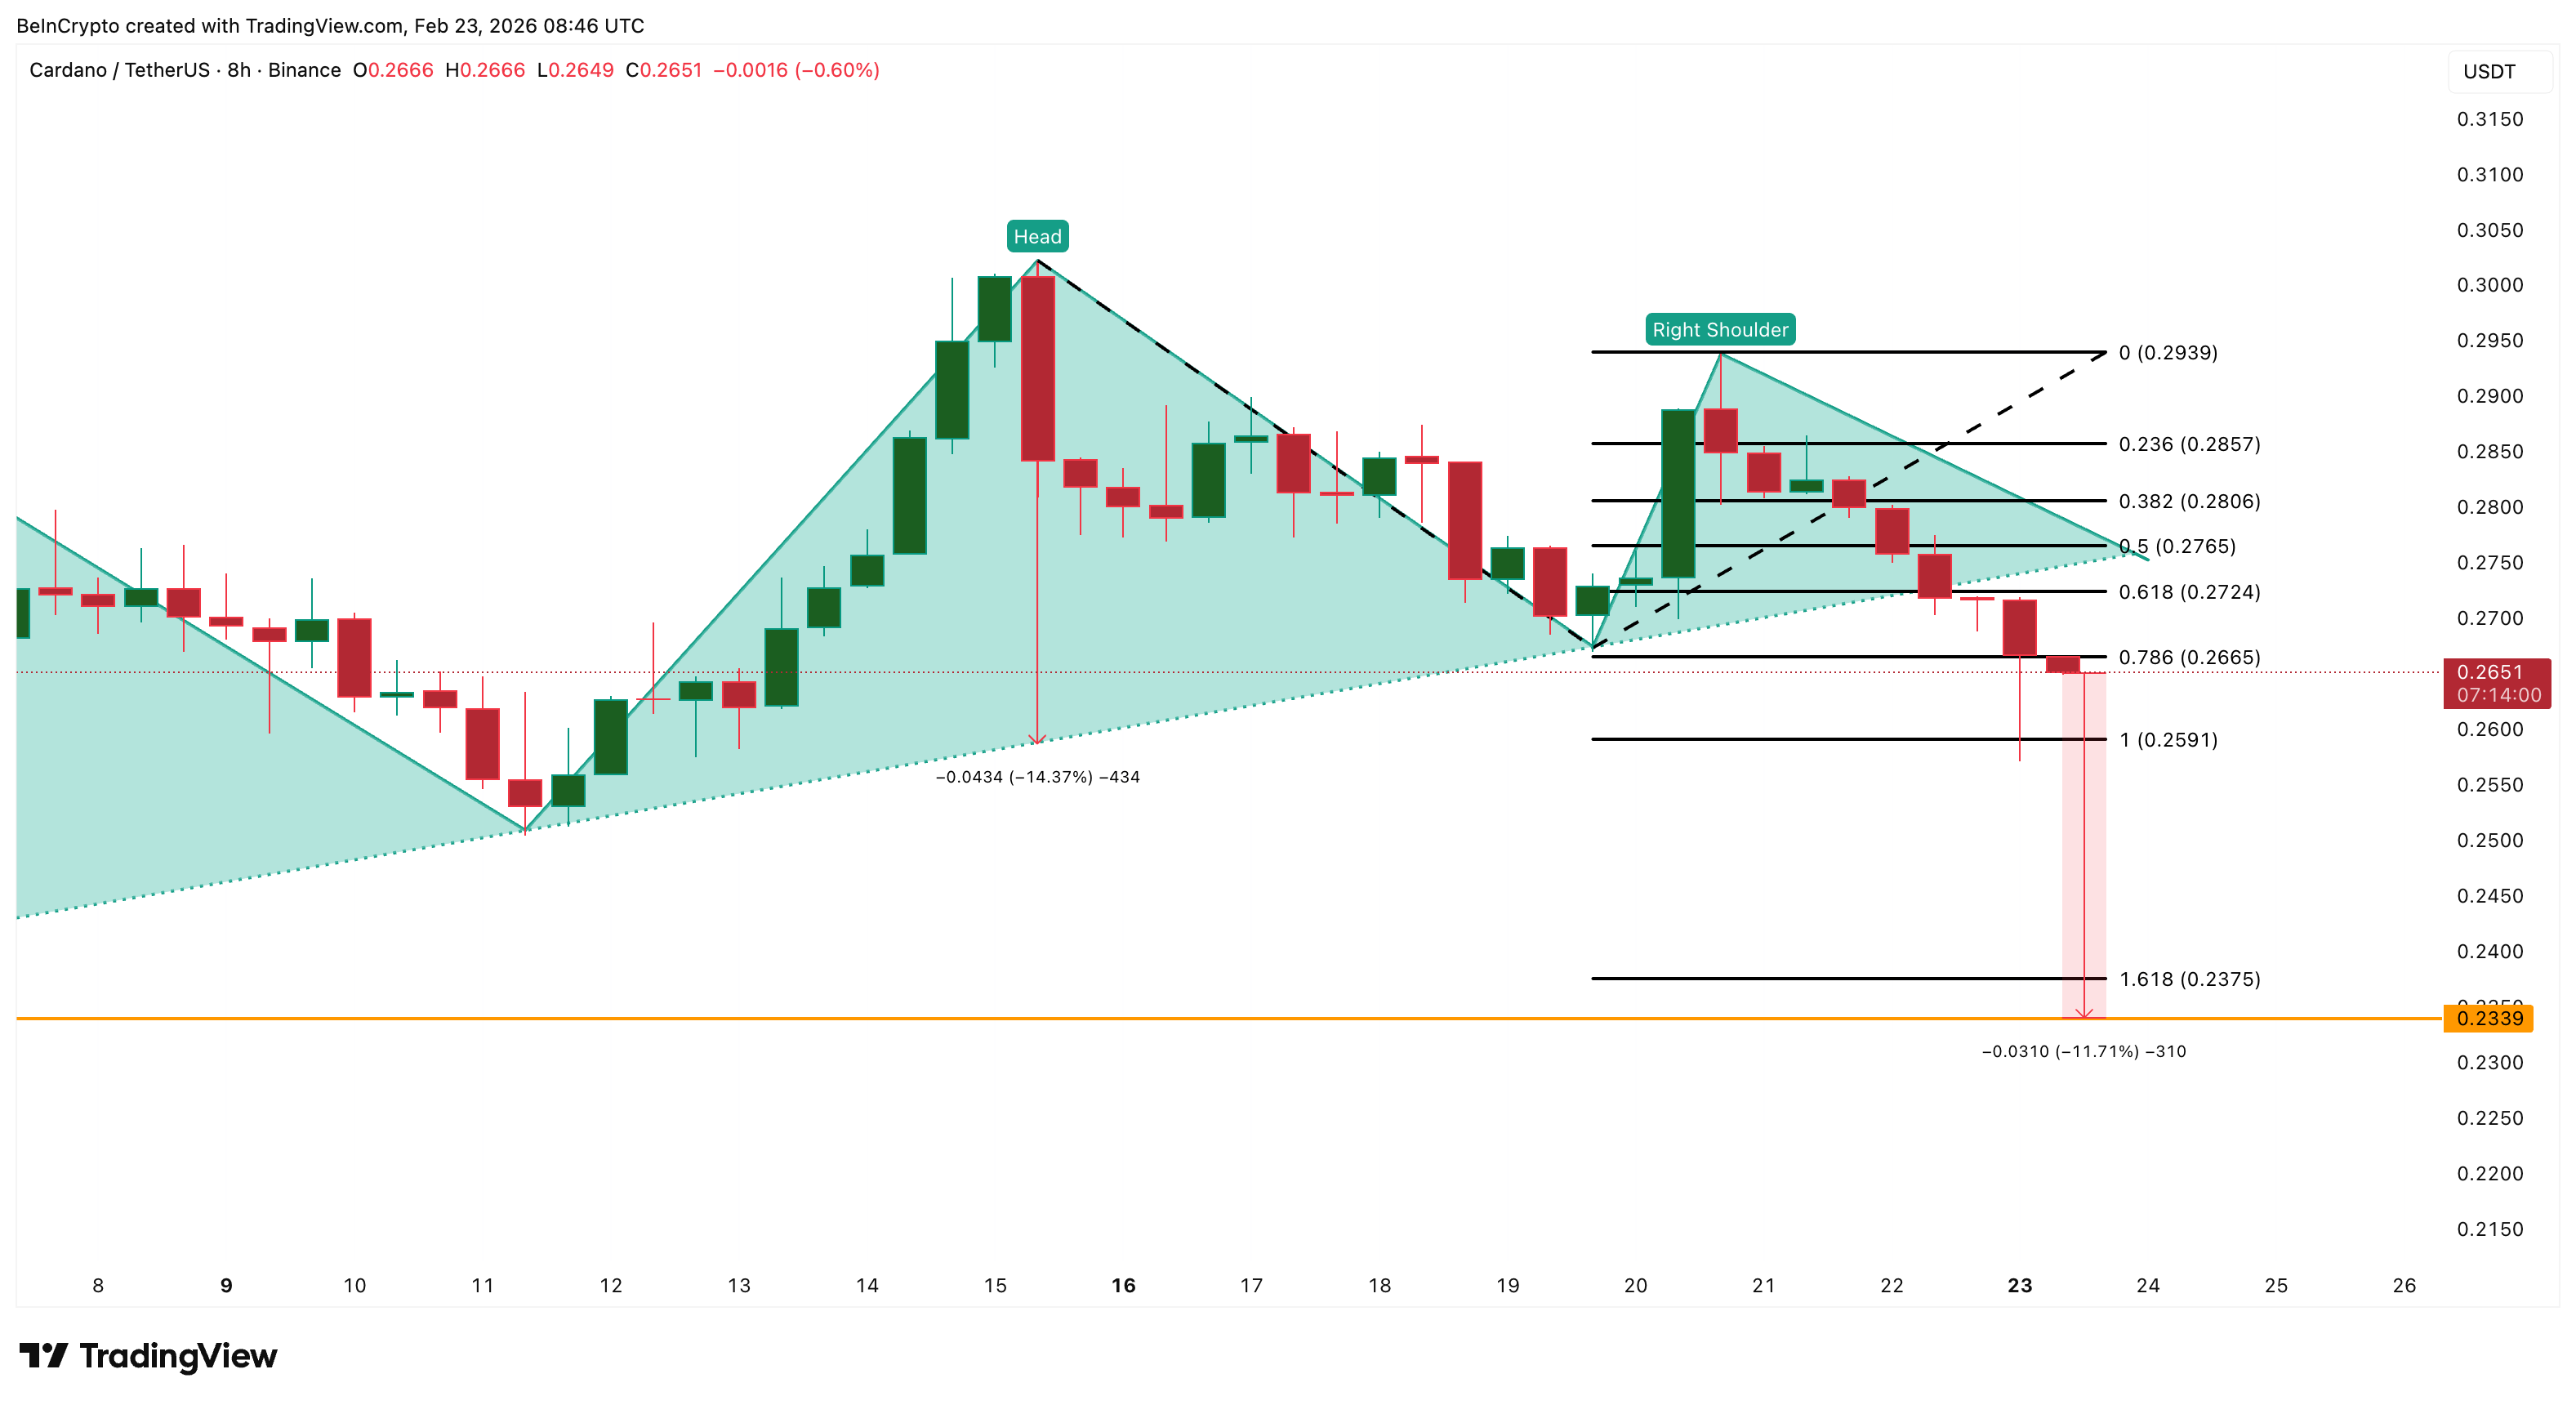
The first sign of strength would appear only if Cardano recovers above $0.276. However, true bullish invalidation requires a move above $0.293. Until then, the trend remains tilted toward further downside.
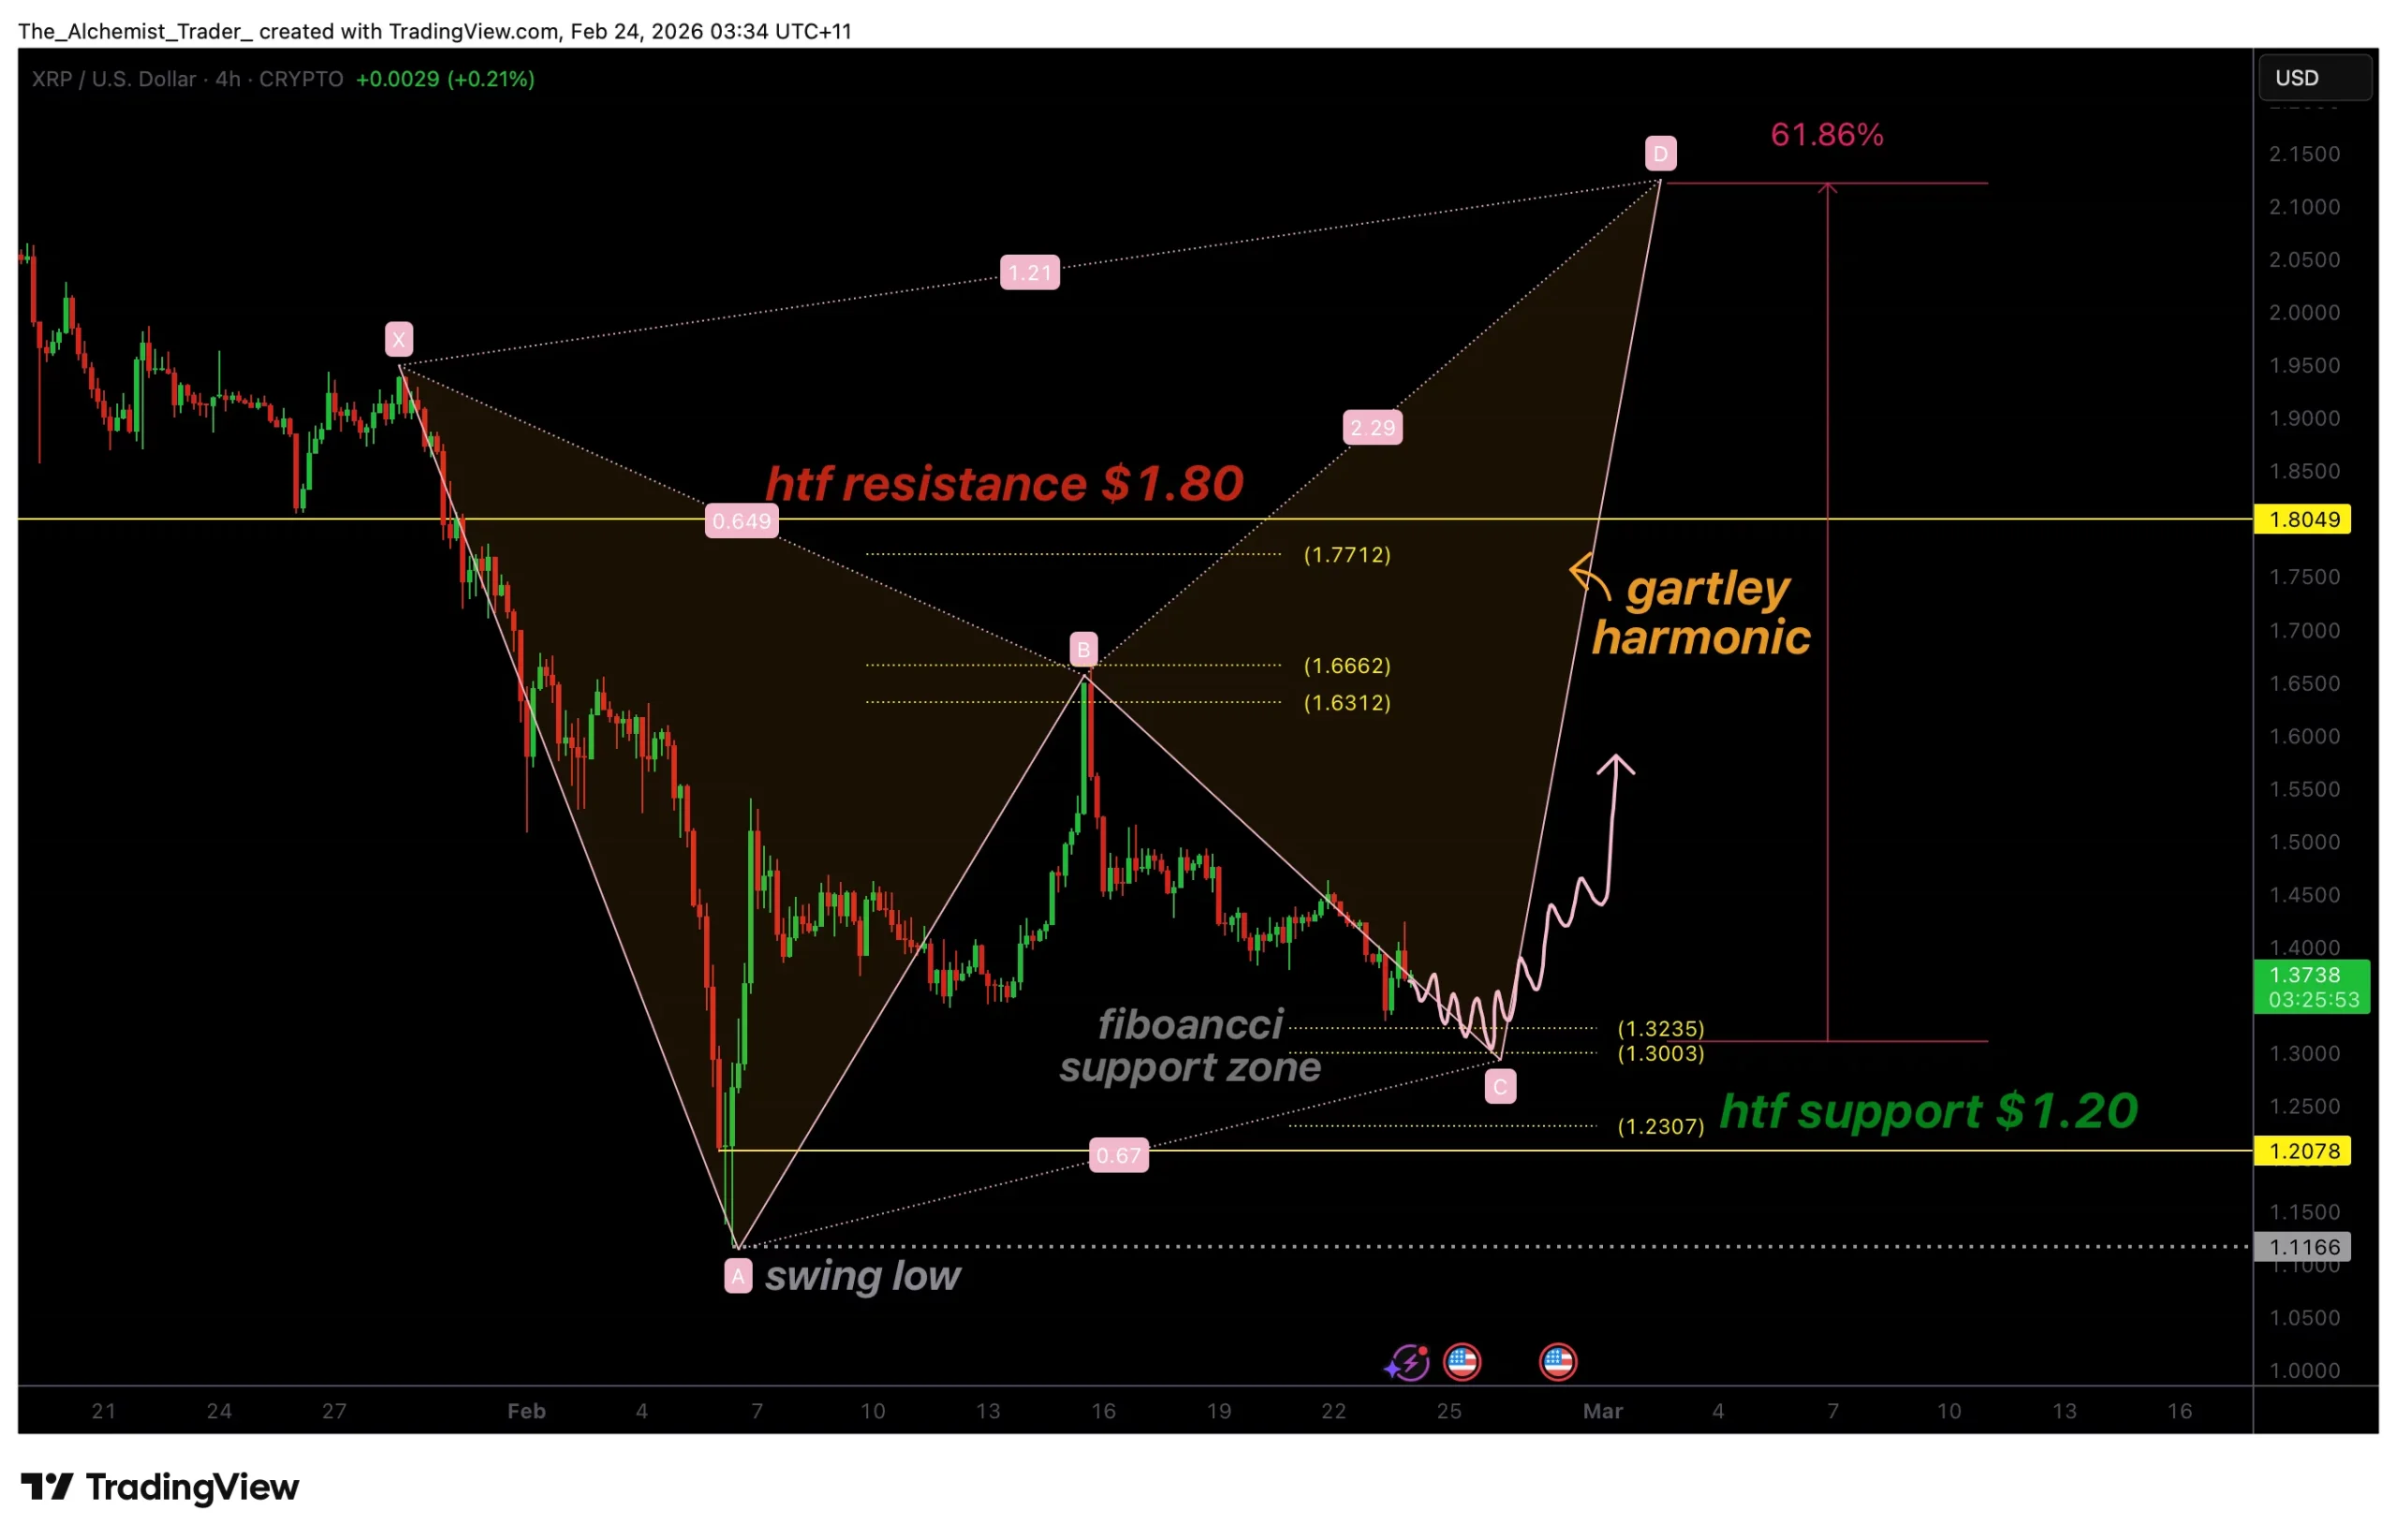
XRP price is forming a potential Gartley harmonic pattern near $1.30 support, signaling a possible bullish bottom as price rotates within a broader range.
Summary
- XRP developing Gartley harmonic pattern near $1.30 support
- Holding above $1.20 keeps bullish reversal structure valid
- Completion of leg D could trigger a strong upside rally
XRP (XRP) price action is beginning to show technical structure as a potential Gartley harmonic pattern develops near the $1.30 region. After weeks of rotational trading between high-timeframe resistance near $1.80 and strong support around $1.20, the market now appears to be transitioning into a pattern-driven consolidation phase that could precede a larger directional move.
Harmonic patterns, particularly the Gartley structure, rely heavily on Fibonacci relationships and precise price pivots. Recent XRP movements align closely with these technical requirements, with price rejecting key Fibonacci levels and forming recognizable swing structures. This evolving setup raises the question whether XRP is establishing a bullish bottom within its current range.
While confirmation is still required, the ongoing formation suggests a growing upside potential if support continues to hold.
XRP price key technical points
- Gartley pattern forming near $1.30: Fibonacci reactions are shaping harmonic structure development
- Range environment intact: XRP continues rotating between $1.80 resistance and $1.20 support
- Potential 60% upside projection: Completion of leg D could trigger a strong bullish rally
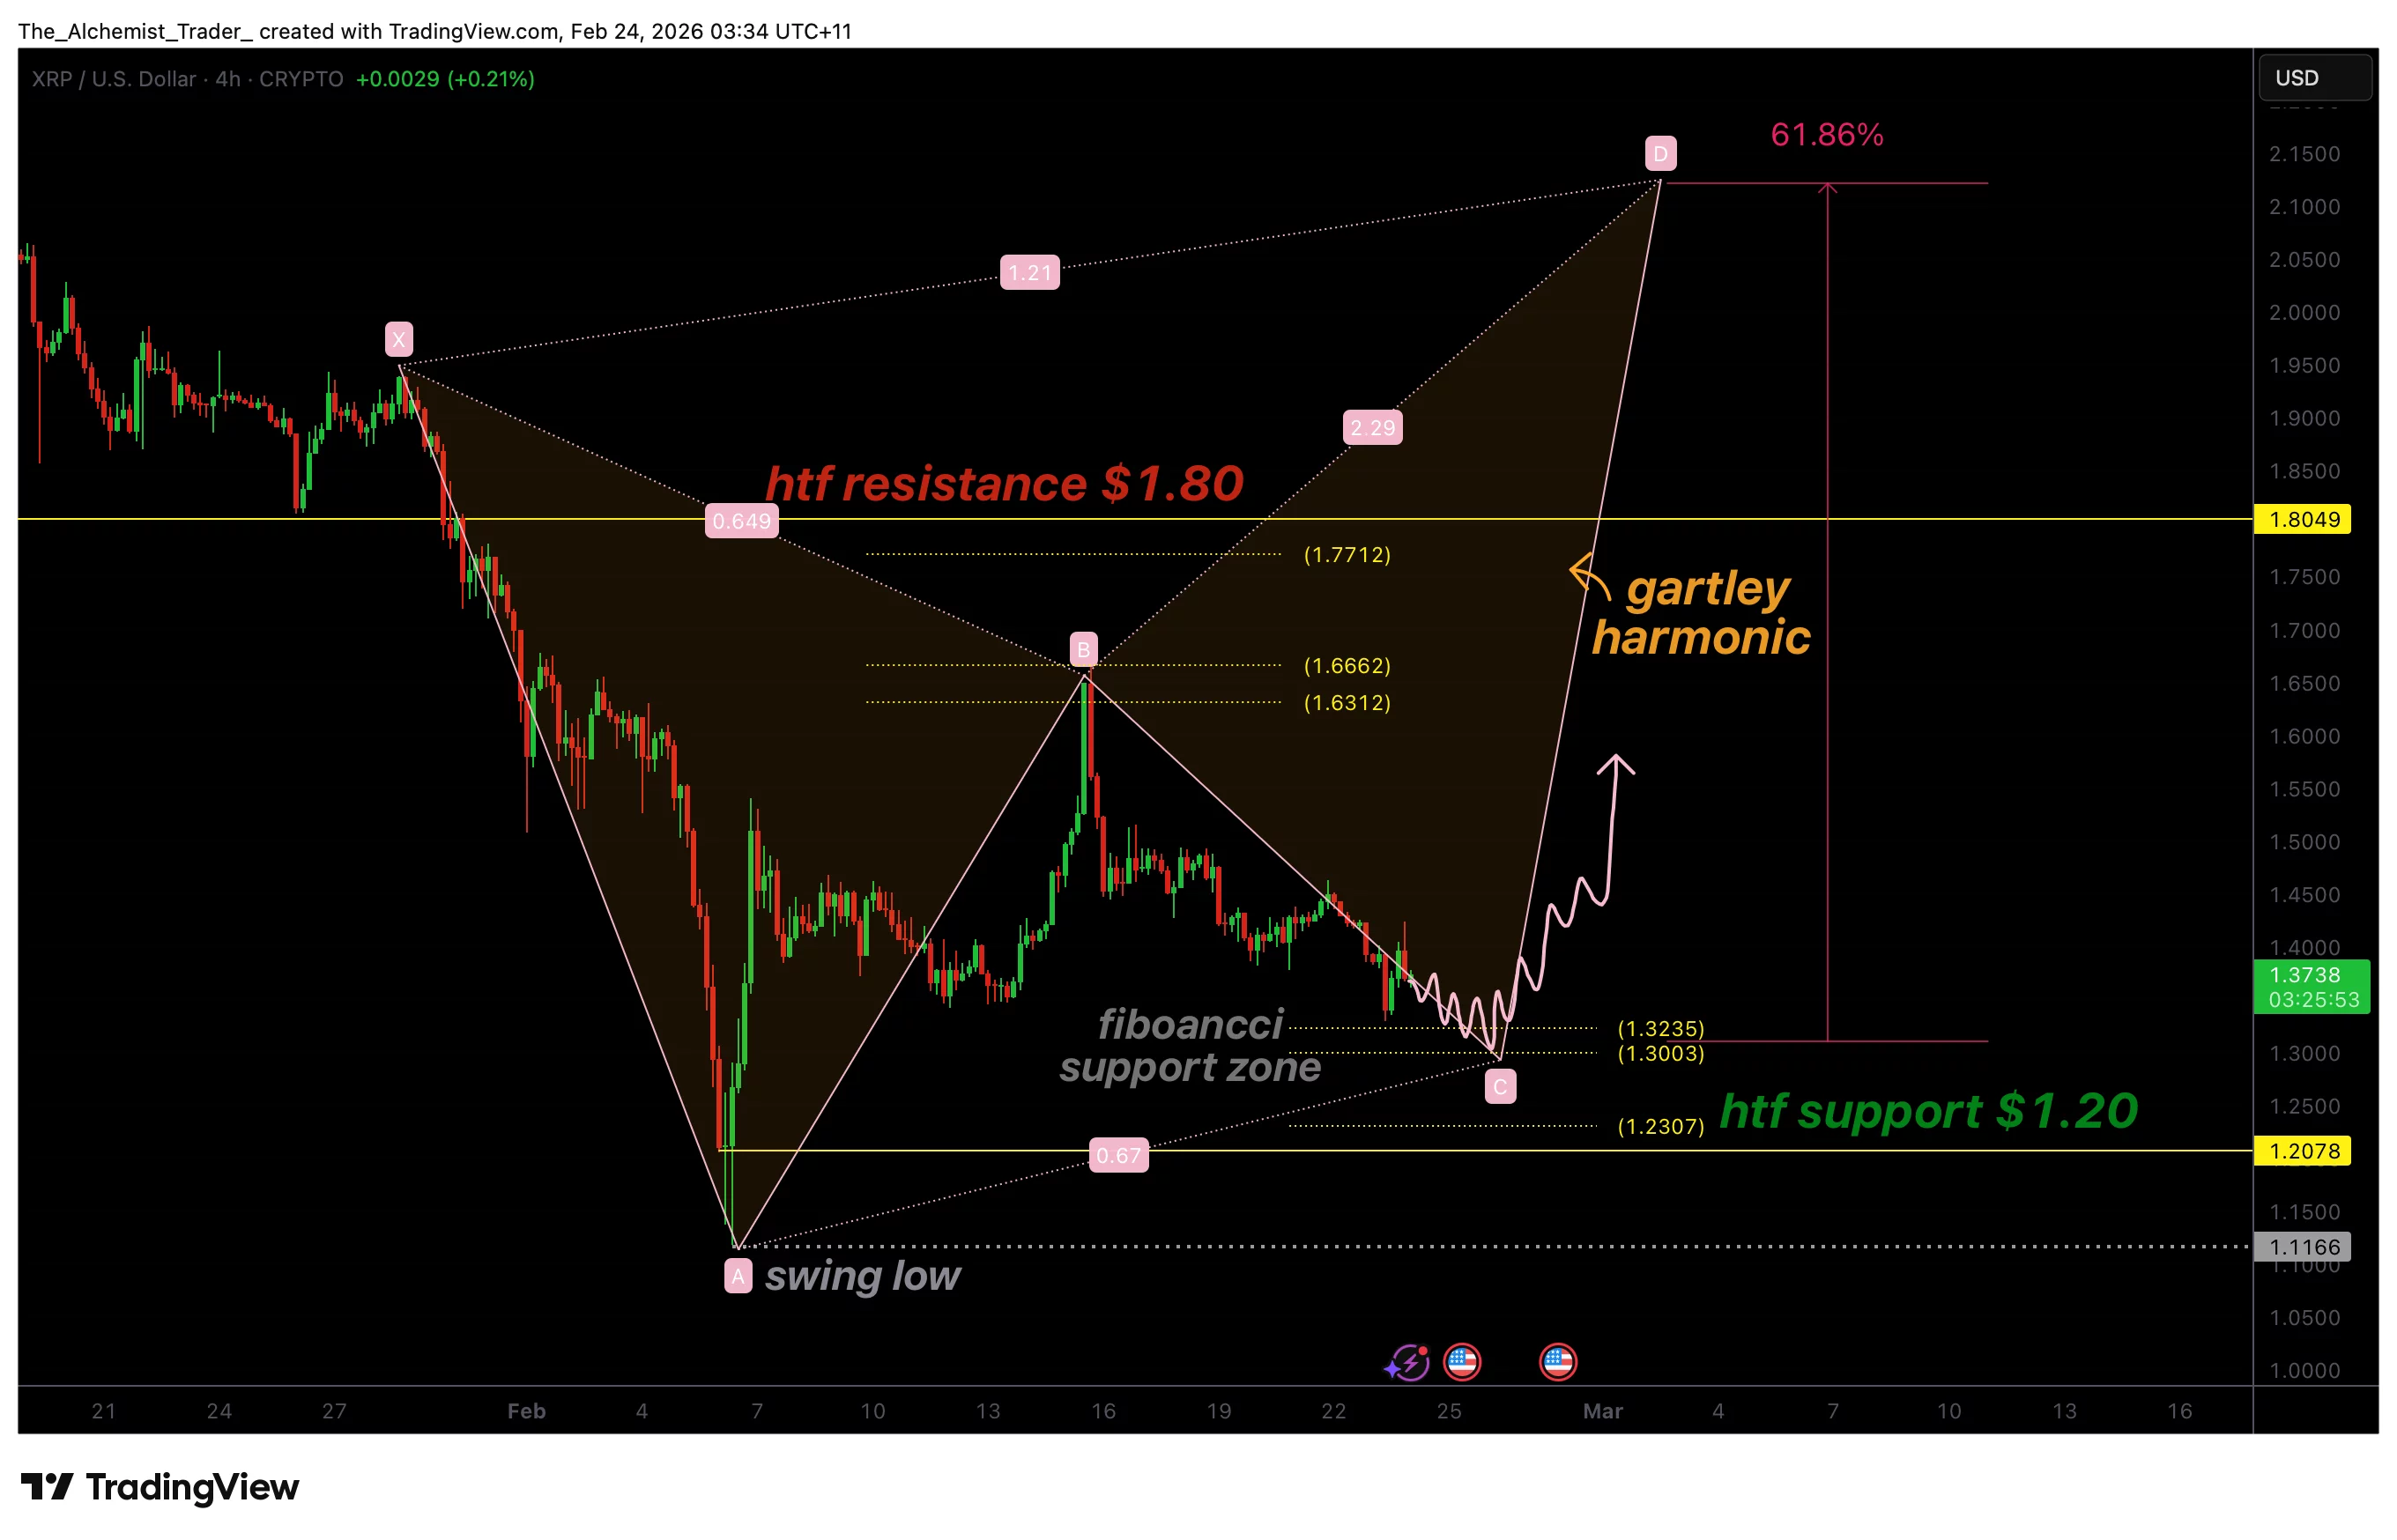
XRP has spent recent months trading within a well-defined range, oscillating between high-timeframe resistance at $1.80 and major structural support at $1.20. Rather than trending impulsively, price has displayed rotational behavior, a condition that often allows harmonic patterns to develop naturally.
The latest corrective move saw XRP reject the 0.618 Fibonacci retracement, an important technical reaction that supports the formation of a Gartley pattern. Price is currently trading below a local Fibonacci support zone, aligning with expectations for the ongoing development of the pattern’s internal legs.
In harmonic analysis, a Gartley pattern typically unfolds through multiple measured swings labeled X, A, B, C, and D. XRP appears to be progressing through the latter stages of this structure, with several clean pivots already established. These pivots reflect strong technical reactions at Fibonacci levels, reinforcing the validity of the developing setup.
Support defense critical for pattern validation
For the Gartley pattern to remain valid, XRP must continue to hold above the high-timeframe support near $1.20. This level represents a critical point of invalidation. Acceptance below it would weaken the harmonic structure and increase the probability of a deeper corrective move.
However, as long as price maintains support and reacts positively near the 0.618 Fibonacci region, the pattern continues to mature. The immediate focus shifts toward the completion of leg C, which typically precedes the impulsive move toward leg D, the final stage of the harmonic formation.
The significance of this stage lies in market psychology. Harmonic patterns often develop during periods of uncertainty, where both buyers and sellers test liquidity extremes before a clearer directional bias emerges. XRP’s repeated reactions at key Fibonacci zones suggest that market participants are actively responding to these technical levels.
Upside potential builds toward leg d completion
If XRP successfully completes leg C and establishes support in the current technical region, the probability increases for a bullish expansion toward the projected completion of leg D. Based on harmonic measurements, this move could represent a rally of approximately 60% from current price levels.
The projected upside aligns with higher resistance areas within the broader range structure, potentially revisiting zones closer to $1.80 and beyond. Importantly, this scenario does not require an immediate breakout but instead reflects a structured recovery within the existing market framework
Momentum confirmation will likely come through sustained higher lows, improved trading volume, and continued respect of Fibonacci retracement levels. These factors would signal that buyers are gaining confidence and positioning ahead of a larger move.
What to Expect in the Coming Price Action
From a technical, price-action, and market-structure perspective, XRP’s developing Gartley pattern suggests a bullish bottom may be forming near $1.30. As long as price remains above the $1.20 high-timeframe support and holds the 0.618 Fibonacci region, the probability favors completion of leg C followed by a rally toward leg D.

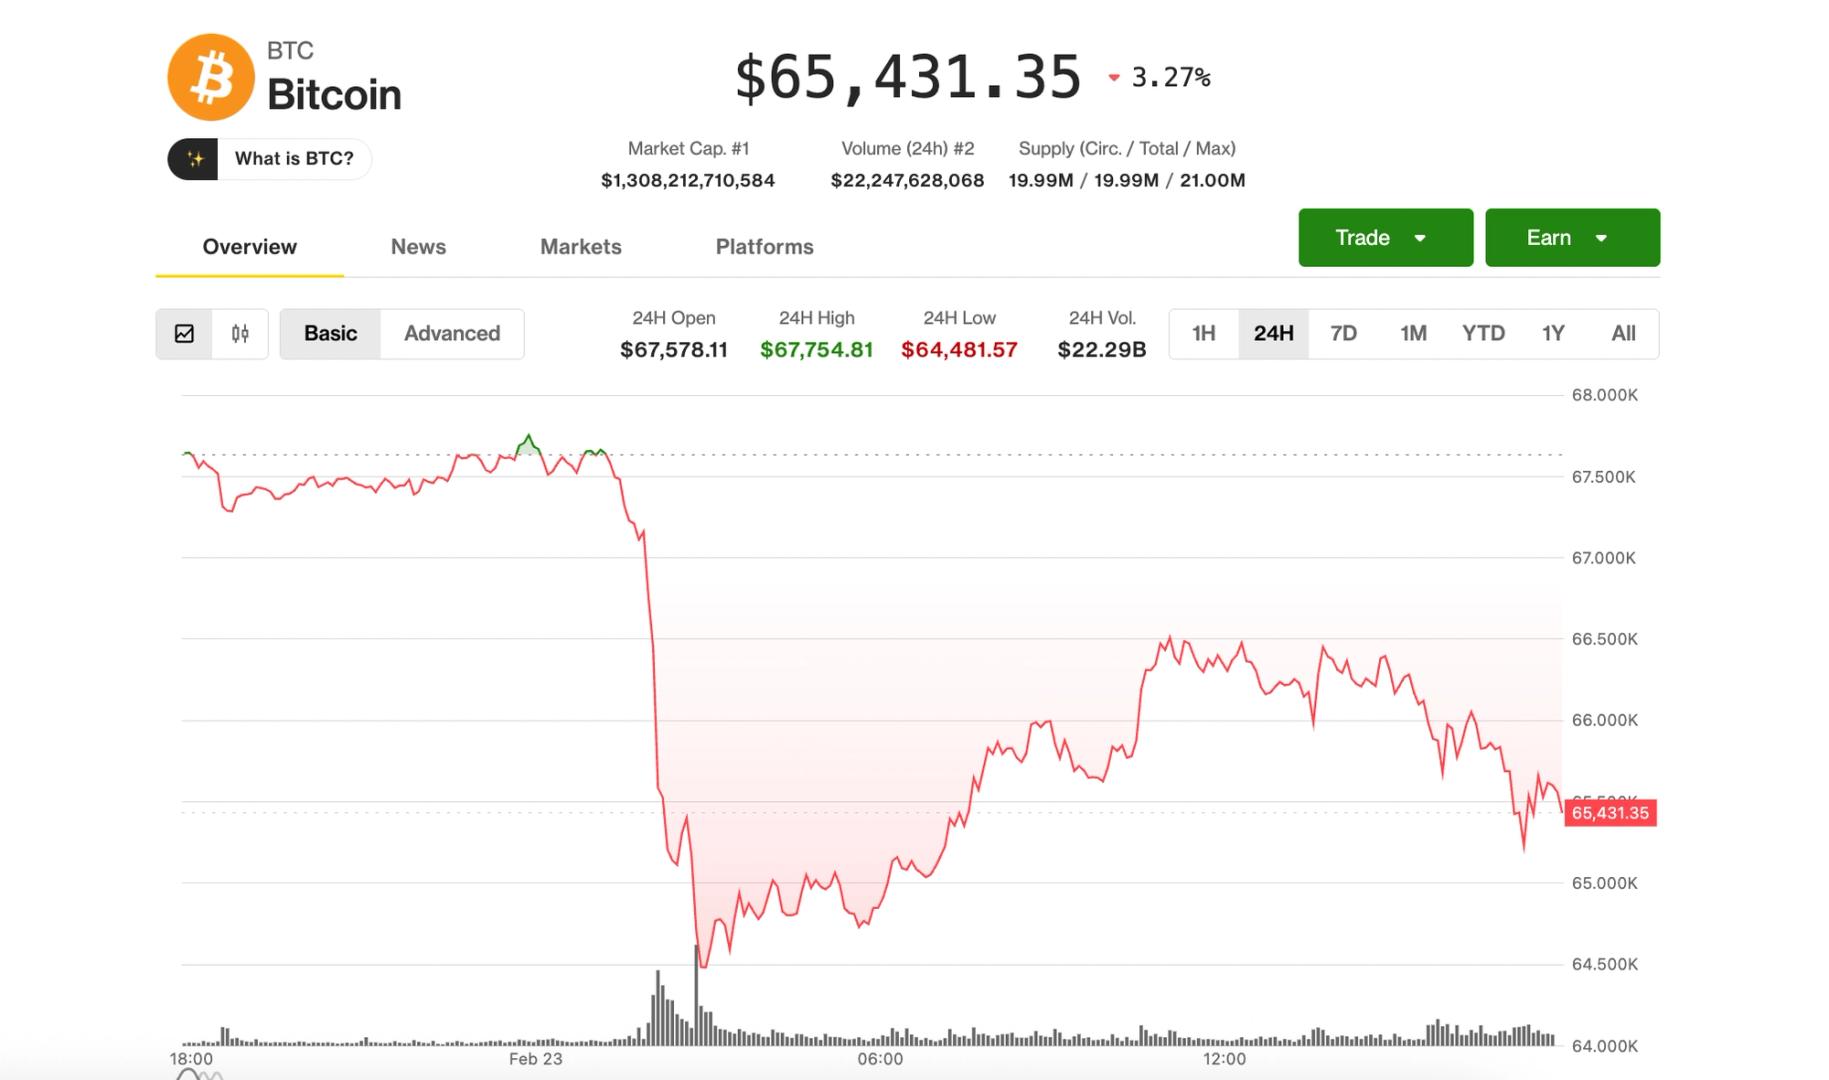
Bitcoin dipped below $65,000 on Monday as investors weighed mounting tariff uncertainties and geopolitical concerns.
The token traded as low as $64,830 early as it continued a nearly 5% slide that began a day earlier. Over the weekend, that decline brought the digital asset to $64,324 at its nadir, marking its lowest level since Feb. 6 when it hit $60,062.
Bitcoin was last down more than 2% at $65,836.68 at 9:40 a.m. ET.

Bitcoin YTD
The world’s oldest cryptocurrency has taken a dive, particularly as geopolitical and macroeconomic uncertainties spark investors’ flight from risk-on investments.
Last week, U.S. President Donald Trump said he would decide whether to strike Iran “over the next probably 10 days” due to its resistance toward a new nuclear deal. The tensions seemed to build over the past few days, with the U.S. continuing to position its military forces across the Middle East.
Separately, Trump said Saturday in a social media post that he would raise his so-called retaliatory tariffs against many of the U.S.’ foreign trading partners to 15%, “effective immediately,” just one day after the Supreme Court struck down his previous trade taxes.
Since the beginning of the year, Bitcoin has lost 24% due to the onslaught of macro threats, while risk-off assets like precious metals have surged. Gold has gained about 20% in the year to date, while silver has added 23% during the same period.

Bitcoin’s very modest rebound from its steep overnight selloff quickly fizzled out during U.S. morning trading on Monday as broader risk markets turned sharply lower.
Trading at $65,400 near the noon hour on the east coast, bitcoin was down 35% over the past 24 hours.
The action occurred as U.S. equities tumbled. The S&P 500 and the tech-heavy Nasdaq 100 were each lower by more than 1%, led by renewed weakness in software stocks and private-equity names.
The iShares Expanded Tech-Software ETF (IGV) sank another 5% to a fresh 52-week low and is now down nearly 35% since October amid concerns that generative AI tools could disrupt traditional software business models. Whether true or not, current market thinking is that crypto is just software, and price movements of bitcoin and IGV of late have been nearly perfectly correlated.
Adding to that bearish theme are continuing worries that AI could be leading markets to the cusp of a major negative credit event similar to that of 2008’s global financial crisis. This is currently reflected in private equity share prices. These companies have heavy exposure to the afore-mentioned software sector. Blow Owl Capital (OWL) — which last week sold assets in an attempt to mollify liquidity-seeking investors — is lower by another 3.5% Monday and 32% year-to-date. BlackStone (BX), Ares Management (ARES), and Apollo Global Management (APO) all added to their sizable recent losses, falling between 6% and 8%.
Crypto often trades as a high-beta proxy for tech and broader liquidity conditions, and Monday’s weakness reflected that dynamic. While BTC has so far held above the worst of its early February lows, it still trades in a tight range between $60,000 and $70,000 as risk appetite remains fragile.
Added to all of this is uncertainty about global tariffs after the Supreme Court clamped down on President Trump’s previous use of sweeping levies, Joel Kruger, market strategist at LMAX Group, said in a note.
“This sparked a classic risk-off environment,” Kruger said. “Investors pulled back from speculative assets like crypto, with bitcoin behaving more like a high-beta risk play than ‘digital gold.’”

Ali Martinez points to a rare three-day signal that historically appeared just before Bitcoin’s final bear-market plunges.
A key technical signal that has foreshadowed the final capitulation phase of previous Bitcoin (BTC) bear markets is flashing again.
According to chartist Ali Martinez, a “death cross” on the three-day chart could be confirmed in late February, potentially sending BTC to $40,000 or even $30,000.
The Death Cross Pattern and What History Shows
Martinez pointed to the three-day chart as a crucial timeframe for understanding Bitcoin’s macro structure, noting that the interaction between the 50 and 200 simple moving averages on this chart has reliably signaled the last major downside move since 2014.
“The death cross between these two moving averages on the 3-day chart has consistently preceded the final leg down of a bear market,” the trader wrote.
Following the 2013 top, Bitcoin dropped more than 72% before the death cross printed in December 2014, after which it fell another 52%. After the 2017 peak, the death cross appeared in November 2018, coming just before a final 50% decline. The signal emerged again in May 2022, following the 2021 top, which led to an additional 45% drop.
Bitcoin registered a new all-time high (ATH) in October 2025 when it went above $126,000, but the current price, which had recovered to just over $66,000 at the time of writing after earlier shedding about $4,000 in only a matter of hours, is nearly 48% below that ATH.
With a potential death cross projected for late February, Martinez warns that if history repeats even partially, a further 30% decline would place Bitcoin near $40,000, while a 50% drop could take it to $30,000.
However, the market watcher was quick to note that there were no guarantees the price drops would happen, even though the current structure matches up with historical setups that led to the last major downside moves before macro bottoms formed.
You may also like:
Market Reaction and On-Chain Divergence
Bitcoin is currently down about 2.5% in the last 24 hours and more than 4% over the past week. It has also lost nearly 27% of its value in the past month, a drop exacerbated by U.S. President Donald Trump’s recent announcement of a 10% (later upgraded to 15%) temporary global tariff after the country’s Supreme Court struck down many of the previous tariffs the Trump administration had imposed under a 1977 emergency law.
As seen during past tariff-related volatility, the impact on Bitcoin wasn’t immediate but arrived once legacy futures markets opened. It also sparked a coordinated bearish impulse in the futures market, with data from analyst Axel Adler Jr. showing that taker sell volume spiked to $2.3 billion in a single hour, accompanied by forced long liquidations of approximately 1,247 BTC worth more than $81 million.
Santiment data confirmed the liquidation cascade, noting open interest dropped to $19.5 billion, which is less than half its January peak, leading to skyrocketing negative sentiment, and the Bitcoin market entering “FUD mode.”
Binance Free $600 (CryptoPotato Exclusive): Use this link to register a new account and receive $600 exclusive welcome offer on Binance (full details).
LIMITED OFFER for CryptoPotato readers at Bybit: Use this link to register and open a $500 FREE position on any coin!

Officer tells inquest of theory missing boy feared to have had head injury
GeoPura to supply hydrogen generators for Thames crossing project

Solana Company starts building high-speed infrastructure to prepare SOL for next ‘super cycle’

Smart energy pays enters the US market, targeting scalable financial infrastructure

Why Israel is blocking foreign journalists from entering

Bitcoin: We’re Entering The Most Dangerous Phase

Money bouquet tutorial Video/ Money bouquet craft idea #ytshorts #shorts #support #viralshort

HOW FINANCIAL PLAN WILL HELP YOU TO QUIT YOUR JOB. #shorts #finance #farmer #peace

XRP SUPPLY SHOCK UPDATE (BINANCE) !!!! XRP ETFS CONFIRM FEDNOW !!!! EVERNORTH ON XRP PRICE !!!!
-

 Crypto World6 days ago
Can XRP Price Successfully Register a 33% Breakout Past $2?
-

 Video4 days ago
XRP News: XRP Just Entered a New Phase (Almost Nobody Noticed)
-

 Fashion3 days ago
Weekend Open Thread: Boden – Corporette.com
-

 Sports7 days ago
GB's semi-final hopes hang by thread after loss to Switzerland
-

 Politics1 day ago
Baftas 2026: Awards Nominations, Presenters And Performers
-
 Tech7 days ago
The Music Industry Enters Its Less-Is-More Era
-

 Business6 days ago
Infosys Limited (INFY) Discusses Tech Transitions and the Unique Aspects of the AI Era Transcript
-

 Entertainment5 days ago
Kunal Nayyar’s Secret Acts Of Kindness Sparks Online Discussion
-

 Video6 days ago
Financial Statement Analysis | Complete Chapter Revision in 10 Minutes | Class 12 Board exam 2026
-

 Tech5 days ago
Retro Rover: LT6502 Laptop Packs 8-Bit Power On The Go
-
 Sports5 days ago
Clearing the boundary, crossing into history: J&K end 67-year wait, enter maiden Ranji Trophy final | Cricket News
-

 Business1 day ago
Mattel’s American Girl brand turns 40, dolls enter a new era
-

 Business1 day ago
Law enforcement kills armed man seeking to enter Trump’s Mar-a-Lago resort, officials say
-

 Entertainment5 days ago
Dolores Catania Blasts Rob Rausch For Turning On ‘Housewives’ On ‘Traitors’
-

 Business5 days ago
Tesla avoids California suspension after ending ‘autopilot’ marketing
-
 NewsBeat8 hours ago
‘Hourly’ method from gastroenterologist ‘helps reduce air travel bloating’
-

 Politics6 days ago
Eurovision Announces UK Act For 2026 Song Contest
-

 Tech1 day ago
Anthropic-Backed Group Enters NY-12 AI PAC Fight
-

 NewsBeat1 day ago
Armed man killed after entering secure perimeter of Mar-a-Lago, Secret Service says
-

 Crypto World5 days ago
WLFI Crypto Surges Toward $0.12 as Whale Buys $2.75M Before Trump-Linked Forum