

Crypto World
What Risks Could Ethereum Short Sellers Face This Week?
The final week of February has brought another wave of declines, reinforcing expectations among short-term traders that altcoin prices could fall further. However, this outlook carries growing risks. If prices approach strong demand zones, they could stage an unexpected rebound.
Several altcoins are showing a severe imbalance between potential long and short liquidations this week. Such conditions often create an environment for large-scale liquidations.
1. Ethereum (ETH)
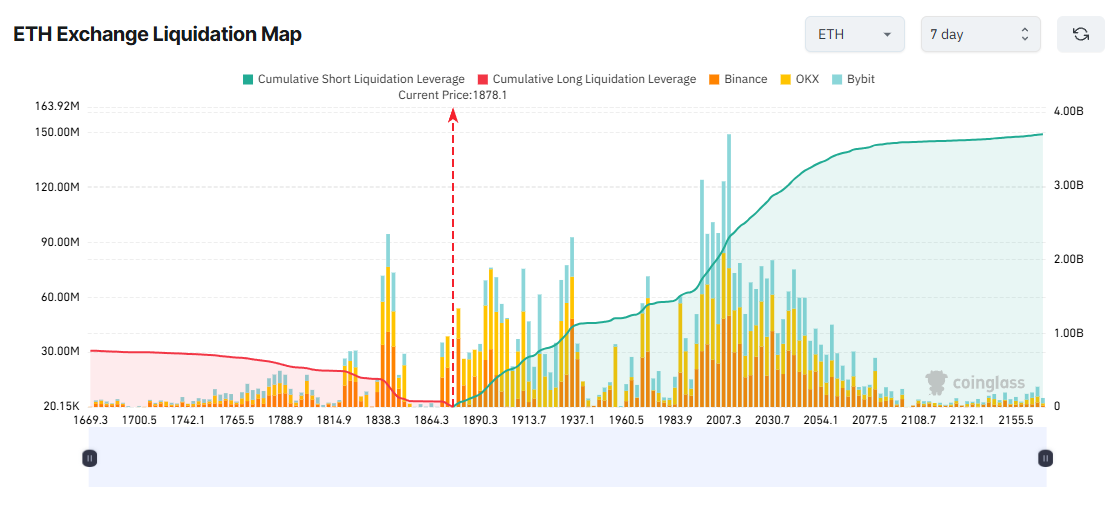
The seven-day liquidation map for Ethereum (ETH) shows that many traders are allocating capital and leverage to short positions, betting on continued downside through the end of the month.
As a result, cumulative potential liquidations on the short side now dominate. If ETH unexpectedly rebounds to $2,000 this week, short positions could face up to $2 billion in liquidations.
If ETH climbs further to $2,160, short liquidations could reach $3.6 billion.

Short-term traders have reasons to justify their bearish positioning. A recent report by BeInCrypto revealed that Vitalik Buterin reduced his holdings by more than 8,800 ETH throughout February 2026. Meanwhile, Ethereum inflows to Binance have reached their highest level since November 2025.
However, several bullish indicators are also emerging, increasing the likelihood of a surprise recovery.
ETH ETF flows have turned positive after four consecutive weeks of outflows. In addition, data from CryptoQuant shows that inflows into ETH accumulation addresses over the past six months have reached the most active period in history.
Given these dynamics, short sellers may need to reassess their leverage levels to mitigate the risk of sudden price reversals.
2. Binance Coin (BNB)
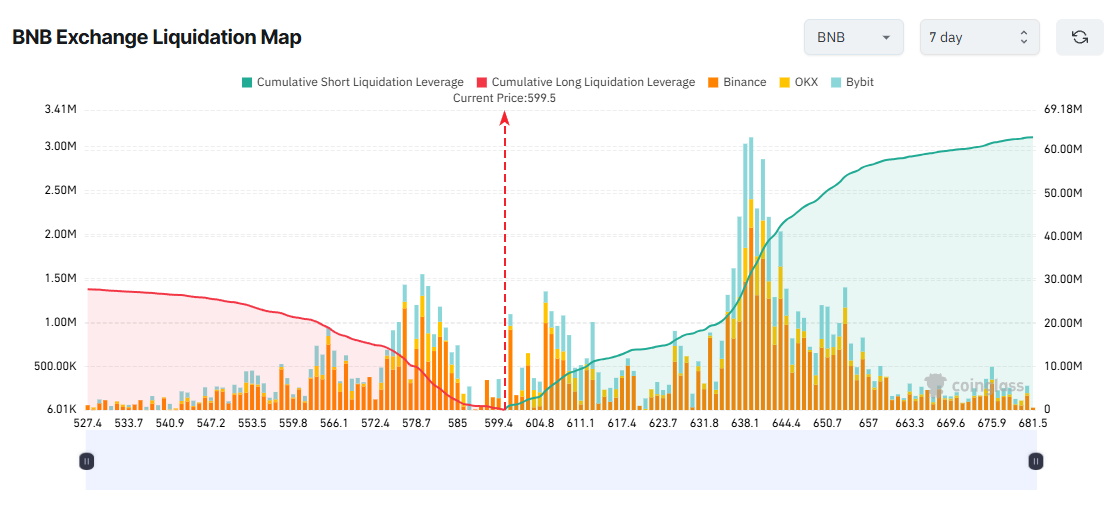
Like ETH, Binance Coin (BNB) has faced persistent selling pressure. Six consecutive red weekly candles with no clear signs of recovery have encouraged traders to maintain dominant short positions.
However, this positioning increases the risk of liquidation if BNB rebounds.
If BNB climbs to $640 this week, potential short liquidations could reach $35 million. A further rally to $680 could push short liquidations above $60 million.
Why should short traders remain cautious?
First, BNB is approaching its long-term support trendline established in 2024. Shorting near strong support levels often carries elevated risk.
Second, data from On-Chain Mind, a crypto analytics account, indicates that BNB is currently trading about 37% below its short-term holder realized price equivalent. Historically, this level has signaled meaningful undervaluation and has often preceded strong repricing moves.
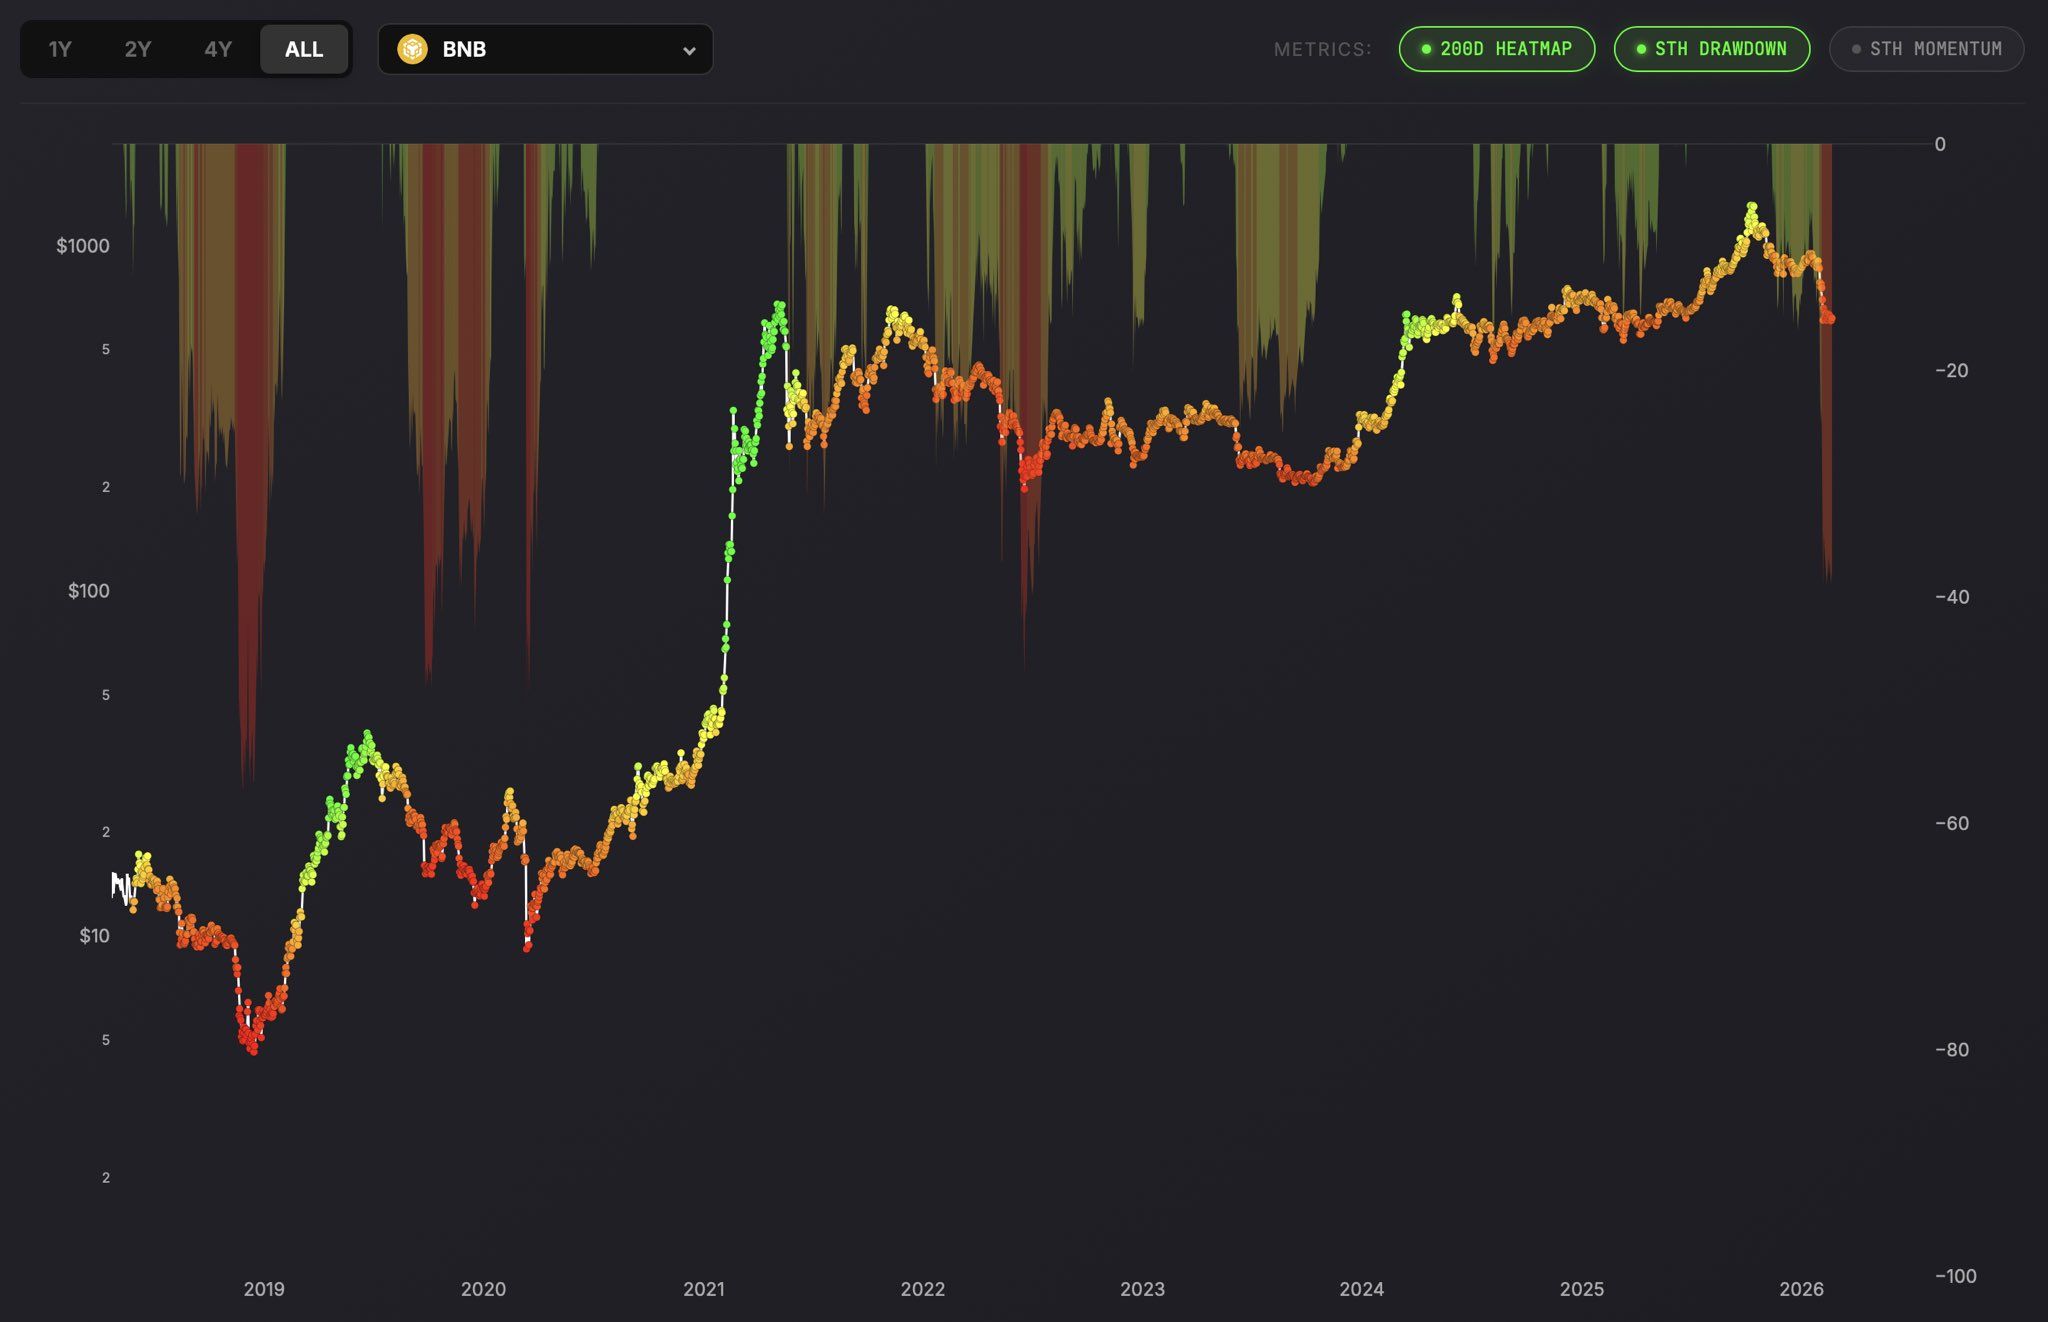
“Right now it is trading about 37% below its short-term holder realised price equivalent, a level that historically signals meaningful undervaluation. BNB has a history of sharp repricings from zones like this,” On-Chain Mind reported.
Short sellers who grow overly confident in BNB’s downtrend could face significant losses if momentum shifts.
3. Bitcoin Cash (BCH)
Bitcoin Cash stands out as one of the few altcoins that has not behaved as if it were in a broader crypto bear market.
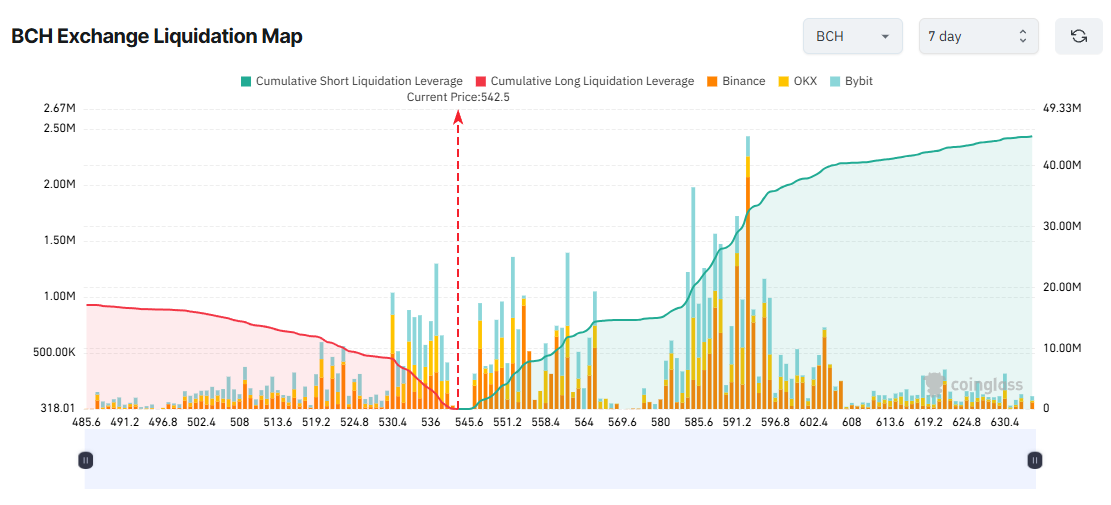
Nevertheless, short-term traders have turned increasingly bearish on BCH in the final week of February. Their positioning has pushed potential short liquidations well above those on the long side.
Data from Bitinfocharts shows that whales have actively accumulated BCH in recent months. One whale address accumulated 400,000 BCH within two months, becoming the network’s third-largest holder.
In addition, a recent report by BeInCrypto stated that the average transaction value on the BCH network surged to over $2 million, nearly 100 times higher than last year.
Under these conditions, heavily leveraged short positions could face liquidation risks if BCH rebounds. A move toward $630 this week could trigger up to $45 million in short liquidations.
In general, extremely negative market sentiment often creates ideal conditions for short squeezes.
“The sentiment in crypto right now is so bad that I’m actually pretty optimistic,” said Tyler Winklevoss, co-founder of Gemini.
In such an environment, short sellers may still capture profits. However, without disciplined profit-taking strategies and strict risk management, gains can quickly evaporate and turn into losses.

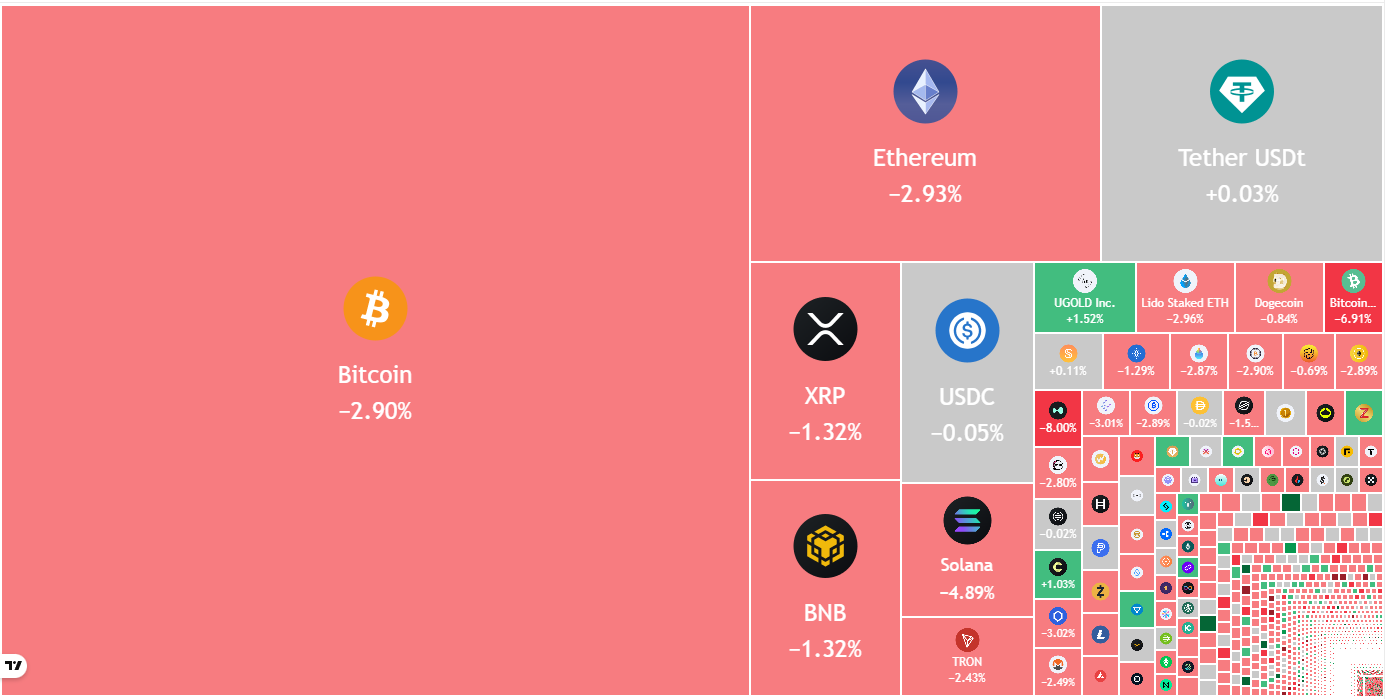
Bitcoin’s (BTC) weakness extended into the weekly open as major stocks sold off in response to US President Donald Trump’s threat to enforce a 15% global tariff after the Supreme Court ruled that his IEEPA tariffs were illegal.
Market sentiment remains fragile, as the Crypto Fear & Greed Index at 5 out of 100 remains in the “extreme fear” zone. Pseudonymous trader and investor BitcoinHyper said in a post on X that the index has been in the extreme fear zone for nearly three weeks, the longest since 2022.
Traders on the prediction market Polymarket have increased the odds of BTC falling below $55,000 to 72%. The prediction market expectations matches several analysts and financial institutions who expect a fall near or below $55,000.

While a bottom may not have formed, expectations are that BTC will eventually recover and move higher. Economist Timothy Peterson said in a post on X that BTC has been positive 50% of the time in the past 24 months. Using a statistical model, Peterson estimated that there is an 88% chance that BTC “will be higher 10 months from now.”
Could buyers defend the support levels in BTC and the major altcoins? Let’s analyze the charts of the top 10 cryptocurrencies to find out.
S&P 500 Index price prediction
The S&P 500 Index (SPX) has been trading between 6,775 and 7,002 for several days, indicating a balance between supply and demand.

The flat moving averages and the relative strength index (RSI) near the midpoint do not give a clear advantage either to the bulls or the bears. Buyers will have to achieve a close above the 7,002 resistance to signal the resumption of the uptrend. The index may then ascend to the 7,290 level.
This bullish view will be invalidated in the near term if the price turns down and breaks below the 6,775 level. The index may then tumble to the solid support at the 6,550 level.
US Dollar Index price prediction
The US Dollar Index (DXY) turned down from the 50-day simple moving average (97.95) on Friday, indicating that the bears are aggressively defending the level.

Sellers are attempting to sink and maintain the index below the 20-day exponential moving average (97.48). If they manage to do that, the index might slide to the 96.21 to 95.55 support zone.
Buyers are likely to have other plans. They will attempt to halt the pullback and push the price above the 50-day SMA. If they can pull it off, the index may jump toward the 99.50 level and subsequently to the 100.54 resistance.
Bitcoin price prediction
BTC fell below the $65,118 support on Monday, but the bulls are attempting to defend the level on a closing basis.

Any relief rally is expected to face selling at the 20-day EMA ($70,185). If the Bitcoin price turns down sharply from the 20-day EMA, it increases the likelihood of a drop to the vital $60,000 support. Buyers will have to defend the $60,000 level with all their might, as a break below it may sink the BTC/USDT pair to $52,500.
Buyers will have to propel the price above the 20-day EMA to signal demand at lower levels. The pair may then march to the $74,508 level, where the bears are again likely to pose a strong challenge.
Ether price prediction
Ether (ETH) fell below the nearby support at $1,897 on Monday, opening the doors for a retest of the $1,750 level.

The downsloping moving averages and the RSI near the oversold territory heighten the risk of a breakdown. If the $1,750 level is taken out, the ETH/USDT pair may resume the downtrend toward the next support at $1,537.
Contrarily, if the Ether price turns up sharply from $1,750, it suggests demand at lower levels. That may keep the pair inside the $1,750 to $2,111 range for a while longer. A close above $2,111 will be the first sign of strength, clearing the path for a rally to the 50-day SMA ($2,593).
XRP price prediction
XRP (XRP) has been trading between the support line of the descending channel pattern and the 20-day EMA ($1.47) for the past few days.

The downsloping 20-day EMA and the RSI in the negative territory indicate that the bears remain in control. If the support line cracks, the XRP/USDT pair may retest the Feb. 6 low of $1.11. A break and close below the $1.11 level may extend the decline to psychological support at $1.
Buyers have an uphill task ahead of them. They will have to swiftly propel the XRP price above the downtrend line to signal a potential trend change.
BNB price prediction
BNB (BNB) fell below the immediate support at $587 on Monday, but the long tail on the candlestick shows buying at lower levels.

The bulls will attempt to start a recovery, which is expected to face selling at the 20-day EMA ($651). If the price turns down from the 20-day EMA, the bears will again strive to pull the BNB/USDT pair below the $570 level. If they manage to do that, the BNB price may start the next leg of the downtrend to psychological support at $500.
Contrary to this assumption, if buyers pierce the 20-day EMA, the pair may rally to the breakdown level of $730.
Solana price prediction
The failure of the bulls to push Solana (SOL) to the breakdown level of $95 signals that the bears are active at higher levels.

Sellers will attempt to strengthen their position by pulling the Solana price below the $76 level. If they succeed, the SOL/USDT pair may fall to the Feb. 6 low of $67, which is a critical support to watch out for. If the level gives way, the pair may slump to $60.
Any relief rally is expected to face resistance at the 20-day EMA and then at the $95 level. A close above the $95 level suggests that the sellers are losing their grip. The pair may then surge to $117.
Related: Bitcoin traders diverge over BTC price strength with $60K in sight
Dogecoin price prediction
Dogecoin (DOGE) turned down from the 20-day EMA ($0.10) on Saturday and is likely to drop to the Feb. 6 low of $0.08.

The bulls are expected to fiercely defend the $0.08 level, as the failure to do so may start the next leg of the downward spiral toward $0.06.
The 20-day EMA remains the immediate near-term resistance to watch out for. A close above the 20-day EMA will be the first sign that the selling pressure is reducing. The DOGE/USDT pair may then ascend to the breakdown level of $0.12, where the bears are expected to mount a strong defense.
Bitcoin Cash price prediction
Buyers pushed Bitcoin Cash (BCH) above the 50-day SMA ($571) on Sunday but could not sustain the higher levels.

The bears sold aggressively and have pulled the Bitcoin Cash price below the 20-day EMA ($551). If the price maintains below $538, the BCH/USDT pair might plummet to the strong support at $500. Buyers are expected to aggressively defend the $500 level, as a close below it may sink the pair to $443.
Buyers will have to drive and maintain the price above the 50-day SMA to signal strength. The pair may then climb to $600.
Cardano price prediction
Despite repeated attempts, buyers failed to push and maintain Cardano (ADA) above the 20-day EMA ($0.28) in the past few days.

That increases the likelihood of a drop to the support line of the descending channel pattern. If the price rebounds off the support line and breaks above the 20-day EMA, it suggests that the ADA/USDT pair may remain inside the channel for some more time.
Instead, if the Cardano price continues lower and breaks below the support line, it indicates the resumption of the downtrend. The pair may then plunge toward $0.15. A short-term trend change will be signaled after buyers clear the overhead hurdle at the downtrend line.
This article does not contain investment advice or recommendations. Every investment and trading move involves risk, and readers should conduct their own research when making a decision. While we strive to provide accurate and timely information, Cointelegraph does not guarantee the accuracy, completeness, or reliability of any information in this article. This article may contain forward-looking statements that are subject to risks and uncertainties. Cointelegraph will not be liable for any loss or damage arising from your reliance on this information.


Crypto.com has received conditional approval from the U.S. Office of the Comptroller of the Currency (OCC) to charter Foris Dax National Trust Bank, taking a significant step toward becoming a federally regulated qualified custodian.
Centralized cryptocurrency platform Crypto.com has received a conditional approval from the U.S. Office of the Comptroller of the Currency (OCC) to establish Foris Dax National Trust Bank, d.b.a. Crypto.com National Trust Bank.
This development advances the firm’s ambition to become a federally regulated qualified custodian, according to an official announcement. Once fully approved, Foris Dax National Trust Bank will provide custody, staking, and trade settlement services under the stringent oversight of the OCC.
Crypto.com’s move aligns with a broader industry trend where crypto firms are pursuing regulatory approvals to enhance their credibility and expand service offerings.
For instance, Anchorage Digital recently launched regulated ‘Stablecoin Solutions’ to cater to institutional needs, while CME Group is set to offer 24/7 crypto futures trading, showcasing the industry’s shift towards regulated offerings.
The move also comes as the global crypto custody market is projected to reach over $4 trillion by 2033, growing at a CAGR of 23.6% from 2025 to 2033, according to Grand View Research.
Kris Marszalek, CEO of Crypto.com, emphasized the significance of this regulatory milestone in a statement.
“This conditional approval is the latest testament to both our commitment to compliance and to providing customers trusted and secure services they expect from Crypto.com,” said Marszalek. “This milestone brings us a major step closer to meeting leading institutions’ needs for a one-stop-shop qualified custodian under a gold standard of federal oversight.”
Headquartered in Singapore, Crypto.com offers a wide selection of crypto services, including trading, payments, and financial products. The platform has amassed over 150 million users worldwide, according to the platform’s website.
The OCC, a U.S. federal agency responsible for regulating and supervising national banks, has been actively involved in providing regulatory clarity for crypto-related financial services.
This article was generated with the assistance of AI workflows.
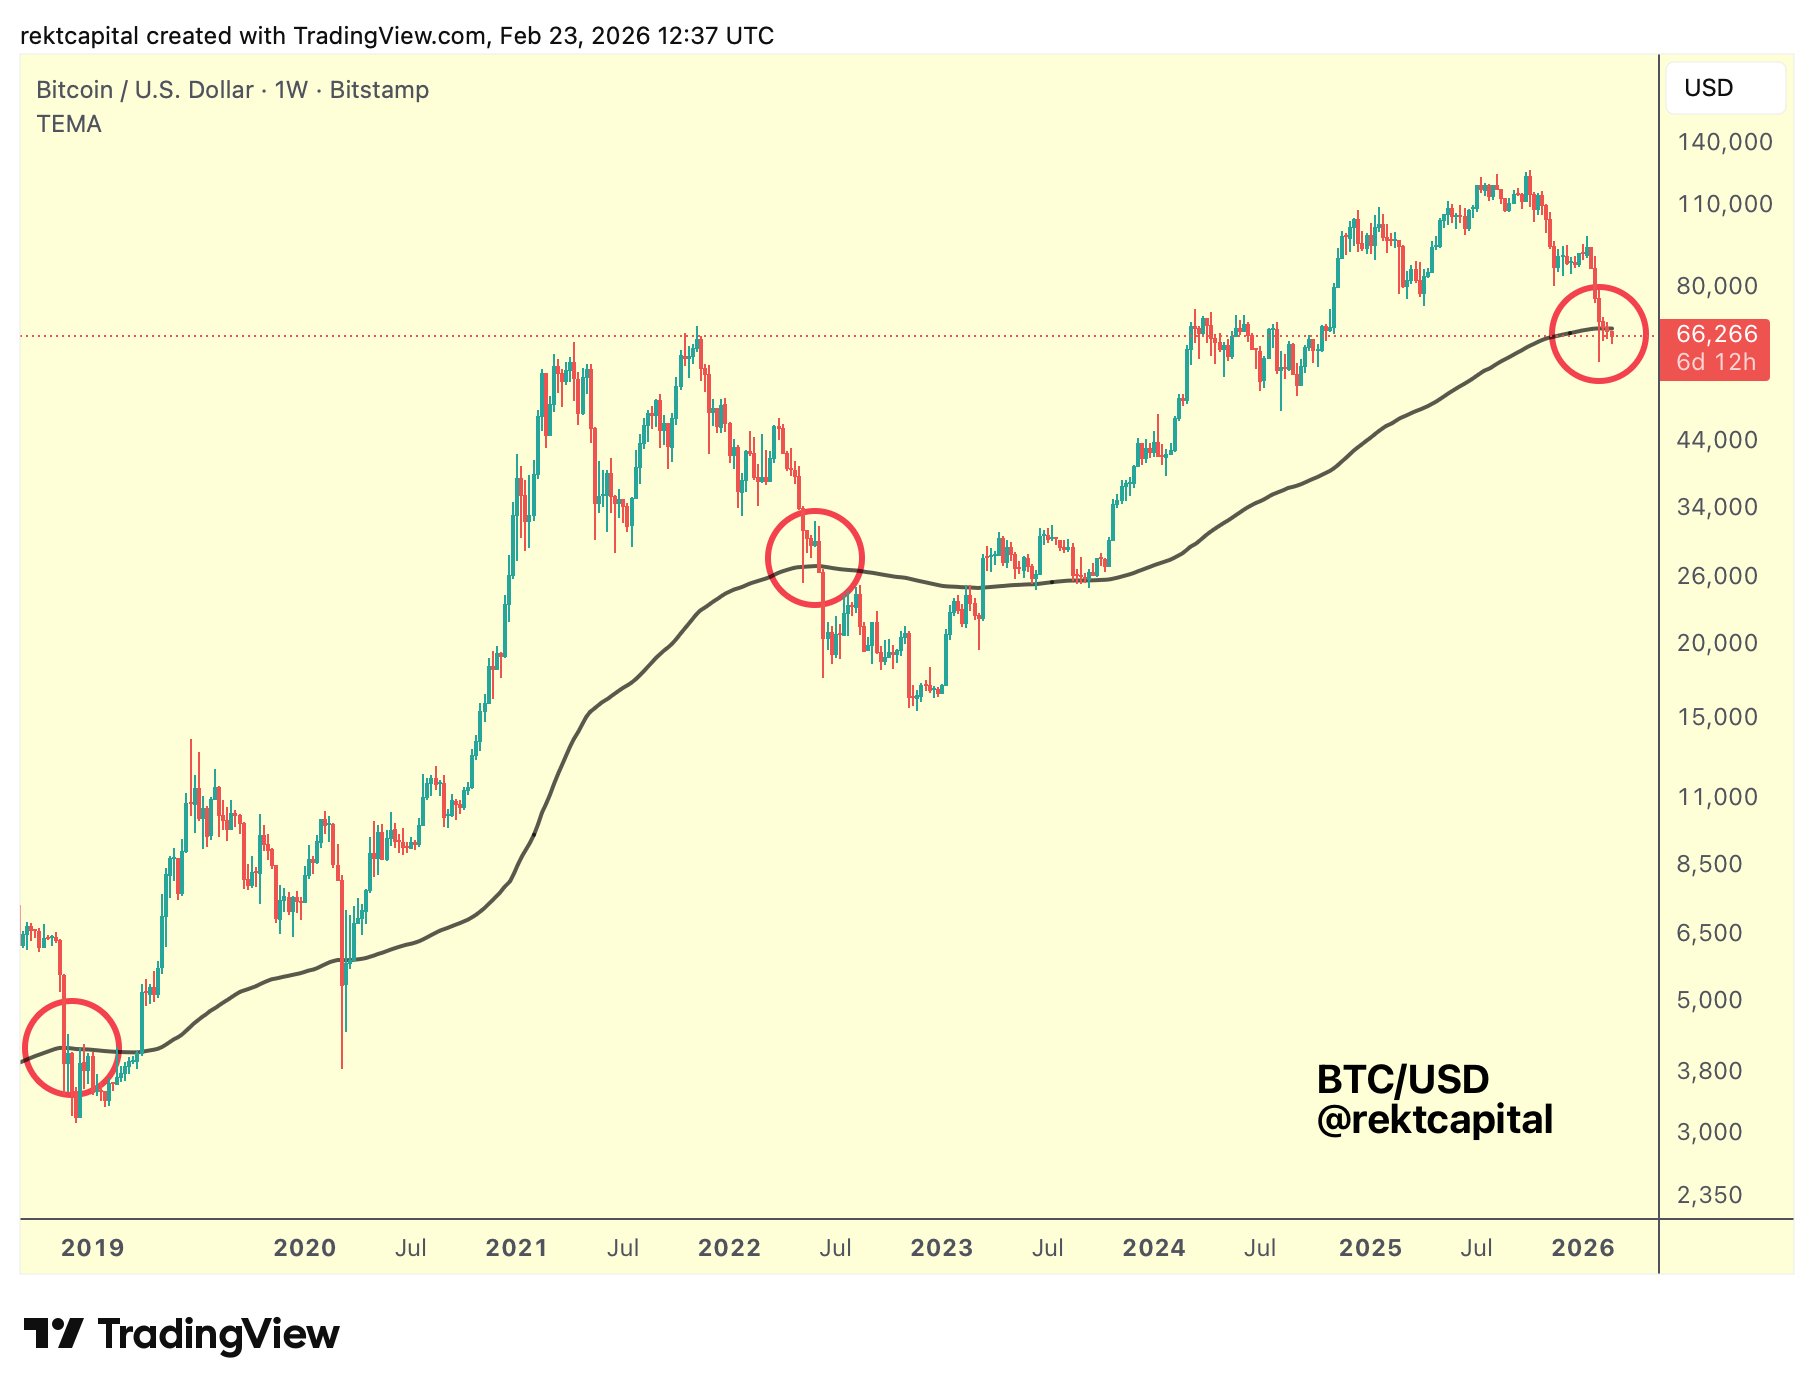
Bitcoin (BTC) closed a weekly candle below its 200-period exponential moving average (EMA) for the first time since October 2023. The weekly close ended a technical uptrend that lasted for 882 days.
The shift in trend renews focus on BTC’s onchain cost-basis levels and its historical interaction with the key moving average across previous cycles, framing a broader recovery timeline based on past market behavior.
The weekly trend may flip to resistance for Bitcoin
The 200-week EMA tracks Bitcoin’s long-term trend and has historically separated expansion phases from the deeper corrective periods. On the weekly chart, BTC closed below the average near $67,628, ending a support streak that began in late 2023.
Crypto analyst Rekt Capital noted the development, stating,
“This technically means that the EMA has been lost as support and that price could turn it into resistance on any upcoming recovery.”

Previous cycles show that reclaiming the 200-weekly EMA has required time. In 2018, Bitcoin traded below the level for roughly 14 weeks before regaining it.
During the Covid-led March 2020 liquidity shock, the recovery took about eight weeks. In 2022, BTC remained under the average for nearly 30 weeks. Across these instances, the average duration below the 200-weekly EMA was approximately 17 to 18 weeks.
Momentum indicators also reflect the cooling of longer-term investor participation. Last week, Bitcoin researcher Axel Adler Jr. noted that entity-adjusted liveliness peaked in December 2025 after BTC reached an all-time high near $126,000 in October.
Liveliness measures the ratio of coin days destroyed to coin days created, adjusted for the internal transfers. The metric has since declined below its 30-day and 90-day moving averages, while the 90-day remains above the 365-day at 0.02622. Similar rollovers in 2020 and 2022 preceded extended accumulation phases lasting one to two years.

A sustained decline in the liveliness metric typically signals reduced spending activity and slower capital rotation, conditions that may lengthen the time required for BTC to rebuild a position and reclaim the 200-weekly EMA.
Related: Tether flashes Bitcoin bottom signal: Can BTC stage another 100% rally?
BTC realized price bands outline the demand zone
Bitcoin’s realized price, near $55,000, reflects the average onchain cost basis of all coins. The shifted realized price, near $42,000, projects this metric forward and historically highlights the deeper value areas during drawdowns.

With BTC trading between the 200-weekly EMA and the realized price band cluster, the region has historically acted as a long-term accumulation zone since 2015. Prior cycles show consolidation periods of six to eight months around these levels before broader upside continuation.
A reclaim of the 200-weekly EMA restores the price above a key long-term trend threshold. Failure to do so maintains focus on the $55,000 realized price and the lower shifted band near $42,000 as potential areas of liquidity concentration.
Related: Bitcoin traders diverge over BTC price strength with $60K in sight
This article does not contain investment advice or recommendations. Every investment and trading move involves risk, and readers should conduct their own research when making a decision. While we strive to provide accurate and timely information, Cointelegraph does not guarantee the accuracy, completeness, or reliability of any information in this article. This article may contain forward-looking statements that are subject to risks and uncertainties. Cointelegraph will not be liable for any loss or damage arising from your reliance on this information.
The crypto market will welcome tokens worth more than $317 million in the final week of February 2026. Three major projects, Jupiter (JUP), Humanity (H), and Grass (GRASS), will release previously restricted tokens into circulation.
Token unlocks are crucial events in the crypto market, influencing liquidity, price volatility, and overall investor sentiment. So, here’s a breakdown of what to watch.
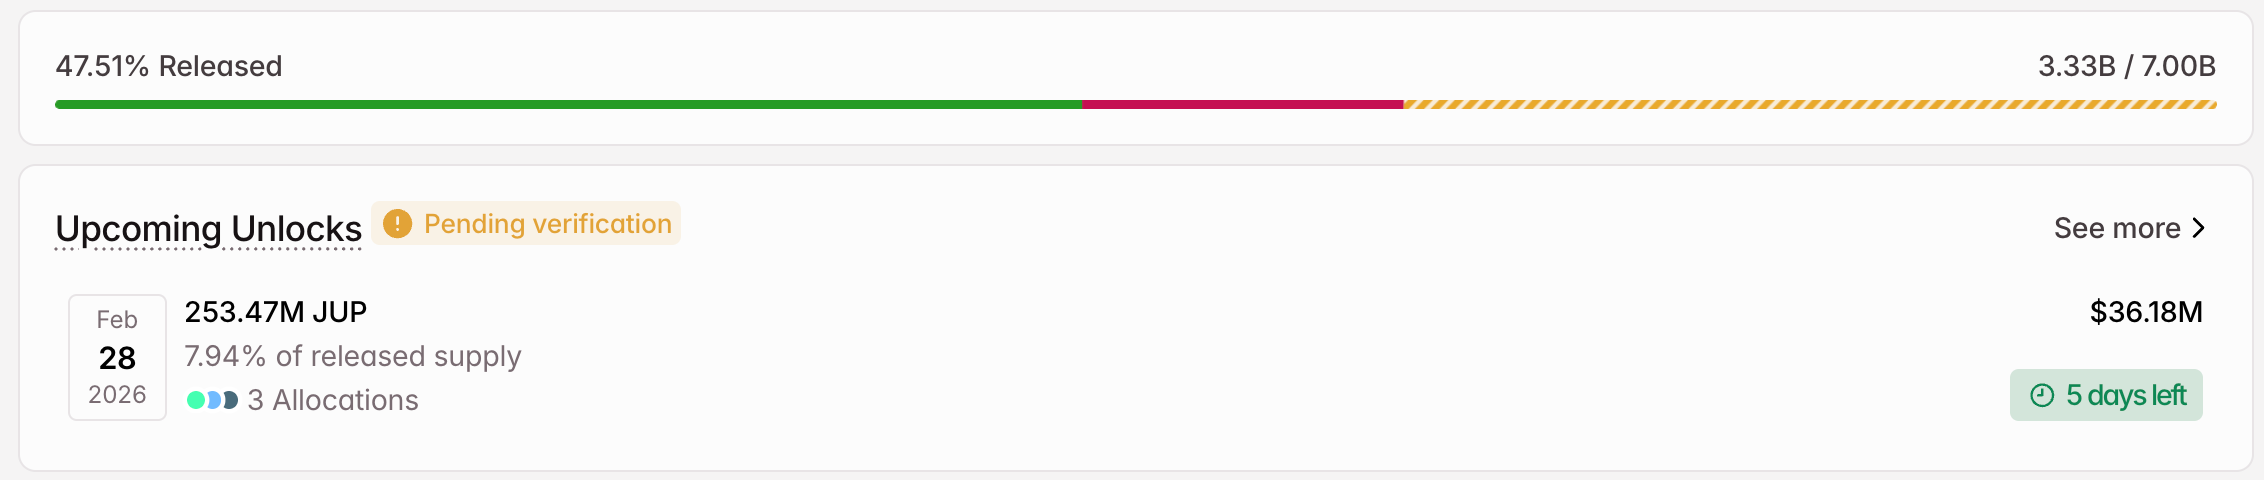
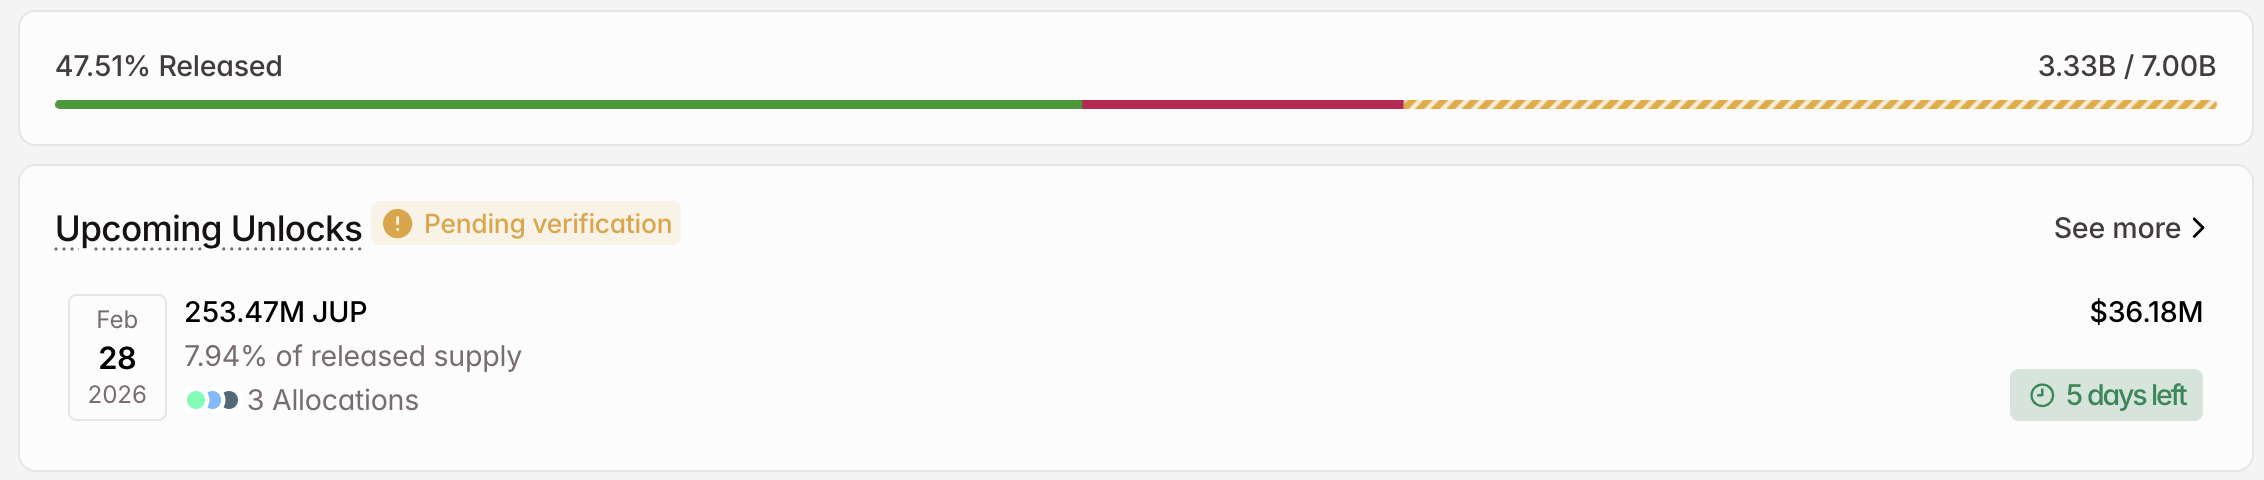
1. Jupiter (JUP)
- Unlock Date: February 28
- Number of Tokens to be Unlocked: 253.47 million JUP
- Released Supply: 3.33 billion JUP
- Total supply: 7 billion JUP
Jupiter is a decentralized liquidity aggregator on the Solana blockchain. It optimizes trade routes across multiple decentralized exchanges (DEXs) to provide users with the best prices for token swaps with minimal slippage.
On February 28, Jupiter will unlock 253.47 million JUP, valued at approximately $36.18 million. The altcoins represent 7.94% of its released supply. This marks a substantial increase from Jupiter’s usual monthly unlock of 53.47 million tokens.
Jupiter will direct 38.89 million JUP to the team. Furthermore, mercurial stakeholders will get 14.58 million JUP altcoins.
Notably, the team has reserved the largest portion, 200 million JUP, for Jupuary. It is Jupiter’s yearly airdrop initiative aimed at rewarding users and long-term community supporters.
2. Humanity (H)
- Unlock Date: February 25
- Number of Tokens to be Unlocked: 105.36 million H
- Released Supply: 2.41 billion H
- Total supply: 10 billion H
Humanity (H) is a decentralized identity protocol that utilizes biometric palm recognition, zero-knowledge proofs, and blockchain to verify the authenticity of real human users without exposing their personal data. It features a native Proof of Humanity (PoH) consensus mechanism.
On February 25, the protocol will unlock 105.36 million tokens. The tokens are worth $16.74 million and account for 4.37% of the released supply.
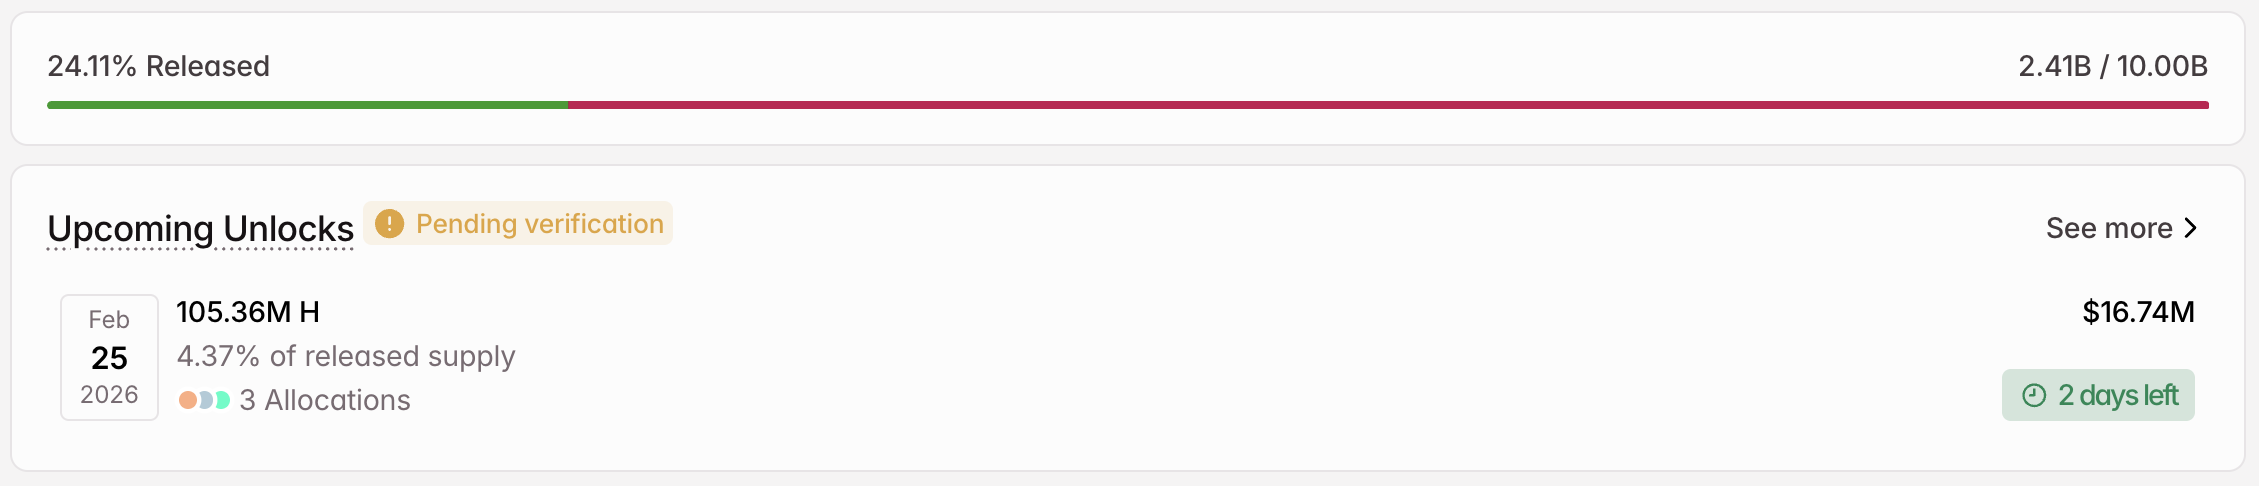
The team will split the released supply three ways. The ecosystem fund will receive 50 million H. Furthermore, Humanity will allocate 42.86 million altcoins to identity verification rewards and 12.50 million to the foundation operations treasury.
3. Grass (GRASS)
- Unlock Date: February 28
- Number of Tokens to be Unlocked: 55 million GRASS
- Released Supply: 416.54 million GRASS
- Total supply: 1 billion GRASS
Grass enables users to monetize unused internet bandwidth. It leverages blockchain to reward participants in a privacy-preserving manner, fostering a global network for accessible data sourcing.
The project will release 55 million tokens on February 28. The supply is worth approximately $9.33 million. It represents 13.15% of the released supply.
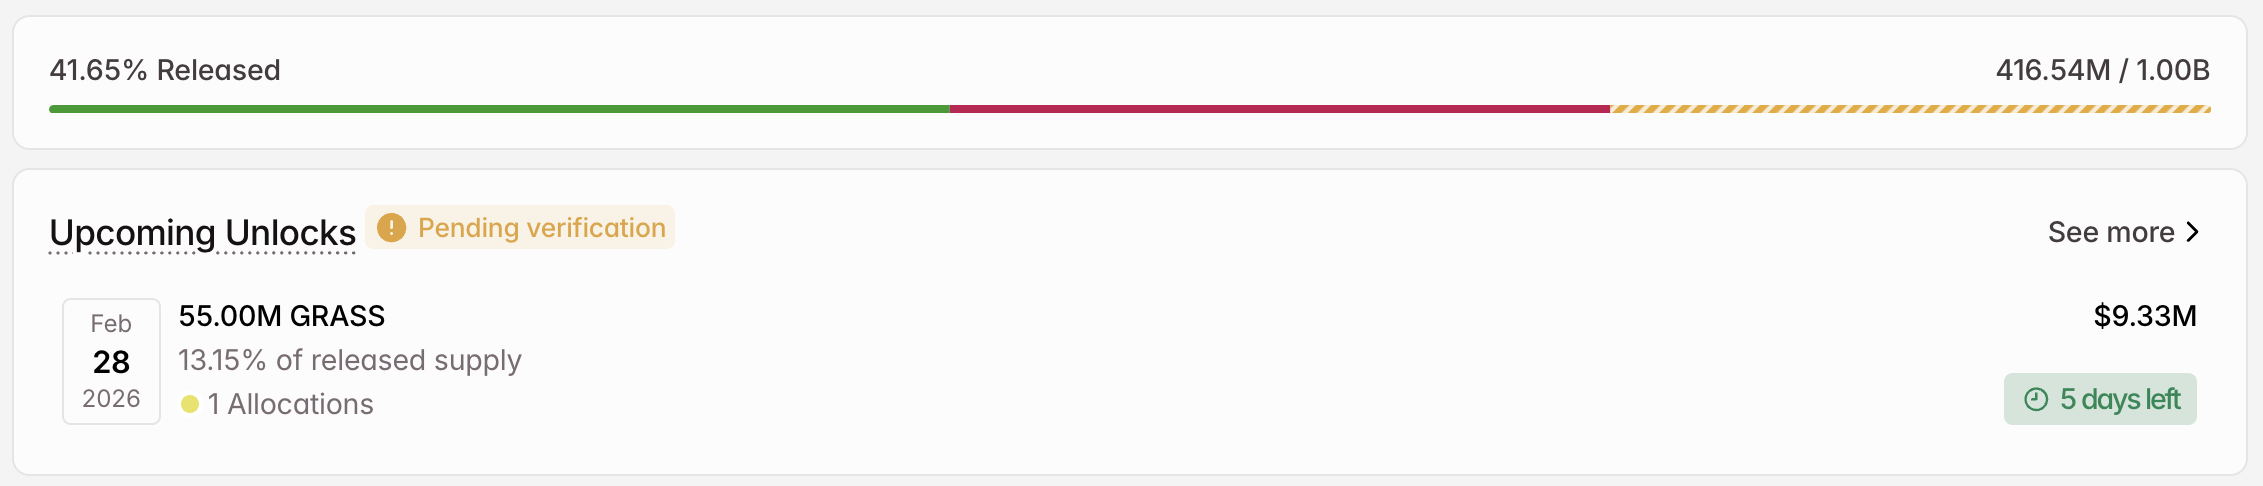
The contributors will receive the entire unlocked supply. In addition to these, other prominent unlocks that investors can look out for in the final week of February include Plasma (XPL), Kamino (KMNO), EigenCloud (EIGEN), and more.
Meme coin volatility is back in focus as the third week of February 2026 delivers explosive short-term rallies. While large-cap assets struggle to establish a clear direction, select low-cap tokens are posting double- and even triple-digit gains.
However, with rapid price expansions comes heightened correction risk. Thus, BeInCrypto has analysed three such meme coins that are pivotal to watch in the final week of February.
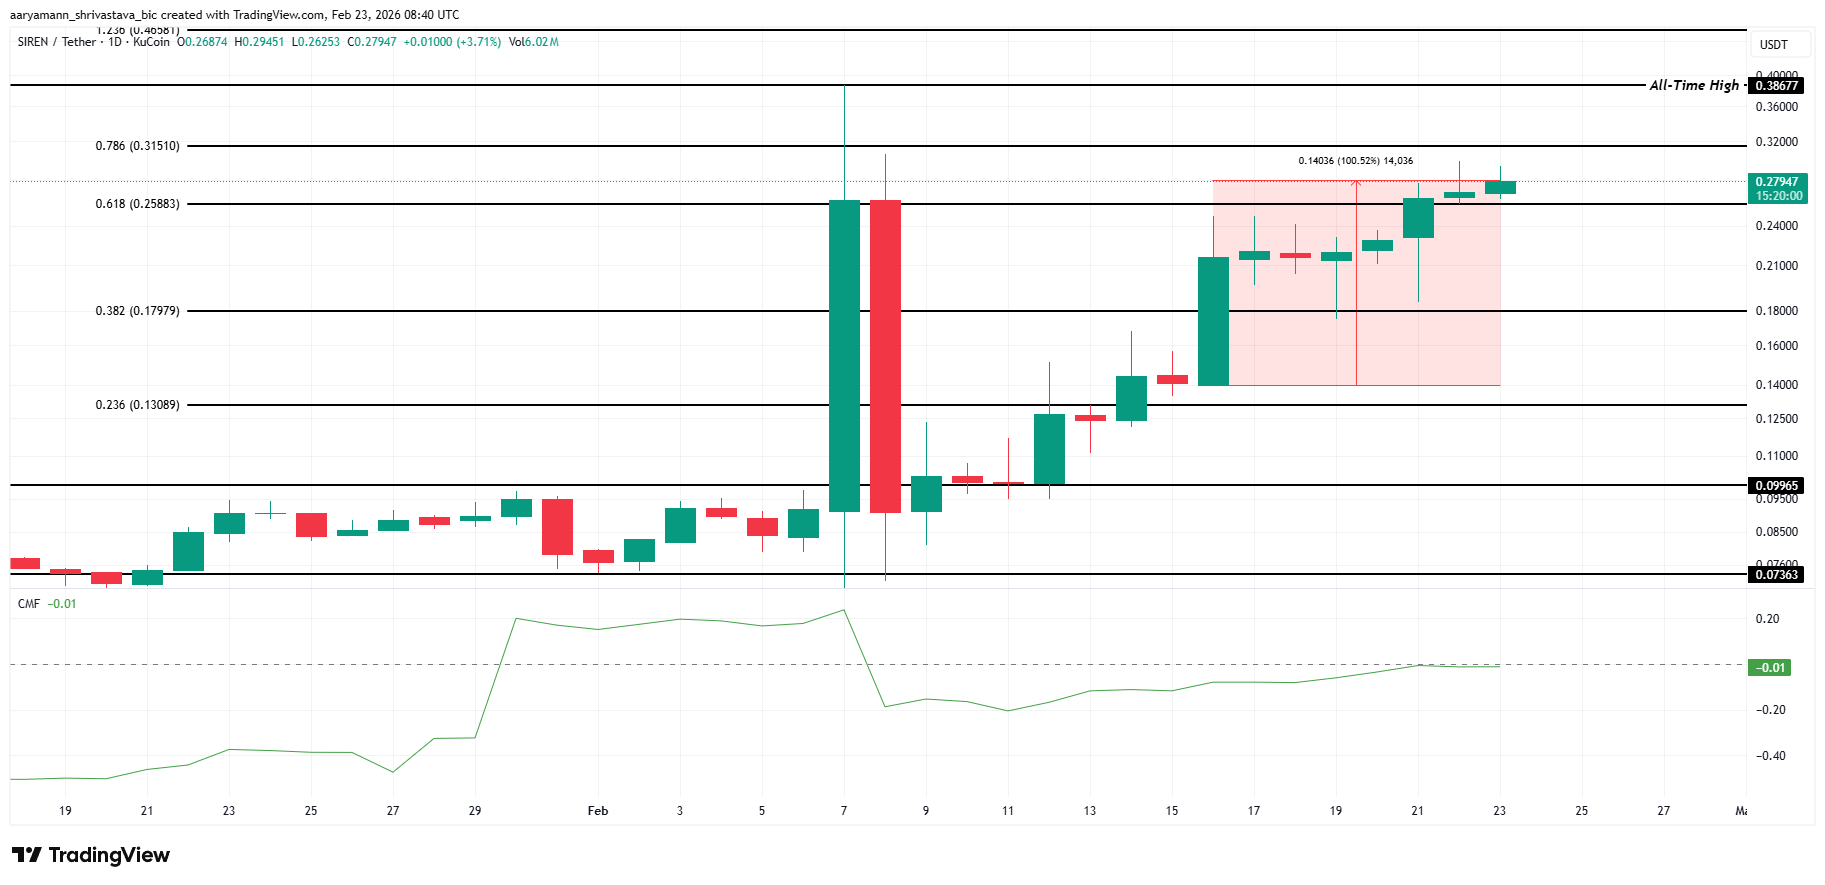
Siren (SIREN)
SIREN price has surged 100.5% over the past week, trading at $0.279 at the time of writing. The meme coin is benefiting from renewed investor optimism. Declining exchange outflows indicate holders are retaining tokens, a signal often associated with strengthening short-term bullish momentum in crypto markets.
The Chaikin Money Flow indicator has climbed above the zero line, reflecting rising capital inflows. Sustained buying pressure could support further upside. If momentum continues, SIREN price may retest its all-time high of $0.386. A breakout above that level could open the path toward $0.465.
Want more token insights like this? Sign up for Editor Harsh Notariya’s Daily Crypto Newsletter here.

However, rapid gains increase the likelihood of profit taking. A shift in sentiment could push SIREN below the $0.258 support level. Losing this threshold would weaken the bullish structure. In that scenario, the meme coin could decline toward $0.179, delaying any attempt to reach new highs.
Not in Employment, Education, or Training (NEET)
NEET price surged 75% in the past 24 hours, trading at $0.0249 at the time of writing. The sharp rally caught the broader crypto market off guard. Elevated trading volume and social media traction have fueled momentum, positioning the altcoin for potential continuation if demand remains steady.
Sustained buying pressure has strengthened NEET’s short-term structure. A confirmed move above $0.0258 could support further upside toward $0.0329 in the coming days. The meme coin’s base of 14,100 holders relative to its $24 million market cap signals active community participation, often a catalyst for volatility.
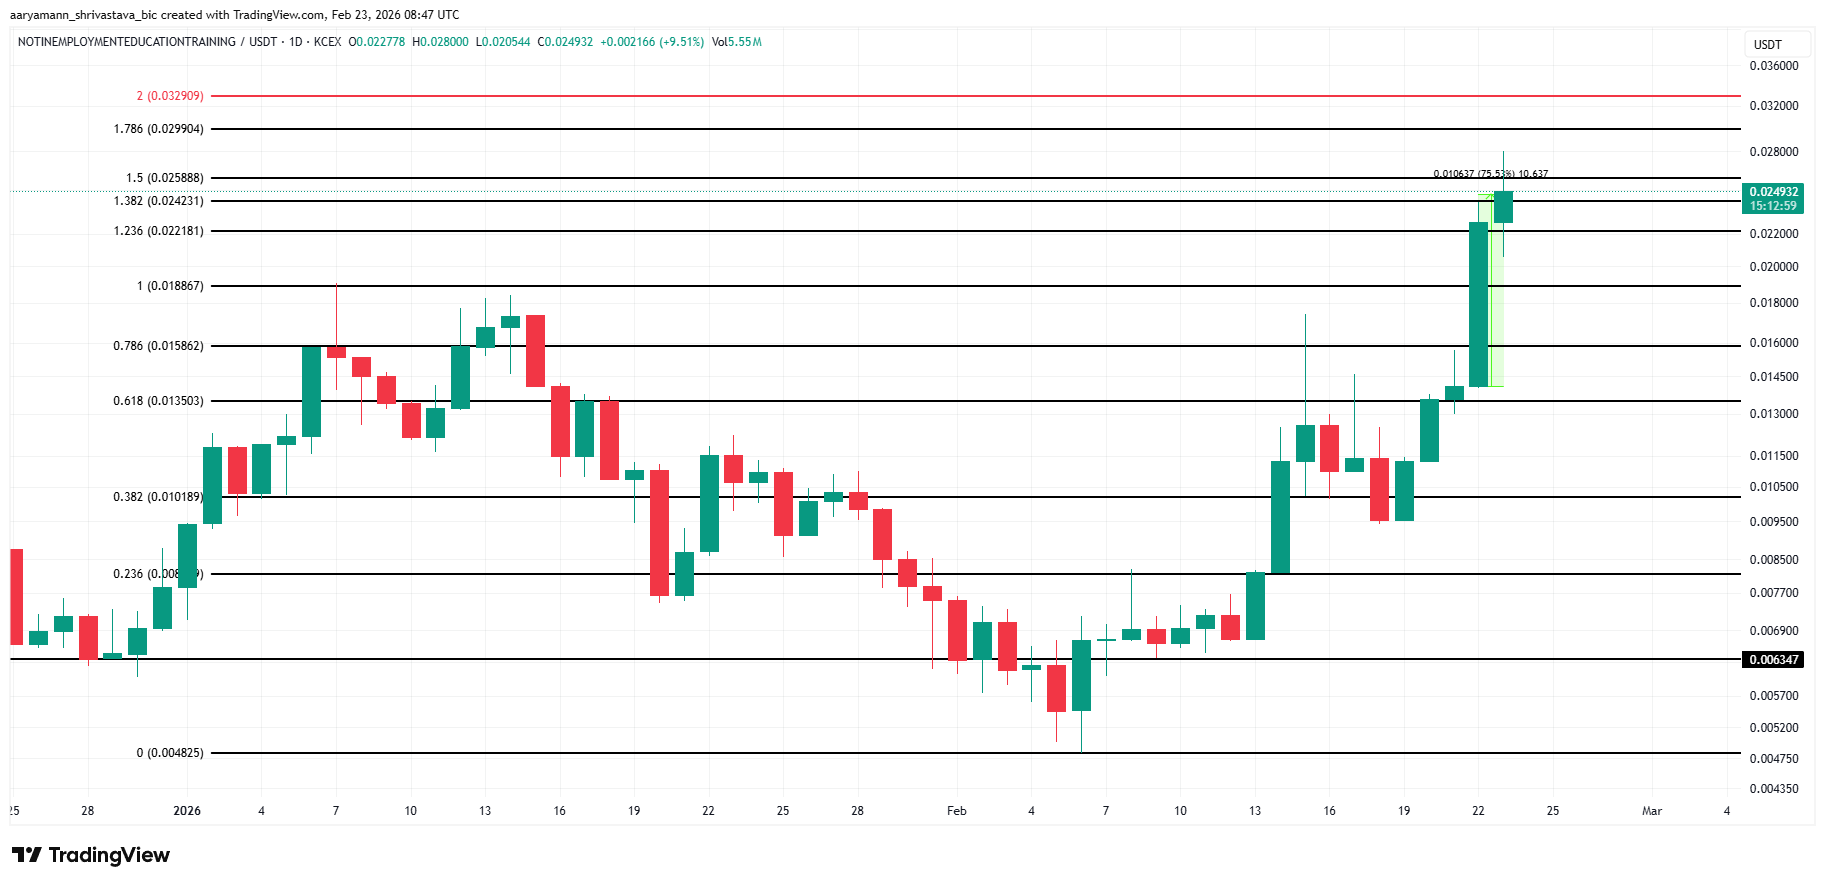
However, rapid price expansion increases correction risk. If buying pressure fades, profit booking may trigger a pullback. Holding $0.0188 support would preserve recovery prospects. A breakdown below that level could drive NEET toward $0.0158, invalidating the bullish outlook and signaling broader weakness.
BAN emerged as one of the stronger-performing meme coins this week, rising 34% despite broader crypto market weakness. This divergence from overall market losses highlights relative strength. Sustained decoupling from bearish sentiment could attract short-term traders seeking alternative upside opportunities in volatile digital assets.
BAN’s correlation with Bitcoin stands at -0.34, indicating it often moves opposite the leading cryptocurrency. This inverse relationship can benefit BAN during Bitcoin pullbacks. Continued negative correlation may support the ongoing uptrend, potentially driving BAN price toward $0.1617 and extending gains to $0.1835.
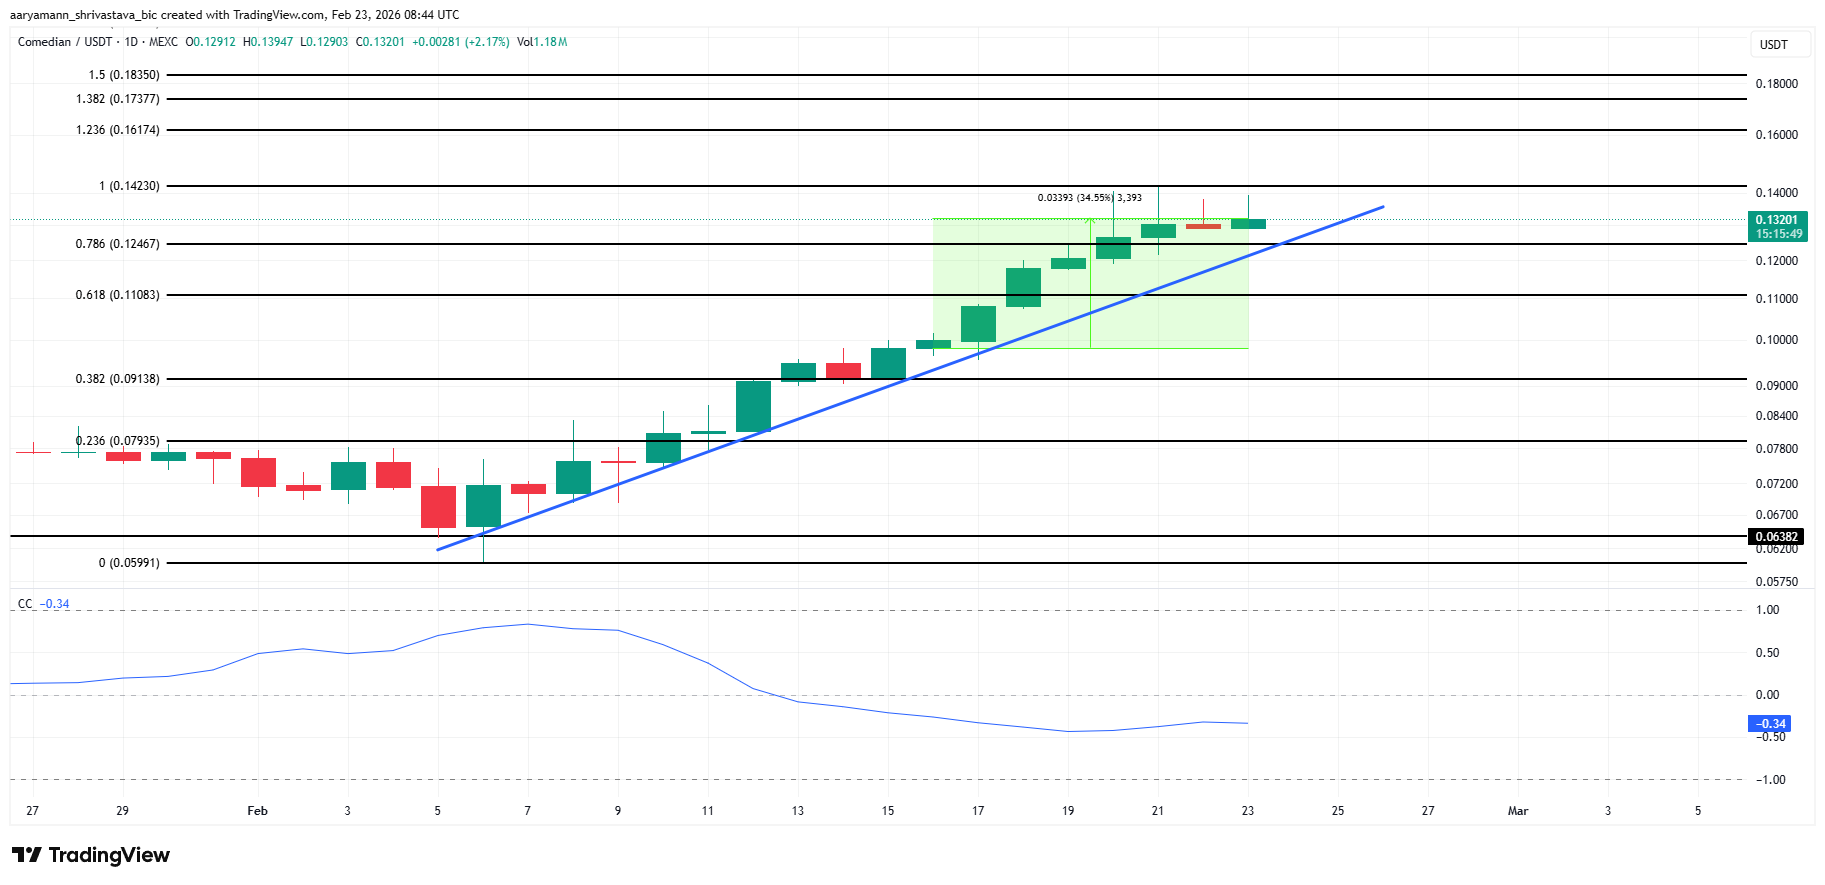
However, improving Bitcoin price momentum could alter this dynamic. If broader crypto sentiment strengthens, BAN’s inverse correlation may limit upside. A decline below $0.1108 would weaken the bullish structure. Sustained selling pressure could push the meme coin toward $0.0913, invalidating the current recovery outlook.

Editor’s note: As the AI boom accelerates, Nvidia sits at the heart of the conversation about how quickly hardware and software teams scale deployment. This editorial provides a concise context for the press release that follows, focusing on the broader market momentum, the role of data centers in AI infrastructure, and the potential implications of forward guidance for investors and traders in tech and beyond. While this note does not add new facts, it frames the lens through which Nvidia’s earnings will be digested by crypto traders and institutional investors who closely watch AI spending trends, capex cycles, and regional risks.
Key points
- Nvidia continues to be a focal point for AI infrastructure spend, with hyperscalers driving data center demand.
- Rubin, Nvidia’s next-generation platform, is a key area of investor focus alongside the Blackwell ramp and gross margin trajectory.
- Geopolitical risk remains a consideration, with export controls in China presenting potential upside if restrictions ease.
- Forward guidance and near-term revenue expectations are closely watched as drivers of momentum in the AI trade.
Why this matters
Nvidia’s earnings preview signals how AI infrastructure investment could shape market dynamics across technology, finance, and enterprise computing. The year ahead will test whether data center demand, platform innovations, and global capex cycles sustain the AI momentum that has underpinned recent market rally attempts and portfolio allocations.
What to watch next
- Rubin ramp progress and its impact on long-term profitability.
- Any developments on China export restrictions and potential upside if eased.
- Guidance clarity on 2027 AI infrastructure spending and data center revenue trends.
Disclosure: The content below is a press release provided by the company/PR representative. It is published for informational purposes.
Nvidia Earnings Set to Test AI Trade Momentum
Nvidia Earnings Set to Test AI Trade Momentum
Abu Dhabi, United Arab Emirates – February 23, 2026: Nvidia’s upcoming earnings report is poised to become one of the most significant events on the global financial calendar, reflecting its position at the centre of the artificial intelligence revolution.
“In the same way Apple once defined the smartphone era, Nvidia now represents the AI era,” said Zavier Wong, Market Analyst at eToro. “Its earnings are no longer just a tech sector event — they are a market-wide catalyst that can influence diversified portfolios globally.”
Wall Street expects quarterly revenue of approximately USD $65–66 billion, representing around 68% year-on-year growth, with earnings per share forecast at USD $1.52–1.53. Data centre revenue is projected to approach USD $60 billion, underscoring sustained demand from hyperscalers including Microsoft, Amazon, Google and Meta. Collectively, these companies are expected to allocate between USD $650–660 billion in capital expenditure in 2026, much of which is tied directly to AI infrastructure.
Beyond US technology giants, sovereign AI investment is emerging as a meaningful growth driver. Countries such as the UAE and Saudi Arabia, alongside several European nations, are accelerating domestic AI cloud development. This segment alone could contribute more than USD $20 billion to Nvidia’s annual revenue in 2026, providing further diversification of its revenue base.
Demand continues to be supported by Nvidia’s Blackwell architecture, which management has previously indicated is effectively sold out through mid-year. Market attention is now turning toward Rubin, the company’s next-generation platform unveiled at CES. Gross margins are expected to recover toward the mid-70% range following temporary pressure during the Blackwell ramp-up, a key signal for long-term scalability and profitability.
However, China remains a notable risk factor. Current guidance assumes no H20 chip sales into the region, meaning any easing of export restrictions would represent upside potential. For now, restrictions continue to act as a headwind.
Nvidia shares have traded broadly flat over the past six months, and investors are increasingly focused on forward guidance rather than headline results.
“The real driver of Nvidia’s share price is guidance,” Wong added. “Markets want confirmation that AI infrastructure spending is still in its early innings, especially as questions grow around the sustainability of industry-wide capex.”
Investors are looking for Q1 FY2027 revenue close to USD $75 billion, gross margins back in the mid-70% range, and clearer visibility on the Rubin ramp. Meeting those expectations could reignite momentum across the AI trade, while any shortfall may trigger volatility extending well beyond Nvidia itself.
Media Contact:
PR@etoro.com
About eToro
eToro is the trading and investing platform that empowers you to invest, share and learn. We were founded in 2007 with the vision of a world where everyone can trade and invest in a simple and transparent way. Today we have 40 million registered users from 75 countries. We believe there is power in shared knowledge and that we can become more successful by investing together. So we’ve created a collaborative investment community designed to provide you with the tools you need to grow your knowledge and wealth. On eToro, you can hold a range of traditional and innovative assets and choose how you invest: trade directly, invest in a portfolio, or copy other investors. You can visit our media centre here for our latest news.

FIFA World Cup organizers are reportedly considering moving this year’s tournament out of Mexico after the death of a crypto-laundering Mexican cartel kingpin led to a wave of violence from his supporters.
Nemesio Oseguera Cervantes, otherwise known as “El Mencho,” ran the Jalisco New Generation Cartel (CJNG) and was killed on Sunday during clashes between his organization and Mexican authorities.
The 59-year-old was reportedly injured during a firefight in the town of Tapalpa, and died while being transported to Mexico City.
His death resulted in an outpouring of violence from supporters. This included the burning of vehicles and buildings across the country, including in Guadalajara, a scheduled host of this summer’s World Cup.
As a result, rumours began to circulate that the city could be pulled from the tournament’s list of venues. Indeed, the host of Ticket Talk, Scott Friedman, claims a contact within FIFA informed him that games will be moved out of Mexico if the situation doesn’t improve in the next week or two.
Bitcoin investor and private fund founder Mike Alfred also claimed that “credible chatter” informed him that the cartel violence has led FIFA to consider moving games slated to take place in Mexico to the US and Canada.
Read more: Up to 127 years for CEO who laundered Mexican cartel funds with bitcoin
The violence has led to countries issuing warnings against travelling to affected regions of Mexico, and the US warning its citizens in the Jalisco region to seek shelter and stay inside.
FIFA is yet to publicly comment on the situation in Mexico. Protos has reached out to FIFA for comment and will update this piece should we hear back.
El Mencho laundered drug funds with crypto brokers
Cervantes founded the CJNG after working his way up the cartel ranks, killing rivals along the way. It was a notoriously violent, heavily armed organization that has been responsible for numerous massacres.
The drug lord was designated as a Kingpin in 2015 and his drug trafficking enterprise was recognised as one of the most powerful criminal groups in Mexico.
The US reward for information leading to his arrest was set at $15 million.

Read more: UK ‘El Chapo’ faces 120 years in US prison over bitcoin-for-drugs ring
Studies led by TRM Labs found that the CJNG has been utilizing crypto to convert drug funds into stablecoins. It was then sent to various wallets, withdrawn from exchanges, or spent as crypto.
In 2022, the Drug Enforcement Administration reportedly discovered that the CJNG had used Binance to move up to $40 million worth of cryptocurrency made through its cocaine and methamphetamine sales.
A Mexican broker was sentenced to eight years in prison for organizing a series of crypto laundering hubs across the US that took cash from the CJNG’s drug sales and converted it into crypto.
TRM Labs has also documented how Chinese money laundering brokers help out these cartels, as well as Chinese suppliers that sell them drug-related chemicals in exchange for crypto.
Got a tip? Send us an email securely via Protos Leaks. For more informed news, follow us on X, Bluesky, and Google News, or subscribe to our YouTube channel.

Editor’s note: The mix of rapid crypto adoption and stringent governance in MENAP demands thoughtful, values-driven innovation. This editorial preview examines how structured, Sharia-aligned products can widen access without compromising transparency or risk controls. By highlighting Binance’s Sharia Earn initiative, we explore how Islamic finance principles and blockchain technology intersect to create clearer contracts, responsible yield, and broader participation. In a region projected to host trillions in Islamic finance assets, responsible design is not optional—it’s essential for sustainable growth.
Key points
- Sharia Earn provides defined contracts, governance oversight, and halal investment channels within Binance’s framework.
- Certified by Amanie Advisors and designed with a Wakala structure and underlying Binance Earn tech.
- Launched with BNB, ETH, and SOL as the initial assets.
- Ramadan-driven campaign highlights the move toward compliant, transparent product design in the region.
Why this matters
Structured, values-aligned innovation in MENAP helps turn digital finance into a trusted, inclusive ecosystem. By coupling Islamic finance tenets with blockchain mechanics and governance oversight, Sharia Earn demonstrates how new products can deliver clarity on risk, returns, and eligibility. With Islamic finance assets forecast to reach trillions by 2029, this approach could broaden participation while preserving sharia compliance and investor protection.
What to watch next
- Ramadan campaign impact on awareness and adoption of Sharia Earn.
- Ongoing governance reviews by Sharia scholars and the Amanie Advisors framework.
- Any future product iterations designed to maintain compliance while expanding access.
Disclosure: The content below is a press release provided by the company/PR representative. It is published for informational purposes.
Designing an Inclusive Financial Future: Why Structured, Values-Aligned Innovation Matters in MENAP
As digital assets continue to mature globally, the conversation in the Middle East is shifting. It is no longer just about access to crypto. It is about how that access is structured. In a region where financial systems have long been shaped by strong governance frameworks and clearly defined compliance standards, innovation cannot be disruptive. It must be inclusive by design. That is where structured, Sharia-aligned financial innovation enters the picture, as a framework for clarity, transparency, and broader participation. This approach is especially significant considering that global Islamic finance assets are projected to reach US$9.7 trillion by 2029, growing at an average annual rate of 10%*, highlighting the vast potential for growth within Sharia-compliant financial markets.
Across the region, millions of potential users remain cautious about digital assets, not due to a lack of interest, but because they want greater clarity on how returns are generated, what mechanisms underpin yield products, how risk is structured, and which governance standards apply. “Financial freedom must be built on trust and clarity,” said Tarik Erk, MENAT Lead & Senior Executive Officer, Abu Dhabi at Binance, “In this region, inclusive growth in digital finance requires products that align with structured financial principles and transparent mechanisms. When innovation is built responsibly, participation expands.”
Introducing Sharia Earn: Where Islamic Finance Meets Blockchain Technology
This is where Sharia-aligned frameworks offer something meaningful: defined contractual structures, clear underlying mechanisms, and governance oversight. Binance’s Sharia Earn product was developed within such a structured framework. It is where two financial systems meet: Islamic finance and blockchain technology. Certified by Amanie Advisors, the product ensures that all deployed funds are channeled into ventures and assets that are halal (permissible) under Islamic law. The product launched with major digital assets including BNB, ETH, and SOL. Rather than positioning itself as a niche offering, Sharia Earn reflects a broader shift toward formalized, compliance-driven product design in the region.
Bridging technology and values responsibly
This is also where Binance as a crypto infrastructure becomes relevant. Building financial freedom responsibly requires more than access; it requires trusted rails, clear frameworks, and compliant innovation that users can understand. At its core, Sharia Earn sits at the intersection of blockchain technology through decentralization and programmability; and Islamic finance through a value-based framework. According to product details, Sharia Earn is built using underlying technology from existing Binance Earn products (including locked products and staking mechanics), with the structure reviewed by Sharia scholars and implemented through a purpose-fit Wakala agreement.
Ramadan: A Timely Moment for Responsible Financial Innovation
Ramadan is often described as a month of reflection and intentionality, values that naturally translate into how people think about money: purpose, discipline, and responsibility. As part of its Ramadan campaign period, Binance is also spotlighting Sharia Earn. But the bigger story is not the boost, it’s the direction where ethical and compliant product design becomes a catalyst for broader participation.
Financial freedom, in the context of modern digital finance, doesn’t simply mean “more products.” It means more meaningful choices, built with the safeguards, transparency, and structures that diverse communities require. Sharia-compliant innovation is one of the examples of how that can be achieved in the region by bridging technology and values.
*Source: LSEG Islamic Finance Development Indicator 2025 / ICD Islamic Finance Report.

Editor’s note: Ramadan is a high-stakes period for shoppers in the UAE and GCC, where staple goods can swing on global supply dynamics as well as seasonal demand. This editorial overview examines how easing prices for wheat, sugar, coffee, and cocoa—driven by improved production and steady shipments—could influence household budgets this year. While retailers anticipate busier shopping periods, prices may hold more gently than in recent years if supply conditions stay favorable. The following press release outlines current commodity trends and what they could mean for Ramadan shoppers.
Key points
- Wheat prices down 5% YoY; supply forecasts revised higher; exports and harvests improving.
- Sugar down >10% in month, ~35% YoY; India quotas and Brazil export flows support supply.
- Arabica coffee around $2.80/lb, 27% YoY drop; Brazil harvest expectations improving.
- Cocoa around $3,200/ton, down 69% YoY; West Africa weather improving, ICE stocks at multi-month highs.
Why this matters
As Ramadan approaches, easing input costs and rising supplies may translate into lower retail costs for key Ramadan staples. The trends suggest the season could be cheaper than last year, offering relief to households in the UAE and GCC while producers navigate a more predictable supply landscape.
What to watch next
- Monitor wheat export volumes and forecasts (SovEcon, IKAR, India exports, Argentina crop) from press content.
- Watch sugar price movements, Indian export quotas, and weather conditions affecting production.
- Track Arabica coffee price moves and Brazil harvest developments for 2026/27.
- Observe cocoa inventories and ICE price trends as West Africa and South America conditions evolve.
Disclosure: The content below is a press release provided by the company/PR representative. It is published for informational purposes.
Consumers May See Cheaper Ramadan as Commodity Prices Ease with Stronger Global Supply
Abu Dhabi, United Arab Emirates – February 23, 2026
Ramadan marks one of the busiest periods of the year for retailers across the UAE and the wider GCC. However, there is good news for consumers: several staple ingredients for the holy month, such as wheat, sugar, coffee, and cocoa, are entering the season at relatively soft prices as global supply conditions improve.
While consumer demand typically strengthens ahead of Ramadan, global markets are currently responding more to supply developments than seasonal buying patterns. What that means is that this Ramadan has potential to be cheaper than last year.
The price of wheat, a core staple in Arab households, used in dishes such as harees and khubz, has come under mild downward pressure in recent sessions. Wheat prices are down 5% YoY; a modest dip. Futures are trading near $5.6 per bushel, easing from a three-month high earlier in February when a cold wave raised concerns about crop damage in parts of the U.S. Plains. As weather conditions improved, supply expectations stabilised. Russian production forecasts have been revised higher, with SovEcon estimating 85.9 million tons and IKAR projecting close to 91 million tons for 2026. India has also approved 2.5 million tons of wheat exports following strong harvests, while Argentina is reporting a near-record crop of around 28 million tons. Together, these developments are supporting global supply.
Sugar prices are down more than 10% over the past month and nearly 35% YoY, trading at around 13.46 U.S. cents per pound. Brazil continues to play a key role in global pricing, with strong export flows keeping markets well supplied. Improved weather conditions have further reduced production risks. In India, the world’s second-largest exporter, authorities recently increased the export quota by 500,000 tons to support market stability.
Arabica coffee, or gahwa, a central part of Ramadan gatherings, has eased to around $2.80 per pound, its lowest level since July 2025, and prices are now 27% lower YoY. Prices are under pressure as Brazil, the world’s largest producer, anticipates a strong 2026/27 harvest following improved rainfall. Brazil’s Conab forecasts output at 66.2 million bags, with some private estimates even higher. However, supplies from the current 2025/26 season remain relatively tight, which may limit the discount that consumers will ultimately see in shops
The staple that has seen the greatest price fall is cocoa. Cocoa is now around $3,200 per tonne, its lowest level since June 2023. Prices are down a whopping 69% YoY, representing a significant correction from 2025’s supply-driven spike. As the weather improves in West Africa and yields rise in South America, global supply is increasing. Intercontinental Exchange (ICE) inventories have climbed to multi-month highs, signalling ample availability. For UAE consumers, cocoa’s stability is particularly relevant given the popularity of chocolate-based desserts during Ramadan and the continued buzz around the now-viral “Dubai Chocolate”. The market has shifted from last year’s supply shortages to expectations of more balanced conditions, reducing price pressure for now.

Commenting on the broader trend, Sam North, Market Analyst at eToro, said: global markets are entering 2026 with improving production outlooks and stronger supply visibility. While short-term volatility cannot be ruled out, current fundamentals suggest that markets are well positioned to absorb seasonal Ramadan demand. It is worth noting that food producers typically secure raw materials in advance, meaning current futures prices are not immediately reflected in retail costs. Nevertheless, easing input prices support the prospect of a comparatively less expensive Ramadan this year, should softer trends persist.
Media Contact: PR@etoro.com
About eToro
eToro is the trading and investing platform that empowers you to invest, share and learn. We were founded in 2007 with the vision of a world where everyone can trade and invest in a simple and transparent way. Today we have 40 million registered users from 75 countries. We believe there is power in shared knowledge and that we can become more successful by investing together. So we’ve created a collaborative investment community designed to provide you with the tools you need to grow your knowledge and wealth. On eToro, you can hold a range of traditional and innovative assets and choose how you invest: trade directly, invest in a portfolio, or copy other investors. You can visit our media centre here for our latest news.


The project is reportedly being led by Israeli tech entrepreneur Liran Tancman, who is working as an adviser to the recently established peacekeeping organization.
The so-called “Board of Peace,” created by U.S. President Donald Trump and established during the World Economic Forum last month, is exploring launching a U.S.-dollar-pegged stablecoin in Gaza, FT reported today, Feb. 23.
Led by Israeli tech entrepreneur Liran Tancman, the initiative reportedly aims to alleviate cash shortages in the war-torn region.
“This will not be a ‘Gaza Coin’ or a new Palestinian currency, but a means to allow Gazans to transact digitally,” a person familiar with the project told the FT.
The project is in preliminary stages, but sources told the FT that it is expected to be tied to the U.S. dollar. How the asset would be introduced in the region remains unclear.
The initiative involves collaboration with the 14-member National Committee for the Administration of Gaza (NCAG) and the Office of the High Representative, led by Nickolay Mladenov, which are both working with the Board of Peace. The Board and NCAG are tasked with deciding the regulatory framework and access to the stablecoin, per the report.
Tancman, serving as an unpaid adviser to the Board of Peace, recently spoke at a meeting of the organization in Washington, stating more broadly that NCAG was working on building “a secure digital backbone, an open platform enabling e-payments, financial services, e-learning, and healthcare with user control over data.”
As Reuters recently reported, Israel’s military has officially accepted death toll reports from Gaza health officials that estimate around 70,000 Palestinians, most of whom were women and children, have been killed in Israeli attacks since October 2023.
This article was generated with the assistance of AI workflows.
‘Illegal lorry park’ sparks concerns about pollution as investigation underway

(VIDEO) Yoko Taro Tapped to Write New ‘Neon Genesis Evangelion’ Anime Series for 30th Anniversary Celebration

Bitcoin, Altcoins Fall Toward New Lows As Stocks Digest New Trump Tariffs


-

 Crypto World6 days ago
Can XRP Price Successfully Register a 33% Breakout Past $2?
-

 Video4 days ago
XRP News: XRP Just Entered a New Phase (Almost Nobody Noticed)
-

 Fashion3 days ago
Weekend Open Thread: Boden – Corporette.com
-

 Sports7 days ago
GB's semi-final hopes hang by thread after loss to Switzerland
-

 Politics2 days ago
Baftas 2026: Awards Nominations, Presenters And Performers
-
 Tech7 days ago
The Music Industry Enters Its Less-Is-More Era
-

 Business6 days ago
Infosys Limited (INFY) Discusses Tech Transitions and the Unique Aspects of the AI Era Transcript
-

 Entertainment5 days ago
Kunal Nayyar’s Secret Acts Of Kindness Sparks Online Discussion
-

 Video6 days ago
Financial Statement Analysis | Complete Chapter Revision in 10 Minutes | Class 12 Board exam 2026
-

 Politics2 hours ago
Nick Reiner Enters Plea In Deaths Of Parents Rob And Michele
-

 Tech5 days ago
Retro Rover: LT6502 Laptop Packs 8-Bit Power On The Go
-
 Sports5 days ago
Clearing the boundary, crossing into history: J&K end 67-year wait, enter maiden Ranji Trophy final | Cricket News
-

 Business1 day ago
Mattel’s American Girl brand turns 40, dolls enter a new era
-

 Business1 day ago
Law enforcement kills armed man seeking to enter Trump’s Mar-a-Lago resort, officials say
-

 Entertainment5 days ago
Dolores Catania Blasts Rob Rausch For Turning On ‘Housewives’ On ‘Traitors’
-

 Business6 days ago
Tesla avoids California suspension after ending ‘autopilot’ marketing
-
 NewsBeat10 hours ago
‘Hourly’ method from gastroenterologist ‘helps reduce air travel bloating’
-

 Politics6 days ago
Eurovision Announces UK Act For 2026 Song Contest
-

 Tech1 day ago
Anthropic-Backed Group Enters NY-12 AI PAC Fight
-

 NewsBeat1 day ago
Armed man killed after entering secure perimeter of Mar-a-Lago, Secret Service says