

Crypto World
Solana Company starts building high-speed infrastructure to prepare SOL for next ‘super cycle’
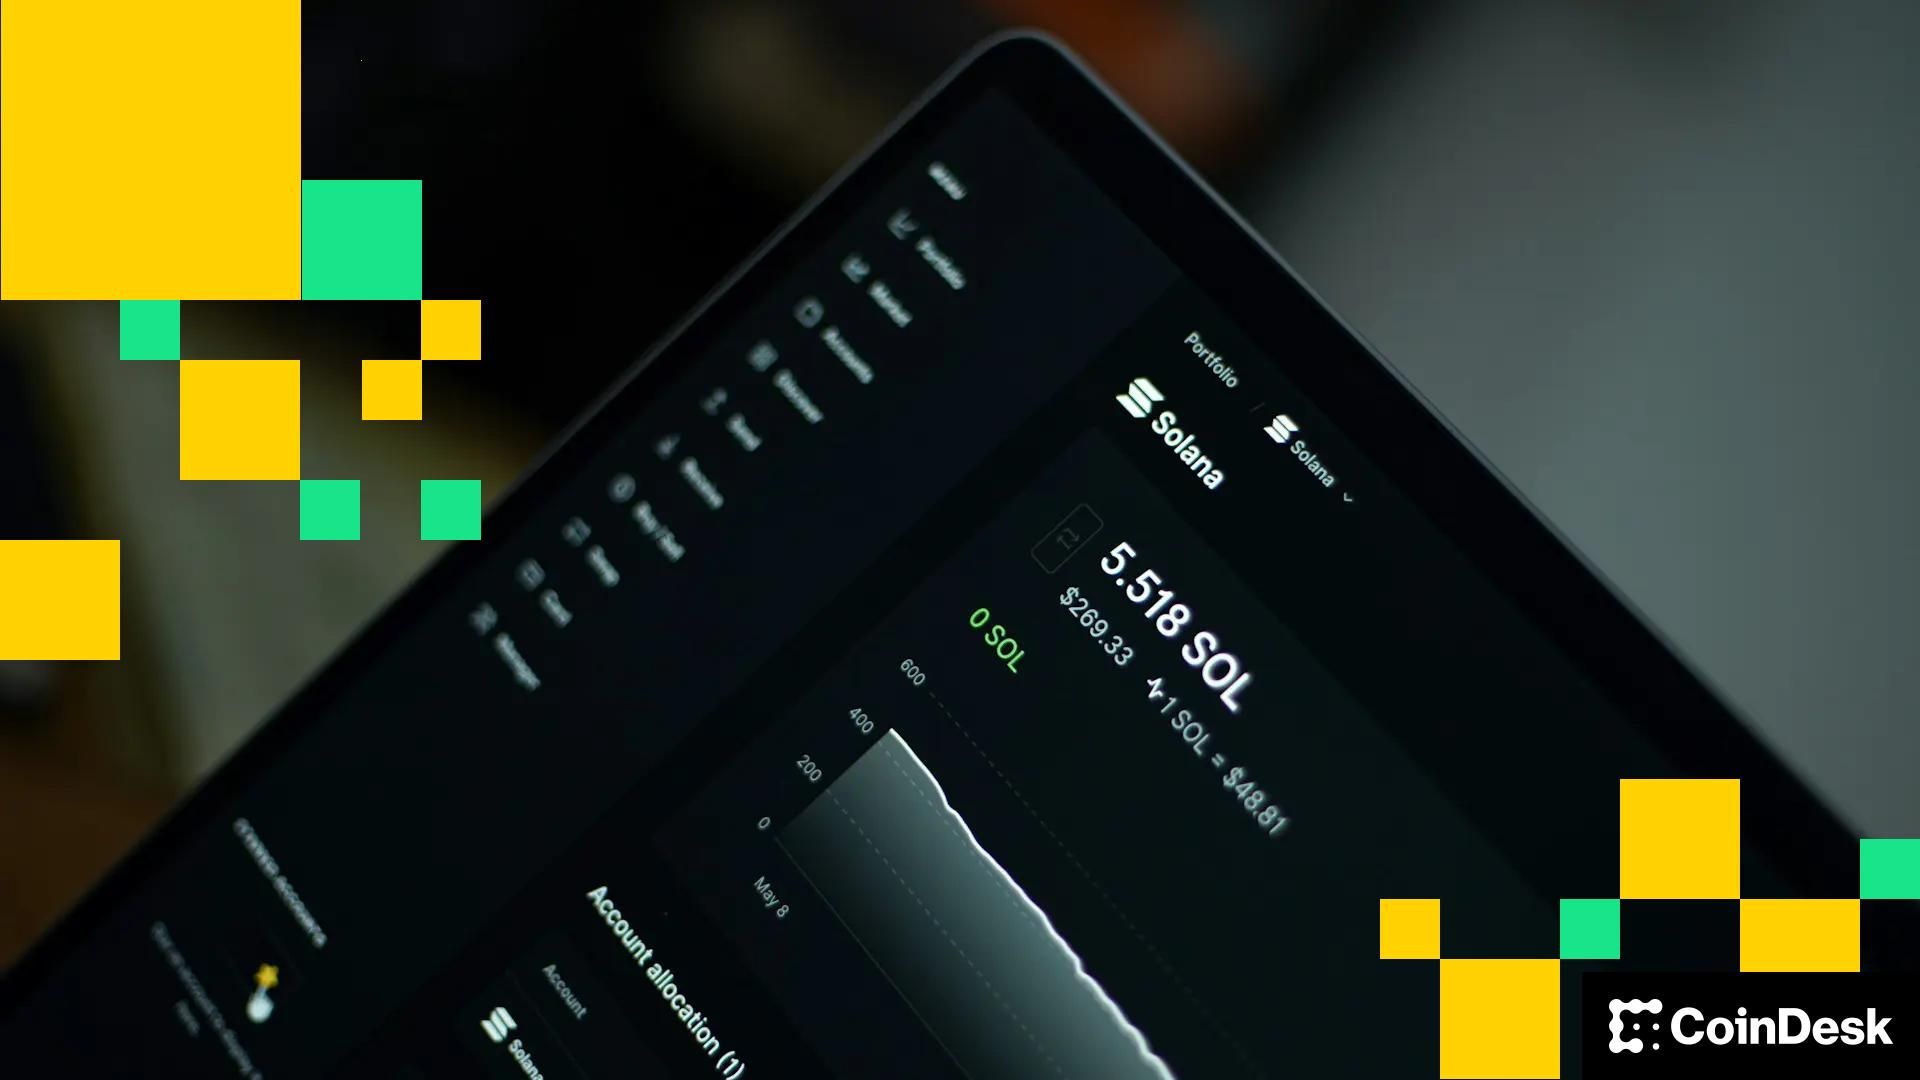

Solana Company (HSDT) said it plans to build a high-speed infrastructure network across the Asia-Pacific region to support the growth of the Solana blockchain and diversify its revenue streams.
The initiative, called the “Pacific Backbone,” will connect Seoul, Tokyo, Singapore and Hong Kong with a low-latency cluster designed to support staking, validation and trading services on Solana.
The move targets institutional demand across the region, which has become a hotspot for crypto adoption, cross-border payments and digital asset development.
The buildout aims to make Solana’s infrastructure more accessible and reliable for market makers, high-frequency traders, and financial institutions, according to a press release.
The company said the project will begin immediately, with performance optimization and additional product launches expected in the next 12 to 18 months. These include DeFi tools, liquid staking, automated market makers and execution services tailored to traditional finance firms entering the space.
Joseph Chee, CEO of Solana Company, said the expansion will help prepare for what he called Solana’s “next super cycle.”
The goal is to reduce reliance on external service providers, reduce latency, and provide a compliant infrastructure that meets institutional requirements in regulated markets.
Solana, the firm said, processes over 3,500 transactions per second and supports millions of daily active wallets. Solana Company is currently the second-largest Solana treasury firm, with 2.3 million SOL, or over $180 million, in its treasury.
Solana Company’s shares are down 13.3% in today’s trading session to $1.76, amid a wider cryptocurrency market drawdown. Solana itself is down nearly 6% in the last 24-hour period, while BTC is down more than 4%.
CoinDesk has reached out to Solana Company for comment but hasn’t heard back at the time of writing.


The seemingly daily disruption of business models by advances in artificial intelligence continued Monday, sending stock market averages and crypto prices sharply lower.
Today’s victim (in addition to the usual ones) was IBM, after Anthropic said Claude code can automate COBOL modernization.
“COBOL [Common Business-Oriented Language] is everywhere,” said Anthropic. “It handles an estimated 95% of ATM transactions in the U.S.. Hundreds of billions of lines of COBOL run in production every day, powering critical systems in finance, airlines, and government.”
“The developers who built these systems retired years ago, and the institutional knowledge they carried left with them,” the company continued. “We aren’t exactly minting replacements—COBOL is taught at only a handful of universities, and finding engineers who can read it gets harder every quarter.”
“Modernizing a COBOL system once required armies of consultants spending years mapping workflows,” Anthropic continued. “Tools like Claude Code can automate the exploration and analysis phases that consume most of the effort in COBOL modernization.”
Think of “armies of consultants” as IBM, and the stock’s reaction is understandable. A bit less than an hour before the close, IBM was lower by 11.2%.
IBM’s decline, along with what’s now becoming regular AI-related tumbles in the overall software sector and private equity, has helped pull the Dow, S&P 500 and Nasdaq all lower by more than 1%.
“It’s becoming increasingly clear how pivotal the times we are in right now truly are,” wrote The Kobeissi Letter.
Tied at the hip in recent months to moves in software, crypto prices were under extreme pressure Monday, with many majors now within range of retouching their lows from the Feb. 5 panic.
Bitcoin was lower by 5% over the past 24 hours to $64,000, with ether (ETH) and solana (SOL) down similarly.
Coinbase (COIN), Strategy (MSTR), Circle (CRCL) and Galaxy Digital (GLXY) were all down 4%-7%.
The only names in the green were those bitcoin miners now running AI infrastructure business models, with IREN (IREN) ahead 5%, Cipher Mining (CIFR) up 3.4%, CleanSpark (CLSK) up 1.5%, and Hut 8 (HUT) gaining 0.7%.
Also moving higher on Monday were precious metals — gold gaining 3.2% to $5,243 per ounce and silver higher by 6.5% to $87.69.
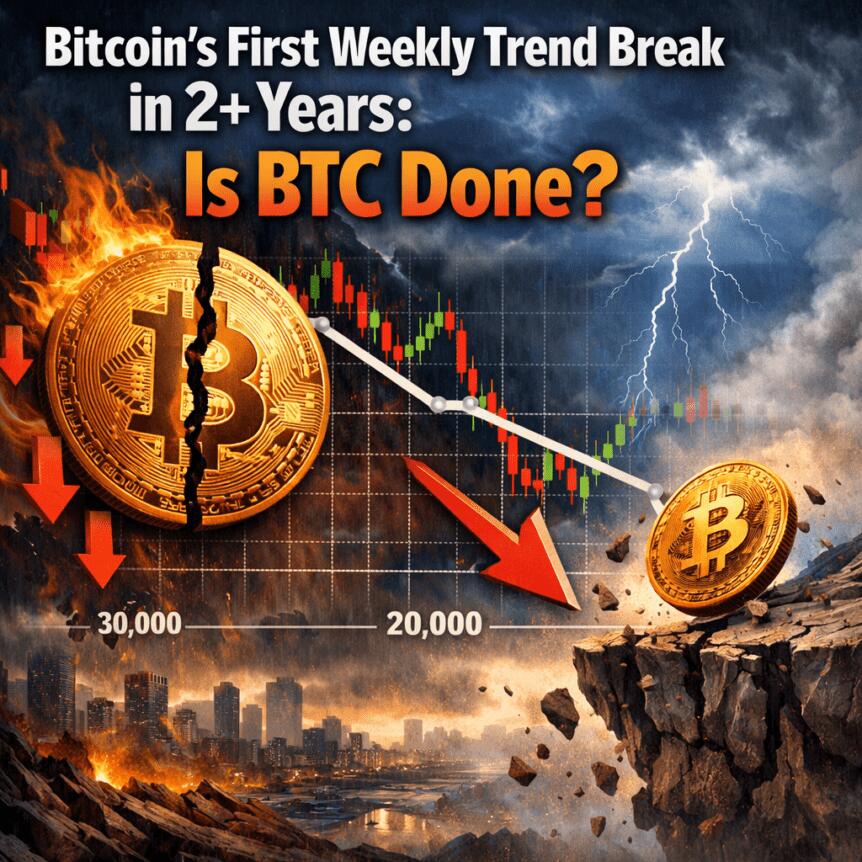
Bitcoin (CRYPTO: BTC) closed a weekly candle below its 200-week exponential moving average for the first time since October 2023, ending an 882-day uptrend. The break redraws the deck for long-term traders, shifting attention to on-chain cost bases and how Bitcoin has historically interacted with this guardrail during prior cycles. The move underscores the risk of a longer, more drawn-out recovery, even as market focus rests on the asset’s price behavior around key macro and on-chain metrics.
Key takeaways
- Bitcoin closed below the 200-week EMA near $67,628, snapping an extensive uptrend that had persisted since late 2023 and signaling a potential shift in the long-run trend line.
- Historical recoveries back above the 200-week EMA varied in duration: roughly 14 weeks in 2018, about eight weeks after the Covid liquidity shock in March 2020, and nearly 30 weeks in 2022; the average spell below the EMA has hovered around 17–18 weeks.
- On-chain momentum has cooled. Liveliness, the metric that compares coin days destroyed to coin days created, has declined below its 30-day and 90-day moving averages, suggesting reduced spending activity and slowed capital rotation.
- The realized price band around $55,000 remains a central reference, with the shifted realization near $42,000 projecting the metric forward and highlighting deeper demand zones during drawdowns.
- A reclaim of the 200-week EMA would reestablish the long-term trend above a critical threshold; failure to reclaim keeps the focus on the $55,000 realized price and the lower band near $42,000 as potential liquidity zones.
Tickers mentioned: $BTC
Market context: The move comes amid a broader environment where on-chain indicators and macro liquidity shape risk sentiment. Traders are watching whether Bitcoin can stabilize near long-term anchors while macro noise—ranging from regulatory signals to liquidity cycles—adds a layer of caution to the next leg of any potential rally.
Why it matters
The weekly break below the 200-week EMA is not a call to panic; rather, it reframes the path of the next recovery. The 200-week EMA has functioned as a long-run dividing line between expansion and deeper correction. When price has dipped beneath it in past cycles, the duration before reclaiming the line varied, but the pattern often culminated in a prolonged accumulation phase rather than an immediate, V-shaped bounce. The current scenario awaits a similar test of resilience, with market participants evaluating whether history will repeat or diverge in a markedly different macro environment.
On-chain activity adds another layer to the interpretation. Liveliness, which measures the balance of coin days created versus destroyed after adjusting for internal transfers, has cooled from its earlier peak. A decline here points to a slowdown in active spending and a shift in capital rotation—factors that can slow the speed at which Bitcoin reclaims macro-level supports. The reading echoes past cycles where similar rollovers preceded extended periods of accumulation, a signal that investors may need to weather a more drawn-out corrective phase before new highs emerge.
Meanwhile, the realized price bands—around $55,000—and the shifted realized price near $42,000 provide a framework for identifying demand zones. These levels have historically delineated the major caches of value during drawdowns and have served as anchors for long-term investors seeking to accumulate on-chain cost bases. The convergence of price with these bands, especially while hovering between the 200-week EMA and the realized price cluster, has during prior cycles signaled a protracted period of consolidation before a renewed uptrend.
There is a broader ecosystem thread to track as well. A referenced analysis suggests that if Bitcoin can reclaim the 200-week EMA, the path toward reestablishing a long-term uptrend remains intact, with the threshold serving as a barometer for macro confidence. Conversely, failing to recapture the EMA keeps the focus on the $55k realized price and the lower $42k band, where liquidity concentration could come into play and influence the next move. The dynamic between these levels will likely shape market expectations for the next several months.
In the narrative of market storytelling, observers may recall related discussions around Bitcoin’s troughs and rallies. For instance, a separate analysis explored signals from Tether that some see as potential hints of a bottom or a prelude to a larger rally. While not deterministic, such signals contribute to the mosaic of factors traders weigh when assessing the durability of any price move and the potential for renewed demand as the market digests both on-chain and macro inputs.
What to watch next
- Watch for a weekly close back above the 200-week EMA (around $67,600) to signal a potential reversion of this test and the resilience of long-term support.
- Monitor shifts in on-chain liveliness: a sustained move above the key moving averages could indicate renewed activity and capital rotation supporting a longer-term revival.
- Track the realized price zone around $55,000 and the lower band near $42,000 for any congestion or liquidity concentration that could influence the next leg of the cycle.
- Observe potential catalysts—whether macro liquidity conditions soften, or on-chain fundamentals return to a more active phase—that could accelerate re-entry into the longer-term uptrend.
- Keep an eye on related market signals and sentiment indicators, including the behavior of other assets and ETF-related flows that may impact Bitcoin’s risk appetite in coming months.
Sources & verification
- Bitcoin price behavior around the 200-week EMA and corresponding price levels cited in the summary analysis.
- On-chain liveliness metrics and their interpretation in relation to price cycles, as discussed by market observers.
- Public posts and analyses referencing the 200-week EMA as a guide to long-term trend dynamics, including remarks by market commentators on potential resistance if the EMA loses its role as support.
- Realized price data and related interpretations of demand zones and liquidity bands used to frame the current accumulation context.
- Related discussions exploring signals such as those around Tether and Bitcoin bottom signals, which provide context for broader market narrative dynamics.
Bitcoin’s long-term trend in focus
Bitcoin’s recent weekly close beneath the 200-week EMA has nudged the market into a phase where long-horizon considerations gain prominence. The line, which traders monitor as an indicator of secular momentum, has historically separated periods of expansion from deeper contractions. The current reading does not automatically imply a new bear market; instead, it emphasizes the need for patience as the market tests whether prevailing on-chain and macro conditions can sustain a move back above the trend line.
From a broader perspective, the real guiding question is the durability of demand zones around the realized price bands. If that demand proves resilient and buying interest returns with conviction, a re-acceleration could unfold, with the 200-week EMA reclaim acting as a catalyst. If not, investors may expect a more protracted period of consolidation, during which accumulation phases could stretch across multiple quarters as market players calibrate entries and risk exposure in light of evolving liquidity conditions.
The central takeaway remains: the interaction between price, on-chain activity, and long-term trend markers will continue to shape Bitcoin’s trajectory. While a single weekly candle below a key moving average does not doom the market, it does reset the frame for what comes next, demanding disciplined risk assessment and a keen eye on the dynamics of demand, liquidity, and macro sentiment that drive the space.
Crypto World
IoTeX bridge exploit raises debate over losses and recovery prospects as CEO offers 10% bounty


IoTeX offered a 10% white-hat bounty to the hacker or hackers who exploited a private key on its cross-chain bridge ioTube, siphoning millions of dollars, in exchange for the voluntary return of funds within 48 hours.
With this move, IoTeX is offering the $440,000 if the malicious actor or actors return roughly $4.4 million they stole, according to an IoTeX X post, to which IoTeX co-founder and CEO Raullen Chai pointed “as a source of truth” on Monday.
Chai told CoinDesk that the team sent an onchain message offering not to pursue legal action or share identifying information with law enforcement if the remaining funds are returned.
“This is regarding the ioTube bridge exploit on Feb. 21, 2026,” Chai said in the message. “All fund movements across Ethereum, IoTeX, and bitcoin have been fully traced.”
The message states that exchange deposits have been flagged and frozen and offers a 10% bounty for the return of remaining funds.
Chai also said IoTeX is rolling out a new chain version, Mainnet v2.3.4, requiring node operators to upgrade. The update includes a default blacklist of malicious externally owned account (EOA) addresses.
“This blacklist contains a list of malicious or problematic EOA addresses that will be filtered by the node,” Chai said.
The offer comes after a Feb. 21 exploit in which a compromised validator owner private key enabled unauthorized control over ioTube’s bridge contracts.
IoTeX said the incident is “under control,” saying that its Layer 1 blockchain was not affected and that the breach was isolated to the Ethereum-side infrastructure of the bridge.
The IOTX token fell roughly 22% following the exploit, dropping from $0.0054 to below $0.0042 before partially rebounding.
Cross-chain bridges have been one of crypto’s main failure points, with several high-profile exploits in recent years. According to industry reports, more than $3.2 billion has been lost due to cross-chain bridge hacks, making them a prime target for advanced threat actors.
Responsibility and key control
IoTeX framed the exploit as an operational issue specific to the bridge rather than a failure of its Layer 1 network.
“IoTube is IoTeX’s own cross-chain bridge built and maintained by their team,” Nick Motz, CEO of ORQO Group and CIO of Soil, told CoinDesk. “The breach came down to a compromised validator owner private key on the Ethereum side, which is fundamentally an operational security failure, not a smart contract vulnerability discovered by an outside actor.”
Motz agreed that IoTeX’s Layer 1 was not compromised but said user funds were entrusted specifically to the bridge.
“When you build and operate the bridge infrastructure and the key management is what fails, it’s difficult to separate yourself from that outcome,” he said.
Nanak Nihal Khalsa, co-founder of human.tech, said responsibility in crypto often comes down to key custody.
“Yes, whoever holds the private key is responsible for securing it,” Khalsa said. “Is that a reasonable responsibility? It’s hard to say. But that’s how the industry works right now.”
He added that liability norms remain unsettled compared to traditional finance and called for stronger wallet and multisig setups to reduce similar risks.
The estimates diverge
On-chain analysis by security firm PeckShield estimated more than $8 million worth of assets were affected, saying the attacker swapped funds into ether (ETH) and began bridging them to bitcoin via THORChain.
“The hacker has swapped the stolen funds to $ETH and has started bridging them to #BTC via #Thorchain,” the firm wrote.
Another onchain investigator, Specter, said on X that “the private key of @iotex_io may have been compromised,” resulting in an estimated $4.3 million loss.
“Once assets are routed through THORChain […] recovery becomes extremely difficult,” Motz said.
IoTeX said it has identified four bitcoin addresses holding 66.78 BTC worth roughly $4.3 million at current prices and that the addresses are being monitored in cooperation with exchanges.
A CoinDesk review of those addresses on Feb. 23 confirmed they held roughly 66.6 BTC.
IoTeX did not immediately respond to CoinDesk’s request for comment.
“Containment is not the same as recovery,” he added. “The assets with actual market value were swapped and bridged. Those are, in my assessment, unlikely to be recovered.”
Khalsa similarly cautioned that recovery prospects are uncertain. “It’s hard to predict how much, if any, can be recovered,” he said.
IoTeX revised its figure upward to approximately $4.3 million, reflecting the direct asset drain but excluding minted tokens. Motz said broader estimates may better capture the severity of the breach.
“Private key compromise rather than smart contract bugs is emerging as a dominant attack vector,” Motz said, noting that such incidents target operational security rather than audited code.
Before offering the 10% bounty, IoTeX said a compensation plan would be in place within the next 48 hours.
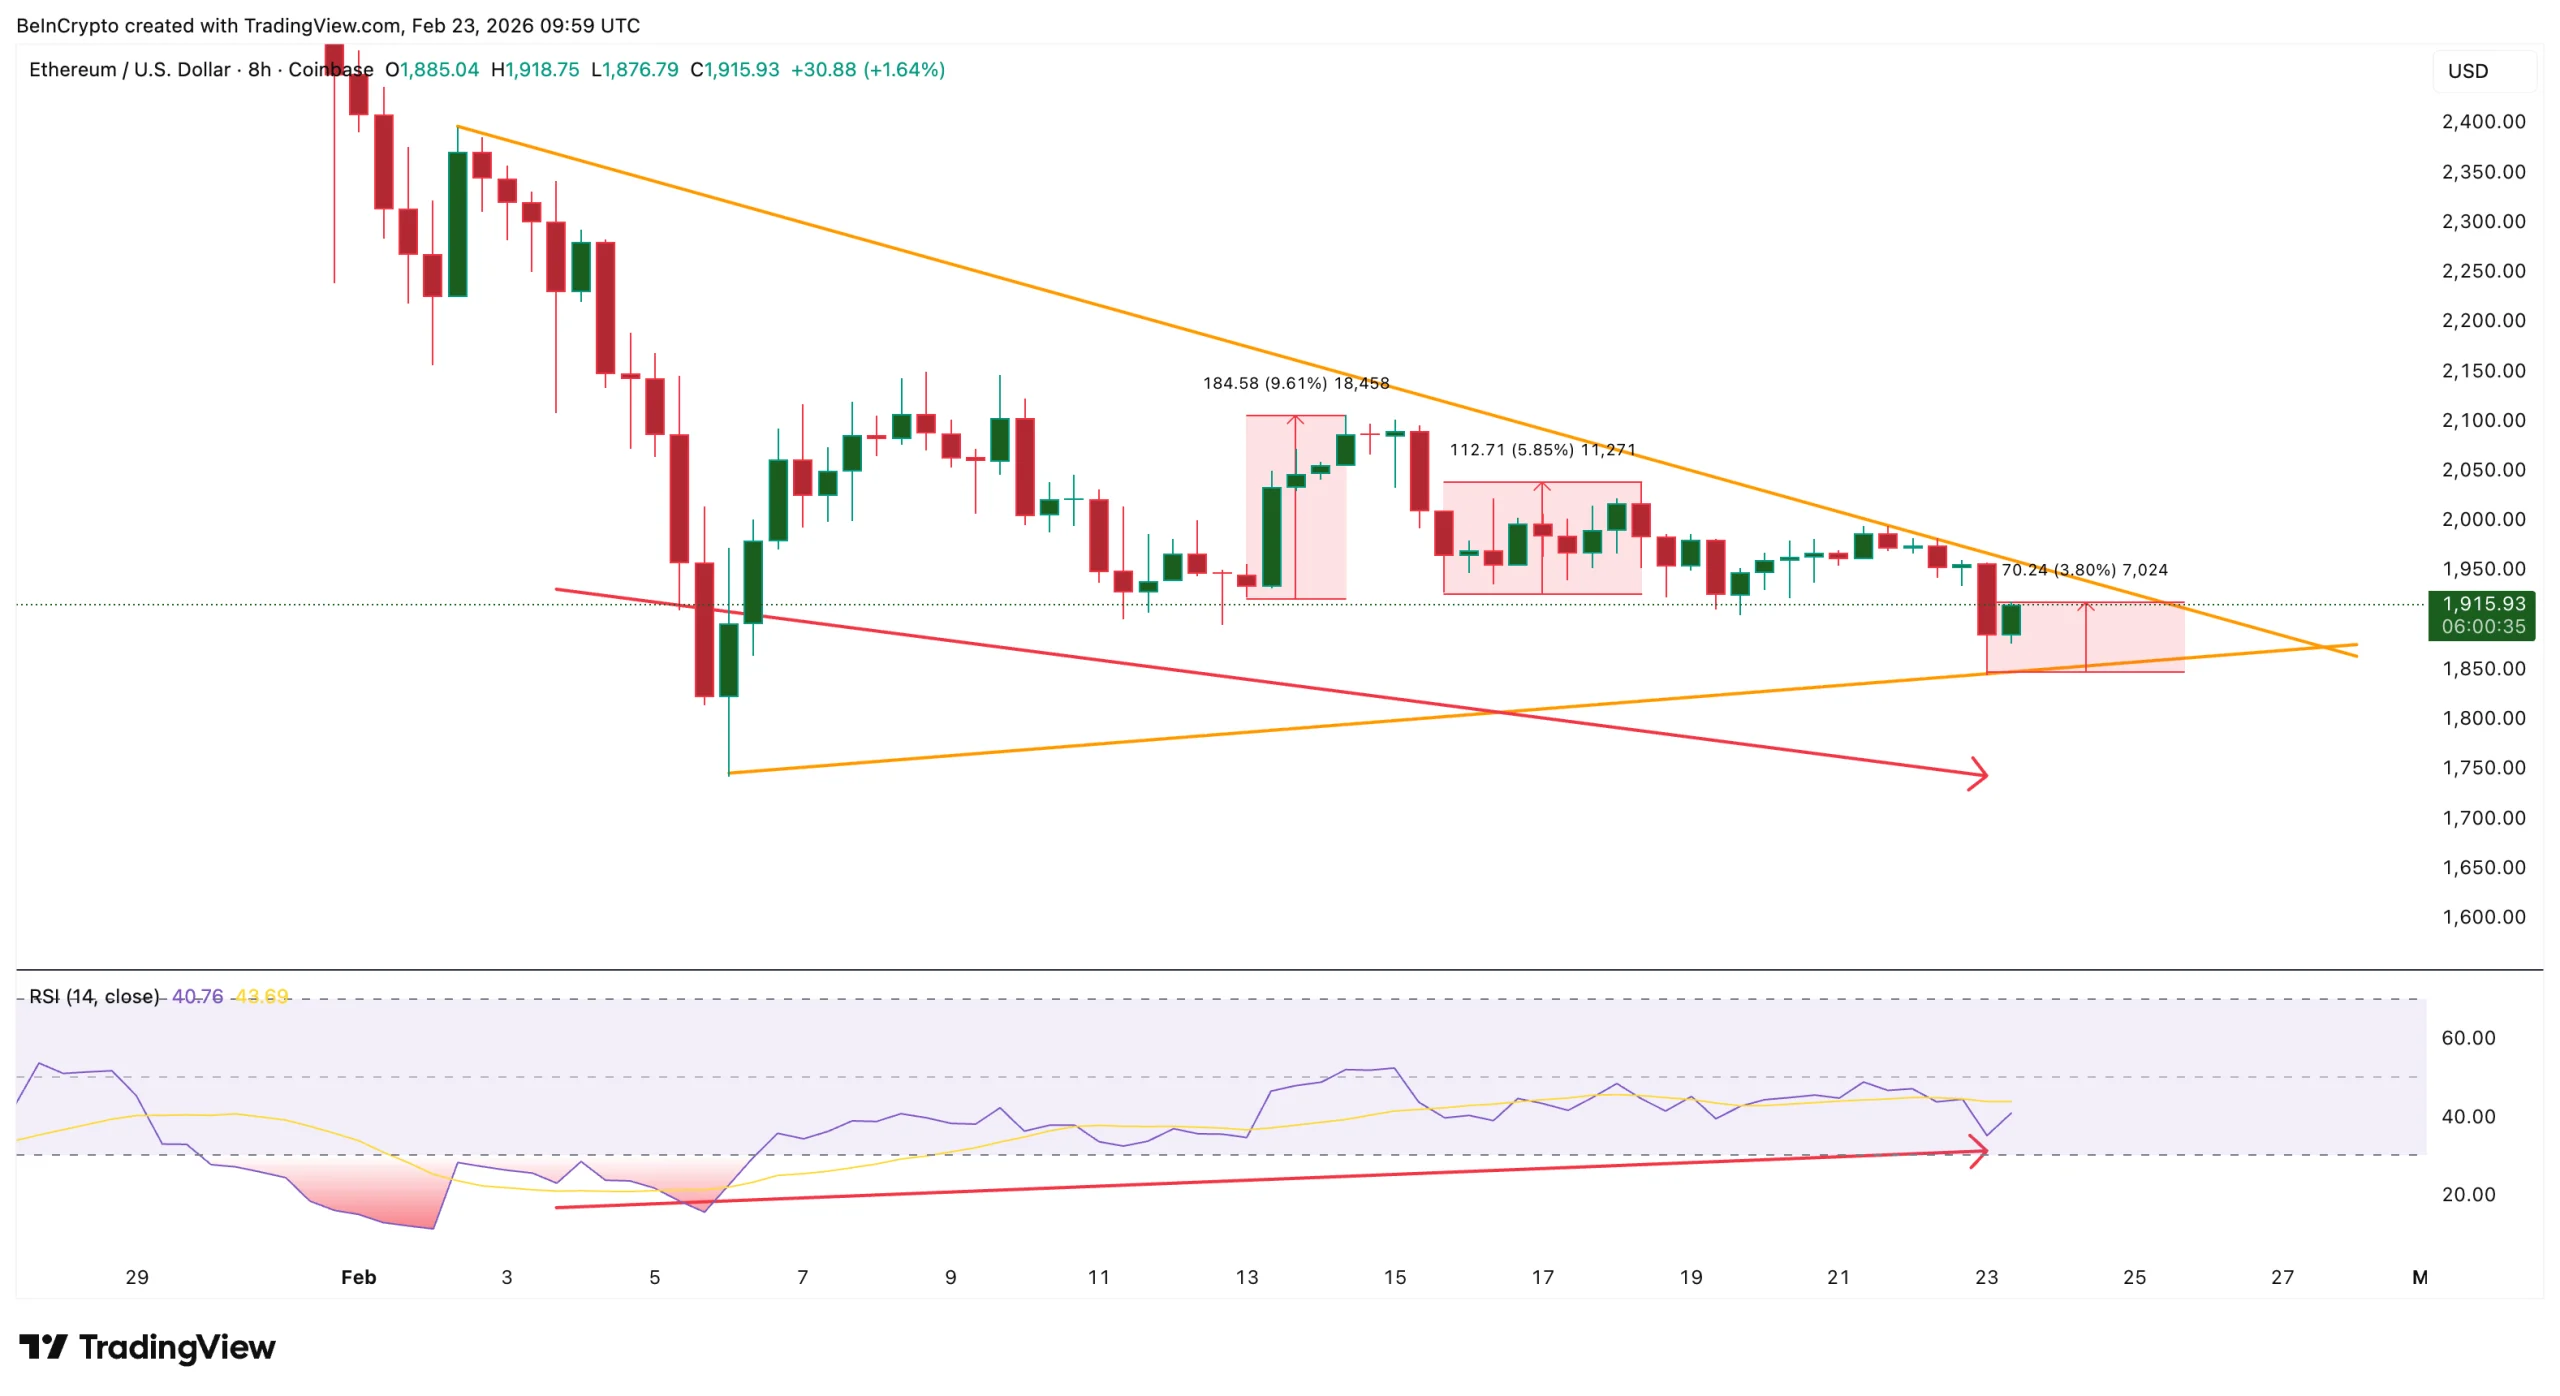
Ethereum is already showing early signs of recovery. Since a recent low near $1,840, Ethereum has climbed nearly 4%, signaling that buyers are beginning to step back in. This rebound is not happening randomly. The bounce setup has been quietly building for weeks.
Several underlying signals now point to a shift. Selling pressure has collapsed sharply. Derivatives traders have turned aggressively bearish without adding new positions. At the same time, long-term holders have started buying again after weeks of selling. Together, these forces suggest the current Ethereum bounce could extend further.
Ethereum Bounce Setup Emerges As Bullish Divergence Builds
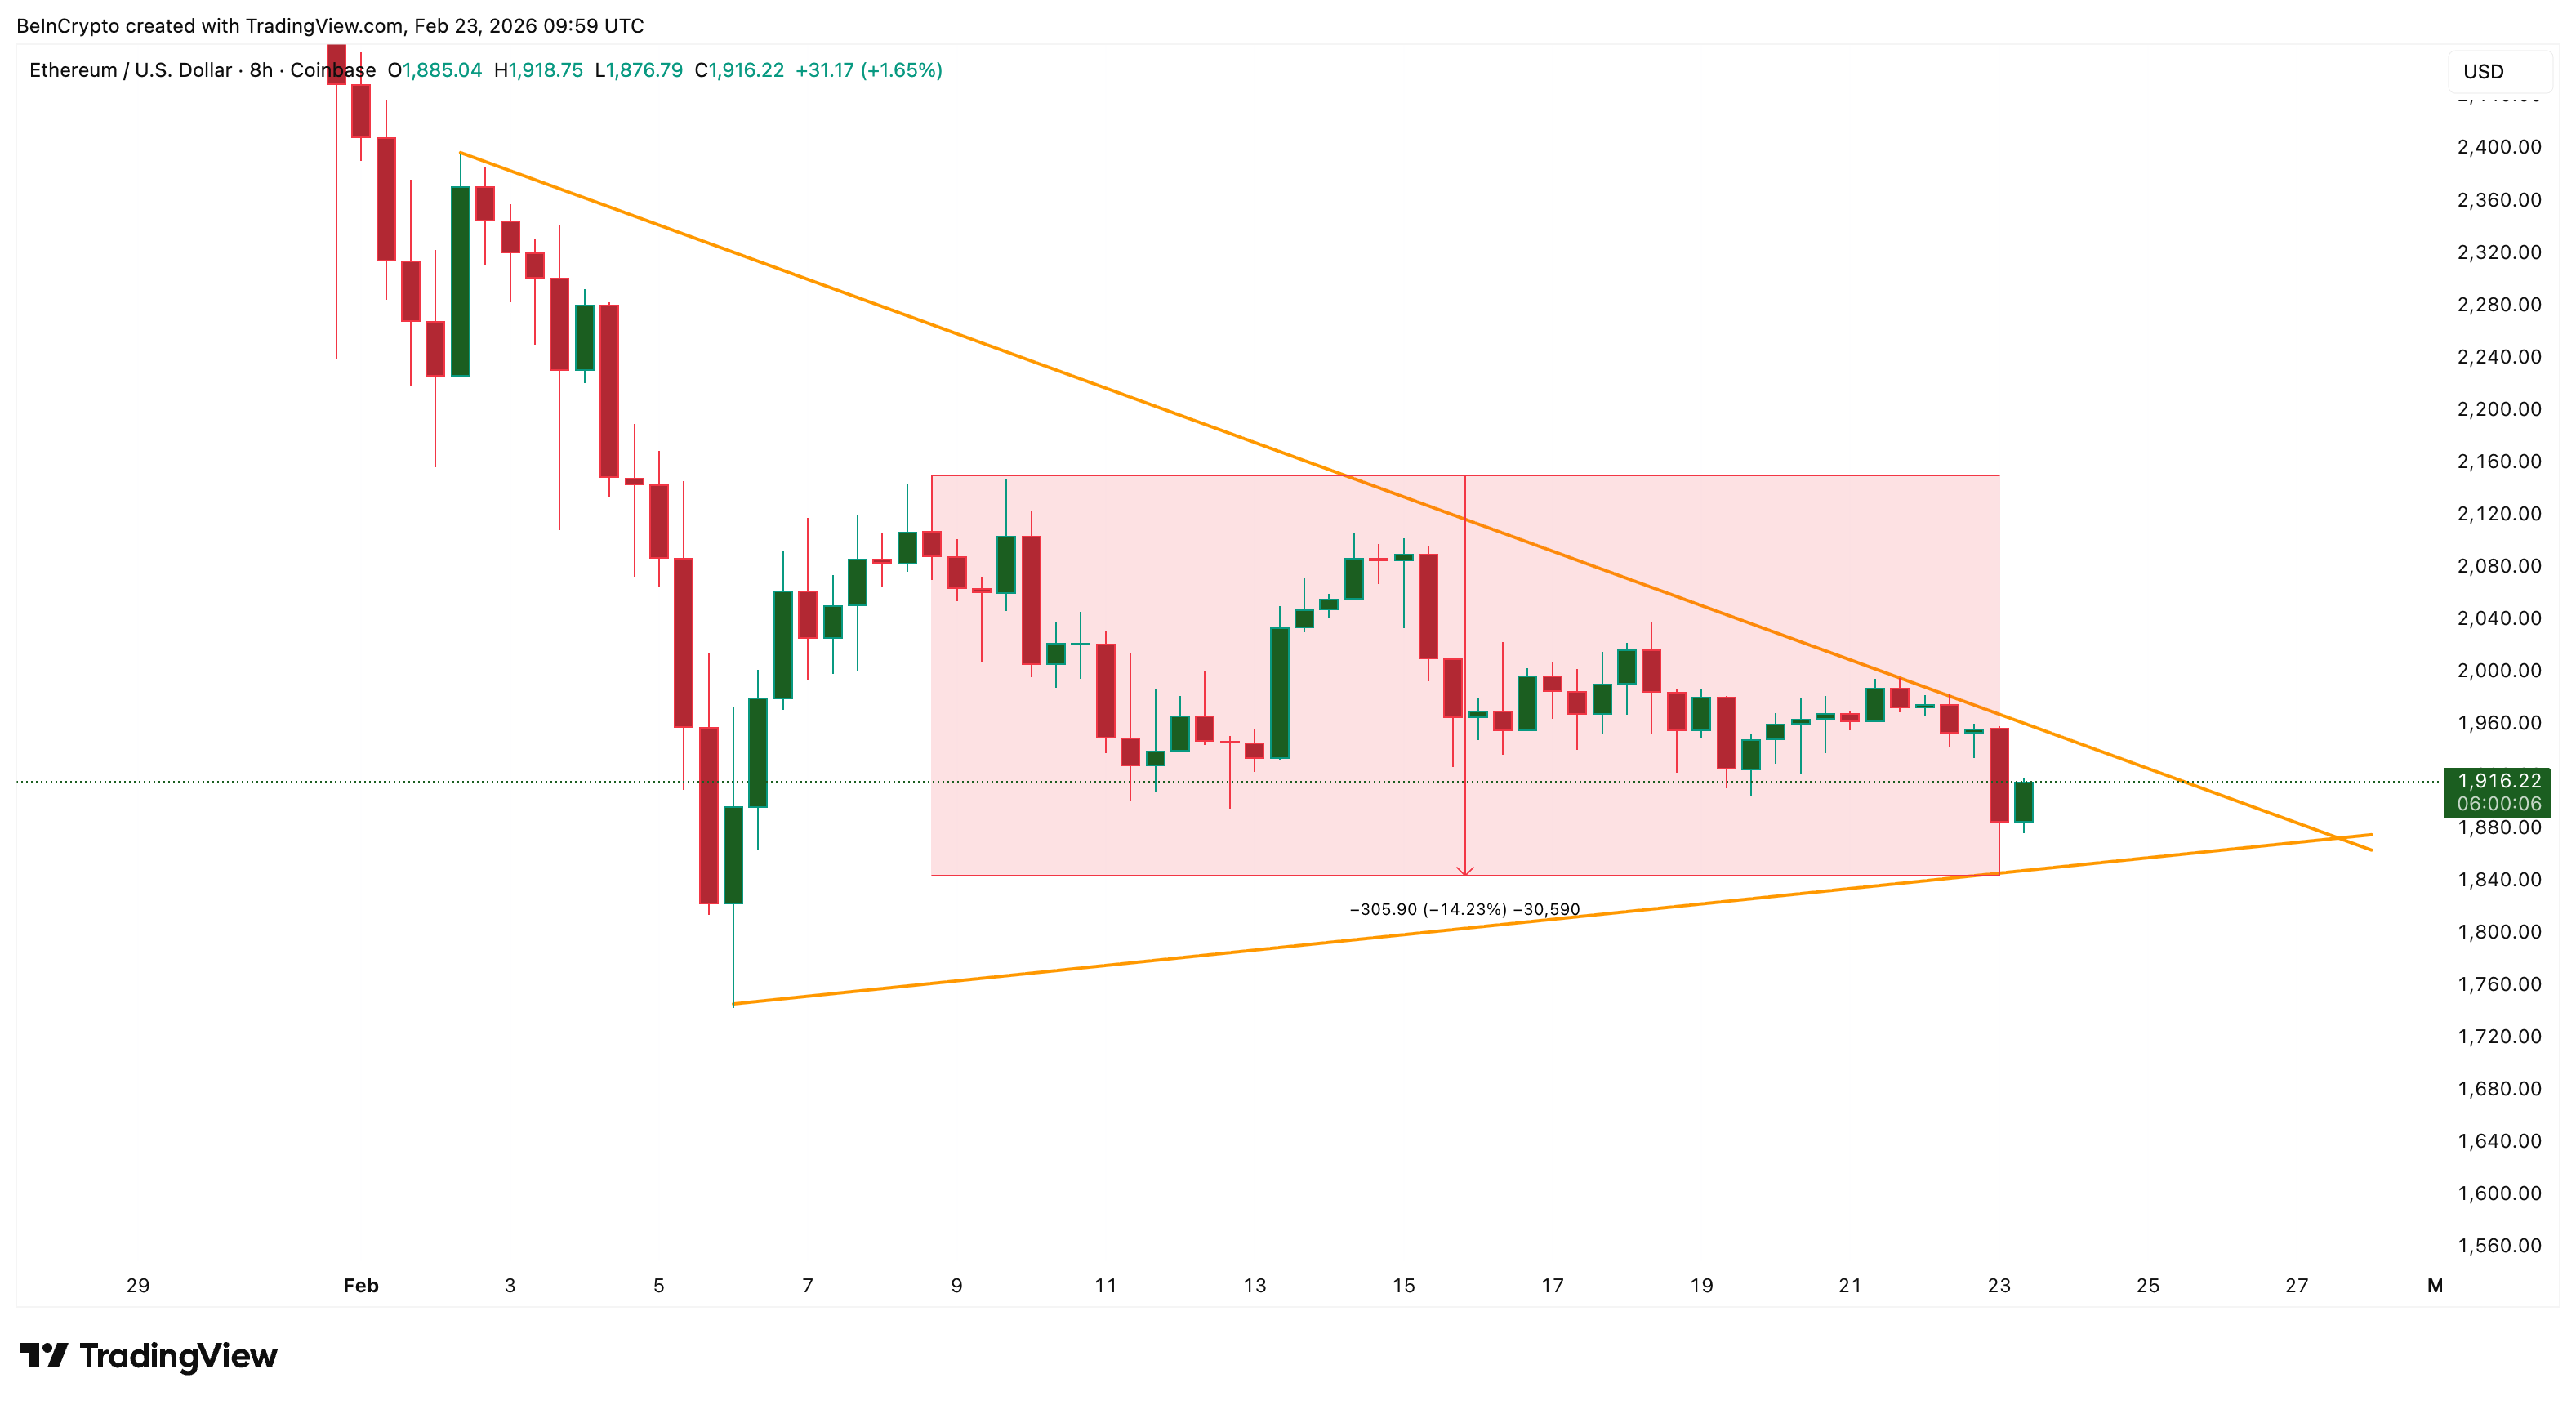
Ethereum’s short-term chart shows a symmetrical triangle. This pattern reflects indecision, where buyers and sellers are fighting for control.
At the same time, a bullish divergence has appeared between price and the Relative Strength Index (RSI). The RSI is a momentum indicator that measures whether selling pressure is strengthening or weakening. Between early February and today (February 23), Ethereum’s price has made lower lows, but the RSI has made higher lows. This pattern often signals that selling pressure is fading.

Want more token insights like this? Sign up for Editor Harsh Notariya’s Daily Crypto Newsletter here.
This same signal worked recently. Between February 3 and February 13, a similar divergence triggered a nearly 10% rebound. Another divergence between February 3 and February 15 led to a 6% move higher.
Ethereum has already started responding again. The recent 4% rebound shows buyers reacting to weakening downside momentum. But technical signals alone are not enough. The bigger question is what changed underneath the surface.
Selling Pressure Collapses 90% Even As Price Fell, Reveals Another Catalyst
The most important shift comes from exchange inflows. Exchange inflow measures the number of coins moving into exchanges. When coins move into exchanges, it usually signals intent to sell.
On February 7, Ethereum exchange inflows peaked near 1.06 million ETH. Since then, inflows have collapsed to just 126,000 ETH. This represents an almost 90% drop in potential selling pressure.
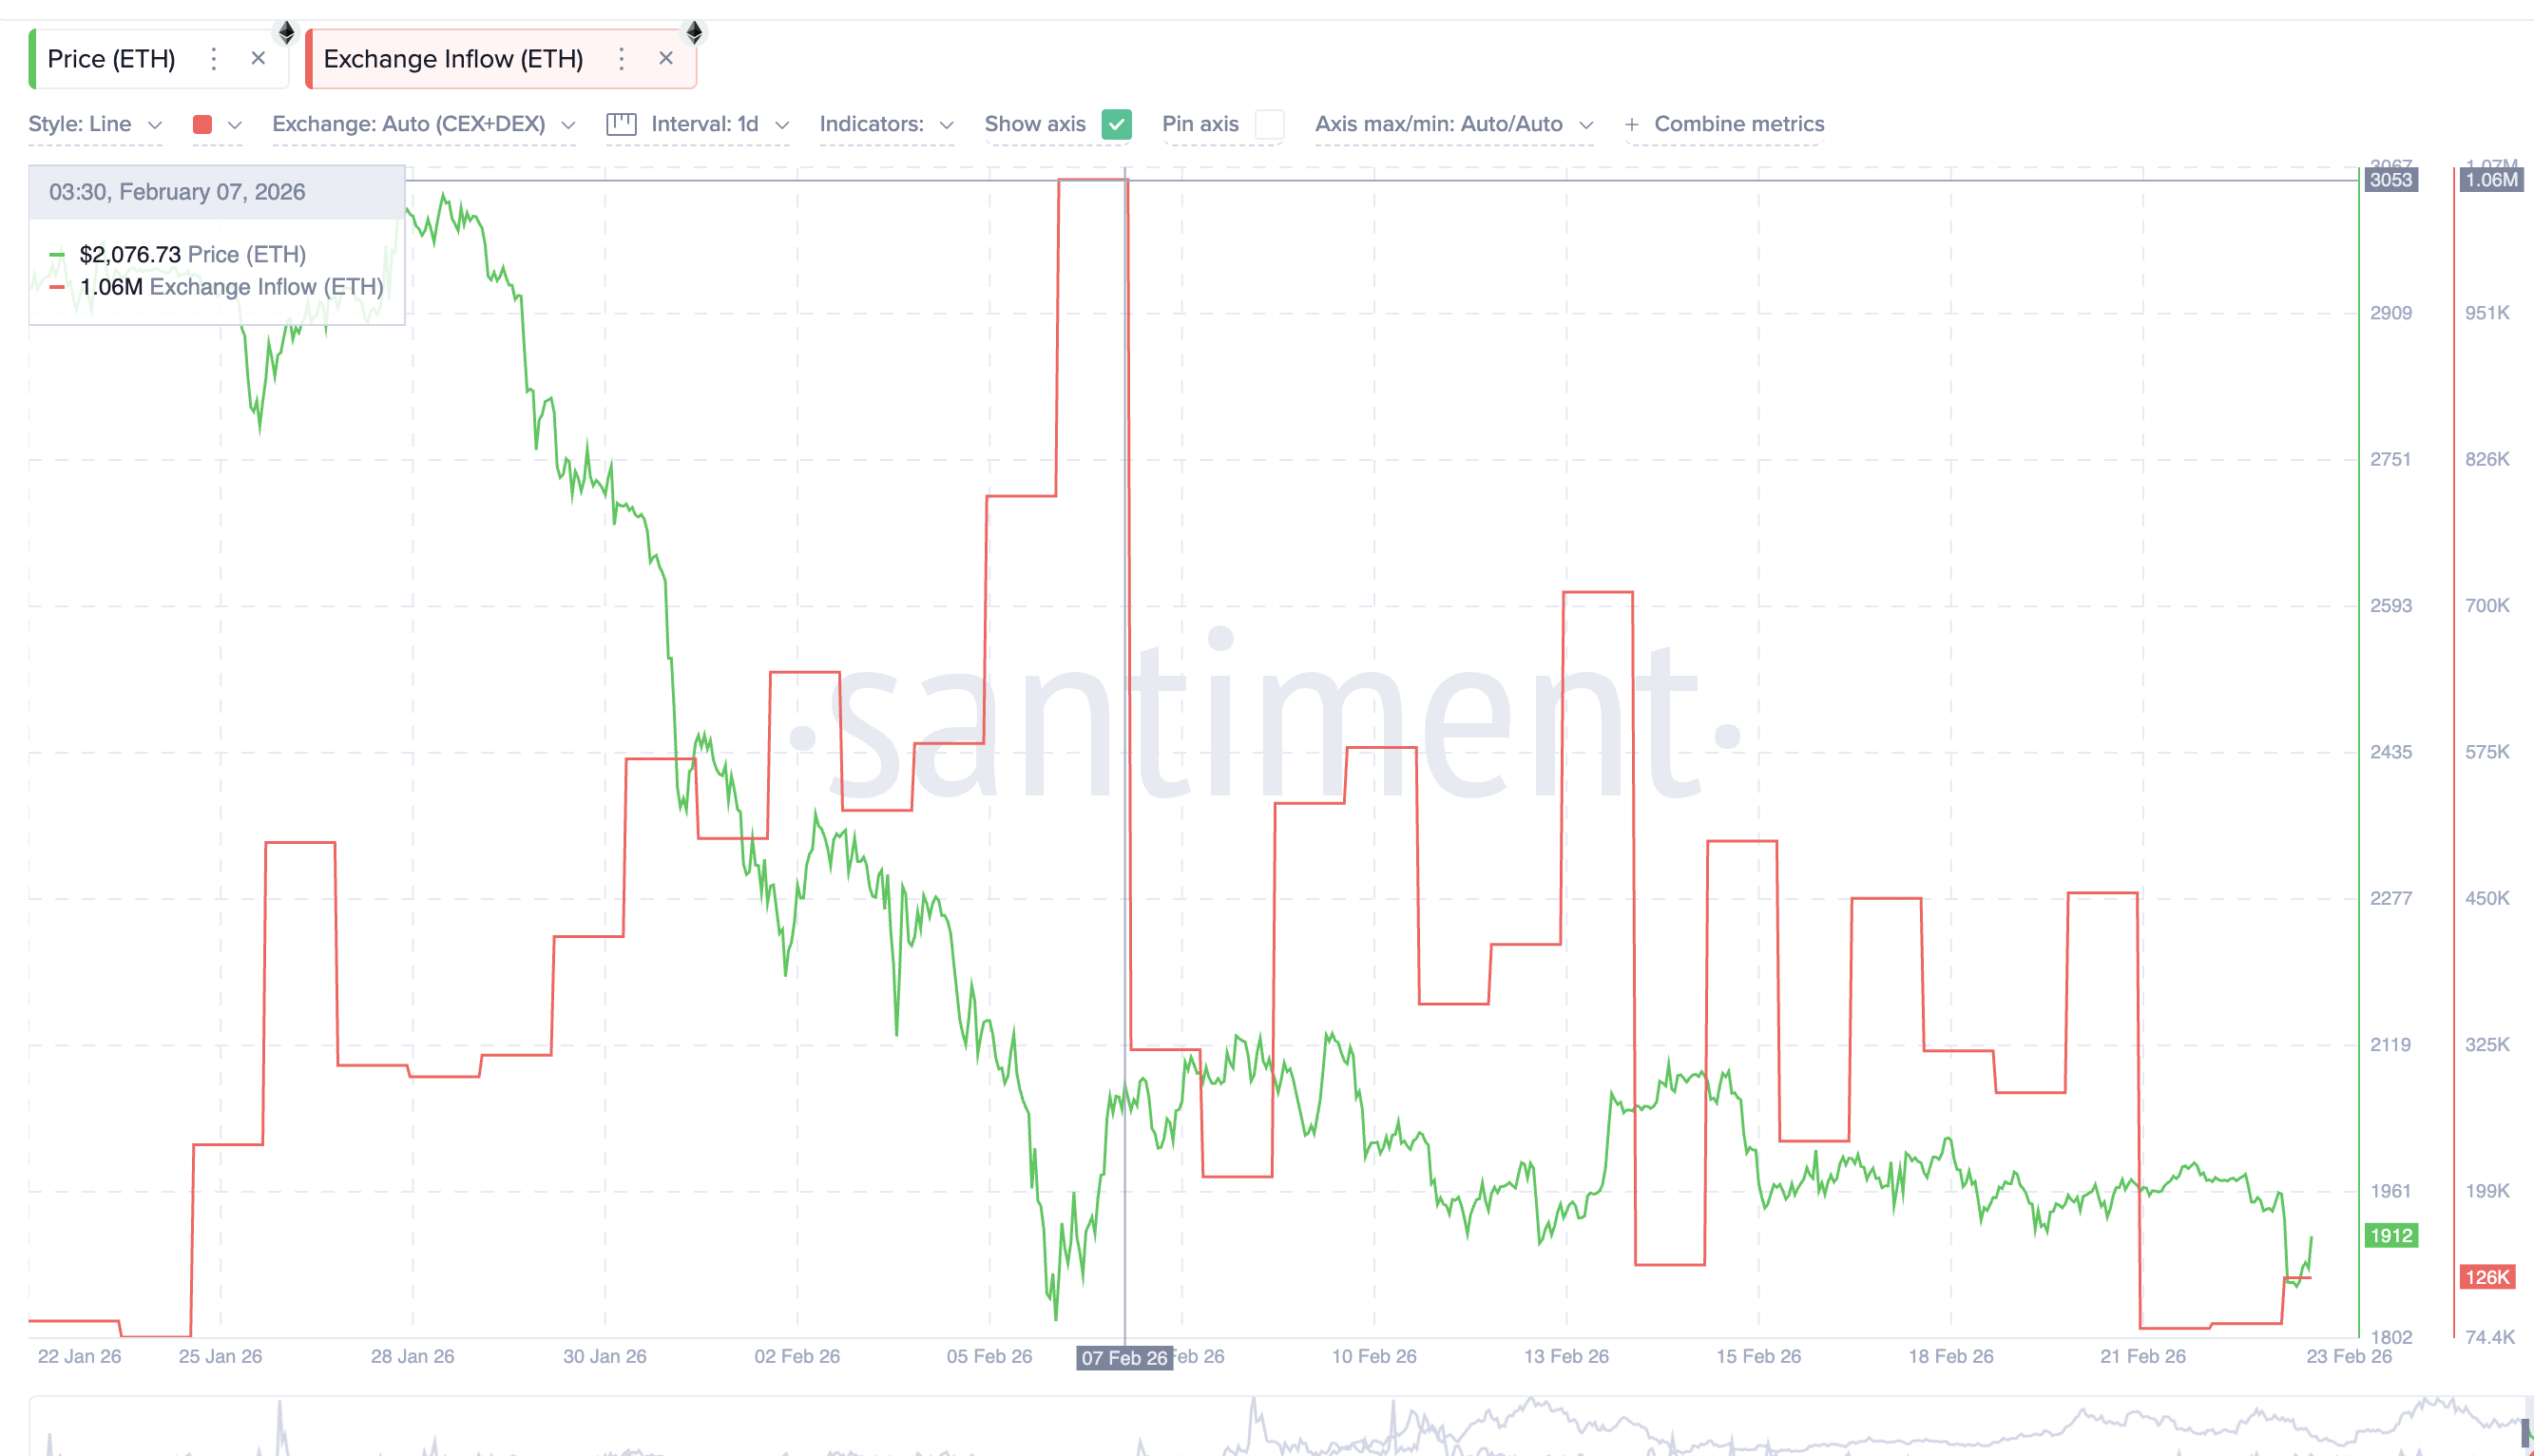
This change becomes even more important when compared to price. During the same period, Ethereum’s price still fell roughly 14%. Normally, price drops when selling pressure rises. But here, the price dropped while the selling pressure disappeared.
This shows the decline was not driven by aggressive spot selling. Instead, it suggests the weakness came from another source. That source appears to be derivatives traders. Ethereum’s funding rate has turned deeply negative. When funding is negative, short sellers are paying to maintain bearish positions.
Since February 7, funding rates dropped from slightly positive levels to around -0.02%. This marks one of the most bearish sentiment flips in recent weeks.
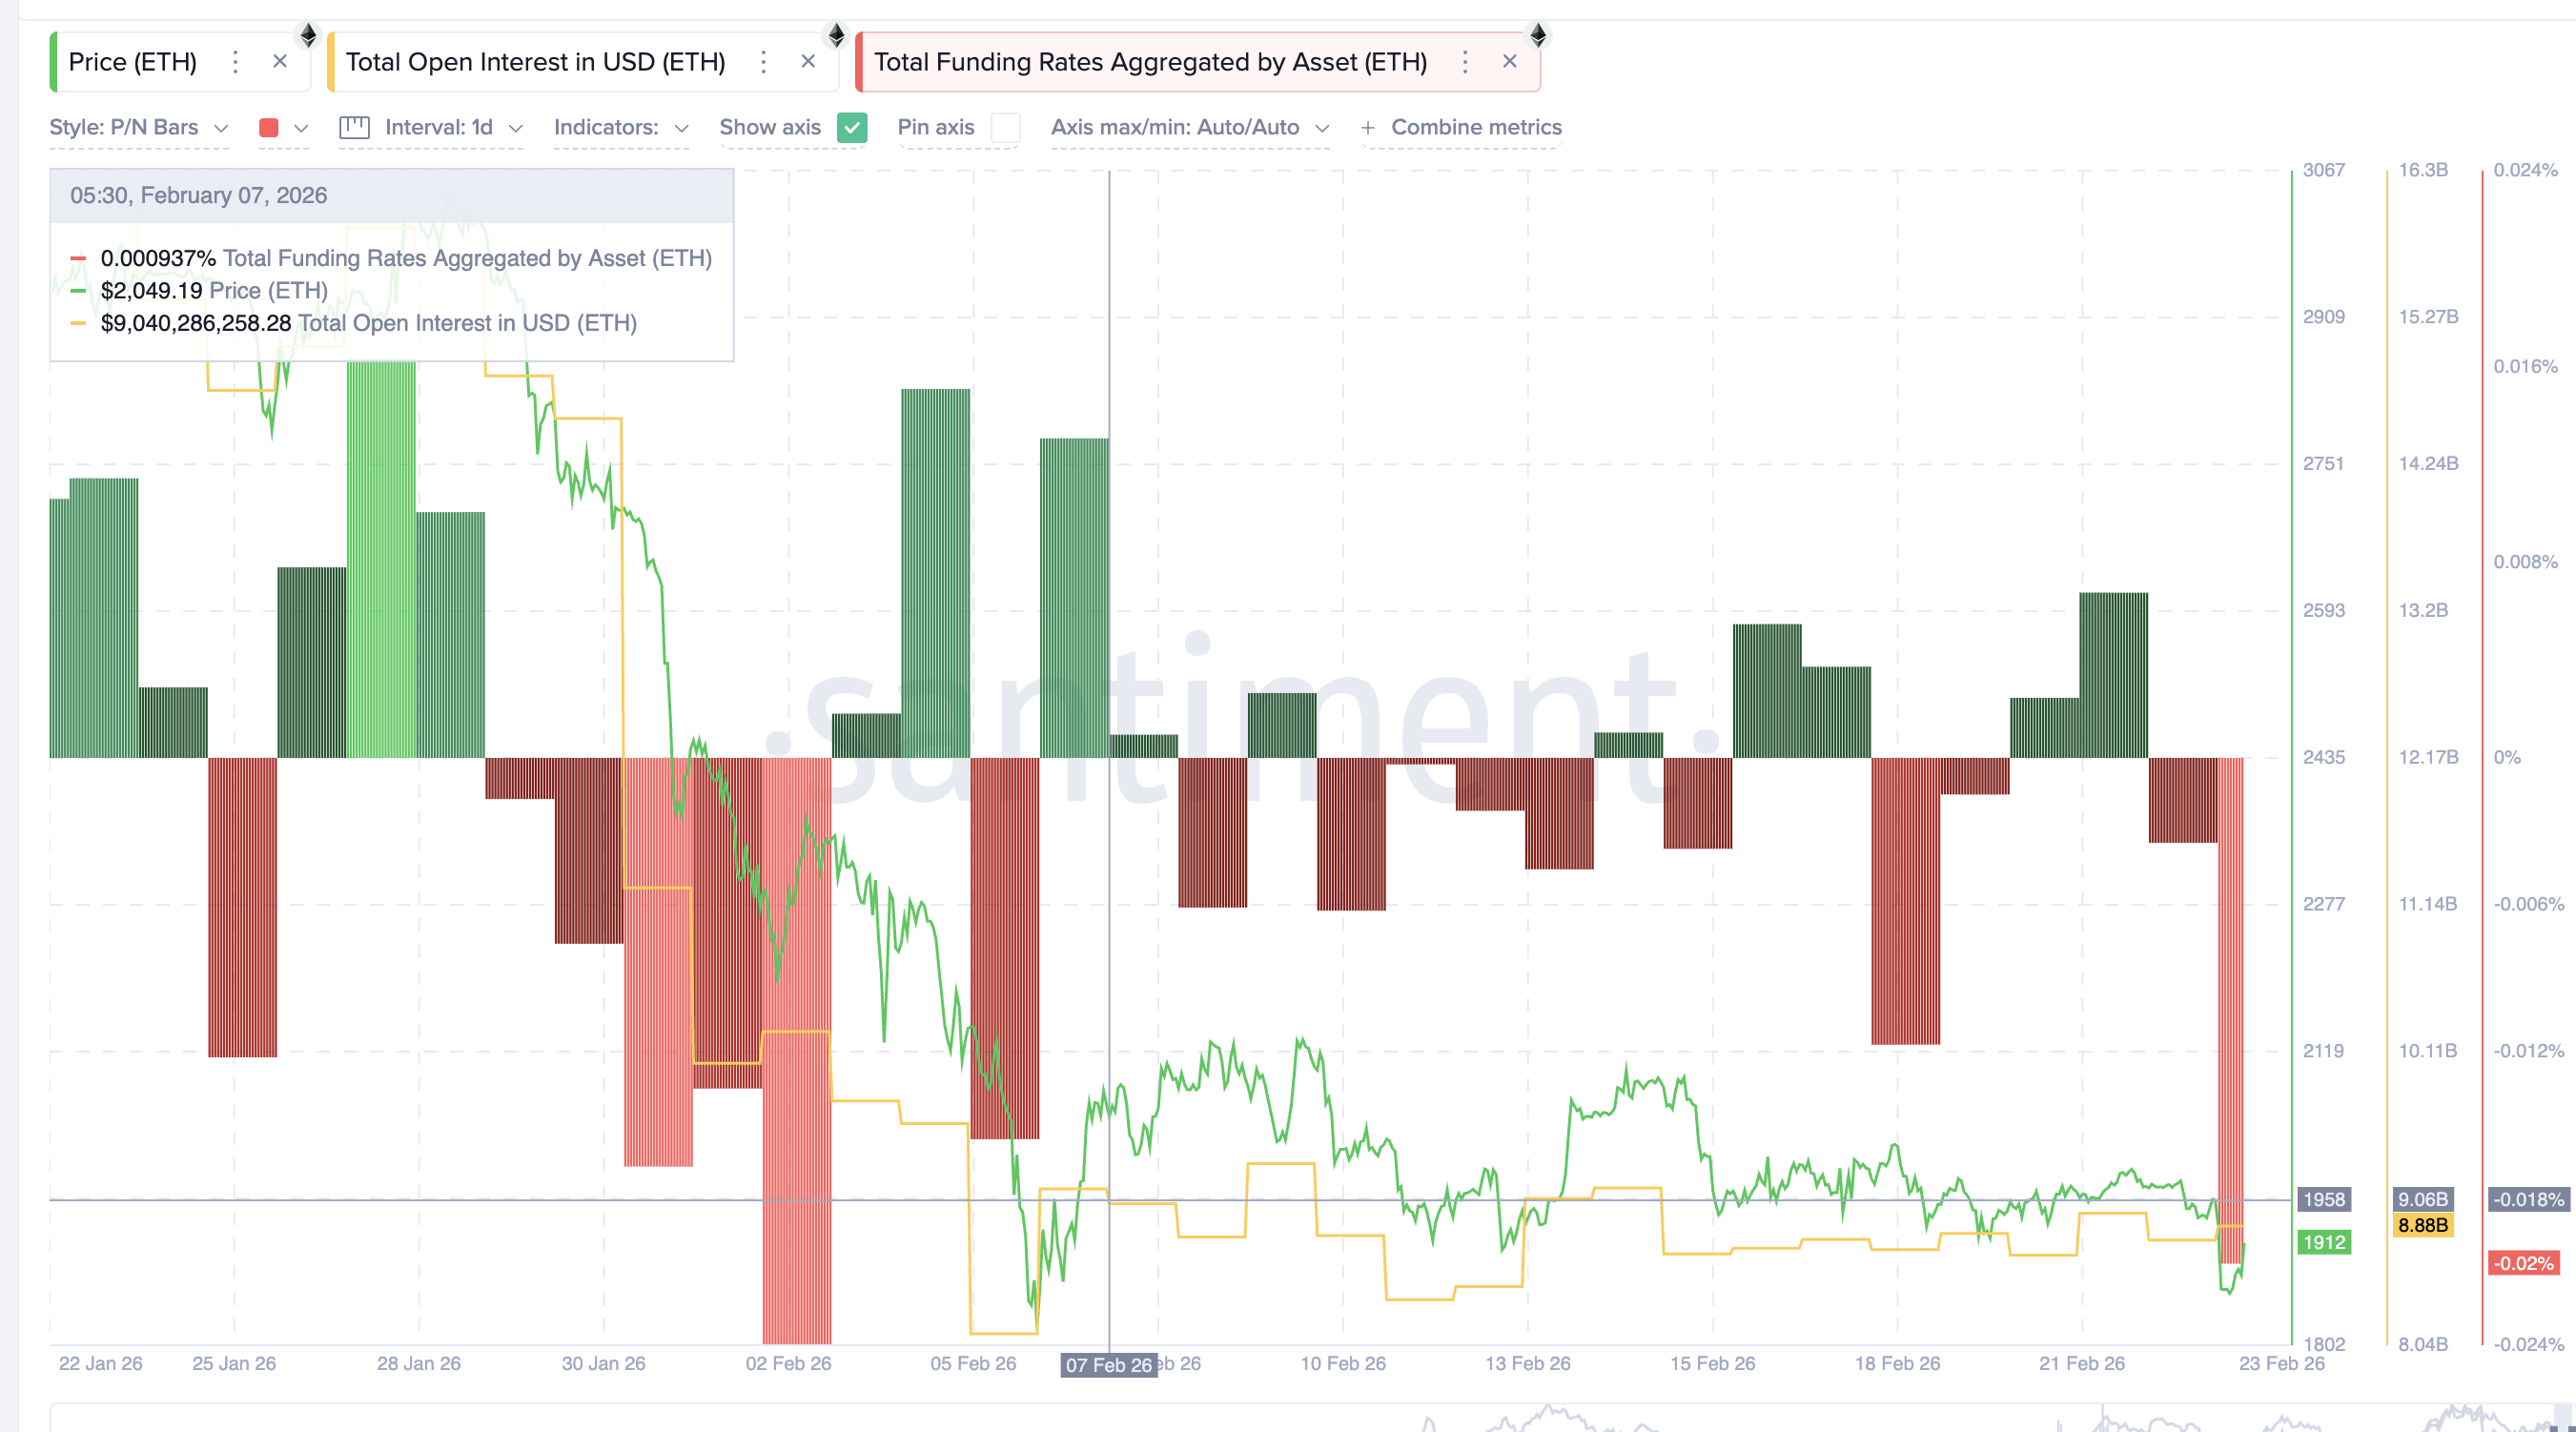
However, open interest tells a different story. Open interest measures the total value of active futures positions. During this period, open interest stayed mostly flat, falling only slightly from around $9.06 billion to $8.88 billion.
This combination is important. It shows that new short positions are not aggressively entering. Instead, existing traders have turned bearish, and long positions have likely exited.
This type of setup can be unstable. When bearish sentiment rises without large new positions, the market becomes vulnerable to a short squeeze. A short squeeze happens when rising prices force short sellers to close positions, pushing the price even higher.
This helps explain why Ethereum’s bounce could extend beyond a simple short-term rebound.
Long-Term Holders Suddenly Turn Buyers After Weeks of Selling
Another important shift comes from long-term holders. The Hodler Net Position Change metric measures whether long-term investors are buying or selling.
Between February 3 and February 20, this metric stayed negative. This showed sustained selling from experienced investors. At its peak, long-term holders sold more than 41,000 ETH on a net basis. But this trend has now reversed. Over the past two days, the metric turned positive, reaching a net accumulation of over 6,000 ETH.
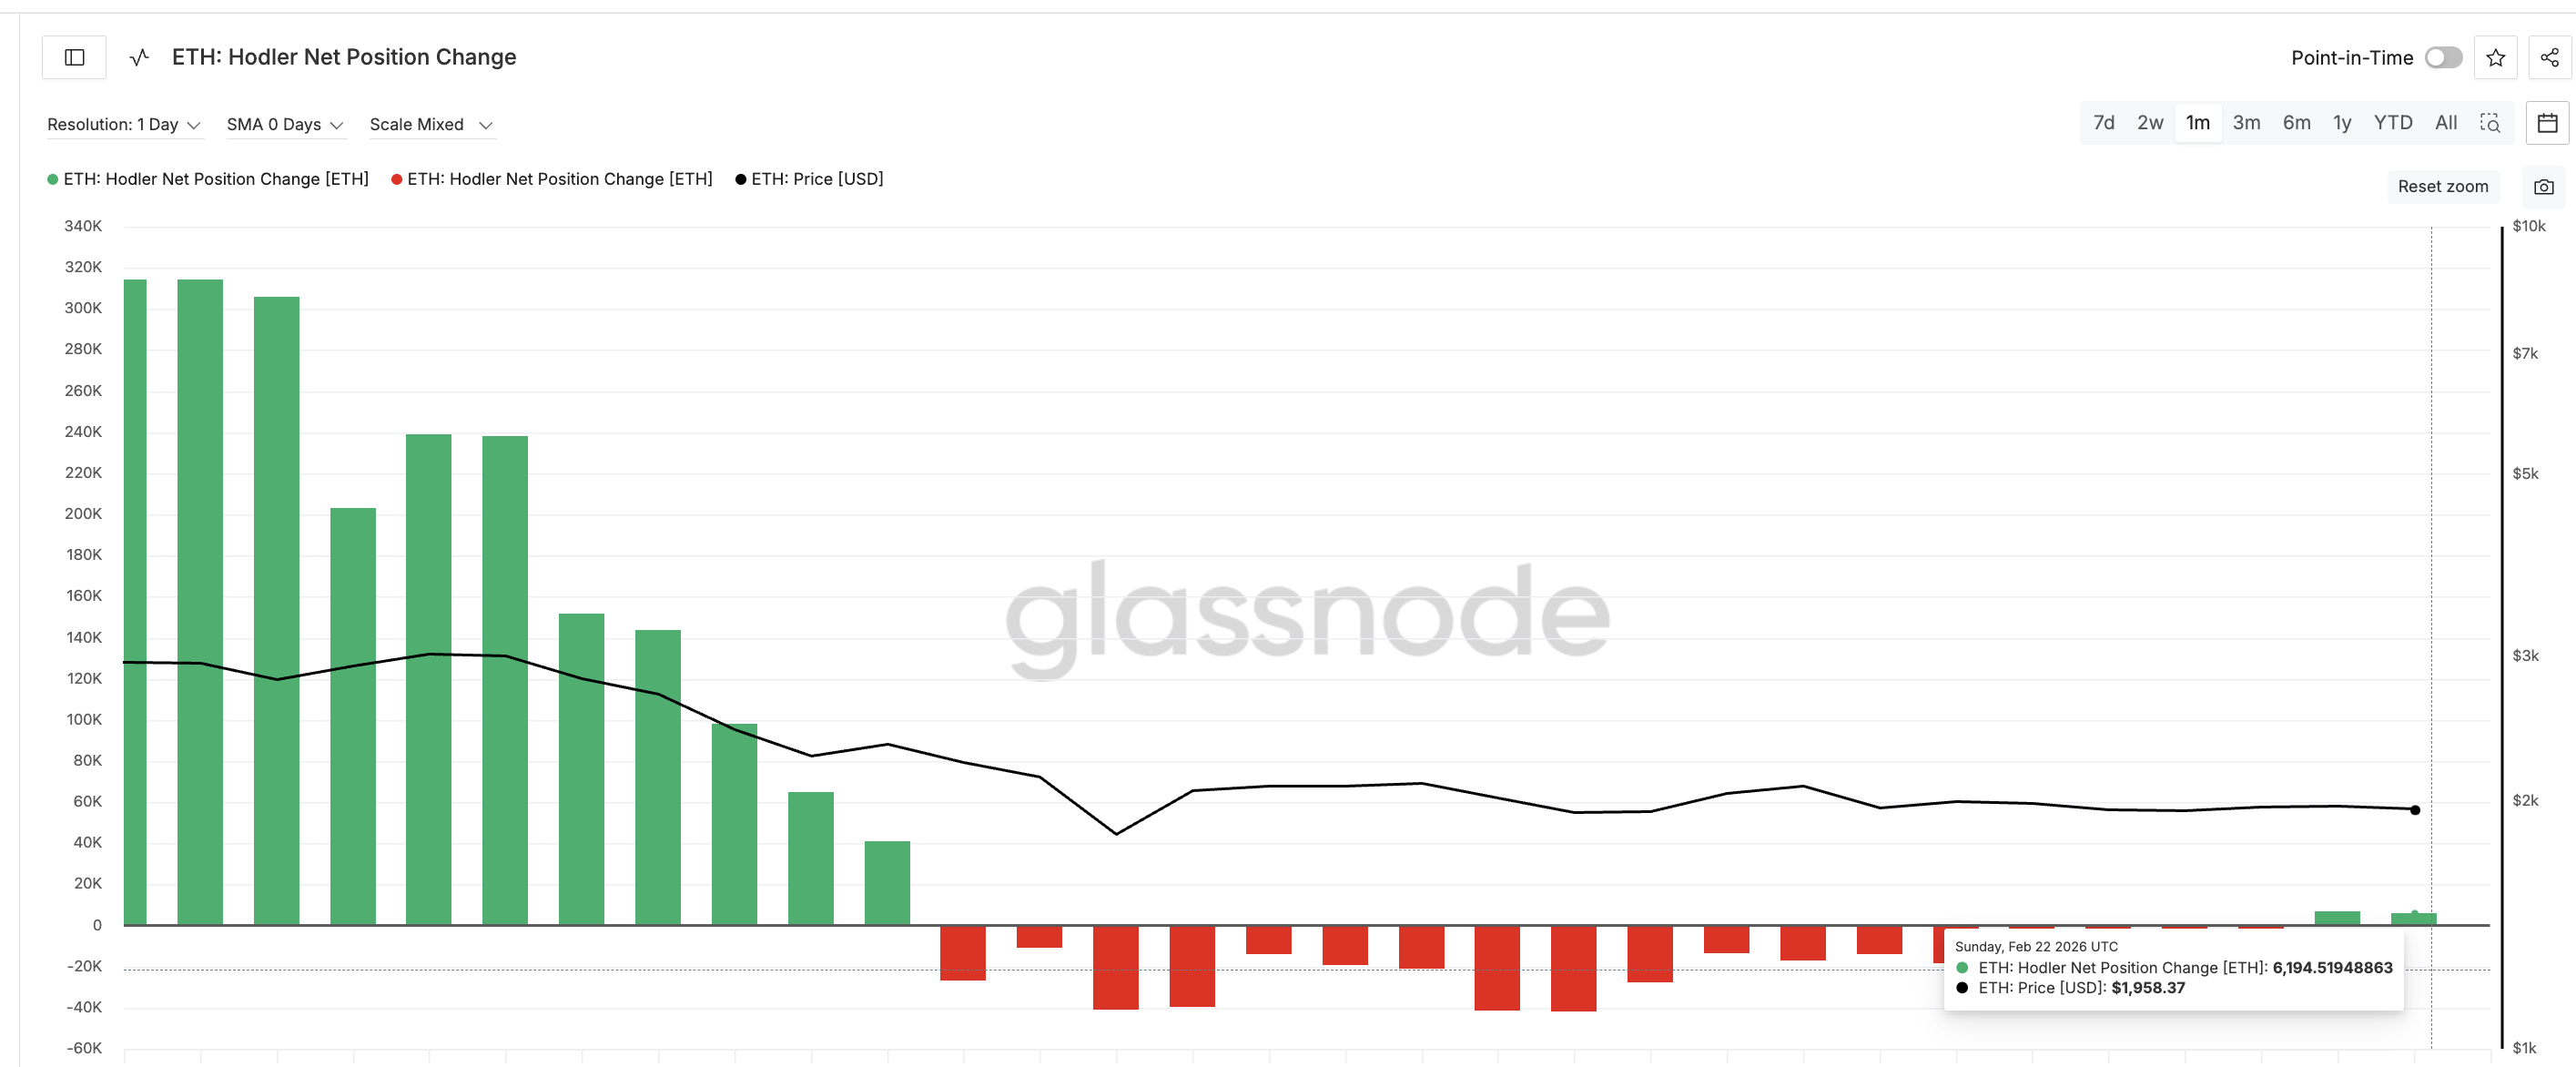
This confirms that experienced investors have resumed buying. This type of accumulation often happens near local bottoms, when long-term investors position early before broader recoveries begin.
With selling pressure falling, bearish derivatives sentiment stretched, and long-term buyers returning, Ethereum’s bounce setup now has stronger structural support.
Ethereum Price Faces Key Breakout Levels That Could Extend Bounce
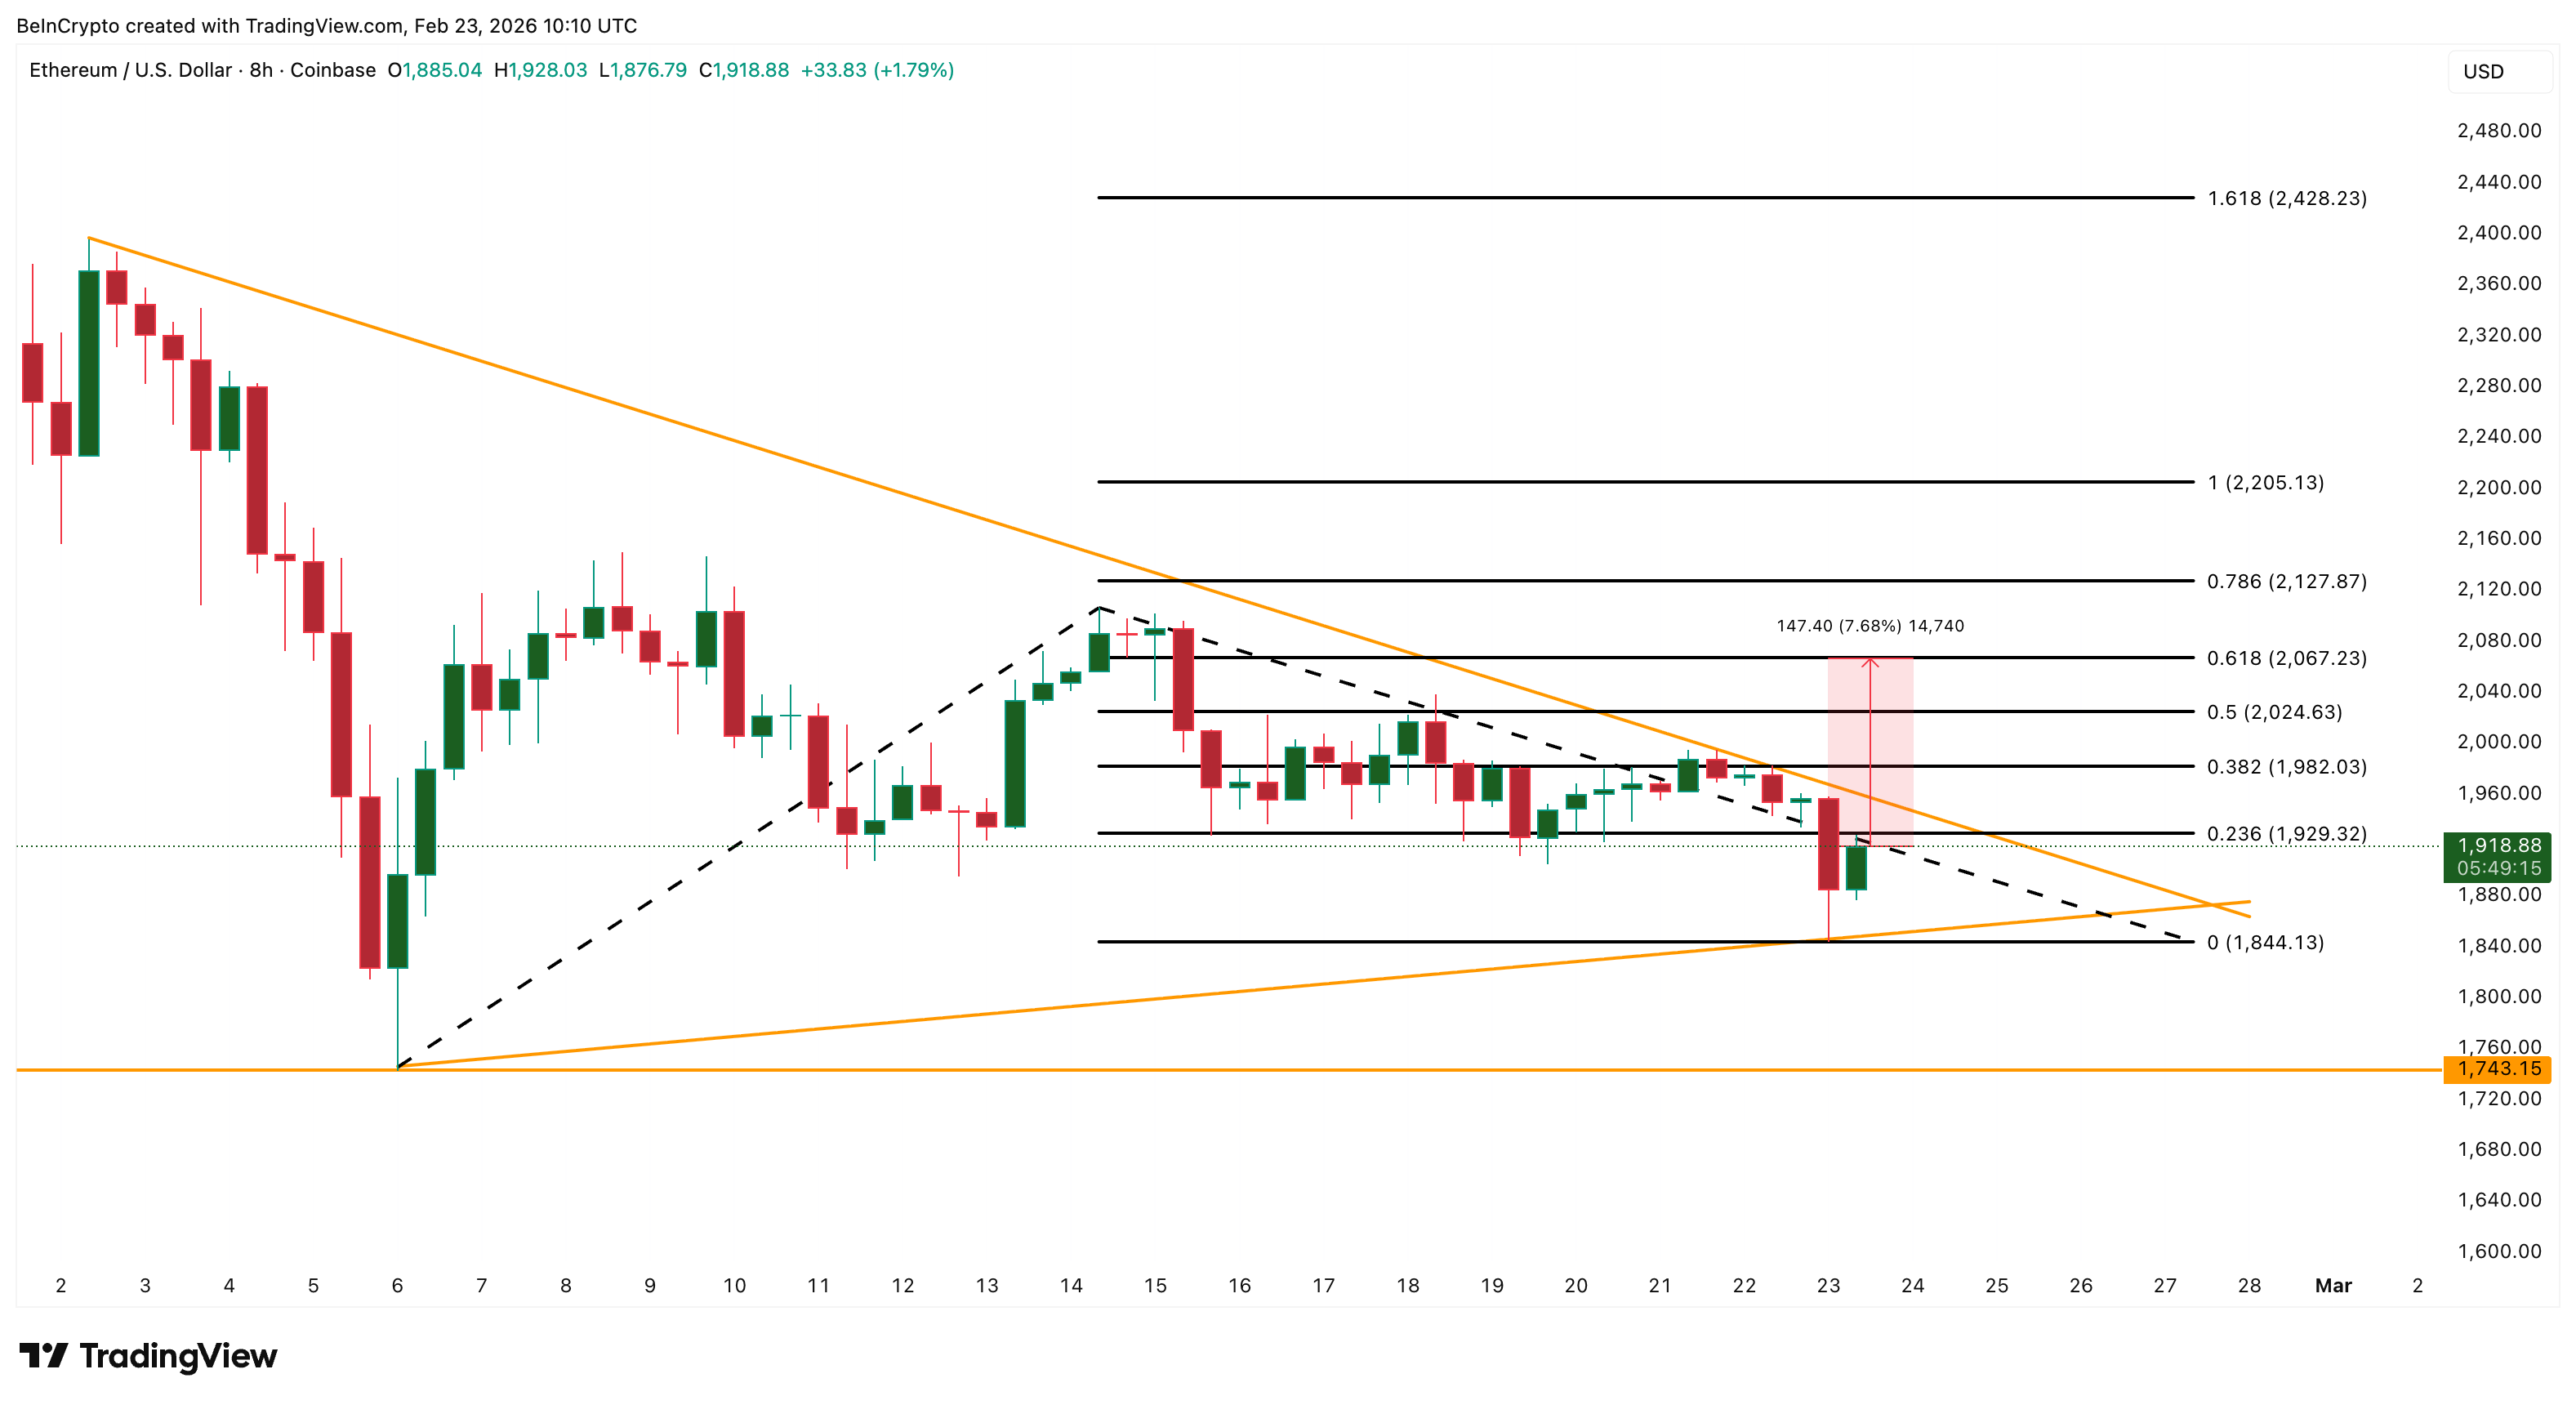
Ethereum now faces several important resistance levels. The first key level sits at $1,920. Breaking above this level would confirm strengthening momentum. The next resistance appears at $2,020, followed by a major barrier near $2,060, a key technical level, where it can experience the most resistance.
If Ethereum breaks above $2,060, the bounce could accelerate toward $2,200 and potentially even $2,420.
However, the bullish setup depends on holding support. The critical downside level remains $1,840. If Ethereum falls below this level, the bounce structure would fail. In that case, the next downside target sits near $1,740.
For now, Ethereum’s bounce is no longer just a simple relief rally. Selling pressure has collapsed by nearly 90%. Bearish sentiment increased without strong conviction. And long-term holders have quietly returned as buyers.
These combined forces suggest Ethereum’s current rebound may be the early stage of a larger move — with the next breakout level now becoming the decisive trigger.


The FT token arrives after the project raised close to $300 million in funding.
The Flying Tulip (FT) token became transferable and began trading today, Feb. 23, marking the token generation event (TGE) for the latest DeFi project linked to Andre Cronje, a systems architect best known for building early DeFi protocols Yearn Finance and Fantom.
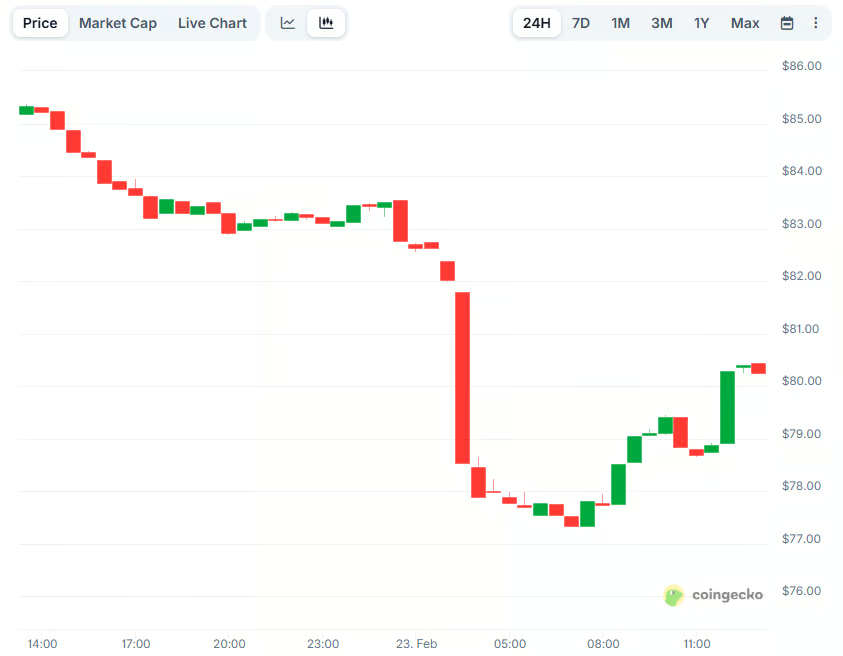
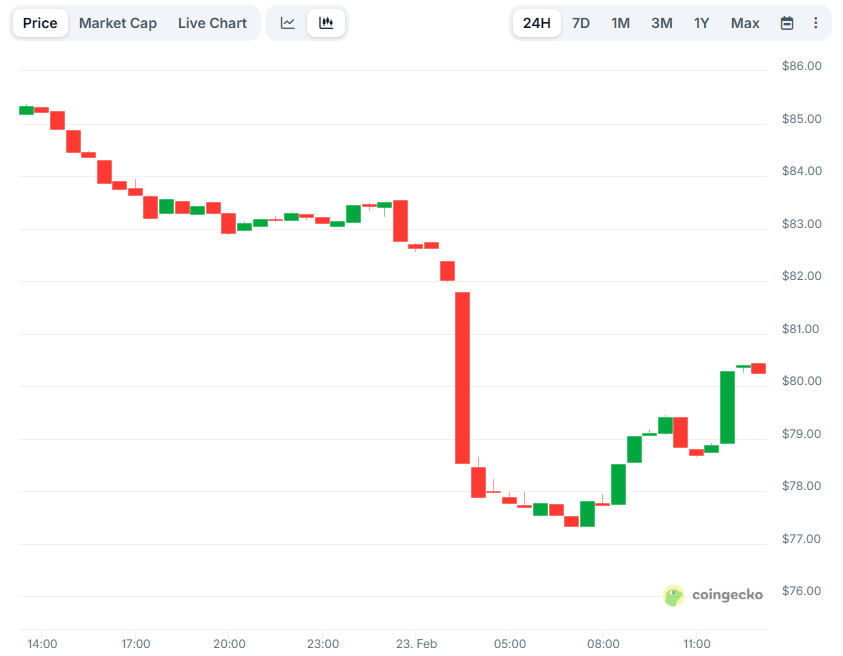
Data from CoinGecko shows that despite an initial dip to around $0.08, FT has spent its first hours trading sideways around the $0.10 mark, implying a fully diluted valuation of around $1 billion.
FT Public Sale, Explained
Flying Tulip’s public sale price was set at $0.10, but it wasn’t a standard token sale. The project’s tokenomics make $0.10 something like a floor price for the asset trading on the open market, as public sale participants have the right to break even on their investment at any time.
Early buyers didn’t just get regular tokens but received ftPUTs, which are non-fungible tokens with a built-in perpetual put option, which gives holders the right, under certain rules, to redeem their tokens at the public sale price of $0.10, instead of having to sell them on the open market.
As Cronje explained earlier this month in an X post, given the project’s tokenomics, “Flying Tulip FDV is not standard FDV.” Typically, FDV is calculated by multiplying total token supply multiplied by current token price.
But Flying Tulip departs from that model because each FT token is only created if it is backed by a corresponding put option, leaving no path for unbacked supply to enter circulation. When tokens are redeemed, they’re also removed from circulating supply.
That tokenomics design means every token is effectively collateralized by its own $0.10, making the system “closer to a NAV valuation than FDV,” Cronje highlighted, adding, “this is something new, and aligns participation far more than any previous model.”
Flying Tulip is positioned as a DeFi “super app,” aiming to bring spot trading, perpetual derivatives and lending into a single interface.
Ahead of the launch, Flying Tulip wasn’t short on cash. The project had already pulled in $200 million in September last year from backers including Brevan Howard and DWF Labs, then added another tens of millions through later rounds and public sales on platforms such as Impossible Finance and CoinList.
SOL is “basically trading in a big no man’s land,” one popular analyst argued.
Solana’s SOL has been on a severe downfall lately, with its valuation plummeting by almost 40% over the past month alone.
According to some analysts, the bears are yet to reveal their full potential, envisioning a slump below $10 in the near future.
SOL HODLers, Beware
The leading altcoin was among the worst-affected cryptocurrencies following the latest market slump caused by Trump’s renewed tariff saga. Just a few hours ago, SOL briefly dipped to roughly $77 before snapping back above $80, meaning a 6% loss for the day.
The renowned analyst on X, Ali Martinez, observed the asset’s recent performance, claiming “the super trend indicator” has flashed a sell signal on the monthly chart. He noted that the last time this pattern appeared was in January 2022 and preceded a brutal 95% decline. Applying a decline of that magnitude to today’s levels would imply a staggering crash to approximately $4.
Moreover, Martinez warned investors to pay close attention to the $76 support zone. He believes that breaking below it could open the door to a further pullback to $53, $35, and $23.
Sjuul | AltCryptoGems also made bearish predictions recently. He argued that SOL “truly looks compromised on the high time frame” and is “basically trading in a big no man’s land.” The analyst claimed that as long as the price remains suppressed beneath the $110 resistance, SOL faces the risk of a deep retracement to as low as $20.
How About a Short-Term Bounce?
Despite the broader crypto market’s depressed condition and SOL’s substantial correction, the asset’s Relative Strength Index (RSI) suggests a rebound could be on the way.
You may also like:
The technical analysis tool gauges the speed and magnitude of recent price movements, offering insight into whether a potential trend reversal may be developing. It ranges from 0 to 100, and ratios below 30 indicate that SOL is oversold and could be on the verge of a rally. Data shows that the RSI has dipped well below that zone on a weekly scale.

X user Mags revealed that the asset’s weekly RSI has reached the same level it was in December 2022, when SOL was trading around $8. In the following months, it posted a major bull run, and the analyst wondered if history was about to repeat itself.
Solana’s recent exchange netflow is another factor worth observing. Toward the end of 2025 and into early 2026, inflows exceeded outflows, suggesting that investors were moving funds from self-custody to centralized platforms. This shift is considered a bearish signal because it can be interpreted as a pre-sale step. In recent weeks, however, the trend has reversed with outflows surpassing inflows.

Binance Free $600 (CryptoPotato Exclusive): Use this link to register a new account and receive $600 exclusive welcome offer on Binance (full details).
LIMITED OFFER for CryptoPotato readers at Bybit: Use this link to register and open a $500 FREE position on any coin!


Analyst says public XRPL metrics are down 50–80%, but private institutional flows may explain the apparent decline.
XRP Ledger activity has dropped steeply, with public metrics showing active users, payment volume, and sender accounts falling between 50% and 80% within weeks, according to market watcher Arthur.
The data has sparked debate over whether the network is weakening or simply shifting activity away from public dashboards after a new institutional trading feature went live.
Public XRPL Stats Fall
In a thread posted on X on February 23, Arthur said active users with tags fell to about 38,000 from more than 200,000, while payment volume dropped to roughly 80 million XRP from over 2.5 billion. Additionally, unique sending accounts slid to about 3,000 from above 40,000, with the analyst describing the figures as “bad” but arguing they may not reflect real network demand.
He linked the drop to the February 18 activation of XLS-81, a permissioned decentralized exchange system that allows regulated entities to trade inside restricted pools. Transactions routed through those channels do not appear on public trackers. Furthermore, he suggested the late-2025 spike in activity came from retail flows visible on-chain, whereas institutional flows could now be moving privately.
At the same time, the XRP advocate criticized viral price forecasts, such as a February 22 post from trader CryptoBull2020 predicting XRP could hit $15 by March and $70 by May. He argued that liquidity and macro conditions matter more than social media optimism.
The asset was trading near $1.39 at the time of writing, down about 2% in the last 24 hours, 5% in seven days, and 27% over the past month. Across the last year, it has fallen by more than 46% and is now more than 60% below its July 2025 peak of $3.65.
By comparison, Bitcoin (BTC) has mostly ranged sideways recently, according to pseudonymous analyst Darkfost, which they said has limited direction across altcoins.
You may also like:
Darkfost also reported that more than 31 million XRP moved into wallets on Binance in a single day, largely from large holders. They estimated the transfers could represent about $45 million in potential sell pressure if the funds reach the market.
Loss Data and Valuation Metrics Offer Mixed Signals
A recent report from Santiment adds longer-term context, saying XRP recorded its largest realized loss spike since 2022 after falling from about $3.60 to near $1.10 earlier this month. The firm noted that similar spikes previously came right before a 114% price rise within eight months, though it did not predict that pattern would repeat.
In another analysis, Santiment compared MVRV ratios to rank Ethereum as the most undervalued major crypto at -14.3%, followed by Bitcoin at -6.9%, with XRP at -4.1%. The metric measures whether holders are in profit or loss relative to their cost basis.
Binance Free $600 (CryptoPotato Exclusive): Use this link to register a new account and receive $600 exclusive welcome offer on Binance (full details).
LIMITED OFFER for CryptoPotato readers at Bybit: Use this link to register and open a $500 FREE position on any coin!
Ethereum faces imminent risk of collapse to $1,475 after co-founder Vitalik Buterin executed a massive sell-off of nearly 9,000 ETH this week.
The high-profile wallet activity coincides with a broader technical breakdown, as the asset struggles to maintain support above $1,850 amidst rising sell volume and widespread market de-risking.
- Vitalik Buterin sold roughly 9,000 ETH, leaving a supply overhang of over 7,350 ETH in the updated wallet balance.
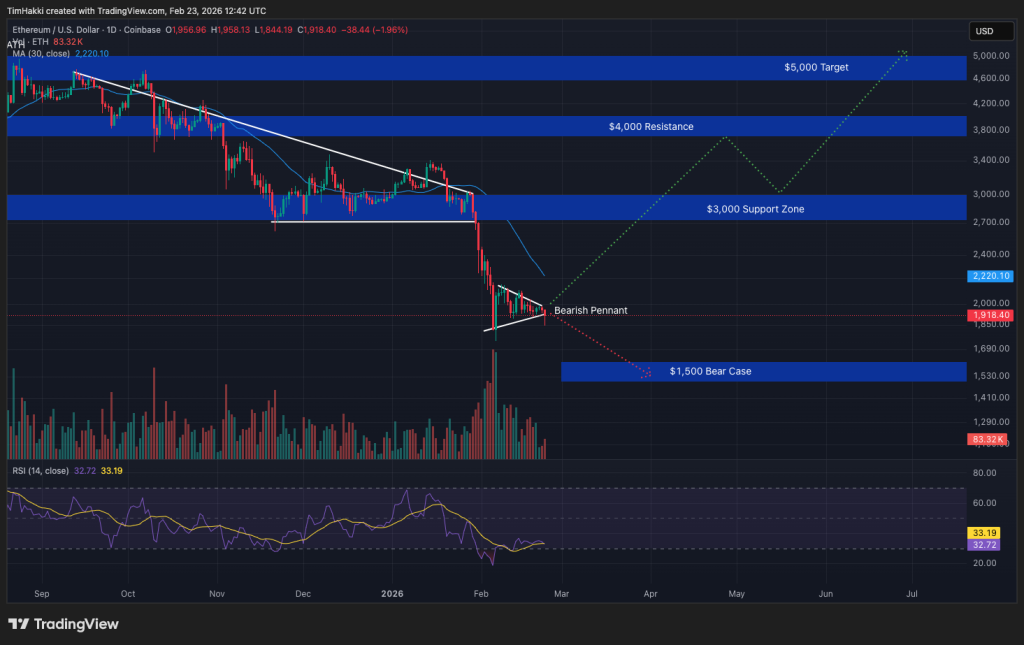
- Ethereum has officially entered a bear pennant breakdown, technically targeting a slide to $1,475 by early March.
- The sell-off aligns with a broader market retreat, significantly threatening the psychological $1,500 support level.
Why Is Founder Selling Triggering Alarm?
The market’s sharp reaction stems from both the volume of the sale and historical precedent. Founder-led selling often acts as a bearish signal for retail traders, and previous sales by Buterin have preceded price declines of almost 23%.
With roughly 7,350 ETH still remaining in the wallet, traders fear a continued supply overhang could suppress price action throughout the week.
This localized selling pressure compounds macro headwinds. Broad market sentiment has already shifted due to nervousness surrounding tariffs, which recently caused a de-risking event across major altcoins.
While long-term institutional holders like Consensys maintain significant treasuries, the immediate liquidity shock from a founder sale creates a tangible drag on short-term momentum.
Discover: The best meme coins in the world right now
Technical Breakdown Points to $1,475 Bottom
The price action on the charts confirms the bearish narrative. Ethereum has entered the “breakdown phase” of a prevailing bear pennant pattern.
Early on Monday UTC, ETH dropped approximately 5.60% in 24 hours to hover near $1,850, slicing through the pennant’s lower trendline. Rising trading volumes accompanied the move, indicating strong conviction from sellers.

According to standard technical analysis principles, a bear pennant breakdown typically resolves when the price falls by a magnitude equal to the previous downtrend’s height.
Applying this to the current chart suggests a downside target of $1,475, precisely aligning with the psychological support zone of $1,500.
While Buterin continues to advocate for protocol improvements, recently backing censorship resistance upgrades, these long-term fundamentals are currently overshadowed by chart weakness.
Can Ethereum Hold Critical Support?
The path forward depends heavily on whether buyers can defend the sub-$1,800 region.
If the bearish momentum continues, a test of $1,475 appears inevitable by early March. Conversely, invalidating this outlook requires a swift reclaim of the pennant’s lower trendline and a sustained close above the $2,000 resistance level.
Despite the current gloom, some analysts, including those at Intellectia.ai, suggest that a 2026 return to $3,000 remains firmly feasible once this correction exhausts itself.
Discover: The next crypto to explode
The post Ethereum Faces $1,500 Downside as Vitalik Buterin Sells 9,000 ETH appeared first on Cryptonews.
Welcome to the US Crypto News Morning Briefing—your essential rundown of the most important developments in crypto for the day ahead.
Grab a coffee — because stablecoins may be about to reshape the US bond market. A new Standard Chartered report suggests rising demand for Treasury bills from digital dollar issuers could quietly force Washington to rethink how it finances its debt.
Crypto News of the Day: Stablecoin Demand Could Force Washington to Rethink US Debt Strategy
Stablecoins may soon reshape the US Treasury market, potentially forcing a radical shift in debt issuance, according to a new report from Standard Chartered.
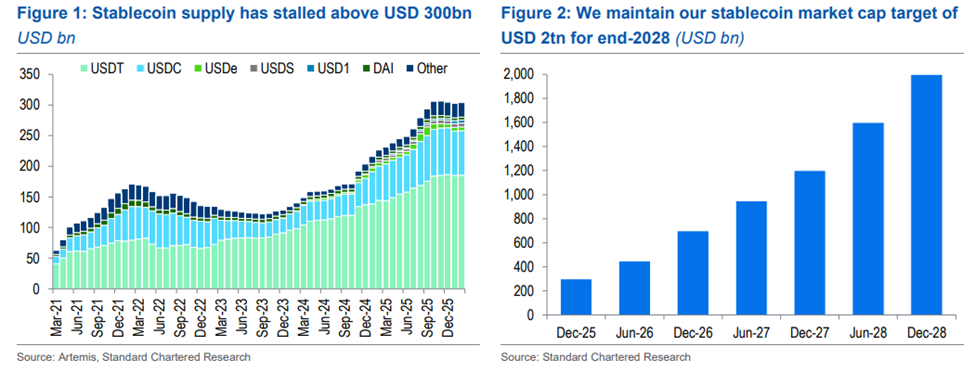
The bank projects that stablecoin issuers could generate between $0.8 trillion and $1 trillion of fresh demand for Treasury bills (T-bills) by the end of 2028.
This trend, when combined with Federal Reserve purchases, could push total short-term Treasury demand to $2.2 trillion.
The report warns that the Treasury could use this emerging excess demand as justification to increase T-bill issuance while reducing long-term bond supply. Such a move could, in effect, allow the US government to suspend all 30-year bond auctions for the next three years.
“We think the US Treasury may use this potential excess demand as a reason to issue more T-bills,” wrote Geoff Kendrick in the latest Standard Chartered report, highlighting stablecoin issuers as increasingly significant buyers of short-term US debt.
Emerging market stablecoins are expected to drive the majority of this demand. Standard Chartered estimates that two-thirds of projected T-bill demand will come from emerging markets, representing net new demand. Meanwhile, stablecoins in developed markets largely substitute for existing holdings.
This pattern highlights the growing role of digital assets in global capital flows and their influence on traditional fixed-income markets.
The potential implications for the Treasury yield curve are substantial. Shifting roughly $9 billion from long-term bonds to T-bills could initially flatten the US Treasury curve.
Yield Curve Risks Mount as Treasury Weighs Expanding T-Bill Share
Standard Chartered notes, however, that long-term premia, fiscal deficit concerns, and market sentiment could influence investor reaction over time.
The bank cautions that a bull flattening at the front end may be the immediate response, but structural factors, including term premia and rollover risk, could shape yields differently in the longer term.
Treasury Secretary Scott Bessent could leverage this scenario to increase the share of T-bills within the overall debt portfolio.
Raising the T-bill share by just 2.5% over three years would generate roughly $900 billion of additional T-bill supply, offsetting the projected excess demand.
This could ease scarcity at the front end of the curve while keeping the 10-year Treasury yield manageable.
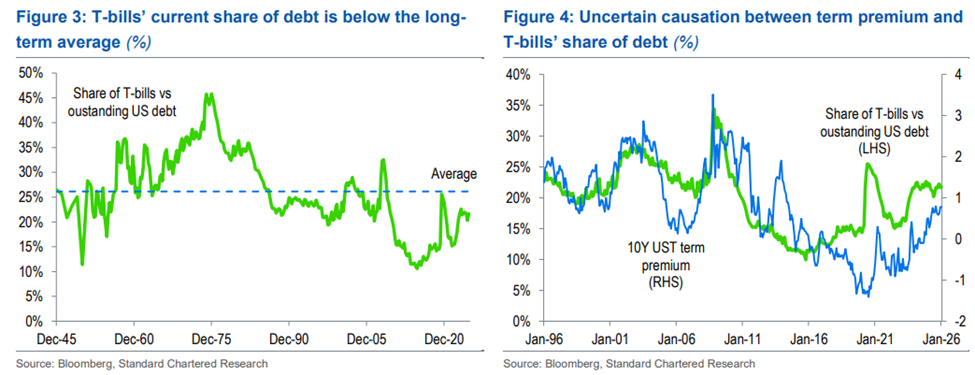
The report also notes that historically, T-bills have averaged 26.1% of outstanding marketable debt. This is well above the Treasury Borrowing Advisory Committee’s recommended 15–20% range, suggesting room for an increase.
Despite short-term stagnation, stablecoin market capitalization is projected to reach $2 trillion by the end of 2028. Growth has recently stalled at around $304 billion, influenced by weaker digital asset markets and regulatory delays following the US GENIUS Act.

However, Standard Chartered considers these factors cyclical rather than structural. Stablecoin demand, combined with ongoing Fed Reserve Management Purchases and replacement of maturing mortgage-backed securities, could therefore drive a historic reshaping of short-term US debt markets.
The report concludes that while suspending 30-year bond auctions would not be unprecedented—the Treasury paused them from 2002 to 2006—the current deficit environment differs markedly.
Chart of the Day
Byte-Sized Alpha
Here’s a summary of more US crypto news to follow today:


Bitwise Asset Management Chief Investment Officer Matt Hougan took to social media to defend Bitcoin (BTC) against a wave of criticism, arguing that skeptics judging the asset as a failed store of value are ignoring the volatile “teenage phase” necessary for any new monetary asset to mature.
His comments were a direct challenge to a growing narrative, amplified by a nearly 50% drawdown from its all-time high and recent headlines questioning the cryptocurrency’s purpose.
Bitcoin’s Volatility Meets Institutional Impatience
The debate reignited after Bloomberg published a report framing the current market downturn as an “existential” struggle for Bitcoin, asking what the asset is actually for if it fails as a hedge, payment rail, or speculative vehicle.
Former Merrill Lynch trader Tom Essaye, quoted in the Bloomberg piece, added fuel to the fire, stating flatly that “Bitcoin is not replacing gold, it’s not digital gold” and dismissing its utility as an inflation or chaos hedge.
Hougan responded to these takes, rejecting the premise that Bitcoin must emerge from nothing as a fully formed, gold-like asset. He described Bitcoin in 2009 as “100% speculation,” projecting a future in 2050 where it is “0% speculation” and owned by central banks.
“You cannot travel from 100% speculation to 0% speculation without ticking every gradient in between,” Hougan posted. “The reason it doesn’t fit any individual box right now is it’s in the uncomfortable middle. But that’s a necessary part of the journey.”
His defense comes at a time when the price action of the king cryptocurrency is testing investor patience. The asset recently shed thousands of dollars off its value, following U.S. President Donald Trump’s announcement of a 10% temporary global tariff.
Meanwhile, Google searches for “Bitcoin is dead” have spiked to levels not seen since the FTX collapse in late 2022, a metric that some traders view as a contrarian signal that a bottom may be forming.
A Historical Precedent for Price Swings
Hougan’s argument is rooted in a historical parallel he first detailed in a 2018 Forbes article, which he recirculated amid the current debate. At the time, he pointed to gold’s performance after the U.S. left the gold standard in 1971.
Following Nixon’s decision, gold was set loose from its moorings, experiencing massive volatility as it fought to establish itself as an independent store of wealth. Furthermore, in 1974, the precious metal rose 73%, only to fall 24% in 1975. In 1981, it lost 33% of its value after being up 121% just two years prior.
“If you had asked someone in 1975 if gold was a store of value, they’d have pointed to that 24% drop,” Hougan implied in his prior analysis. He argued that Bitcoin is following the same trajectory: a rapidly appreciating price that slows over time, accompanied by high-but-declining volatility.
“Either you believe it’s literally impossible to create a digital store of value, or you have to imagine it passing through exactly this teenage state,” insisted the Bitwise CIO.
His framework suggests the current drawdown, which has seen BTC fall roughly 50% from its October 2025 peak near $126,000, fits the pattern of an asset class maturing rather than failing.
The post Matt Hougan: BTC Is Still in Its ‘Teenage State’ appeared first on CryptoPotato.

MLB news: Arte Moreno says winning ‘not in top five’ priorities for Angels fans

How to Grow as a Building Inspector

BTC tumbles back to $64,000 as IBM becomes latest AI target


-

 Crypto World7 days ago
Can XRP Price Successfully Register a 33% Breakout Past $2?
-

 Video4 days ago
XRP News: XRP Just Entered a New Phase (Almost Nobody Noticed)
-

 Fashion3 days ago
Weekend Open Thread: Boden – Corporette.com
-

 Sports7 days ago
GB's semi-final hopes hang by thread after loss to Switzerland
-

 Politics2 days ago
Baftas 2026: Awards Nominations, Presenters And Performers
-
 Tech7 days ago
The Music Industry Enters Its Less-Is-More Era
-

 Sports3 hours ago
Women’s college basketball rankings: Iowa reenters top 10, Auriemma makes history
-

 Politics4 hours ago
Nick Reiner Enters Plea In Deaths Of Parents Rob And Michele
-

 Business6 days ago
Infosys Limited (INFY) Discusses Tech Transitions and the Unique Aspects of the AI Era Transcript
-

 Entertainment5 days ago
Kunal Nayyar’s Secret Acts Of Kindness Sparks Online Discussion
-

 Video7 days ago
Financial Statement Analysis | Complete Chapter Revision in 10 Minutes | Class 12 Board exam 2026
-

 Tech6 days ago
Retro Rover: LT6502 Laptop Packs 8-Bit Power On The Go
-
 Sports5 days ago
Clearing the boundary, crossing into history: J&K end 67-year wait, enter maiden Ranji Trophy final | Cricket News
-

 Business1 day ago
Mattel’s American Girl brand turns 40, dolls enter a new era
-

 Business1 day ago
Law enforcement kills armed man seeking to enter Trump’s Mar-a-Lago resort, officials say
-

 Entertainment5 days ago
Dolores Catania Blasts Rob Rausch For Turning On ‘Housewives’ On ‘Traitors’
-

 Business6 days ago
Tesla avoids California suspension after ending ‘autopilot’ marketing
-
 NewsBeat12 hours ago
‘Hourly’ method from gastroenterologist ‘helps reduce air travel bloating’
-

 Politics7 days ago
Eurovision Announces UK Act For 2026 Song Contest
-

 Tech1 day ago
Anthropic-Backed Group Enters NY-12 AI PAC Fight