

Crypto World
Here’s How It Could Happen

Bitcoin has faced a tougher trading stretch, dipping under 75,000 for 18 sessions and testing the market’s nerve as policy and macro signals diverge. The asset briefly retraced to around 64,200 after a broad stock retreat, while a decision by the Trump administration to raise baseline import tariffs to 15% added fresh uncertainty. Yet history cautions against assuming a permanent top when liquidity is in flux: Bitcoin has repeatedly outperformed other risk assets during stressed macro cycles, aided by persistent mining activity and a growing cohort of professional traders using volatility to adjust exposure. In this environment, Bitcoin remains a focal point for liquidity dynamics and institutional positioning, with fundamentals showing resilience even as headlines churn.
Key takeaways
- Historical data suggests Bitcoin often outperforms during trade wars and liquidity injections, even when macro fears are elevated.
- Mining activity has proven resilient, and a shift to net long positions on CME futures signals professional traders are adding exposure on dips.
- Policy shocks, such as tariffs implemented in early April 2025, coincide with sharp price moves—Bitcoin hit a five-month low near 74,600 before staging a subsequent rally.
- The U.S. Federal Reserve’s liquidity facilities have historically been a source of indirect support, with peak repo-like operations sometimes foreshadowing price rebounds in BTC.
- Hashrate recovery and profitable mining hardware at modest electricity costs have reduced tail risks from miner capitulations, helping sustain network fundamentals.
- Market positioning by large speculators flipped from net short to net long on BTC futures, a signal that has sometimes preceded major price bottoms.
Tickers mentioned: $BTC, $NVDA, $ORCL, $MARA, $CRWV
Sentiment: Bullish
Price impact: Positive. Dip-buying by institutions and improving mining fundamentals could support a move back toward key benchmarks.
Trading idea (Not Financial Advice): Hold. Given mixed macro cues, a cautious stance is warranted until price action and policy signals provide clearer direction.
Market context: Liquidity conditions and regulatory developments are shaping near-term outcomes, with network health and futures positioning acting as important indicators for BTC’s trajectory.
Why it matters
Bitcoin’s resilience amid policy jitters matters because it tests the narrative of crypto as a hedge in times of macro stress. When governments signal tighter control or aggressive tariff actions, liquidity dynamics often determine whether risk assets liquidate or rotate into alternatives with unique inflation-hedging characteristics. The fact that miners’ revenue streams have remained resilient, and that professional traders have shifted toward net long exposure on futures, adds a layer of credibility to the idea that BTC can stabilize and recover rather than cascade lower during periods of uncertainty.
Another dimension is the health of the mining sector. With 2024 and 2025 ASICs continuing to operate profitably at practical energy costs around $0.07 per kilowatt-hour, miners have less incentive to withdraw from the network even as AI-fueled tech equities face tighter funding. This reduces systemic risk linked to hash rate collapse and supports on-chain activity. The interplay between policy developments and the macro funding environment remains a central driver for BTC, and current data points suggest a favorable tilt for a potential retest of higher levels in the near term. For readers tracking the broader ecosystem, recent company dynamics—such as MARA’s stake in Exaion—underscore how mining-related investments are increasingly intertwining with data-center and AI-capital narratives.
In parallel, a shift in trader positioning has emerged as a recurring theme. A CFTC report published last week highlighted that large speculators on CME Bitcoin futures moved from a net short to a net long posture, a pattern that has, in past cycles, preceded sizeable price bottoms. While no single indicator confirms a bottom, the combination of improving miner fundamentals, a potential stabilization of liquidity metrics, and a cautious, yet constructive, positioning backdrop can augur a more constructive tone for the BTC market in the weeks ahead. The price action already reflected a bounce from the mid-60ks toward the 75k area in the near term, and market participants will be watching how this dynamic interacts with ongoing macro developments and policy updates.
What to watch next
- The latest CME Bitcoin futures positioning data from the CFTC showing net long shifts among large speculators.
- Hashrate and miner profitability trends, especially at around $0.07/kWh energy costs.
- Policy developments—new tariffs or liquidity actions—that could impact risk sentiment.
- Upcoming earnings or funding moves in the AI hardware and data-center space, including Nvidia results.
- Price action around the $75,000 level and whether BTC tests this midpoint in the coming weeks.
Sources & verification
- Executive orders on reciprocal tariffs issued in early April 2025 and subsequent tariff actions affecting major trading partners.
- CFTC report detailing the shift from net short to net long on CME Bitcoin futures.
- HashRateIndex data on miner gross profits at a power cost of $0.07/kWh.
- Bitcoin’s price responses during the 2020 COVID-19 crash and subsequent multi-month rally to the $42,000 level.
- Industry reference to MARA’s stake in Exaion and the broader mining sector’s status.
Bitcoin resilience amid policy jitters and miners’ rebound
Bitcoin (CRYPTO: BTC) has weathered a fresh bout of volatility as traders reassess risk in a climate of heightened policy scrutiny. After drifting below the psychological 75,000 mark for 18 sessions, the digital asset touched a low near 64,200 as global equities pulled back. The catalyst was a wave of tariff actions announced in early April 2025, including reciprocal duties across many trading partners and a 34% levy targeting China by April 9. The immediate backdrop was, in many ways, a reminder of how macro policy can ripple through risk assets even asBitcoin continues to attract a dedicated pool of long-term holders and enthusiasts. Yet the price reaction also underscored a familiar pattern: when liquidity conditions tighten, BTC often behaves unlike traditional equities, with the potential for outsized rebounds when sentiment stabilizes.
From a structural perspective, Bitcoin’s network has shown considerable resilience. The mining sector—with ASICs deployed in 2024 and 2025—has remained profitable at modest energy costs, reducing the risk of mass capitulations that could threaten hash rate. The observable improvement in the hashrate relative to earlier delays helped counter fears of a miner “death spiral” and supported on-chain activity. This improvement matters more than flat price moves because a robust hash rate underpins transaction throughput and security, which in turn sustains confidence among holders and developers alike. For investors following the mining landscape, the narrative has shifted from existential risk to a more nuanced assessment of profitability and supply dynamics, with miners continuing to contribute to BTC’s forward resilience.
The macro narrative around policy and liquidity remains a central force. The U.S. Federal Reserve’s liquidity facilities—lending against Treasuries to smooth funding markets—have historically influenced risk appetite, even if not always framed as direct injections. In past episodes, peaks in such operations have often coincided with safer moments for risk assets, including BTC, as market participants anticipate a policy environment that will eventually stabilize. In the current cycle, traders are poring over data on repo-like operations and balance-sheet conditions to gauge whether a more accommodative liquidity backdrop could re-emerge, providing a tailwind for BTC in the weeks ahead. The discussion around liquidity is complemented by linked policy moves, such as the tariff actions described above, which can amplify risk-off or risk-on impulses depending on how the broader economy absorbs the shocks and whether policymakers offer mitigants or liquidity backstops.
Adding another layer to the story, institutional players have started to reallocate exposure during pullbacks. A recent analysis noted that professional traders used the dip to add Bitcoin exposure, with long positions on CME futures expanding at a pace that historically signals a renewed appetite for BTC among sophisticated funds. That shift aligns with the broader narrative of a maturing market where liquidity, hedging demand, and macro risk sentiment converge to form potential baselines for a recovery. In parallel, the data points cited in industry commentary—such as MARA’s stake in Exaion—highlight how capital moves within the mining and AI infrastructure ecosystem can influence both sentiment and the capital flows into related hardware and data-center ventures. For traders and observers, this confluence of mining fundamentals, futures positioning, and policy dynamics provides a clearer, albeit still uncertain, path toward higher levels if the catalysts align.
Looking ahead, the near-term trajectory will likely hinge on how quickly the macro environment absorbs tariff signals, how the liquidity backdrop evolves, and whether Bitcoin can sustain a momentum lead beyond the 75,000 threshold. The market has shown a capacity to rally after drawdowns tied to policy shocks, as evidenced by the 38% rebound observed in the month following the initial low. If this dynamic persists, BTC could carve a path back toward the mid- to upper-70s in the coming weeks, aided by a combination of supportive hashrate trends, a possible shift in futures positioning, and any signs that macro liquidity will re-enter the system with a clear framework. In the meantime, investors will be watching for more granular signals—from CME futures data to mining profitability metrics—that can help distinguish a temporary bounce from the beginning of a sustained upcycle.


Spot Bitcoin ETFs are on track for a fourth consecutive month of net outflows as BTC approaches another negative monthly close in February, underscoring a demand lull for regulated, spot-linked exposure. Data through mid-February show ETF holdings ebbing from a peak in late 2025, with total assets sitting around $84.3 billion on the day, down from an October 2025 high near $170 billion. The trajectory also reveals a slowdown in cumulative inflows, which have slipped to roughly $54 billion from a $63 billion all-time high. Since July 2025, net inflows have totaled only about $5 billion, highlighting a marked shift in capital allocation to crypto-focused funds. Meanwhile, Bitcoin’s price has slid more sharply than its ETF balances, suggesting the market is absorbing selling pressure without a commensurate bounce in ETF demand.
Key takeaways
- US spot Bitcoin ETFs have declined from about $170 billion in October 2025 to roughly $84.3 billion, signaling waning investor appetite for regulated BTC exposure.
- Cumulative net inflows have plunged to around $54 billion from a $63 billion peak, with only about $5 billion of inflows since July 2025, indicating a sustained slowdown in new capital input.
- Over seven sessions from Feb. 12 to Feb. 19, ETF outflows totaled 11,042 BTC, with Feb. 12 recording a single-day drop of 6,120 BTC (about $416 million at the time).
- Balance reductions among leading participants are sizable: BlackRock’s IBIT holdings fell to 759,000 BTC from 806,000 BTC, a roughly 6% decline, while Fidelity’s FBTC dropped to 186,000 BTC from 213,000 BTC, or about 12.6%.
- Gold ETFs have displaced some attention as risk-on markets ebb and flow, with flows rotating between BTC and gold over the past two years while macro yields remain a focal point for risk appetite.
Tickers mentioned: $BTC, $IBIT, $FBTC
Sentiment: Bearish
Price impact: Negative. Bitcoin’s price has dropped more sharply than ETF holdings, suggesting selling pressure is not yet being countered by renewed ETF demand.
Market context: The ETF flows unfold against a backdrop of a cooling macro environment. The Federal Reserve ended quantitative tightening in December 2025, halting the balance-sheet runoff, yet policy remains restrictive relative to growth expectations. The 2-year Treasury yield persists above 2-year rate expectations, while the 10-year yield trades around 4.1% with the 10-year real yield near 1.7%–1.8%, maintaining tight financial conditions that constrain non-yielding assets like Bitcoin. In this environment, real yields provide an inflation-adjusted return elsewhere, raising the opportunity cost of holding BTC for some investors.
Why it matters
The persistence of outflows in spot Bitcoin ETFs matters because these products are often viewed as liquidity proxies for the broader crypto market. A sustained decline in ETF AUM can indicate a mismatch between price signals and the willingness of institutions to deploy capital through regulated vehicles. The current pattern—outflows outpacing price declines—suggests that, at least for now, soft demand from ETF products is not rekindling upside momentum for Bitcoin. In practice, this means the spot ETF framework may continue to act as a source of supply in the near term, potentially suppressing price recoveries even when spot demand revives in other market segments.
Macro forces are clearly in play. The retreat in ETF inflows coincides with a regime in which real yields remain elevated and monetary policy stays comparatively tight. As Benjamin Cowen notes, the first quarter of 2026 could be characterized as a “late-cycle restrictive digestion” phase for both equities and crypto, where investors demand higher clarity on inflation, growth, and policy trajectories before reaccelerating risk assets. The interplay between rate expectations and risk sentiment is particularly relevant for BTC, which historically has shown sensitivity to changes in real yields and liquidity conditions. The absence of a clear easing signal for yields or balance-sheet expansion has contributed to a cautious stance among ETF buyers and larger holders alike. Cowen’s macro assessment, drawing on research and market cycles, emphasizes that durable ETF inflows historically arrive when real yields decline or policy relaxation appears imminent, conditions that have not yet materialized.
From a broader asset-allocation perspective, the Bitcoin-versus-gold dynamic remains a recurring theme. Over the past two years, the flows into Bitcoin and gold ETFs have alternated as investors sought a balance between liquidity, volatility, and duration of drawdowns. Gold’s inflows surged during risk-off periods, while Bitcoin’s exposure lagged, reflecting a preference for assets perceived as less volatile or offering longer-standing track records in uncertain times. This rotation underscores that macro risk appetite, rather than BTC-specific catalysts alone, often drives ETF flows. Investors watching for catalysts in 2026 should consider how shifts in macro policy, inflation expectations, and risk sentiment could tilt the balance back toward crypto ETFs or push further capital toward more traditional hedges like gold.
In the near term, the lack of a sustained shift in ETF inflows may keep BTC price action more dependent on macro headlines and on-chain signals rather than fund-flow-driven recuperation. The market will likely pay close attention to any signs of three consecutive positive ETF sessions, which many observers consider a potential signal of renewed accumulation, as well as any shifts in the policy stance that could reopen the tap on liquidity. The ongoing story is not solely about the price of Bitcoin but about how institutional appetite for regulated exposure evolves as the macro landscape matures through 2026.
What to watch next
- Monitor for three consecutive days of net ETF inflows or a sustained turnaround in holdings, which could signal renewed institutional demand for spot BTC exposure.
- Watch for any policy shifts from the Federal Reserve or commentary from officials that could alter the path of real yields and liquidity conditions.
- Track changes in the BTC price relative to ETF AUM and rolling net flows to gauge whether price action starts to outpace or lag the flows again.
- Observe movements in competitor assets, such as gold ETFs, for signs of continued rotation or a rebalancing that favors one category over the other during risk-on or risk-off phases.
- Assess updates from major ETF issuers and custodians, particularly around new product launches or changes in holdings, for indications of evolving investor demand.
Sources & verification
- Seven-session BTC ETF net outflows and the Feb. 12 single-day drop (6,120 BTC) analysis by Axel Adler Jr on X: https://x.com/AxelAdlerJr/status/2024397434818859427?s=20
- Bitcoin ETF assets and CheckOnChain data showing IBIT and FBTC holdings changes: https://charts.checkonchain.com/btconchain/etfs/etf_balance_0/etf_balance_0_light.html
- FBTC holdings data corroborating the decline from 213,000 BTC to 186,000 BTC: https://charts.checkonchain.com/btconchain/etfs/etf_balance_0/etf_balance_0_light.html
- Bold.report flow comparisons between Bitcoin and Gold inflows: https://bold.report/compare/flows/
- Macro risk memo from Benjamin Cowen outlining the late-cycle digestion framework for 2026: https://www.benjamincowen.com/reports/macro-risk-memo-feb-2026
- Cointelegraph coverage and Bitcoin price context linked for price reference: https://cointelegraph.com/bitcoin-price
Bitcoin ETF outflows persist as macro conditions weigh on BTC demand
Bitcoin ETF dynamics reveal that even with a lower price baseline than late-2025 peaks, the appetite for regulated spot exposure remains constrained. The first substantial wave of outflows began to dominate the narrative as October’s peak enthusiasm receded. Data show that, through the February period, major ETF products continued to be light on new capital, with several days registering net decreases in asset under management. The scale of these outflows—11,042 BTC across a seven-day window—emphasizes a market where traders and institutions are assessing whether BTC can re-enter a more favorable risk-reward equation or whether the current regime will persist longer than anticipated.
BlackRock and Fidelity—two of the largest ETF providers with significant spot BTC offerings—have not been immune to the shift in demand. IBIT’s holdings declined to about 759,000 BTC while FBTC slipped to around 186,000 BTC, illustrating that even heavyweight participants are managing exposure in line with broader market sentiment. The observed pattern—BTC price falling more than ETF balances—suggests that price discovery is being driven more by market liquidity and order flow than by the absorption of new ETF inflows. In other words, the ETF structure may be acting as a pressure valve, releasing BTC onto the market even as buyers remain cautious rather than aggressively expanding exposure.
The phenomenon is taking place alongside a broader cross-asset flow environment. Gold ETFs, which have historically competed with Bitcoin during risk-off phases, have been increasingly in the spotlight as investors sought instruments with different risk profiles and volatility characteristics. The rotation between BTC and gold flows, documented in recent flow-tracking studies, implies a nuanced investor stance: seek yield or capital preservation in more familiar assets during periods of macro uncertainty, then pivot as conditions shift. This dynamic underscores a key theme for 2026—macro-driven capital allocation can overshadow single-asset narratives, even in a space as attention-grabbing as cryptocurrency.
Insurance for risk? For now, the answer appears to be a cautious stance. The macro backdrop—where the Fed halted QT but policy remains tight—means investors must balance inflationary expectations, growth trajectories, and the opportunity costs of holding non-yielding assets. The narrative that “durable ETF inflows are likely to materialize only after real yields retreat or policy easing emerges” remains a guiding hypothesis for market participants. In practice, that means the market is likely to continue to weigh BTC exposure against the relative attractiveness of other assets, with ETF inflows sensitive to shifts in rate expectations and liquidity conditions rather than outright price gains alone.
The coming months will be telling. If BTC begins to see three or more consecutive positive ETF sessions or if macro indicators tilt toward easier policy, ETF demand could reassert itself. Conversely, if the real-yield environment remains supportive of safer assets or if risk sentiment deteriorates, BTC may face continued headwinds regardless of technical indicators or on-chain signals. The evolving interplay between ETF flows, macro policy, and price action will remain central to how investors structure crypto exposure in 2026.

TLDR
- Ripple USD has reached a market capitalization of $1.56 billion with 1.55 billion tokens in circulation.
- RLUSD is now less than $500 million away from achieving the $2 billion market cap milestone.
- Ripple minted $40 million worth of RLUSD on Ethereum earlier this week.
- Daily trading volumes for RLUSD have remained above $43 million, with several sessions exceeding $100 million.
- RLUSD has maintained its $1 peg despite broader weakness in the crypto market.
Ripple’s USD (RLUSD)-backed stablecoin approaches a new supply milestone as market capitalization reaches $1.56 billion. Circulating supply stands at 1.55 billion tokens, according to CoinMarketCap data. The token now sits less than $500 million away from the $2 billion level.
Ripple USD Supply Growth Nears $2 Billion Mark
Ripple USD recorded a $40 million mint on Ethereum earlier this week. The mint increased total supply while daily trading volume stayed above $43 million.
Data shows RLUSD has maintained volumes above $100 million on several recent sessions. At the same time, the token has held its $1 peg during broader crypto market weakness.
Ripple has expanded RLUSD distribution through regulated financial channels. The company continues to position the stablecoin within traditional finance infrastructure.
Deutsche Bank integrated Ripple technology for cross-border payments this week. The integration supports Ripple’s broader push into regulated payment systems.
Société Générale also expanded its MiCA-compliant euro stablecoin onto the XRP Ledger. This move connects European regulated assets with Ripple’s blockchain network.
Ripple has outlined plans for a Japan rollout with SBI Holdings. Market participants track this expansion as part of RLUSD’s international growth.
The company also continues its pursuit of a U.S. National Trust Charter. Regulatory approval would support further institutional adoption of Ripple USD.
Institutional Strategy Supports RLUSD Expansion
Ripple has spent nearly $3 billion on acquisitions tied to financial infrastructure. Executives describe the strategy as focused on compliance and institutional utility.
The company has referred to its approach as “boring is better” in prior statements. This positioning emphasizes oversight and integration over speculative growth.
RLUSD differs from XRP because its growth depends on circulating supply. Each new token enters circulation through minting tied to demand.
Supply growth reflects usage across payment and settlement channels. Ripple links this expansion to partnerships with regulated financial entities.
Recent market conditions have pressured many crypto assets. However, RLUSD has remained stable and preserved its dollar peg.
Trading activity has continued even during periods of broader asset declines. Volume data supports consistent liquidity across major exchanges.
If current minting trends continue, RLUSD could cross $2 billion by early Q2 2026. The projection follows current supply growth patterns and institutional integrations.

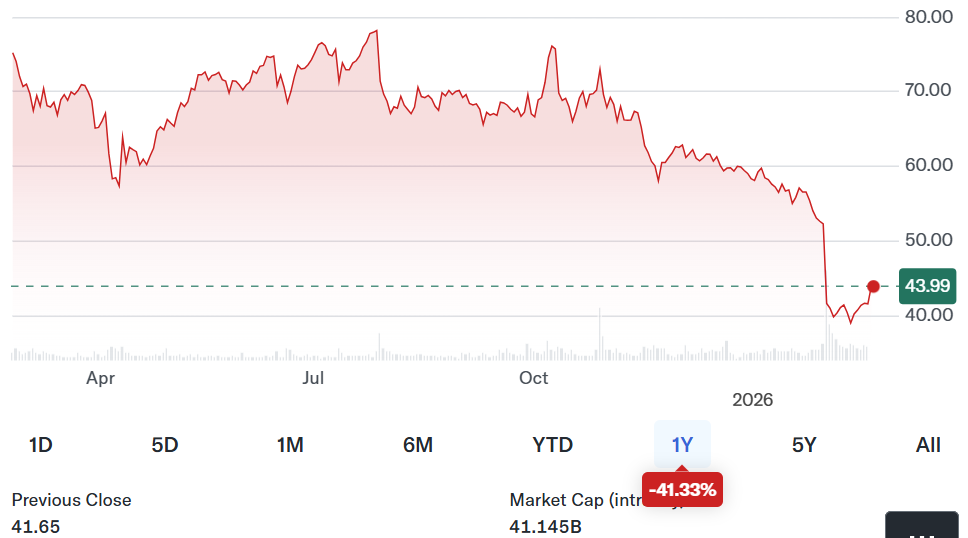
PayPal Holdings has reportedly attracted unsolicited takeover interest after a prolonged stock slump left the payments giant trading well below recent highs, signaling that competitors were looking to consolidate their footprint in the digital payments space.
Citing people familiar with the matter, Bloomberg reported Monday that PayPal has been meeting with banks to review buyout approaches from unnamed investors. One potential bidder — described as an industry rival — is said to be exploring an acquisition of the entire company, while others have expressed interest in specific PayPal assets.
There is no guarantee a deal will materialize, and discussions remain at an early stage, the report said.
Shares jumped following the news, but the rebound only partly offsets a bruising year for investors. PayPal stock had fallen roughly 46% over the past 12 months before Monday’s report, according to market data. Shares were up more than 6% on Monday.

The company has pivoted toward digital assets as part of its turnaround strategy. Then-CEO Alex Chriss positioned stablecoins as a way to address what he described as the “innovator’s dilemma” — the risk that established companies become too reliant on legacy products and miss disruptive technological shifts.
Earlier this month, Chriss was removed from the job following disappointing fourth-quarter 2025 financial results. Enrique Lores, currently HP’s CEO, was tapped to lead PayPal through its next phase.
Related: YouTube enables PYUSD stablecoin payouts for US creators: Report
Despite struggles, PayPal’s crypto push gains traction
Although PayPal’s broader turnaround has been uneven, its expansion into digital assets has produced measurable results.
Its dollar-pegged stablecoin, PayPal USD (PYUSD), has surpassed $4 billion in market capitalization, making it the sixth-largest stablecoin globally. It now trails only USDt (USDT), USDC (USDC), Ethena USDe (USDe), Dai (DAI) and World Liberty Financial USD (USD1), according to market data.

Beyond issuing its own stablecoin, PayPal has expanded its crypto payments infrastructure. The company recently introduced shareable payment links that allow users to send cryptocurrencies and stablecoins through peer-to-peer transfers, broadening access beyond traditional wallet-to-wallet transactions.
Earlier in 2025, PayPal also launched “Pay with Crypto,” a blockchain-based settlement service that lets merchants accept digital asset payments while receiving funds in fiat currency. The offering reflects PayPal’s push to position itself as a bridge between traditional payments and on-chain settlement.
However, neither initiative was mentioned earlier this month in the company’s earnings announcement nor on management’s subsequent call with analysts.
Related: Stablecore’s Jack Henry integration opens stablecoins to 1,600 banks
TLDR
- Binance.US plans to expand its US operations after the SEC dismissed its 2023 lawsuit with prejudice.
- Changpeng Zhao said a clearer regulatory climate could support deeper banking partnerships and a possible financial charter.
- The SEC dropped the case following a policy shift and a mutual agreement between regulators and the exchange.
- Binance. US had suspended dollar deposits and withdrawals for about eighteen months during the legal dispute.
- Binance agreed to pay $4.3 billion in penalties in 2023 over anti-money laundering violations.
Binance.US plans expansion in the United States after regulators dropped their 2023 lawsuit. Changpeng Zhao outlined the path forward in a Bloomberg News interview. He said improved rules could support deeper banking ties and a financial charter.
The SEC dismissed its civil case with prejudice last May. The agency and the exchange reached a mutual agreement after policy changes.
The lawsuit had accused Binance entities of operating an unregistered exchange. Regulators also alleged the sale of unregistered securities in thirteen counts.
Binance.US Moves to Restore Banking Access
Binance.US now seeks restored dollar services after an eighteen-month suspension. Trading volumes fell sharply during the freeze and weakened its market share.
Zhao said a friendlier climate could enable stronger banking partnerships. He added that charter discussions depend on legal and management decisions.
Binance.US restored some services after regulators eased federal oversight restrictions. The platform seeks new banking partners across several major states.
Executives review compliance systems to meet updated federal regulatory standards. They plan to do outreach with regulators and community banks this year.
The company hired staff focused on risk management and controls. It also rebuilt relationships with payment processors nationwide and custodians.
Legal Resolution and Leadership Clarifications
Zhao clarified that his comments applied only to the US platform. He said international operations follow separate strategies and structures.
He remains the largest shareholder but holds no executive role. He stated that he will not return as chief executive.
He served four months in prison after pleading guilty to violations. A presidential pardon followed his release in September 2024.
Speculation arose about potential talks between the Trump family and Binance. Zhao denied any business ties with World Liberty Financial.
He dismissed claims about executive discussions after receiving the pardon. He repeated that leadership changes depend on corporate governance processes.
Regulatory Shift and Financial Penalties
Binance agreed to pay 4.3 billion dollars in penalties in 2023. Authorities tied the settlement to anti-money laundering compliance failures.
The case reshaped the company’s operations within the United States market. It halted fiat channels and limited customer access for months.
Under the Trump administration, regulators dropped several crypto enforcement actions. Paul Atkins now leads the SEC and formed a Crypto Task Force.
The agency says it prefers structured rules over courtroom battles. Officials aim to balance investor protection with market innovation.

Strategy CEO Michael Saylor dismissed concerns about quantum computing during an appearance on Natalie Brunell’s Coin Stories podcast, saying the cybersecurity community broadly agrees that any credible quantum threat is likely more than a decade away.
While it remains unclear if or when a quantum risk might materialize, Saylor told the podcast host that any credible breakthrough would prompt coordinated software upgrades across global banking systems, internet infrastructure, consumer devices, artificial intelligence networks and crypto protocols, including Bitcoin (BTC).
Saylor said the digital systems underpinning modern digital infrastructure would eventually adopt post-quantum-resistant cryptography if necessary, adding that such a shift would not come as a surprise.
“You’ll see it coming. We’ll all see it coming,” he said, adding that Bitcoin’s software is designed to change over time, with nodes, hardware, and wallets capable of upgrading in response to emerging threats.

In his view, global consensus on how to respond would emerge only if a credible threat develops, noting that governments, technology companies and financial institutions would all face the same risk to their digital systems.
He also described the crypto sector as the “most sophisticated cybersecurity community,” pointing to the multi-factor authentication and hardware key protections commonly used to secure digital assets.
In his view, the procedures required to move Bitcoin are significantly more rigorous than the security standards used for traditional bank wires or stock trading systems. Saylor said:
“I think the crypto community will be the first to perceive the threat, and to react to the threat, and they’ll be leading the way.”
Quantum computing is an emerging field of computation that uses quantum mechanics to process information far faster than classical computers, prompting concerns that advanced machines could eventually break the cryptography securing Bitcoin and other digital assets.
Saylor’s Strategy is the largest Bitcoin treasury company in the world. On Monday, the Tysons Corner, Virginia-based company announced it had purchased 592 Bitcoin for roughly $39.8 million last week, its 100th acquisition since adopting a Bitcoin treasury strategy in August 2020.
It currently holds 717,722 BTC, acquired for about $54.56 billion at an average price of $67,286 per coin.

Related: Willy Woo warns quantum risk is eroding Bitcoin’s edge over gold
The ongoing quantum debate in crypto
While Michael Saylor, one of Bitcoin’s most prominent advocates, has downplayed the risks posed by quantum computing, others in the crypto industry appear more worried about the threat.
One of them is Ethereum (ETH) co-founder Vitalik Buterin, who in late 2025 cited Metaculus, a forecasting platform, that suggested around a 20% chance that quantum computers capable of breaking current cryptography could emerge before 2030, with a median estimate around 2040.
Speaking months later at Devconnect in Buenos Aires, he warned that elliptic curve cryptography, which underpins Ethereum and Bitcoin, could fail before the 2028 US presidential election and urged a transition to quantum-resistant systems within the next four years.
The Ethereum Foundation has incorporated post-quantum preparedness into its 2026 security roadmap, with researcher Justin Drake announcing on Jan. 24 that a dedicated Post-Quantum team had been formed, describing the move as a turning point in the foundation’s long-term quantum strategy.
The quantum threat has even caused some to speculate its the reason behind the Bitcoin’s recent price decline, which has fallen from highs of over $126,000 in October to its current price of around $64,000.
In January, Castle Island Ventures partner Nic Carter said Bitcoin’s “mysterious” underperformance could be attributed to quantum risk concerns, saying that markets were reacting even if developers were not.
That view drew pushback, with Glassnode analyst James Check writing that quantum computing plans should be put in place, but the threat is not the “primary reason” behind the decline in price.

Magazine: Bitcoin may take 7 years to upgrade to post-quantum: BIP-360 co-author

Crypto funds recorded $288 million in outflows last week, marking the fifth consecutive week of declines, according to the latest weekly report from CoinShares.
Summary
- Digital asset investment products saw $288 million in weekly outflows, marking the fifth consecutive week of withdrawals and bringing the cumulative total to $4 billion over the period.
- The United States led redemptions with $347 million in outflows, while Europe and Canada recorded modest inflows, highlighting a regional divergence in sentiment.
- Bitcoin accounted for the bulk of withdrawals, while short-bitcoin products and select altcoins such as XRP and Solana saw minor inflows.
US sells, Europe buys: Crypto funds show sharp regional divide
The latest withdrawals bring cumulative outflows over the current stretch to $4.0 billion, highlighting persistent weakness in investor sentiment.
Trading activity also cooled significantly. Total volumes across crypto exchange-traded products fell to $17 billion, the lowest level since July 2025, after several weeks of elevated turnover. The sharp decline in activity suggests growing investor apathy following recent market turbulence.
Regional flows reveal a widening divergence in sentiment.
The United States accounted for $347 million in outflows, reflecting continued caution among U.S. investors. In contrast, Europe and Canada recorded a combined $59 million in inflows, as some investors appeared to view recent price weakness as a buying opportunity.
Switzerland led regional inflows with $19.5 million, followed by Canada at $16.8 million and Germany at $16.2 million.
Bitcoin leads $288M weekly outflows
Bitcoin (BTC) remained the primary driver of weakness, with $215 million in outflows, representing the largest share of redemptions. Meanwhile, short-bitcoin products saw $5.5 million in inflows, the highest of any category, suggesting some investors are positioning for further downside.
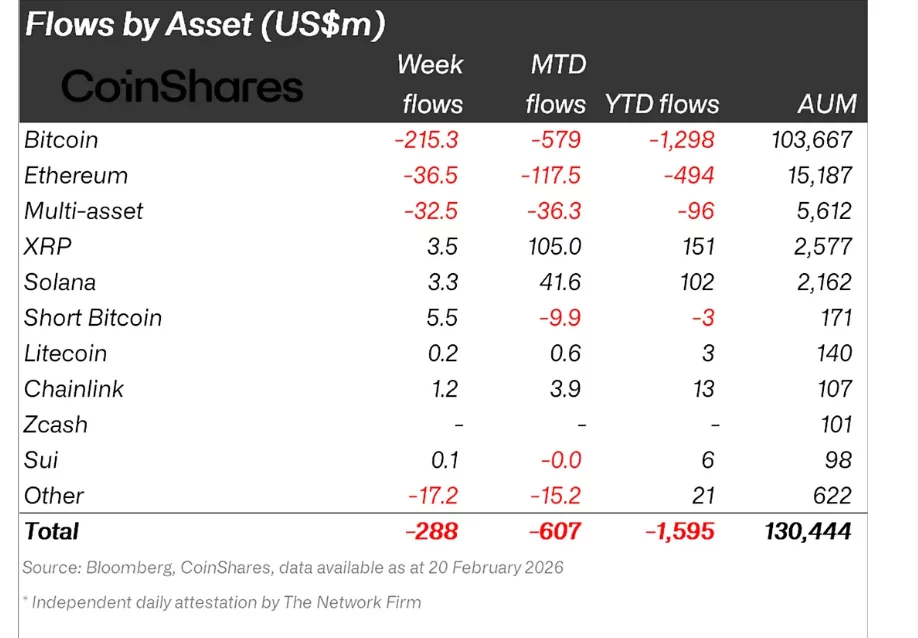
Ethereum (ETH) experienced the second-largest withdrawals at $36.5 million, while multi-asset products and Tron saw outflows of $32.5 million and $18.9 million, respectively.
Among altcoins, minor inflows were recorded in XRP ($3.5 million), Solana ($3.3 million), and Chainlink ($1.2 million), though these were insufficient to offset broader market weakness.
Despite the ongoing selloff, total assets under management remain substantial at $130.4 billion, indicating that while sentiment is subdued, institutional exposure to digital assets persists.
Crypto World
Strange New Chinese AI ‘KIMI’ Predicts the Price of XRP, PEPE and Cardano By the End of 2026
Feeding KIMI AI carefully worded prompts unlocks eye-popping 2026 price outlooks for XRP, Pepe, and Cardano heading into 2026.
Based on KIMI’s data-driven models, all three could deliver gains of at least 5x by the end of next year.
Below we assess how realistic KIMI’s targets are.
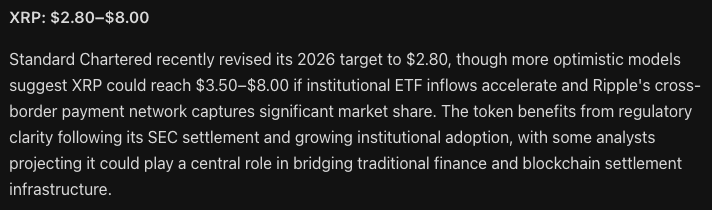
XRP ($XRP): KIMI Maps a Longer-Term Route Toward $8
In a recent update, Ripple reiterated that XRP ($XRP) remains the cornerstone of its plan to establish the XRP Ledger as a global, enterprise-ready payments infrastructure.

With fast settlement times and negligible transaction costs, the XRP Ledger could capture meaningful share in two rapidly expanding segments of crypto adoption: stablecoins and tokenized real-world assets.
XRP currently trades near $1.40. According to KIMI’s extended forecast model, the token could advance to $8 by the end of 2026, implying a near sixfold increase.
Market indicators support this outlook. XRP’s Relative Strength Index (RSI) sits around 39 and rising, while price action remains below the 30-day moving average, conditions that suggest now presents an attractive accumulation zone.
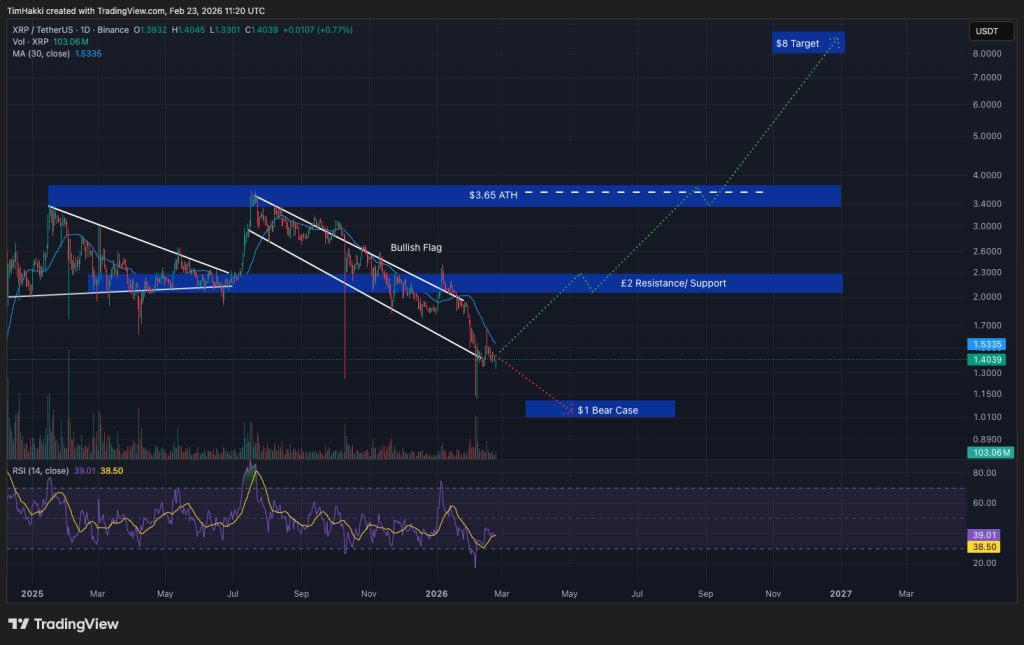
Additional momentum could come from multiple sources, including institutional demand following the approval of U.S.-listed XRP ETFs, Ripple’s growing network of global partnerships, and potential regulatory clarity if the U.S. CLARITY bill advances this year.
Pepe ($PEPE): KIMI Teases a 2,300% Upside Scenario
Pepe ($PEPE), launched in April 2023, has since become the largest meme coin outside the doge category, with a market capitalization of $1.7 billion.
Derived from Matt Furie’s “Boy’s Club” comics, PEPE’s instantly recognizable avatar and strong cultural resonance have kept it in the spotlight across social platforms.
Despite intense competition in the meme coin space, PEPE has maintained its leadership thanks to a loyal community and the many copycat tokens it has inspired.
Occasional cryptic posts from Elon Musk on X have also fueled speculation that PEPE may rank alongside DOGE and BTC in his personal portfolio.
At the time of writing, PEPE trades around $0.0000041, roughly 85% below its December 2024 ATH of $0.00002803.
Under KIMI’s most aggressive assumptions, PEPE could rally nearly 2,300% this year, climbing to $0.000098 and decisively surpassing its previous record.
Cardano (ADA): KIMI Gives Hoskinson’s ETH Contender 1,300% Gains
Founded by Charles Hoskinson, Cardano ($ADA) emphasizes peer-reviewed research, high security standards, scalability, and long-term network sustainability.
With a market capitalization near $10 billion and over $128 million in total value locked (TVL), Cardano’s ecosystem continues growing despite the downturn.
KIMI’s projections suggest ADA could climb slightly above 1,300%, rising from about $0.27 today to nearly $3.80 by the end of 2026. That level would place it well above its 2021 peak of $3.09.
However, ADA is currently trading at its lowest level since October 2024.
Given the volatile market conditions seen this year, further downside is possible, including a possible collapse down to $0.15 in a bear market.
Maxi Doge: A New Meme Contender Emerges as Majors Target Higher Levels
Pepe’s inherent meme coin magic (volatility) means KIMI thinks it could 24x this year. However, given its large market cap, even Pepe’s headroom for growth is limited by its size.
Maxi Doge ($MAXI) is not, however. Having raised $4.6 million so far in its ongoing presale, it’s one of the hottest under-the-radar meme coins around.
The project centers on Maxi Doge, a brash, gym-obsessed, unapologetically degen alpha doge and an envious distant cousin and self-proclaimed rival to Dogecoin.
Its tone and branding tap directly into the raw, irreverent energy that powered the 2021 meme coin boom.
MAXI is an ERC-20 token built on Ethereum’s proof-of-stake network, giving it a far smaller environmental footprint than Dogecoin’s proof-of-work model.
Early presale buyers can currently stake MAXI tokens for yields of up to 67% APY, with rewards decreasing as the staking pool expands.
The token is currently selling for $0.0002805, with automatic price increases at each funding milestone. Purchases are supported through wallets such as MetaMask and Best Wallet.
Stay updated through Maxi Doge’s official X and Telegram pages.
Visit the Official Website Here.
The post Strange New Chinese AI ‘KIMI’ Predicts the Price of XRP, PEPE and Cardano By the End of 2026 appeared first on Cryptonews.
Crypto World
World Liberty Financial Claims Hackers and Paid FUD Targeted USD1 in Orchestrated Market Attack
TLDR:
- World Liberty Financial alleged that several WLFI co-founder accounts were hacked during the Tuesday attack.
- Paid influencers reportedly spread fear and uncertainty to trigger a short-term sell-off in USD1 markets.
- USD1 briefly depegged to 0.9802 USDT before recovering to its intended $1.00 par value quickly.
- Eric Trump deleted WLFI-related posts on X, causing the token to briefly fall more than 8% in value.
World Liberty Financial reported a coordinated attack against its USD1 stablecoin on Monday morning. The project alleged that several co-founder accounts were hacked, influencers were paid to spread fear, uncertainty, and doubt, and large short positions were opened to profit from the resulting volatility.
USD1 briefly dipped to 0.9802 USDT before recovering to its $1.00 peg. WLFI credited its full 1:1 asset backing and mint-and-redeem mechanism for the quick recovery.
World Liberty Financial Alleges a Three-Part Coordinated Campaign
World Liberty Financial reported that the attack followed a structured and deliberate pattern. Hackers gained unauthorized access to several WLFI co-founder accounts on social media. Those accounts were then used to push misleading information to a broad audience.
Shortly after, paid influencers reportedly amplified the negative messaging across multiple platforms. The manufactured narrative was designed to erode market confidence in USD1 quickly.
Together, the hacked accounts and coordinated posts created enough panic to trigger a short-term sell-off.
While the social media campaign unfolded, attackers also opened massive short positions on WLFI tokens. This move was timed to profit from the price drop caused by the artificial fear in the market. The strategy reflected a pattern that has been observed in previous coordinated crypto attacks.
World Liberty Financial responded publicly through its verified X account, stating: “A coordinated attack was launched against USD1 this morning. Attackers hacked several WLFI cofounder accounts, paid influencers to spread FUD, and opened massive shorts to profit from the manufactured chaos.” The project urged users to rely only on verified channels going forward.
Eric Trump’s Deleted Posts Contributed to the Brief Market Decline
The reported attack was further compounded when Eric Trump, a WLFI co-founder, deleted several project-related posts on X.
The timing of the deletions coincided with the broader attack already unfolding across the market. Observers and traders quickly flagged the removed content as a point of concern.
Following the deletions, WLFI token prices fell more than 8% within a short window. The drop showed how sensitive crypto markets remain to social media activity, particularly during moments of uncertainty. Even minor shifts in online presence can trigger outsized reactions from market participants.
USD1 also felt the pressure during this period, trading temporarily at 0.9802 USDT against its intended $1.00 peg.
While the deviation was short-lived, any movement away from the peg in a stablecoin draws immediate scrutiny. The price recovered to par shortly after the situation stabilized.
World Liberty Financial maintained that the attack caused no lasting damage to USD1 or its underlying structure.
The team reaffirmed its long-term commitment to the project and noted that the stablecoin’s backing held firm throughout the incident. The full scope of the attack is still being investigated by the WLFI team.
TLDR
- Vitalik Buterin swapped more than 3,100 ETH for stablecoins through CoW Swap in recent days.
- On-chain data shows the transactions totaled over $6.1 million at current market prices.
- His on-chain Ethereum holdings now stand at more than 224,000 ETH valued at about $426 million.
- Buterin previously moved over $29 million in ETH, with at least $2.3 million funding Ethereum Foundation initiatives.
- Ethereum’s price fell below $1,900 and dropped over 36% in the past month.
Vitalik Buterin has continued selling Ethereum (ETH) through decentralized exchanges in recent days. On-chain data shows he swapped thousands of ETH for stablecoins. The latest transactions come as Ethereum’s price trades below $1,900.
Vitalik Buterin Executes Fresh ETH Sales Through CoW Swap
Arkham Intelligence labeled wallets tied to Vitalik Buterin recorded recent swaps on CoW Swap. The data shows he exchanged more than 3,100 ETH for stablecoins over several days.
Those transactions equal more than $6.1 million at current prices. After the swaps, his on-chain holdings stand at over 224,000 ETH.
The remaining balance carries a value of about $426 million. The transfers follow a pattern of routine sales observed in recent weeks.
Earlier, Buterin moved over $29 million worth of Ethereum. At least $2.3 million from that amount supported Ethereum Foundation initiatives.
He previously outlined plans to sell around $44.7 million in ETH. He linked those sales to a period of “mild austerity” for the Foundation.
Buterin said the approach would “ensure the Ethereum Foundation’s own ability to sustain in the long term.” He added it would protect Ethereum’s “core mission and goals.”
Ethereum Price Drops Below $1,900 as Market Weakens
Ethereum’s price has declined during the broader crypto market downturn. ETH has fallen about 4% over the past 24 hours.
The asset recently traded at $1,872 on major exchanges. It earlier touched a two-week low of $1,855 on Sunday.
Over the past month, Ethereum has dropped more than 36%. The token also remains over 62% below its August all-time high of $4,946.
Buterin has also addressed Ethereum’s long-term roadmap in public statements. He said the Ethereum mainnet “needed a new plan” regarding layer-2 scaling networks.
He discussed the relationship between the base layer and scaling chains. He suggested adjustments to strengthen coordination and efficiency.
Last week, Buterin supported a new censorship-resistant upgrade for the network. He said Ethereum was “going hard” on its technical direction.
He also referred to reviving a “cyberphunk” ethos within the ecosystem. These remarks came as developers continued work on protocol upgrades.
The recent ETH sales occurred during this period of roadmap discussion. On-chain data continues to track movements from wallets linked to Vitalik Buterin.


Australian authorities have charged two men following an investigation into an alleged $5 million cryptocurrency investment scam that targeted vulnerable victims across the country.
Summary
- The New South Wales Police Force has charged two men following an investigation into an alleged $5 million cryptocurrency investment scam targeting Australians.
- Police allege victims — including elderly and vulnerable individuals — were lured via social media into depositing funds into a fake trading platform, with money funneled through multiple crypto wallets.
- One man has been charged and granted conditional bail, while investigations continue as authorities warn Australians about rising investment scam losses.
Australia steps up crypto fraud crackdown
The New South Wales Police Force said detectives from its Cybercrime Squad launched Strike Force Resaca to investigate reports of fraudulent online investment activity. Search warrants were executed at properties in Strathfield and Cammeray, as well as a business premises in Burwood, all located in Sydney.
Police allege the scheme lured victims, many described as elderly or financially vulnerable, through social media advertisements and unsolicited messages promoting cryptocurrency and other high-return investment opportunities.
Victims were reportedly directed to deposit funds into what they believed was a legitimate trading platform known as “NEXOpayment.” Australian authorities claim the money was instead funnelled through multiple cryptocurrency wallets and exchanges in an attempt to disguise the movement of funds.
A 42-year-old man was arrested at a Strathfield residence and taken to Auburn Police Station, where he was charged with recklessly dealing with proceeds of crime valued above $5,000. He was granted conditional bail and is scheduled to appear at Burwood Local Court on March 17, 2026.
A 36-year-old man was also arrested at a Cammeray property and later released pending further inquiries.
Police say investigations remain ongoing and are urging anyone who suspects they may have been targeted by an investment scam to report the matter to authorities. Officials reiterated that investment scams remain one of the highest-loss cybercrime categories in Australia.

Are Bitcoin ETFs Accumulating or Not Selling? Key Flow Data

Andrew Mountbatten Windsor used taxpayer money for massages

Manchester United are transformed under Michael Carrick and Benjamin Sesko proves it


-

 Crypto World7 days ago
Can XRP Price Successfully Register a 33% Breakout Past $2?
-

 Video4 days ago
XRP News: XRP Just Entered a New Phase (Almost Nobody Noticed)
-

 Fashion3 days ago
Weekend Open Thread: Boden – Corporette.com
-

 Sports7 days ago
GB's semi-final hopes hang by thread after loss to Switzerland
-

 Politics2 days ago
Baftas 2026: Awards Nominations, Presenters And Performers
-
 Tech7 days ago
The Music Industry Enters Its Less-Is-More Era
-

 Sports7 hours ago
Women’s college basketball rankings: Iowa reenters top 10, Auriemma makes history
-

 Politics8 hours ago
Nick Reiner Enters Plea In Deaths Of Parents Rob And Michele
-

 Business6 days ago
Infosys Limited (INFY) Discusses Tech Transitions and the Unique Aspects of the AI Era Transcript
-

 Entertainment6 days ago
Kunal Nayyar’s Secret Acts Of Kindness Sparks Online Discussion
-

 Video7 days ago
Financial Statement Analysis | Complete Chapter Revision in 10 Minutes | Class 12 Board exam 2026
-

 Tech6 days ago
Retro Rover: LT6502 Laptop Packs 8-Bit Power On The Go
-
 Sports5 days ago
Clearing the boundary, crossing into history: J&K end 67-year wait, enter maiden Ranji Trophy final | Cricket News
-

 Business2 days ago
Mattel’s American Girl brand turns 40, dolls enter a new era
-

 Business1 day ago
Law enforcement kills armed man seeking to enter Trump’s Mar-a-Lago resort, officials say
-

 Entertainment5 days ago
Dolores Catania Blasts Rob Rausch For Turning On ‘Housewives’ On ‘Traitors’
-

 Business6 days ago
Tesla avoids California suspension after ending ‘autopilot’ marketing
-
 NewsBeat16 hours ago
‘Hourly’ method from gastroenterologist ‘helps reduce air travel bloating’
-

 Politics7 days ago
Eurovision Announces UK Act For 2026 Song Contest
-

 Tech1 day ago
Anthropic-Backed Group Enters NY-12 AI PAC Fight