
CryptoCurrency
Ethereum Price Prediction For 2026: Bearish Still?

Ethereum ends 2025 near $2,970 after a messy quarter. The market is divided. Some analysts expect the next growth cycle to begin. Others warn that the structure is still uncertain or mixed.
The truth sits in the middle. The chart hints at pressure, the seasonality record is shaky, and on-chain flows show early support but not conviction.
The setup going into 2026 is not clean. The question is simple: is Ethereum preparing for recovery, or setting up another leg down?
Bearish Price Structure Meets A Historically Volatile Start
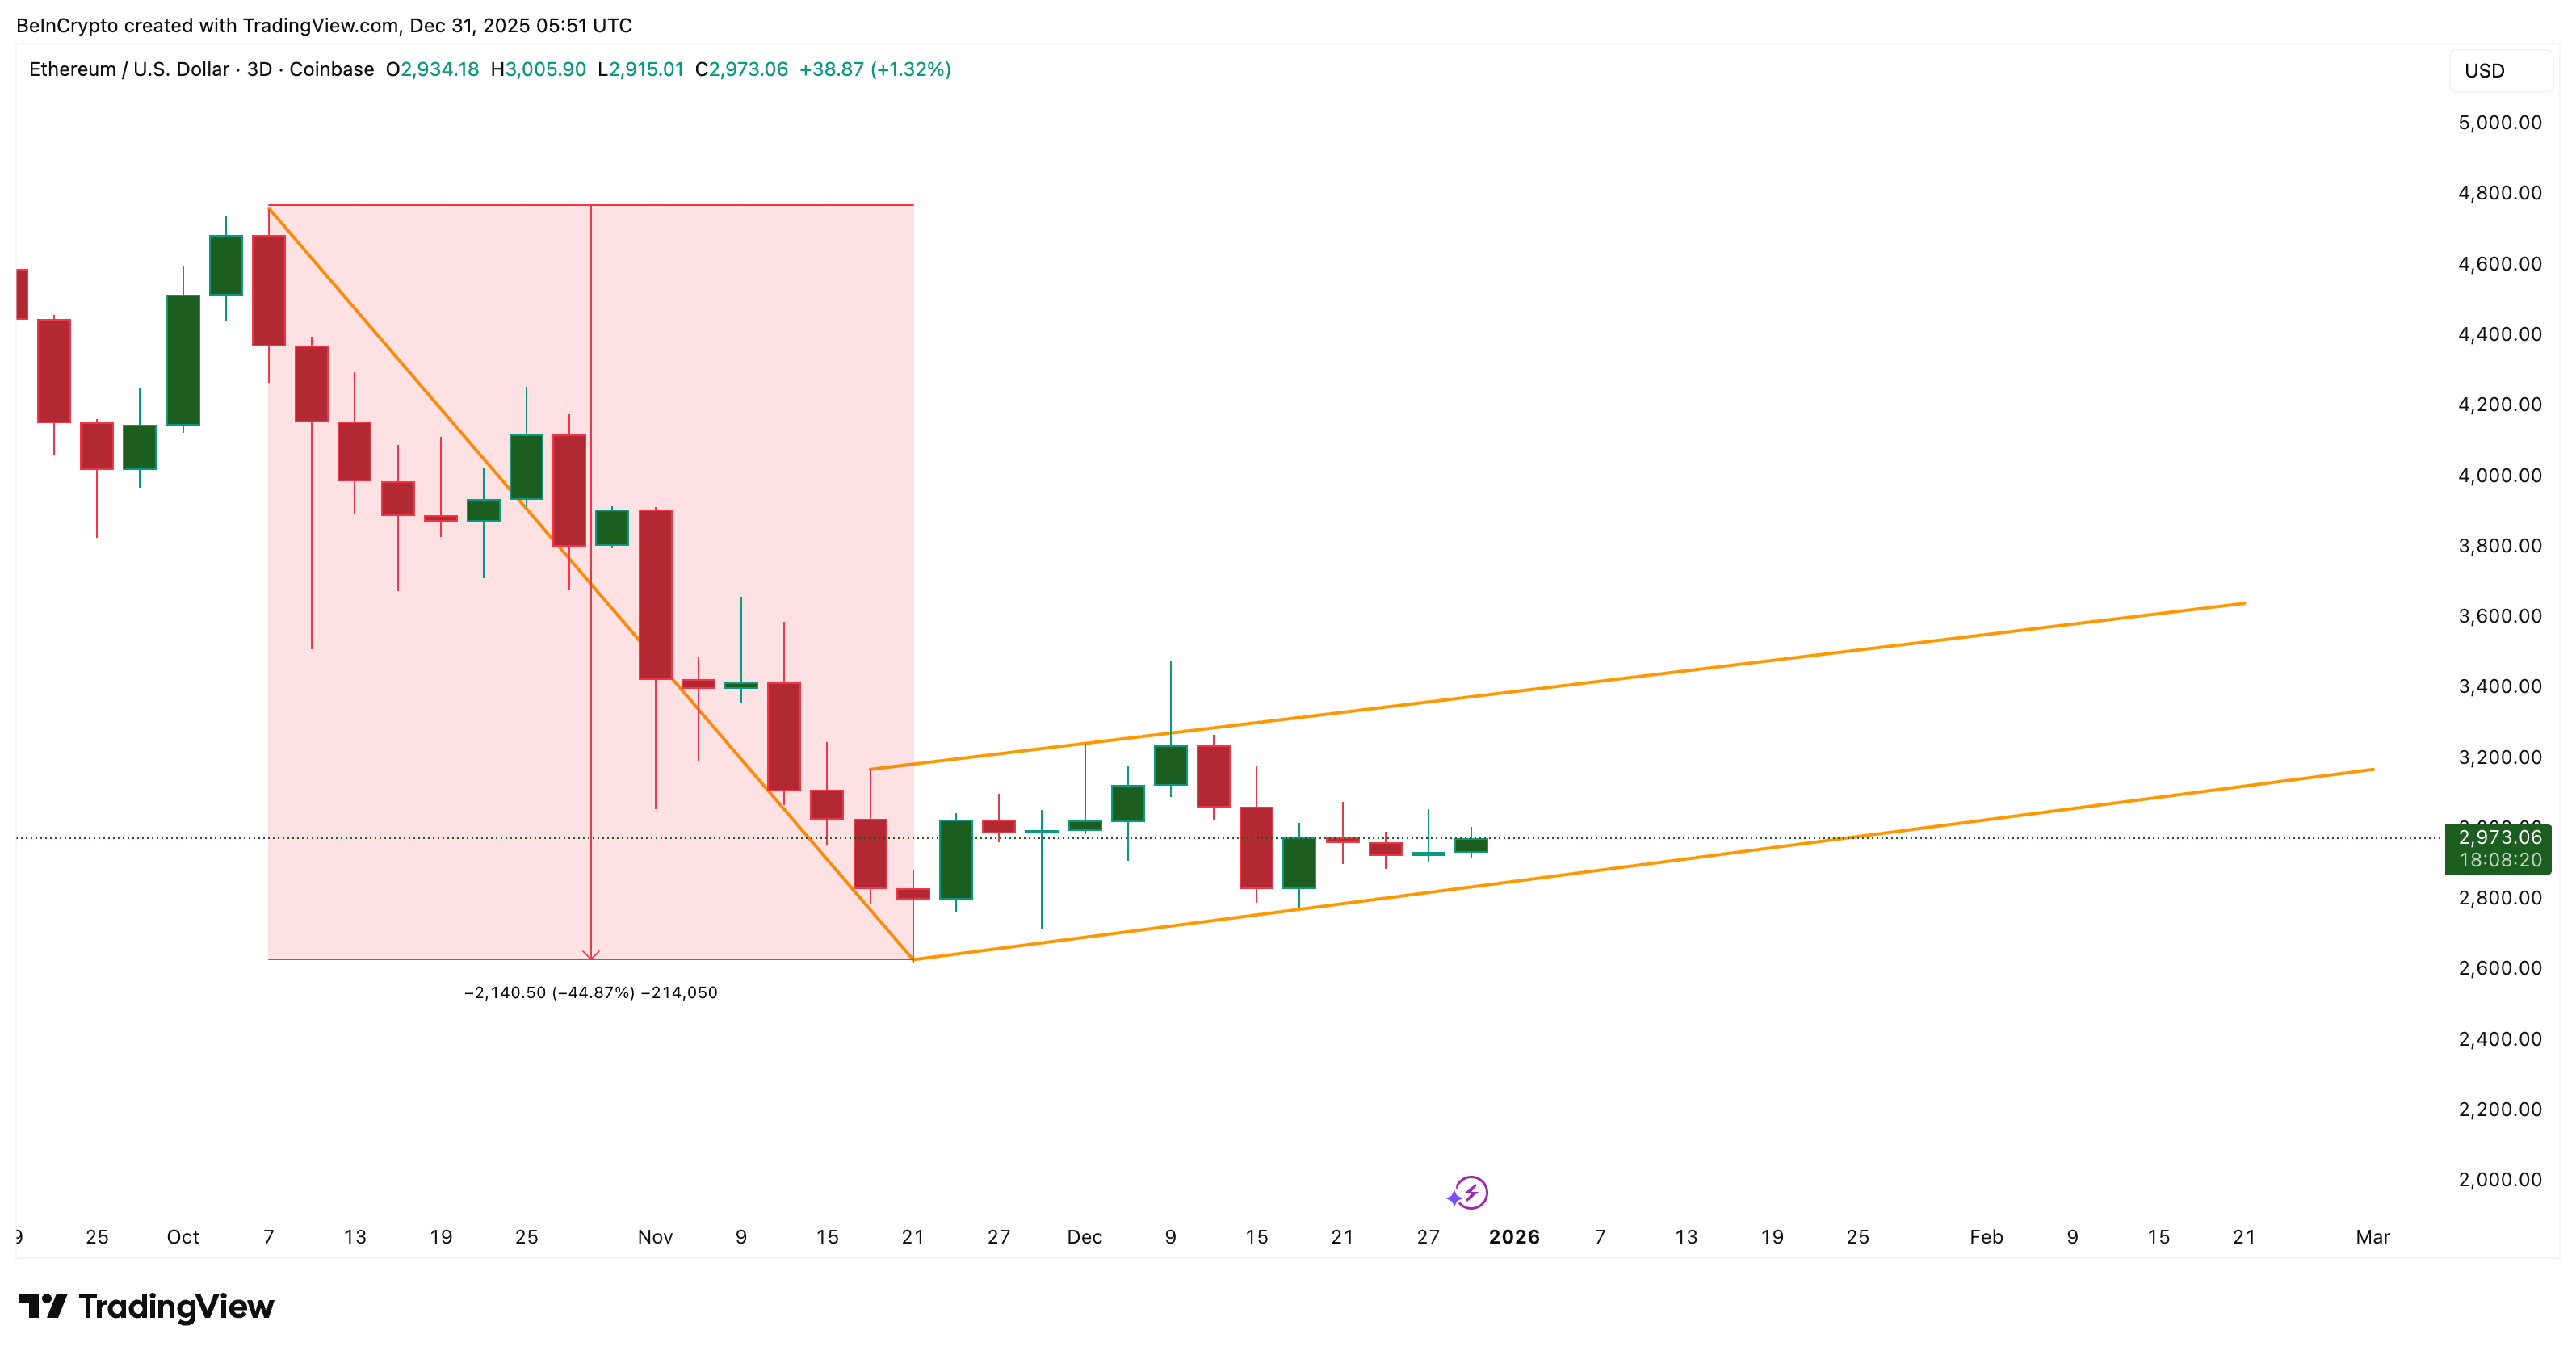
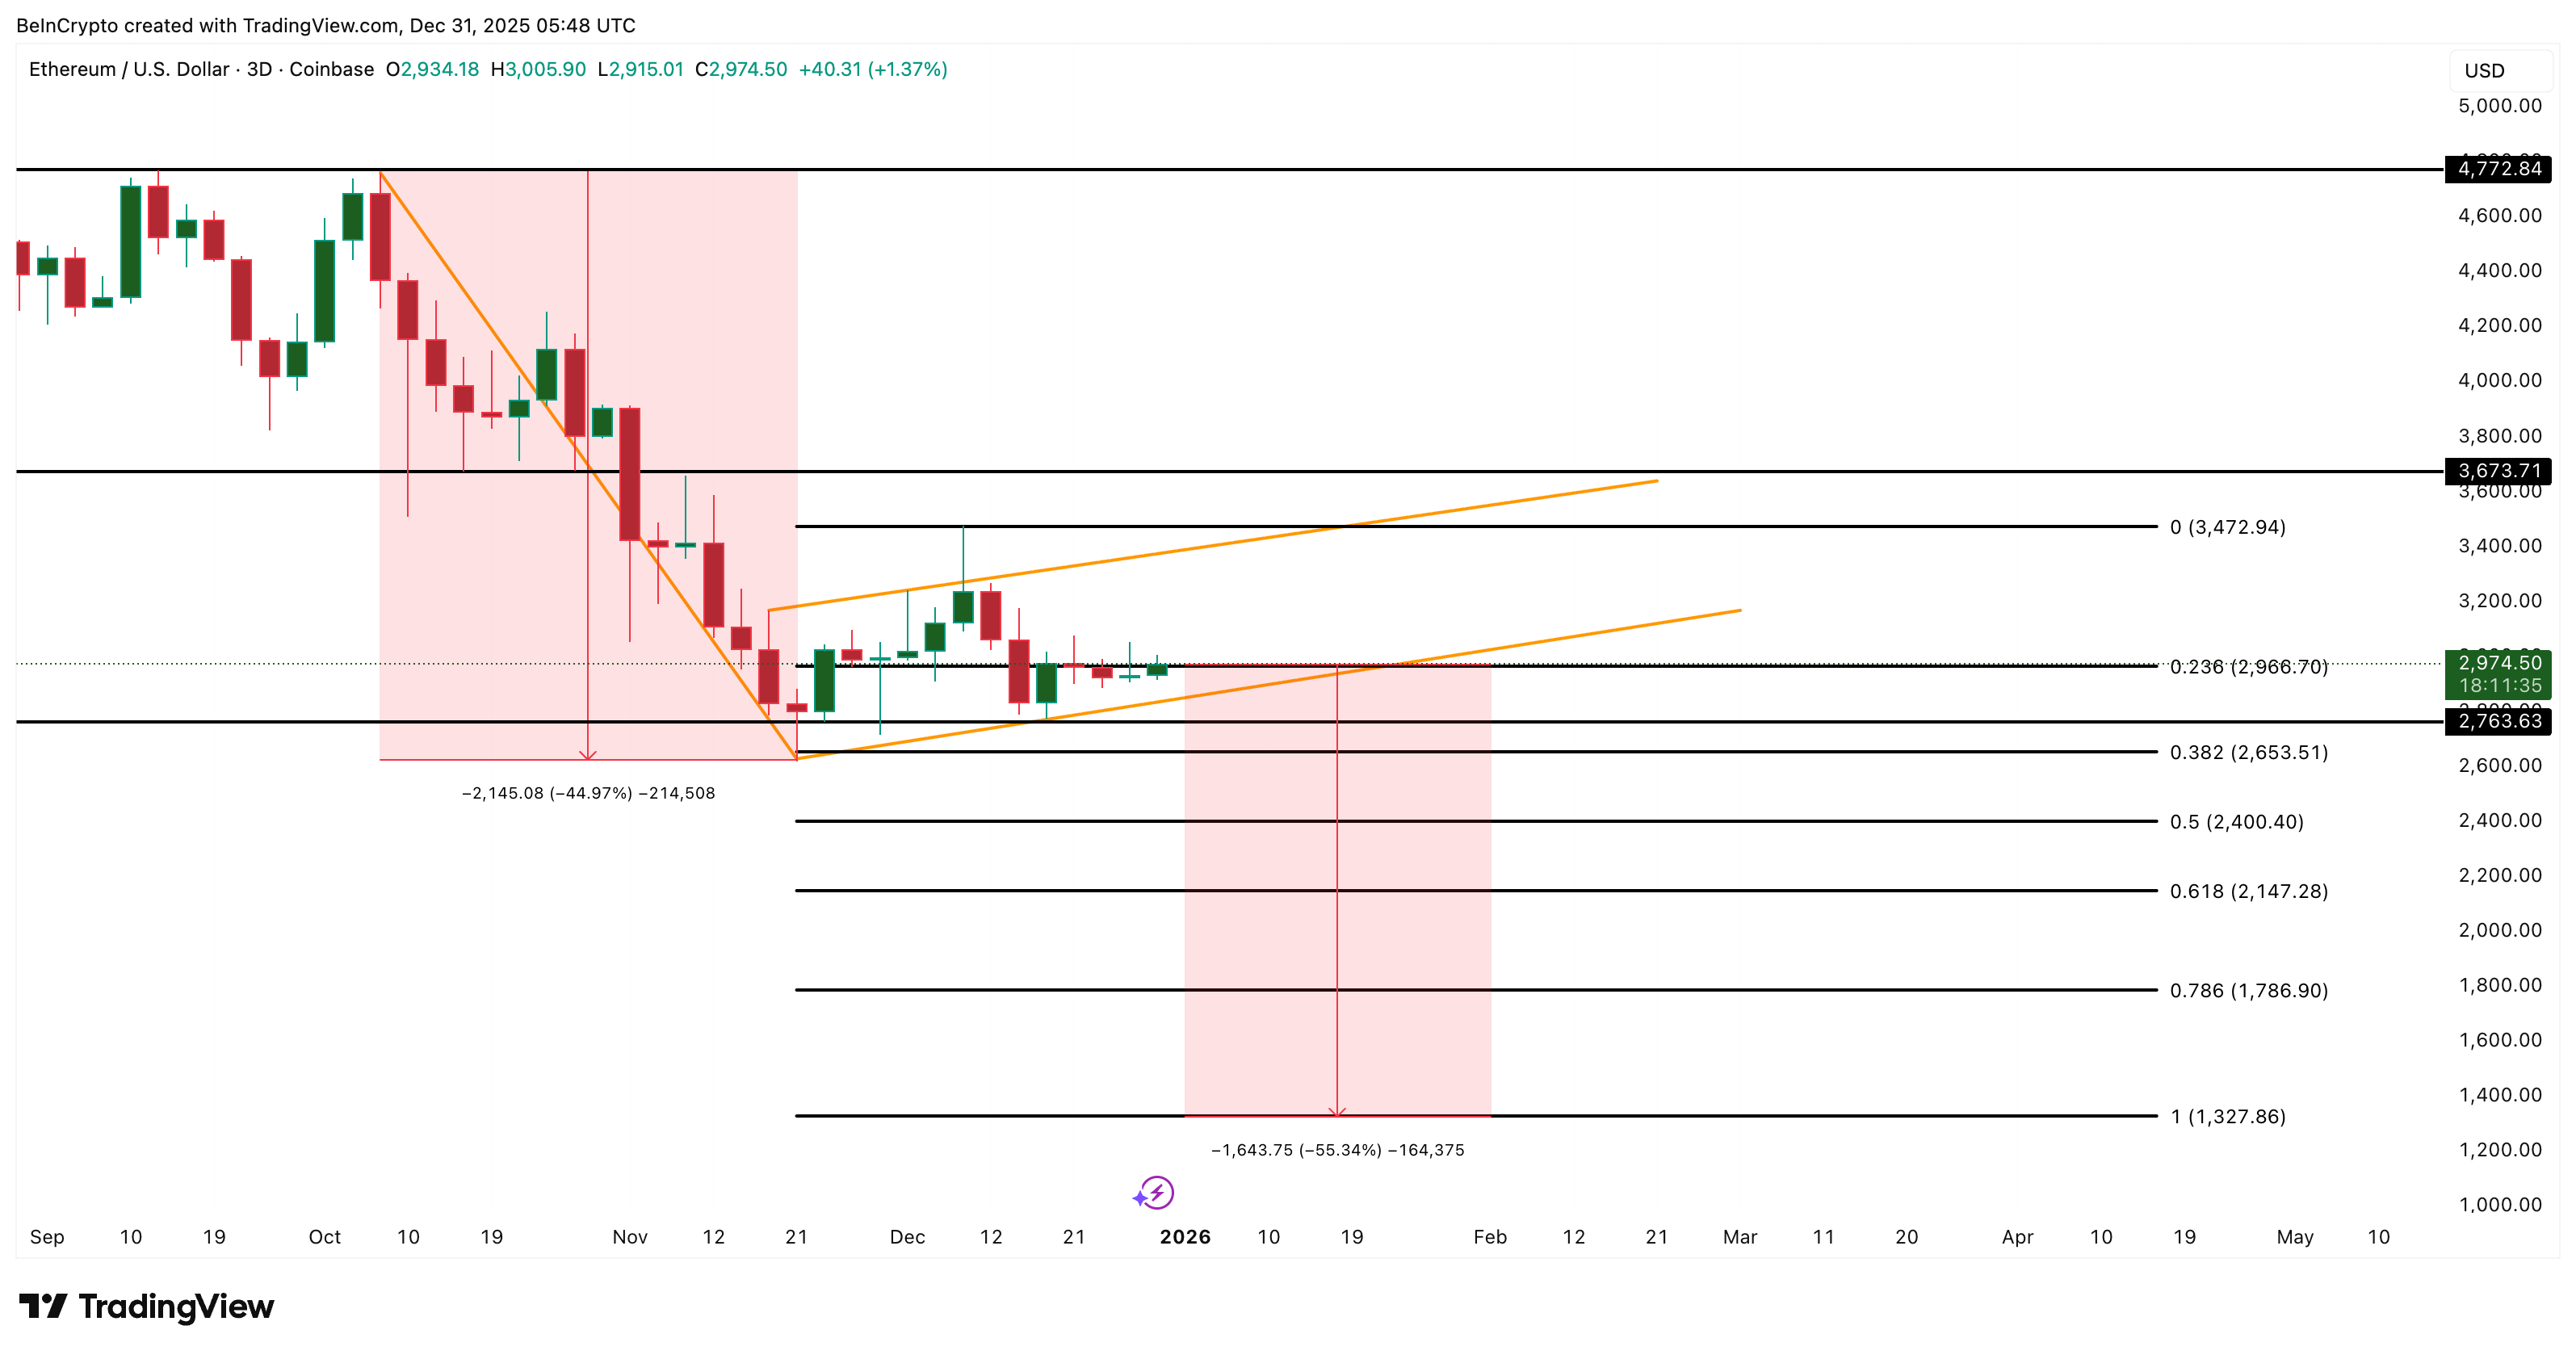
On the 3-day chart, ETH trades inside a rising channel that looks like a bear flag. A break below this structure activates the measured move. If confirmed, the technical projection implies a move of about 44% lower from the breakdown levels.
Sponsored
Sponsored
Note: The breakdown risk decreases significantly if Ethereum keeps moving inside the channel for some time.
Want more token insights like this? Sign up for Editor Harsh Notariya’s Daily Crypto Newsletter here.
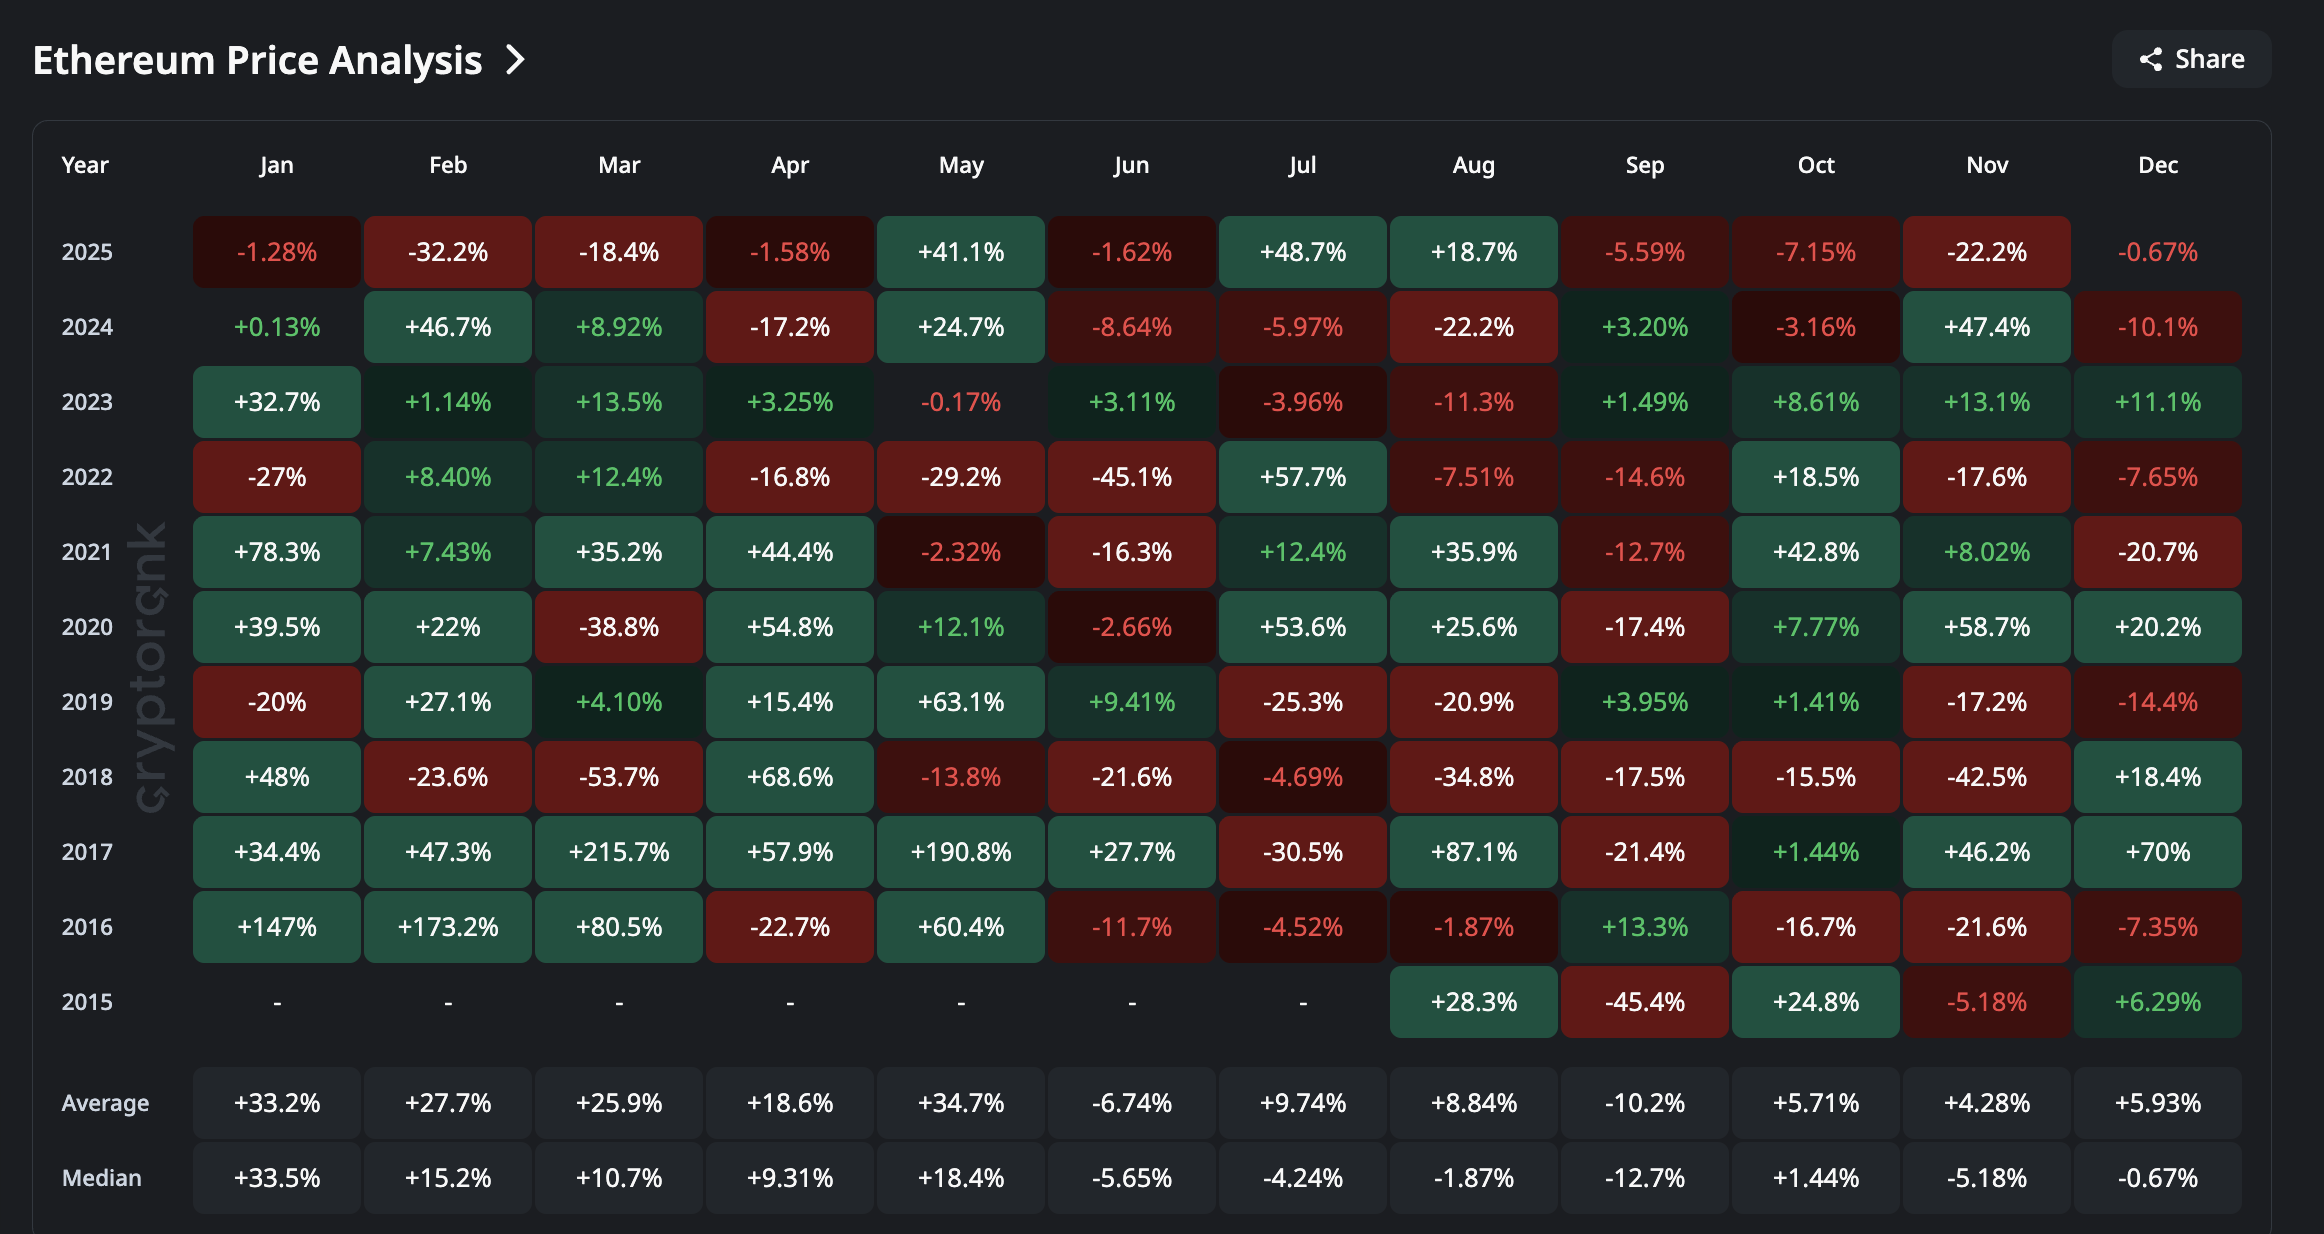
Seasonality, however, complicates this. January has historically been reliable for Ethereum, with a long-term average near +33%, but the last January wasn’t great. January 2025 opened with a drop and triggered four straight red months. If the flag breakdown happens, the seasonal momentum that often starts a new year could fail again.
The bearish risk clubbed with a historically volatile phase doesn’t go well with expert predictions of Ethereum reaching anywhere between $7,000 and $9,000 in 2026. At least not yet.
The weakness matches what Ryan Lee, Chief Analyst at Bitget, told BeInCrypto when asked about forecasts of $9,000 in 2026:
“Capital must stop leaving Ethereum, real usage must grow beyond today’s pilots, and supply must stay locked for longer periods,” he mentions
He added that the current environment does not support breakout expectations yet:
“We view the current picture as mixed,” he added.
Sponsored
Sponsored
So the chart shows risk. Seasonality shows uncertainty. The analyst’s view indicates a slow, conditional, and externally dependent recovery. Those improvements might be visible on-chain, yet only weakly.
On-Chain Flows Show Hope, But Not Conviction Yet
Some on-chain signals argue against a full breakdown.
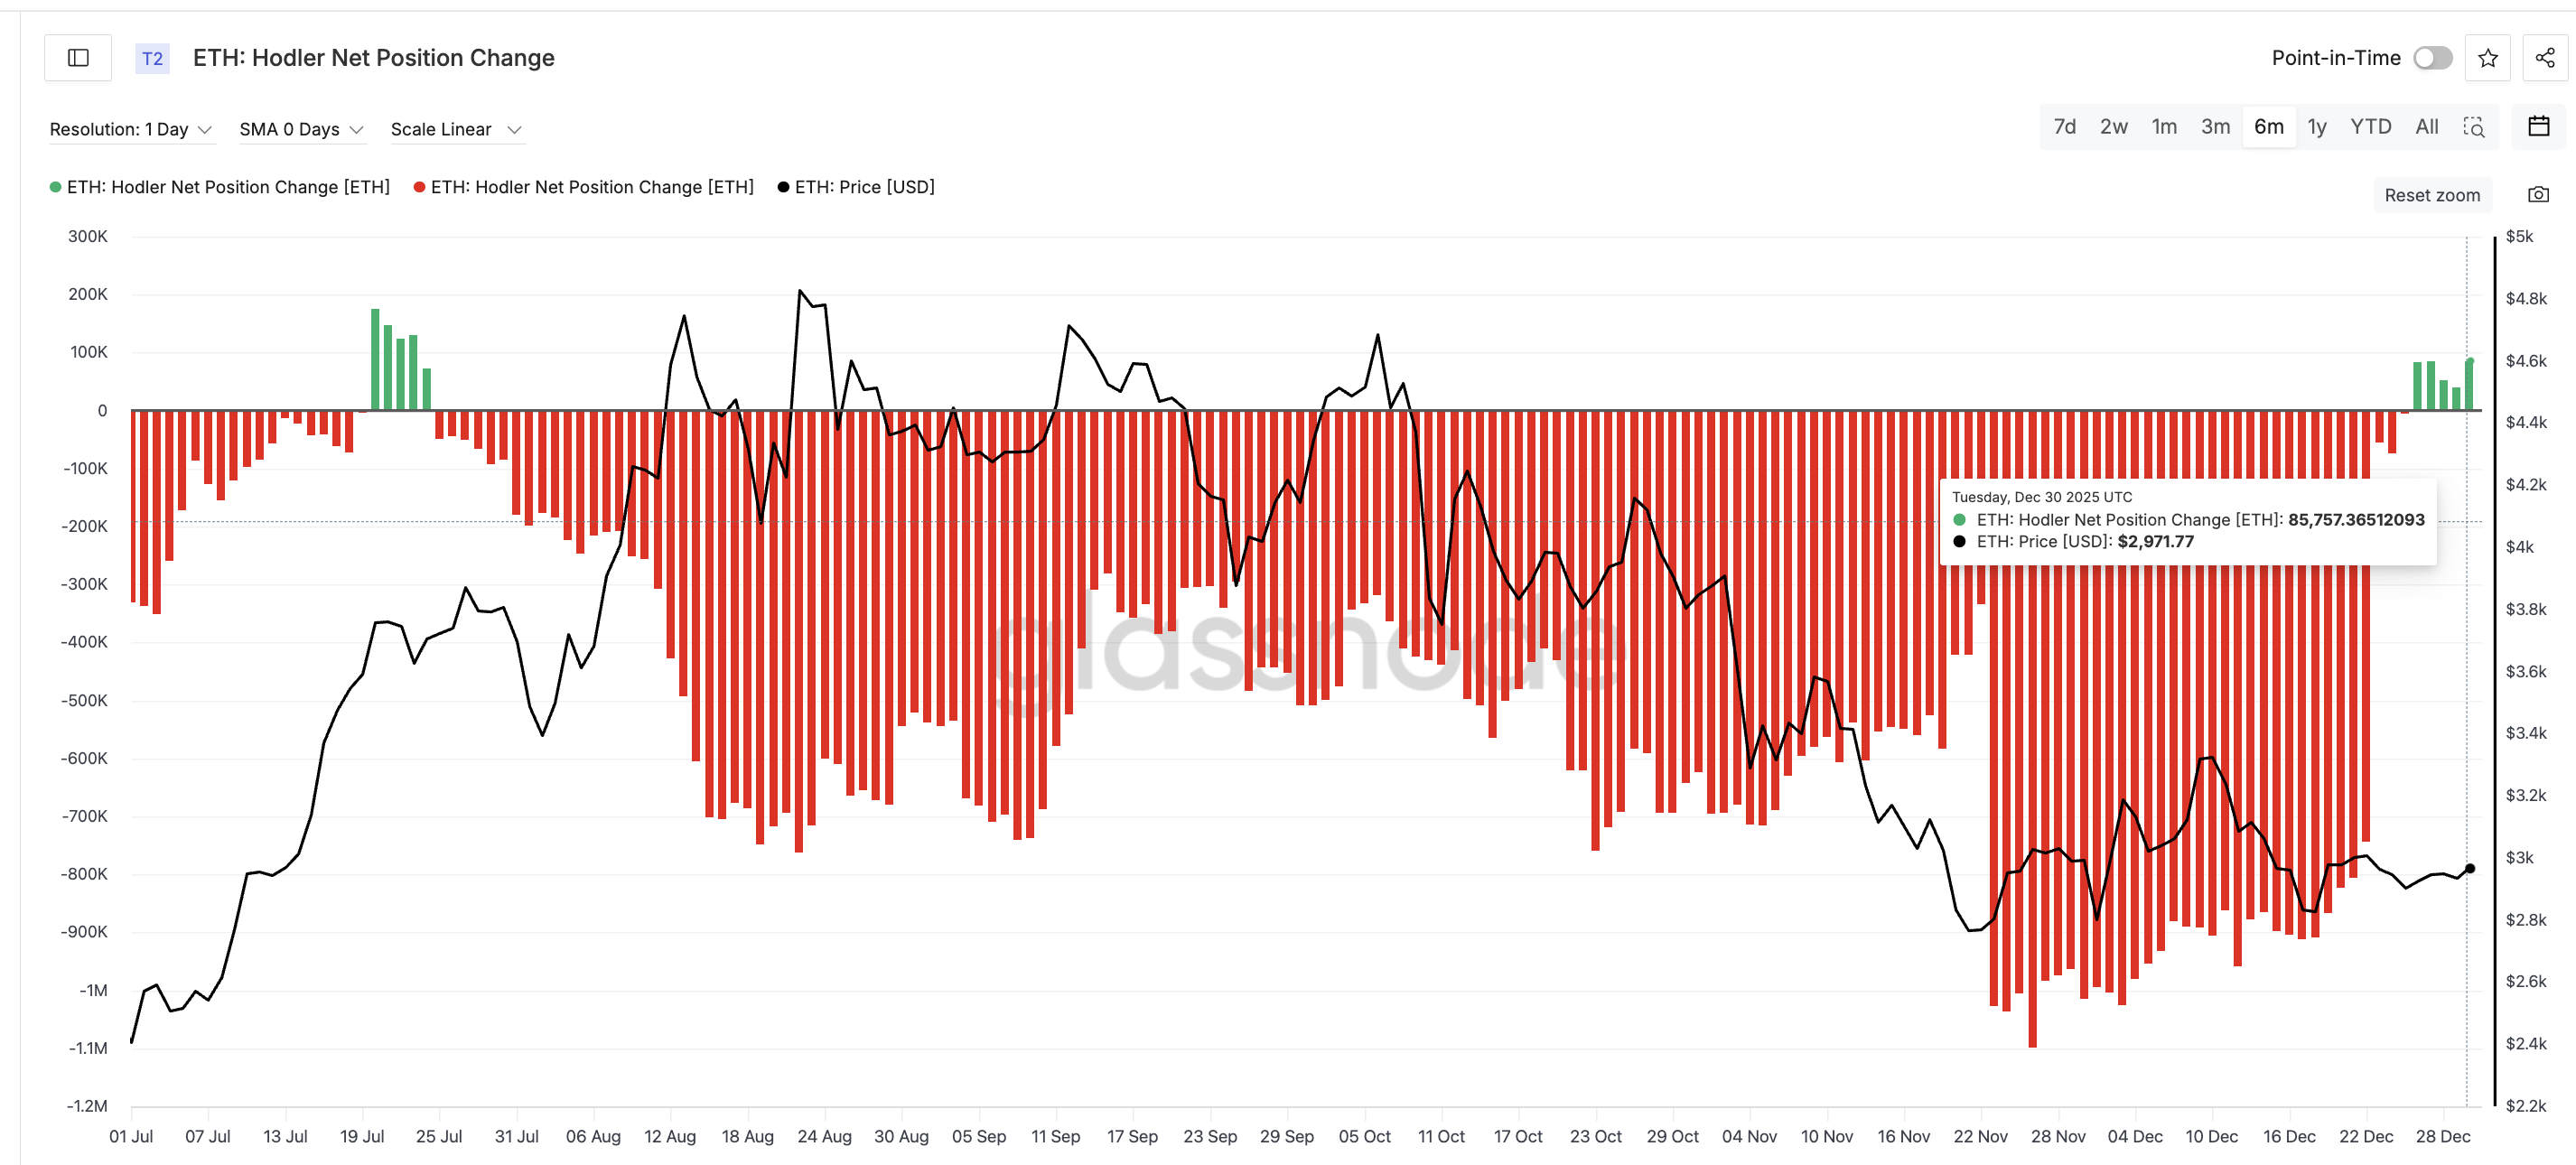
Long-term holders have finally turned buyers again. The Hodler Net Position Change metric (showing long-term investor wallet flows) flipped positive on December 26 for the first time since July, and has remained positive for several days. This signals patient capital showing up at lower levels, but cautiously.
With the Ethereum staking entry queue surpassing the exit path, it might be possible that Hodler Buys end up getting locked. That’s something Ryan Lee mentioned as a prerequisite for a higher ETH price move.
Ryan adds other details as well:
“More than 740k ETH is waiting to enter staking, while roughly half of that amount is queued to exit. Almost 30% of the total ETH supply is already staked,” he highlighted
This suggests accumulation and an intent to lock in supply, but the size is not yet sufficient to force a trend reversal. The behavior reflects interest rather than leadership.
Sponsored
Sponsored
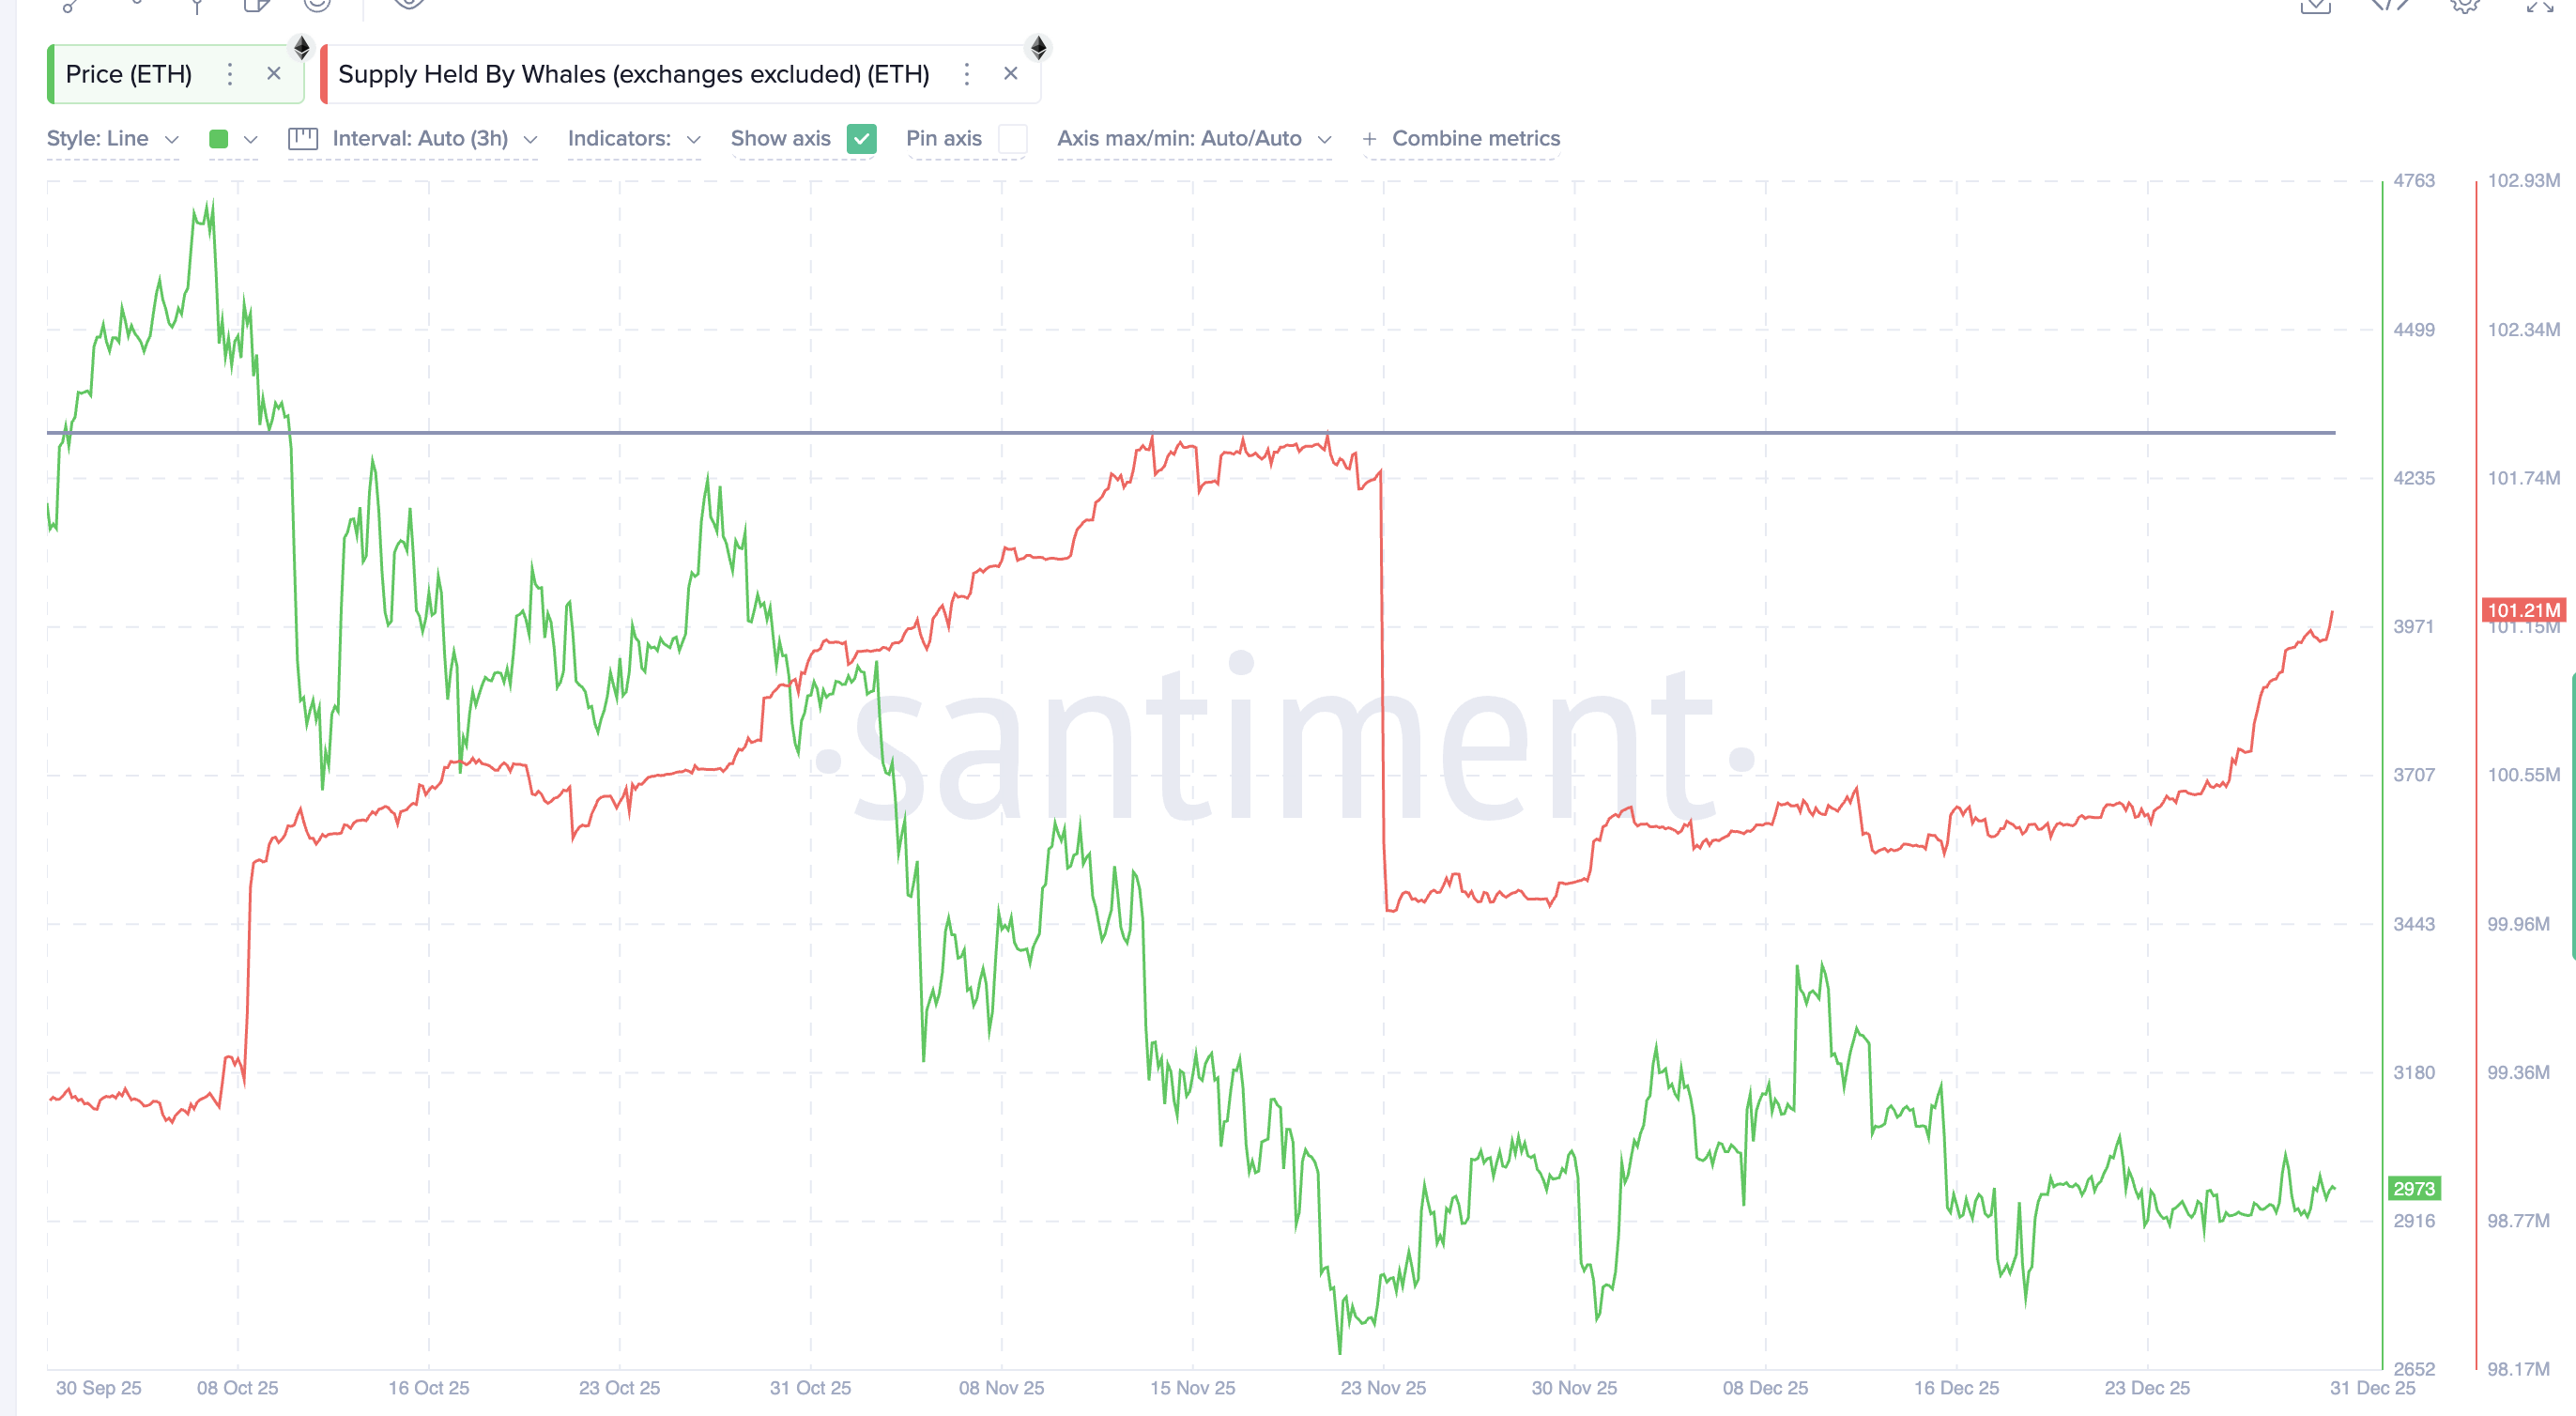
Whales have also returned. After dropping to around 100.01 million ETH held off exchanges in late November, supply has climbed back to 101.21 million ETH by December 31. That $3.6 billion accumulation matters. But the number still sits below the 101.90 million peak from early November. Until that peak breaks, whale demand is supportive rather than decisive.
ETF flows remain the biggest gap in the bullish argument. Spot ETH ETFs saw around $1.97 billion in outflows as both November and December ended negative.
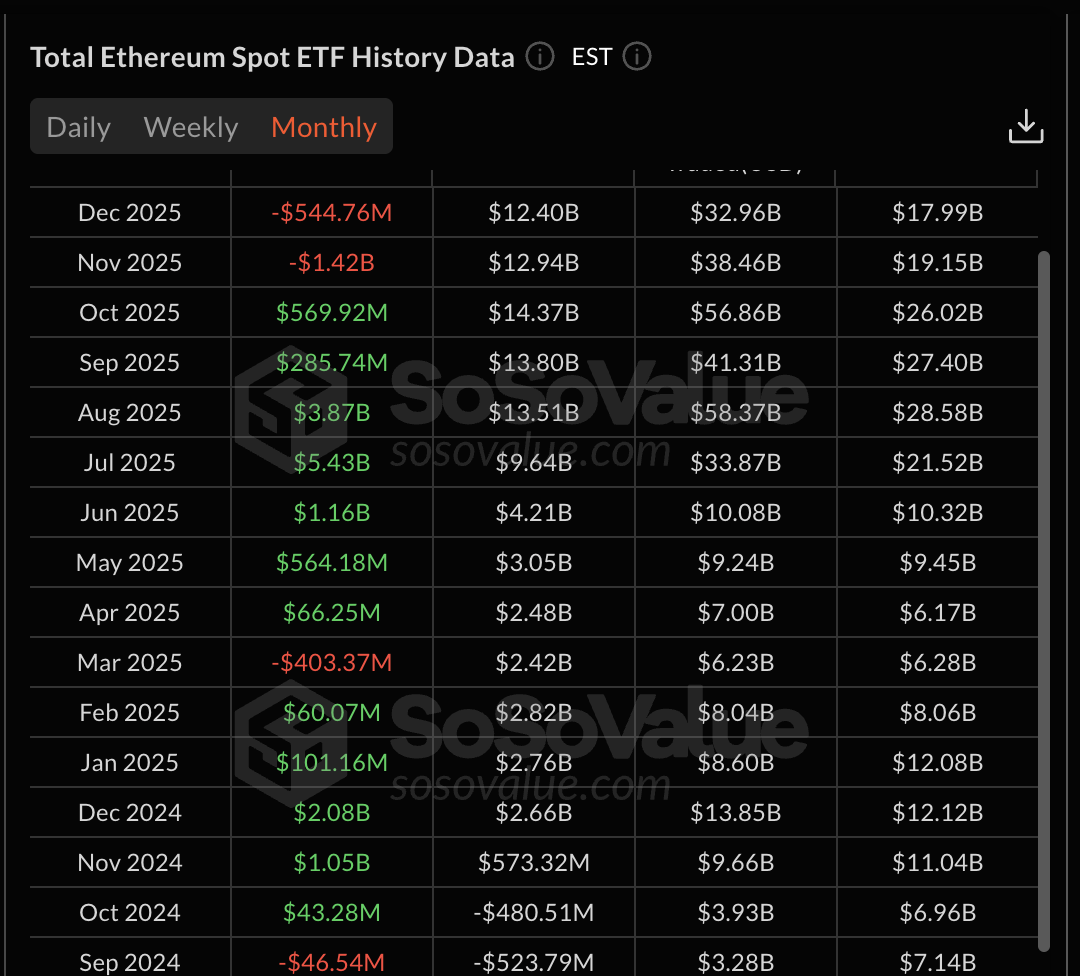
Ryan is direct here and believes that the ETF gap is something hugely restrictive to the price moves:
“At the moment, the large capital leaves the ecosystem. So this limits the price’s potential.”
So the on-chain story is improvement without conviction. It appears to be early bottom-building, not a trend change.
Sponsored
Sponsored
2026 Roadmap Depends On Key Ethereum Price Levels
This is where the chart and Ryan’s framework connect.
ETH needs to stay above $2,760 to hold the flag structure together. Losing that level weakens the structure and exposes $2,650 and $2,400. A deeper move toward $2,140 and $1,780 confirms the breakdown. If the bear flag plays out fully, the pattern projects a drop toward $1,320, which matches the 44% calculation from the breakdown point.
For a bullish turn, the price needs to break $3,470 to challenge the upper boundary. A move above $3,670 flips the structure. But the real breakout to the upside does not happen until ETH reclaims $4,770 — the point where the flagpole began and the level that resets the trend.
Only above that zone do targets like $7,000 to $9,000 make structural sense, and even there, Ryan still sees the move as conditional:
“That is why our base case is a slow, condition-driven recovery. The price can rise, but it is more likely to do so gradually,” he believes.
He also explains who leads first if macroeconomic policy easing (rate cut expectations) improves liquidity:
“Bitcoin is likely to react first. Ethereum follows shortly after, once staking turns dominant, tokenized asset volumes grow, and ETF flows stabilize,” he said.
If liquidity improves in 2026, Bitcoin is likely to lead. Ethereum price will follow only when ETF outflows stop, whale supply breaks its November high, and staking demand becomes sustained, driven by continued hodler additions.
Until those conditions align, the trend remains neutral to bearish.


