
Crypto World
How Deep Could BTC Fall if $80K Support Breaks?

The latest headlines surrounding President Trump’s pick for Jerome Powell’s replacement have intensified risk-off sentiment across global markets. This development has weighed heavily on equities and risk assets, with crypto reacting swiftly as liquidity conditions tighten and volatility rises.
Against this backdrop, Bitcoin has experienced a decisive technical breakdown, shifting focus toward key demand zones
Bitcoin Price Analysis: The Daily Chart
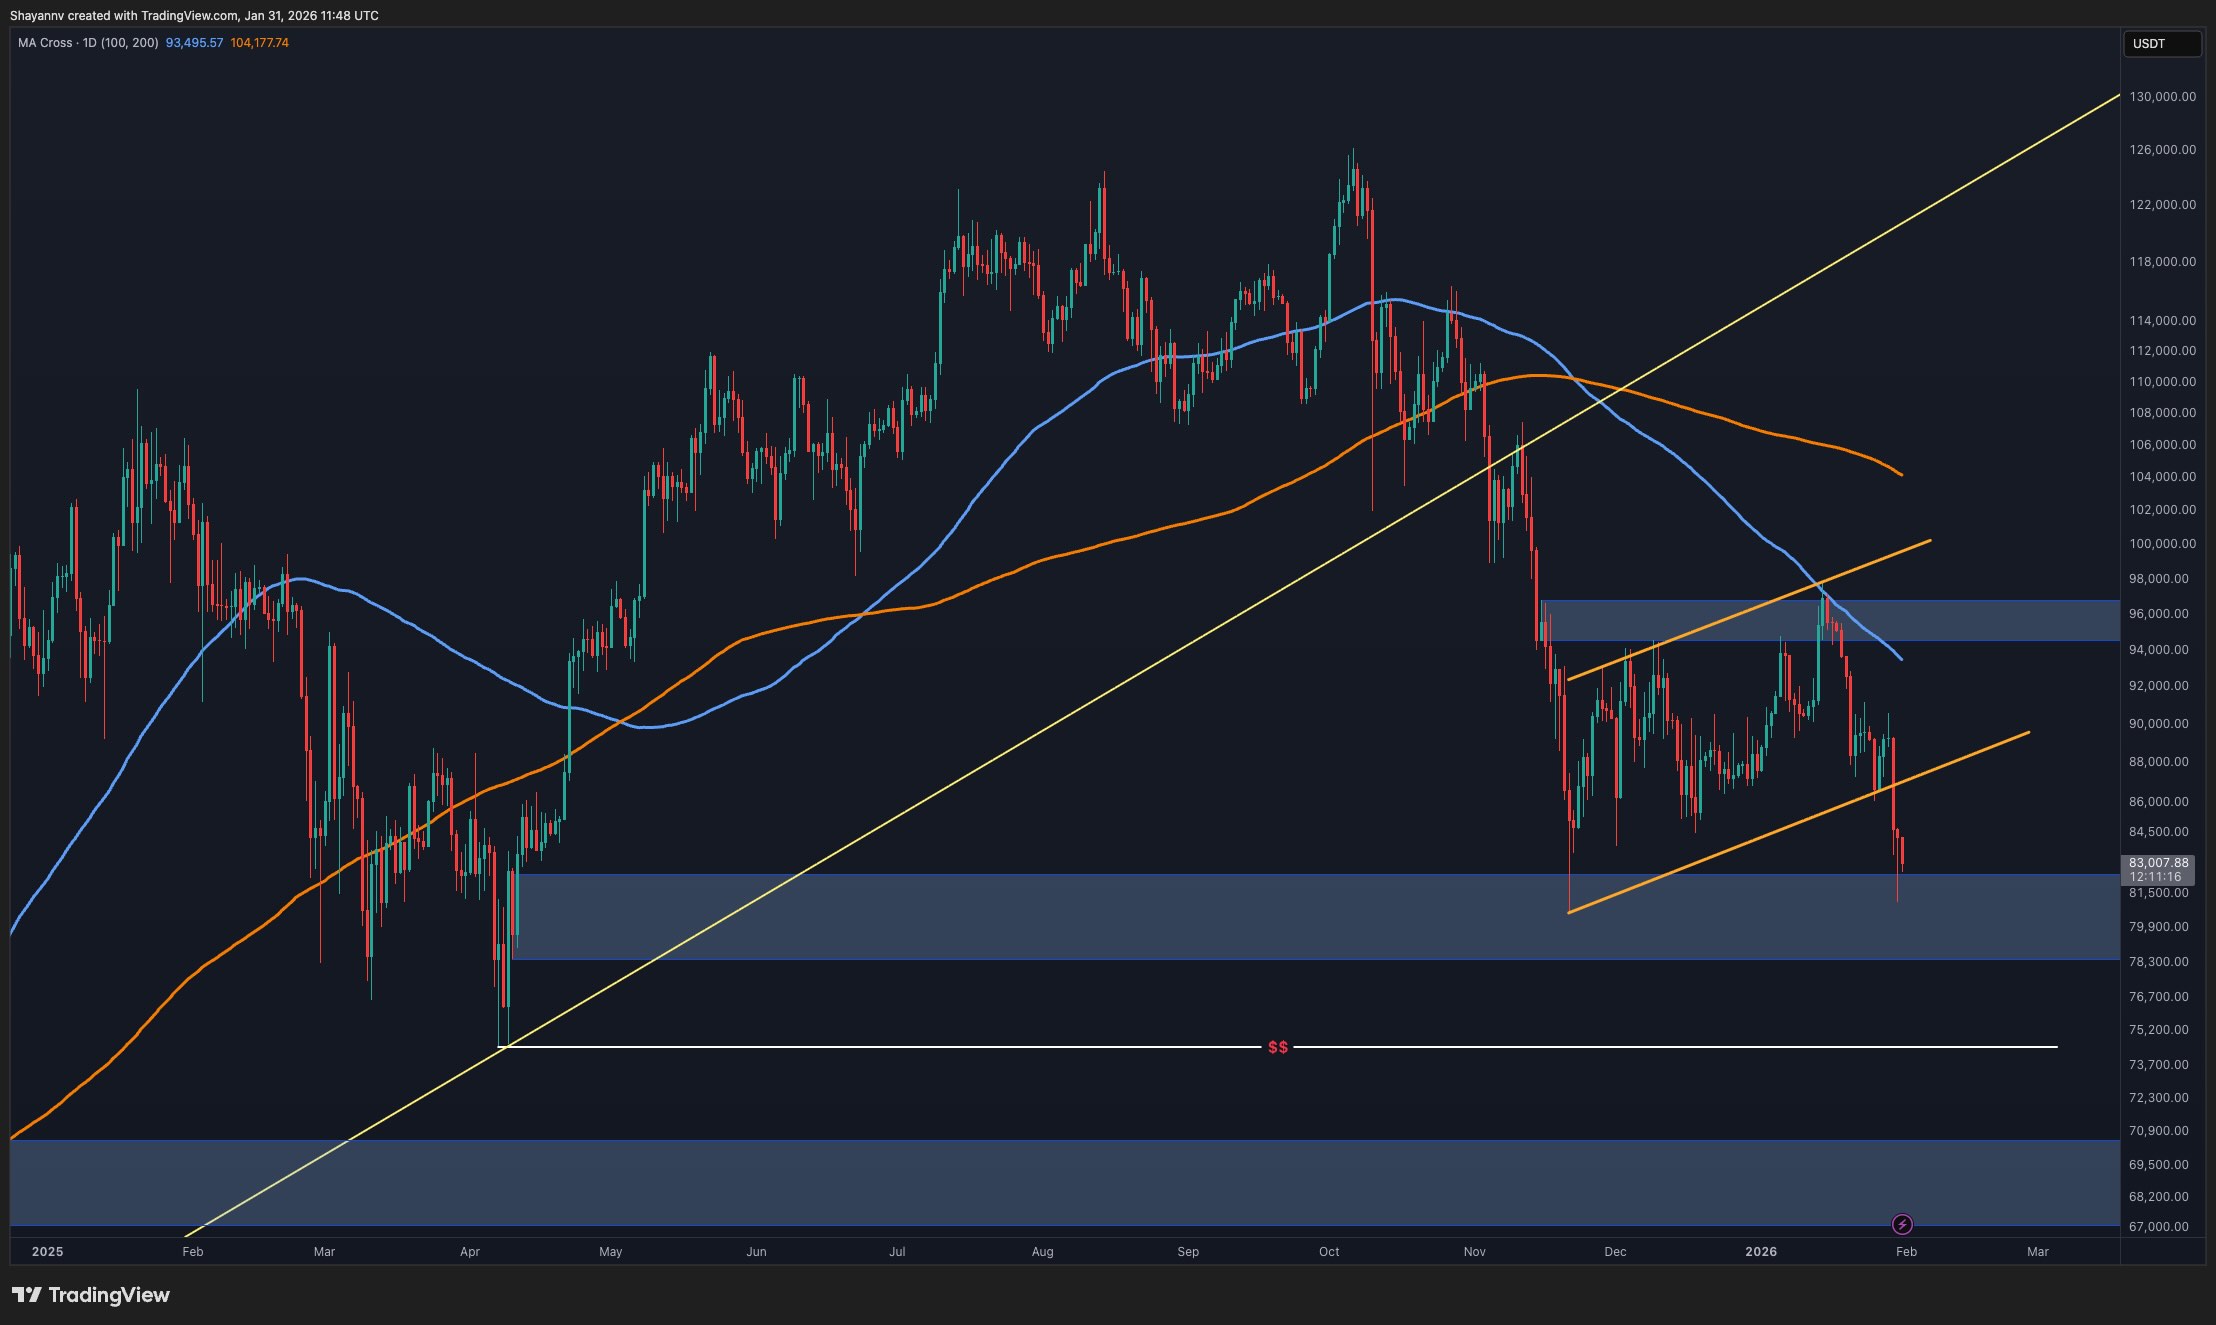
On the daily timeframe, BTC has confirmed a bearish breakout below the flag structure, signaling a continuation of the broader bearish move rather than a temporary pullback. This breakdown invalidated the prior consolidation phase and opened the door for accelerated downside momentum.
The asset is now directly confronting the major psychological demand zone at $80K, as highlighted on the chart. This area represents a critical buyers’ base that previously acted as a springboard for impulsive upside moves. The market’s reaction here is crucial.
Holding this zone could trigger a relief bounce or short-term stabilization, whereas a clean loss would expose lower-liquidity pockets and shift the medium-term bias decisively bearish. The macro uncertainty driven by Fed leadership concerns further increases the probability of volatility expansion around this level, making this demand zone a key decision point.
BTC/USDT 4-Hour Chart
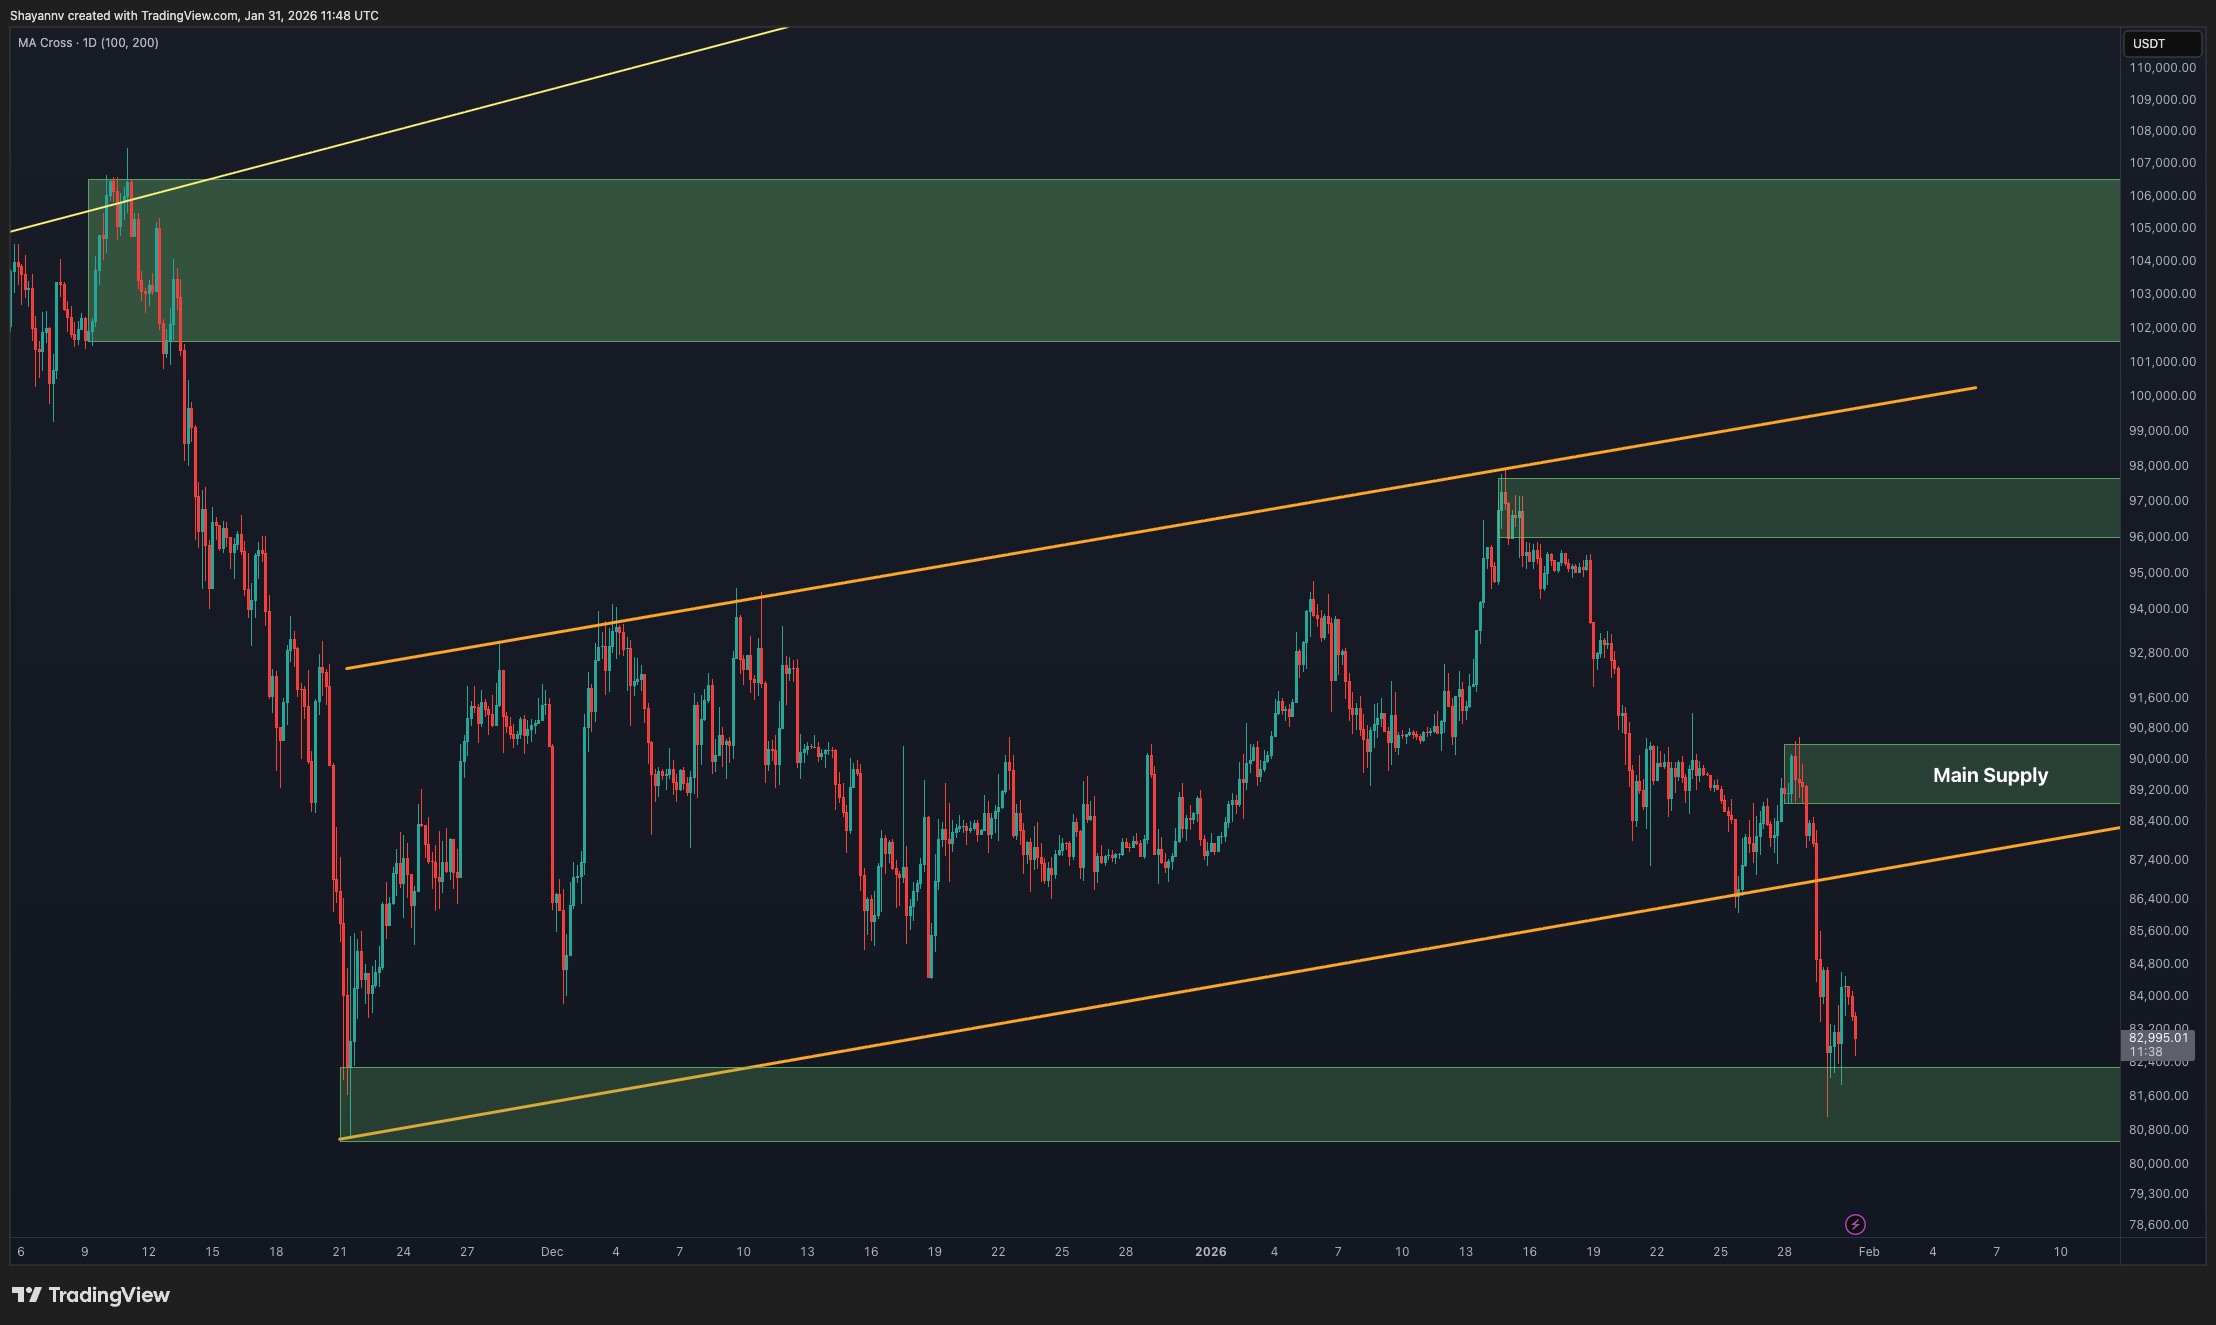
Zooming into the 4-hour chart, the structure becomes more tactical. Following the sharp breakdown, Bitcoin is now showing early signs of exhaustion, suggesting the possibility of a short-term pullback.
From a market-structure perspective, the last supply zone overhead at the $88K crucial zone stands out as the most likely magnet for any corrective move. This area previously acted as a distribution before the impulsive sell-off and is expected to attract sellers on a retest.
A pullback into this supply zone would be technically healthy, allowing the market to rebalance before deciding on continuation or reversal. Failure to reclaim it would reinforce bearish control, while acceptance above it would be the first signal of structural recovery.
On-Chain Analysis
On the on-chain side, the Realized Price – UTXO Age Bands reveal an important shift in behavior. Longer-term holders remain relatively stable, while shorter-term cohorts show signs of stress as the price trades closer to their realized levels.
Notably, the compression between mid-term realized prices and the asset breaking below the 12-18 month cohort’s realized price suggests that Bitcoin is approaching an area where historical accumulation tends to emerge, particularly if macro fear peaks. While this does not guarantee an immediate bottom, it does support the idea that downside from here may become increasingly reactive rather than trend-driven.
Combined with heightened macro uncertainty, this on-chain positioning reinforces the importance of the current demand zone as a potential pivot area for the next major move.

SECRET PARTNERSHIP BONUS for CryptoPotato readers: Use this link to register and unlock $1,500 in exclusive BingX Exchange rewards (limited time offer).
Disclaimer: Information found on CryptoPotato is those of writers quoted. It does not represent the opinions of CryptoPotato on whether to buy, sell, or hold any investments. You are advised to conduct your own research before making any investment decisions. Use provided information at your own risk. See Disclaimer for more information.

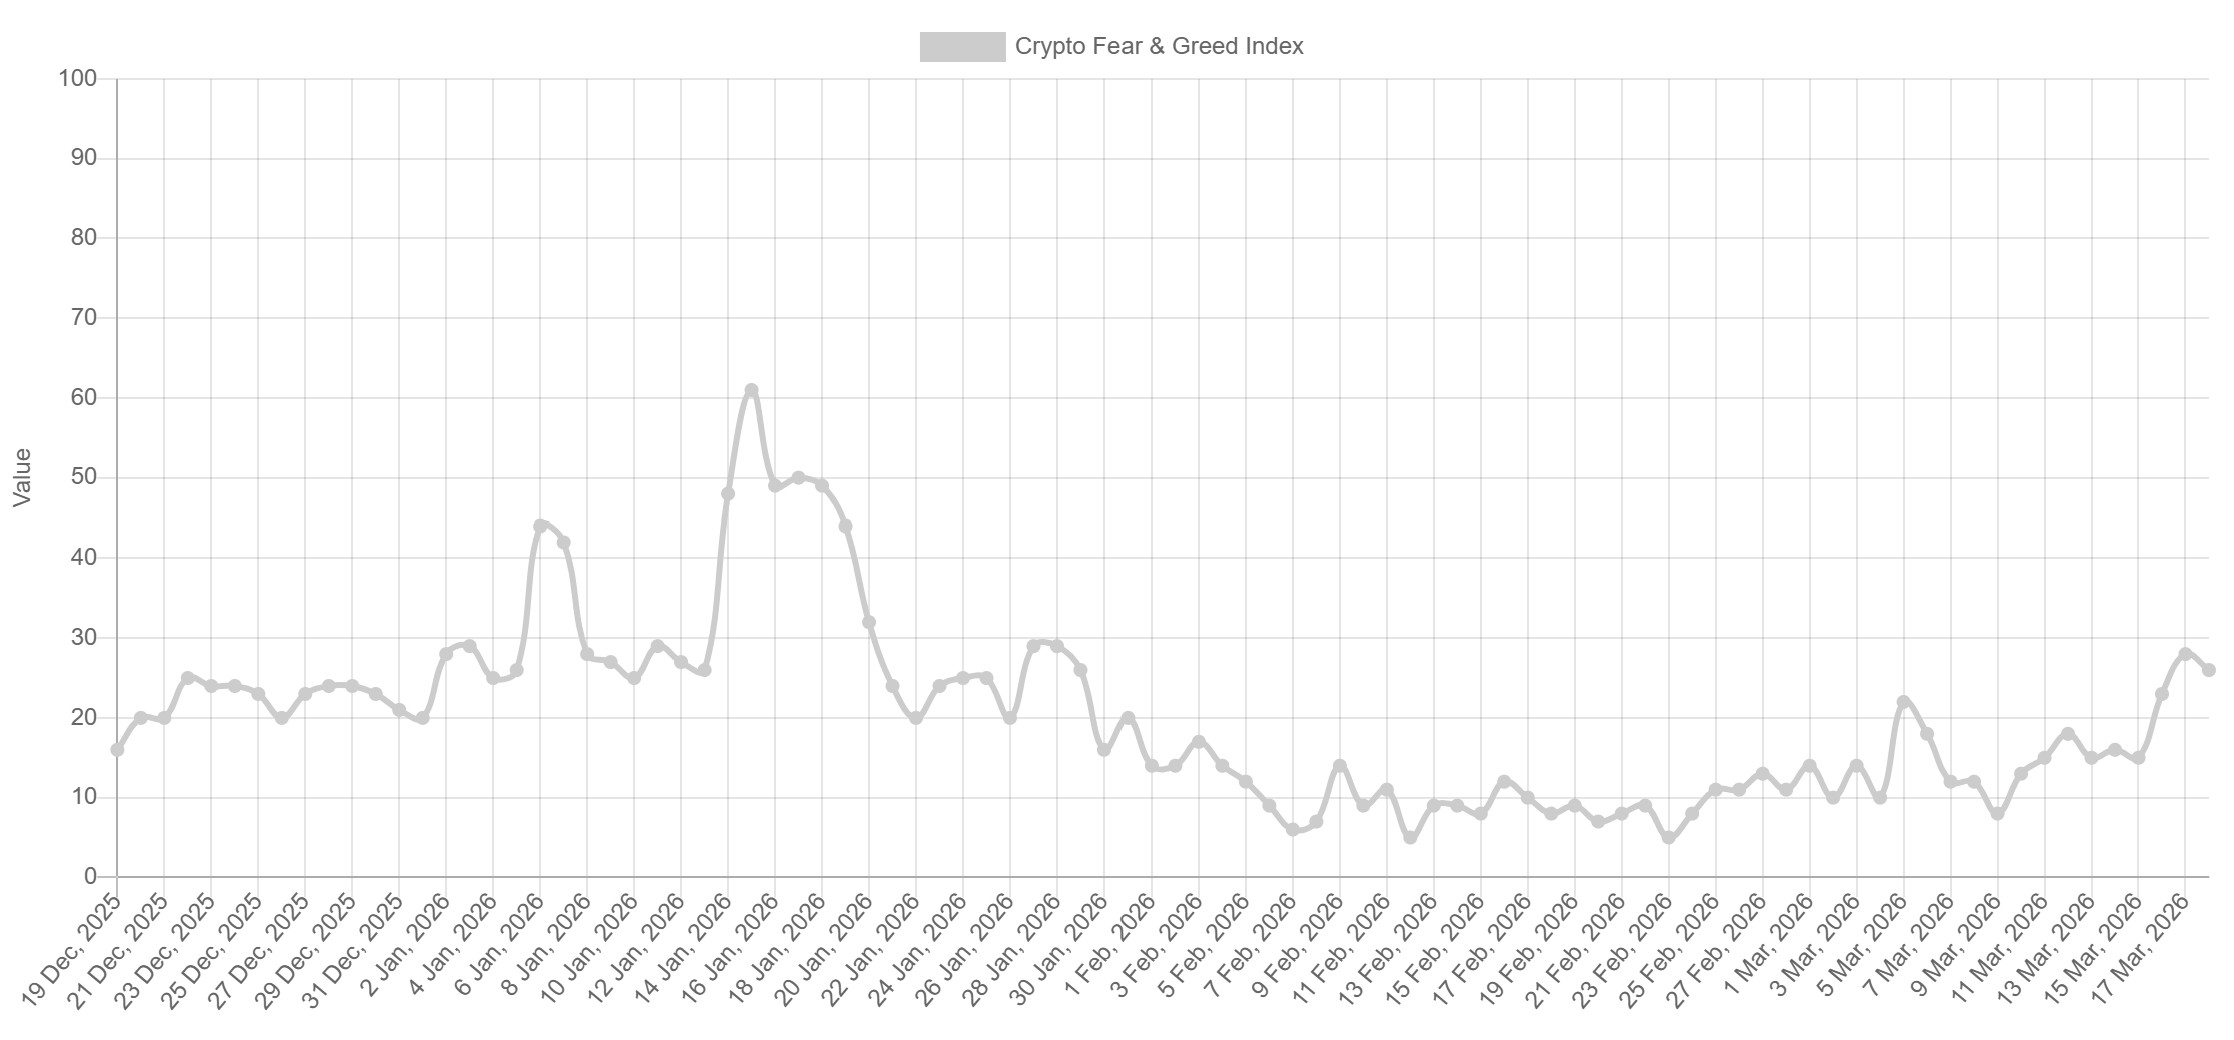
The Crypto Fear & Greed Index remained at 26 on Wednesday, after rising to 28, a day earlier, ending the indicators’ 48-day stretch in the “extreme fear” zone.
The Crypto Fear & Greed index tracks market sentiment using volatility, momentum, volume, and social data. Any reading below 25 signals extreme fear, while higher values reflect an improving risk appetite.

The index reading points to an improvement in market sentiment this week, marking its first exit from extreme fear in over six weeks.
The move coincides with a recovery in the total crypto market capitalization, which has added 7.65% in March, equivalent to roughly $174 billion. This marks the first monthly bullish expansion since September 2025. Before this, the market declined nearly 40%, dropping to $2.28 trillion from $3.65 trillion in the previous five months.

Market researcher Sminston With provided additional context to the Fear & Greed index.
With said that an analysis of the past Bitcoin market cycles shows that buying BTC during fear phases delivered stronger returns over a two to four-year window.
The average gains reached 331% over three years, compared to 100% for BTC entries made during the greed phases. However, over longer time periods (four to five years), the return differences narrowed, with both the entry strategies converging as Bitcoin’s long-term growth trend dominated the price action.

Related: SOL price signal tied to previous 142% rally flashes again: Are the bulls back?
A rise in stablecoin inflows signals liquidity return
Binance exchange flow data shows a shift in capital movement. Binance recorded a $2.2 billion inflow in Tether USDt (USDT) on March 18, marking the largest single-day stablecoin deposit since November 2025.

These inflows represent the available capital, often referred to as “dry powder,” that can be deployed into the crypto markets. The spike coincided with Bitcoin pushing into higher price levels near $75,000 on Monday, linking the liquidity injection with active trader positioning.
Meanwhile, the total stablecoin reserves across exchanges surged to $68.5 billion from a six-month low of $64 billion on March 8, marking a sharp increase of 7%, within a short period.

A rise in exchange-held stablecoins typically signals that participants are preparing to deploy funds into spot or derivatives markets. This indicates that traders are re-entering with the intent to take positions, adding to near-term buying capacity.
Related: Australian crypto shopping surges, but so do banking blocks: Survey
This article does not contain investment advice or recommendations. Every investment and trading move involves risk, and readers should conduct their own research when making a decision. While we strive to provide accurate and timely information, Cointelegraph does not guarantee the accuracy, completeness, or reliability of any information in this article. This article may contain forward-looking statements that are subject to risks and uncertainties. Cointelegraph will not be liable for any loss or damage arising from your reliance on this information.


FTX Recovery Trust announced Wednesday it will distribute roughly $2.2 billion to creditors on March 31 as part of its ongoing bankruptcy recovery process, with additional payments to preferred equity holders scheduled later this year.
The payout marks the fourth distribution under FTX’s Chapter 11 reorganization plan and will go to creditors in both “Convenience” and “Non-Convenience” classes who have completed required onboarding steps, the trust’s statement says. Funds are expected to arrive within 1 to 3 business days via BitGo, Kraken, or Payoneer.
The trust also clarified all distributions are made in U.S. dollars to designated service providers, which then offer options for fiat withdrawal or conversion into digital assets.
The previous distribution to creditors took place from Sept. 30, when the trust announced the release of $1.6 billion, the third major payout since the collapse of the crypto exchange more than three years ago.
Earlier rounds totalled over $6 billion as part of a process aimed at recovering assets for users of the once-prominent cryptocurrency exchange, which collapsed in November 2022, triggering a steep crypto bear market. Sam Bankman-Fried, the founder and CEO of the exchange, is serving a 25-year sentence after being found guilty of seven counts of fraud and conspiracy.
The latest distribution pushes recovery rates higher across several claim classes, the trust said. The statement added that in this fourth distribution, those eligible for distribution classed as “Class 5A Dotcom” would receive an additional 18% (bringing total recovery to 96%), while U.S. customer claims classed as “5B” would reach full recovery at 100%. Those in classes “6A” and “6B” would also recover 100% recovery, each receiving a 15% increment. “Class 7,” meanwhile, would receive a cumulative 120% distribution, the statement said.
FTX said customers who opted to receive funds through a designated distribution provider have waived their right to direct cash payments and must work with those platforms to access their funds.
The estate also set April 30 as the record date for its first payments to preferred equity holders, with payments scheduled for May 29. Eligible holders must complete ownership certification, know-your-customer (KYC) verification and tax documentation to qualify, the trust said.
FTX began outreach to equity holders earlier this year and urged those who have not been contacted to come forward. Further distribution timelines are expected to be announced, the statement concluded.

An eagle is seen framed though construction fence on the Marriner S. Eccles Federal Reserve Board Building, the main offices of the Board of Governors of the Federal Reserve System on September 16, 2025 in Washington, DC, U.S.
Kevin Dietsch | Getty Images News | Getty Images
The Federal Reserve is still expecting to cut interest rates once this year in spite of a spike in oil prices from the Iran war.
The central bank’s so-called dot plot, which shows the anonymous expectations of the 19 individual members, showed a median estimate of 3.4% for the federal funds rate at the end of 2026, the same as what it had projected at the end of last year.
However, a closer look at the overall dot plot showed the balance of projections moved toward fewer reductions, meaning more members are forecasting one reduction from two previously.
“If you notice, the median didn’t change, but there was actually some movement toward — a meaningful amount of movement — toward fewer cuts by people,” Fed Chair Jerome Powell said in his post-meeting remarks. “So four or five people went from two to one, let’s say, two cuts to one cut.”
The Fed kept rates unchanged on Wednesday, voting 11-1 to keep the benchmark federal funds rate anchored in a range between 3.5%-3.75%.
Traders had come into the year hopeful for two interest rate cuts. However, that expectation has been getting pushed out in recent weeks because of data showing hotter inflation that could put the central bank on hold.
In particular, it complicates the job of former Fed Governor Kevin Warsh, who is set to succeed current Chair Powell when his term ends in May. Warsh, who was handpicked by President Donald Trump, has expressed his support for lower rates.
The Fed’s Summary of Economic Projections showed higher inflation projections for the year, as well as a somewhat faster pace of growth.
The forecast for personal consumption expenditures inflation climbed to 2.7% for 2026, up from 2.4% in December. The projection for core inflation, which excludes volatile food and energy prices and is more closely watched by the Fed, also rose to 2.7% from 2.5%.
However, the change in real GDP rose to 2.4% from 2.3% in December.
Fed funds futures were last pricing in just one rate cut in 2026, as well as the greater likelihood that the central bank may remain on hold, according to the CME FedWatch Tool.
— CNBC’s Gabriel Cortes and Jeff Cox contributed to this report.

WASHINGTON – The Federal Reserve on Wednesday voted to hold its key interest rate steady as policymakers navigate their way through higher-than-expected inflation readings, mixed signs on the labor market – and a war.
In a widely expected decision, the Federal Open Market Committee voted 11-1 to keep the benchmark federal funds rate anchored in a range between 3.5%-3.75%. The rate sets overnight funding costs for banks but influences a broad range of consumer and business borrowing.
The committee in its post-meeting statement made few changes to its view on the economy, with a slightly faster pace of growth and higher inflation projections for 2026.
Despite the elevated uncertainty, officials again signaled they still expect a few rate cuts ahead. The closely watched “dot plot,” which reflects individual members’ rate projections, pointed to one reduction this year and another in 2027, though the timing remains unclear.
Of the 19 FOMC participants, seven signaled they expected rates to stay unchanged this year, one more than the last update in December. While future years showed a fairly wide disbursement of forecasts, the median outlook is for an additional cut in 2027 before the funds rate steadies out around 3.1% for the long term.
Stocks fell to session lows as the central bank’s decision and comments from Federal Reserve Chair Jerome Powell drew more attention to the threat of persistant inflation.
War’s implications are ‘uncertain’
One factor is the uncertainty associated with the war with Iran that started nearly three weeks ago. The fighting and its impact on the Strait of Hormuz has roiled the global oil market and threatened to keep inflation above the Fed’s 2% target.
“The implications of developments in the Middle East for the U.S. economy are uncertain,” the statement said.
During his news conference, Powell said it was “too soon to know” the impact of the war.
“Near term measures of inflation expectations have risen in recent weeks, likely reflecting the substantial rise in oil prices caused by the supply disruptions in the Middle East,” he said.
Governor Stephen Miran again dissented, favoring a quarter percentage point cut amid rising concerns about the jobs climate. Governor Christopher Waller, who joined Miran in wanting a cut in January, voted this time to hold.
Before the conflict, markets had been pricing in two reductions this year, with a small chance of a third. But rising oil prices and a string of firm inflation readings — entailing data from before the energy shock — have pushed expectations down to at most one cut in 2026.
Faster economic growth seen
In updates to their economic projections, Fed officials see gross domestic product increasing at a 2.4% pace this year, a bit faster than in December. Growth is projected to progress at a solid 2.3% rate in 2027, up three-tenths of a percentage point from the previous outlook.
Officials also upped their inflation outlook for this year. They now expect the personal consumption expenditures price index to reflect a 2.7% inflation rate, both on headline and core. However, they see inflation falling back near the Fed’s 2% target in ensuing years as the impact of tariffs and the war fade. Policymakers continue to expect a 4.4% unemployment rate by year’s end, despite a string of weak payrolls readings.
The Fed’s decision to hold comes against a complicated political backdrop.
President Donald Trump continues to badger Powell and his colleagues to lower rates. Earlier this week, Trump criticized Powell for not calling a special meeting to ease, even with inflation running hot and the uncertainty of the war’s impact.
For his part, Powell presided over what could be his next-to-last meeting as head of the central bank. His term is set to end in May, and Trump has tapped former Fed Governor Kevin Warsh as the successor. Warsh has indicated a preference for lower rates, though he has not issued any recent public statements to indicate where his thinking is now.
Complicating the dynamic further is Trump’s own Justice Department.
U.S. Attorney Jeanine Pirro in Washington has subpoenaed Powell for evidence regarding the Fed’s multibillion-dollar headquarters renovation. Powell, though, has resisted the subpoena, and accused Trump of using it as a pretext to pressure the Fed into lowering rates. A judge sided with Powell on the issue, tossing the subpoenas and agreeing with the notion that the effort was simply to twist Powell’s arm to cut.
However, Pirro has vowed to appeal, and Sen. Thom Tillis, R-N.C., has in turn said he would block Warsh’s nomination in the Senate Banking Committee until the Powell matter is settled. Assuming the court battle continues past May, that would keep Powell in his seat until Warsh is confirmed.
Powell touched on this during the news conference, saying “I have no intention of leaving the board until the investigation is well and truly over, with transparency and finality.”
Once it wraps, Powell is undecided. “I have not made that decision yet, and I will make that decision based on what I think is best for the institution and for the people we serve.”
Powell’s term on the Board of Governors doesn’t expire until early 2028.
Correction: An earlier version of this story misspelled Sen. Thom Tillis’ name.

Key Takeaways
- Red Cat shares rose approximately 12% Wednesday, nearing the 52-week peak of $18.78
- Fourth-quarter revenue projections range from $24M to $26.5M, representing a 1,842% increase from last year’s $1.3M
- Fiscal 2025 revenue outlook of $38M–$41M represents more than double the $15.6M recorded in 2024
- The company’s SRR Tranche 2 agreement with the U.S. Army has grown to approximately $35M in value
- Wall Street analysts maintain a consensus “Hold” rating with a mean price target of $19.33
Red Cat Holdings experienced another strong trading session on Wednesday, with shares advancing roughly 12% during intraday action. The stock reached the $18.10–$18.13 zone as investors awaited the company’s fourth-quarter financial results scheduled for release after market close.
The market’s enthusiasm stems from impressive preliminary figures. In January, the drone manufacturer issued Q4 revenue projections of $24M to $26.5M. Analyst consensus estimates entered the quarter at roughly $23.95M, placing the company’s own forecast comfortably above Street expectations.
To put this in perspective, fourth-quarter 2024 revenue totaled just $1.3M. The projected year-over-year expansion rate of 1,842% is extraordinary by any measure.
For the full 2025 fiscal year, Red Cat anticipates revenue between $38M and $41M — a significant jump from 2024’s $15.6M, exceeding the guidance parameters established last November.
The Growth Catalysts Behind Red Cat’s Performance
The company’s revenue acceleration traces primarily to its U.S. Army Short Range Reconnaissance (SRR) Tranche 2 agreement. Initially secured as a Limited Rate Production contract in July 2025, this deal has expanded to roughly $35M in total value. The contract focuses on Red Cat’s Teal drone technology.
Third-quarter results already telegraphed the coming momentum shift. That period delivered $9.6M in revenue — a 646% year-over-year jump and 200% sequential increase — surpassing analyst forecasts. Following those results, management upgraded Q4 guidance, with CEO Jeff Thompson stating the upcoming quarter would generate “more revenue in one quarter than we have ever done in a 12 month period.”
Thompson also emphasized the Black Widow drone platform as the current primary revenue generator. This system recently gained approval for inclusion in the NATO NSPA catalog, enabling procurement by NATO member states and allied nations.
Beyond terrestrial applications, the company has diversified into new verticals. Its newly launched Blue Ops maritime division represents what Thompson called “perhaps the most exciting strategic expansion” for the business.
Wall Street and Institutional Positioning
Ladenburg Thalmann lifted its RCAT price objective from $15 to $20 in a March 3 research note, maintaining a “Buy” recommendation. Needham reaffirmed its “Buy” rating with a $16 target on March 2. Northland Securities maintains the most bullish outlook with a $22 target established in January, while Weiss Ratings takes a contrarian “Sell” position.
The aggregated analyst view stands at “Hold” with a mean price objective of $19.33.
Institutional investors increased their exposure during the fourth quarter of 2024. Invesco expanded holdings by 36.3%, Janus Henderson grew its stake by 29.5%, and Caitong International Asset Management surged its position by more than 1,800%. Institutional ownership currently represents approximately 38% of shares outstanding.
Technically, the stock trades well above both its 50-day moving average of $13.55 and 200-day moving average of $11.00. Wednesday’s 12% advance positions RCAT just below its 52-week high of $18.78.
CFO Chris Ericson observed that the company’s financial metrics demonstrate enhanced operational leverage as manufacturing capabilities expand to accommodate increasing demand.
The post Red Cat Holdings (RCAT) Stock Surges 12% Near 52-Week Peak on Strong Earnings Outlook appeared first on Blockonomi.


The Federal Reserve held its benchmark fed funds rate range steady at 3.50%-3.75% on Wednesday, as expected.
Down nearly 4% ahead of the anticipated decision following a surge in oil prices and poor inflation data earlier on Wednesday, bitcoin remained sharply lower at $71,600 in the moments following the news.
U.S. stocks remain lower for the day, with the Nasdaq and S&P 500 each down by 0.55%. The 10-year Treasury yield remains higher by a tick at 4.21%.
“The implications of developments in the Middle East for the U.S. economy are uncertain,” said the central bank in its accompanying statement.
The vote to hold policy steady was 11-1, with Stephen Miran voting to trim rates by 25 basis points.
The Fed also updated its economic projections. Of particular note was a sizable rise in inflation expectations — now seen at 2.7% for 2026 versus 2.4% previously. Inflation, however, is expected to drop to 2.2% in 2027 against 2.1% projected earlier.
The so-called “dot plot” continues to show expectations for one 25-basis-point rate cut in 2026 and one more in 2027.
The U.S. central bank must balance what appears to be a slowing employment market with inflation that remains well above its 2% target. Adding to that is the March attack against Iran, which has sent the price of oil to nearly $100 per barrel versus less than $60 earlier this year.
Investors will now turn their attention to Federal Reserve Chair Jerome Powell’s post-meeting press conference at 2:30 pm ET for further insight into the central bank’s outlook.


The decentralized finance sector is well accustomed to lightning-fast exploits, with hackers making off with millions in the blink of an eye. However, a recent attack on Venus Protocol was neither quick, nor profitable.
Indeed, the months-long exploit ended with the attacker down $4.7 million… on-chain, at least.
The latest analysis of Sunday’s hack from audit firm BlockSec states that “the on-chain picture is more complex” than the widely-reported $3.7 million hack, and that “both the protocol and the attacker ended up losing money.”
Read more: Oracle error adds to turmoil at DeFi giant Aave
The attack itself was long-planned and involved accumulating Thena’s THE token over nine months. Allez Labs’ technical post mortem describes how the hacker built up considerable THE positions, funded via Tornado Cash.
They then surpassed Venus’ THE supply cap, manipulated the value of their THE used as collateral, and borrowed assets worth almost $15 million against it.
However, BlockSec’s analysis of the on-chain profit-and-loss found that the hacker “invested $9.92 million and retained only ~$5.2 million after all liquidations, an on-chain net loss of ~$4.7 million.”
Despite the on-chain loss incurred, their payoff may have come from off-chain positions, such as centralized exchange accounts.
Venus Protocol itself was left with $2.1 million of bad debt as liquidation bots sold THE collateral into thin liquidity. Allez Labs also notes that the attack vector “was flagged in a 2023 Code4rena audit but dismissed as having ‘no negative side effects.’”
One security researcher claims to have made $15,000 shorting THE whilst tracking the exploit.
Read more: Whitehat hacker accuses Injective of ghosting after $500M bug disclosure
Venus: Too close to the sun
Venus Protocol is the largest lending platform on BNB Chain (formerly Binance Smart Chain), with $1.45 billion in total value locked.
Launched in 2020, it’s seen more than its fair share of trouble over the years.
In September, fears of a $27 million hack turned out to be a Venus user falling for a phishing scam. The protocol was paused and the user’s position was liquidated to recover the stolen funds.
Read more: DeFi exploiter targets lending protocols with oracle tricks
A year ago, the platform incurred $900,000 of bad debt “from an oracle manipulation attack that nobody saw coming… except everyone should have.”
The incident’s post mortem report put the blame on “Mountain’s WUSDM Exchange Rate Oracle.”
In 2023, the protocol braced for the liquidation of $150 million in BNB from 2022’s $600M hack of the BNB Bridge.
Venus was one of many protocols affected by the fallout of 2022’s LUNA meltdown. It accrued $14 million in bad debt when a Chainlink price feed for LUNA bottomed out.
Finally, volatility on its native token XVS led to $200 million in liquidations and caused $90 million in bad debt back in 2021.
Got a tip? Send us an email securely via Protos Leaks. For more informed news and investigations, follow us on X, Bluesky, and Google News, or subscribe to our YouTube channel.
Bitcoin’s (BTC) bullish start to the week faced a halt on Wednesday, as BTC dropped 3.4% to $70,900 alongside an overarching sell-off in US stocks.
The correction followed a hotter-than-expected Producer Price Index (PPI) report, which was 0.7% higher than the 3.4% year-on-year estimate. Despite the selling, data shows BTC spot market demand holding steady, with buyers stepping in to absorb the selling pressure and proof of this appetite being reflected by Bitcoin reclaiming $72,000 after Federal Reserve minutes highlighted their decision to leave interest rates unchanged.
While the market consensus had tilted toward the Fed choosing to pause on interest rate changes, market volatility in oil prices, equity markets, and persistent tension over the recently started US and Israel-Iran war had traders on edge.
Bitcoin bulls need to defend these price levels
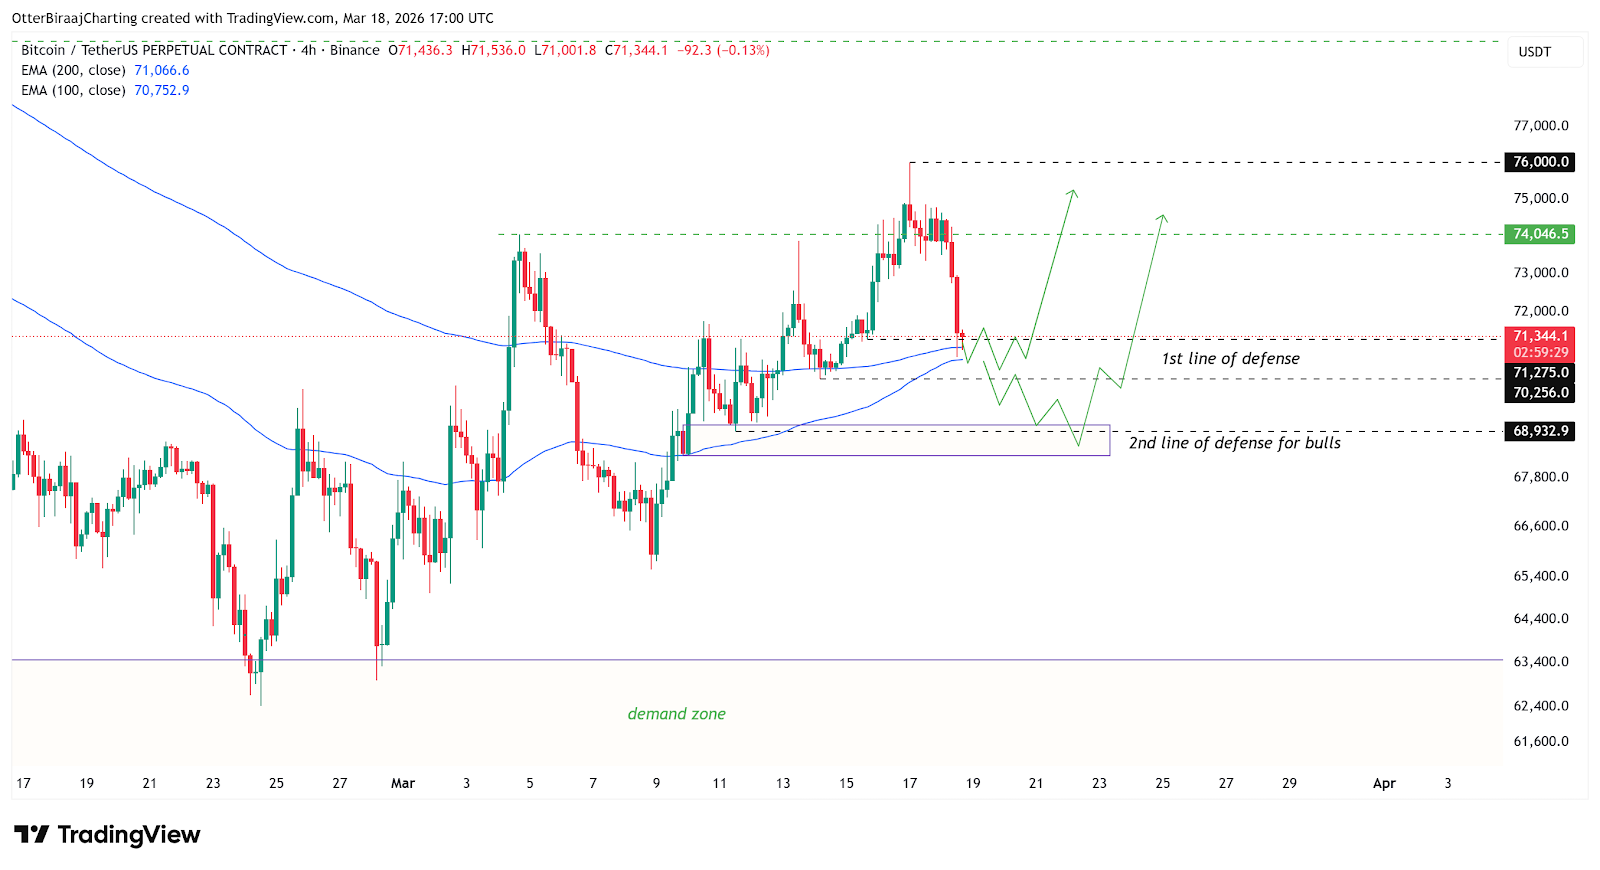
On the four-hour chart, Bitcoin shows a higher low pattern, keeping the short-term uptrend intact. The price action is holding above both the 100- and 200-period exponential moving averages (EMAs), which are acting as dynamic support.
These moving averages track the average prices over time and define the trend direction when aligned below the price.
The confluence may allow BTC to stabilize near $71,000, forming a potential base after today’s sell-off.

From a technical standpoint, BTC needs to defend the $70,250 to $71,275 range, which marks the internal liquidity levels built during Monday’s breakout.
This zone represents the areas where orders were previously filled, possibly attracting a liquidity sweep again.
Losing this range exposes the next liquidity pocket near $68,900. That level aligns with a small order block between $68,300 and $69,100, where prior demand briefly absorbed the selling pressure.
Maintaining these levels keeps the lower time frame trend structurally bullish for BTC, with higher lows signaling continued demand on dips.
Related: Bitcoin tests fresh decoupling trade as tech correlation drops to 2018 lows
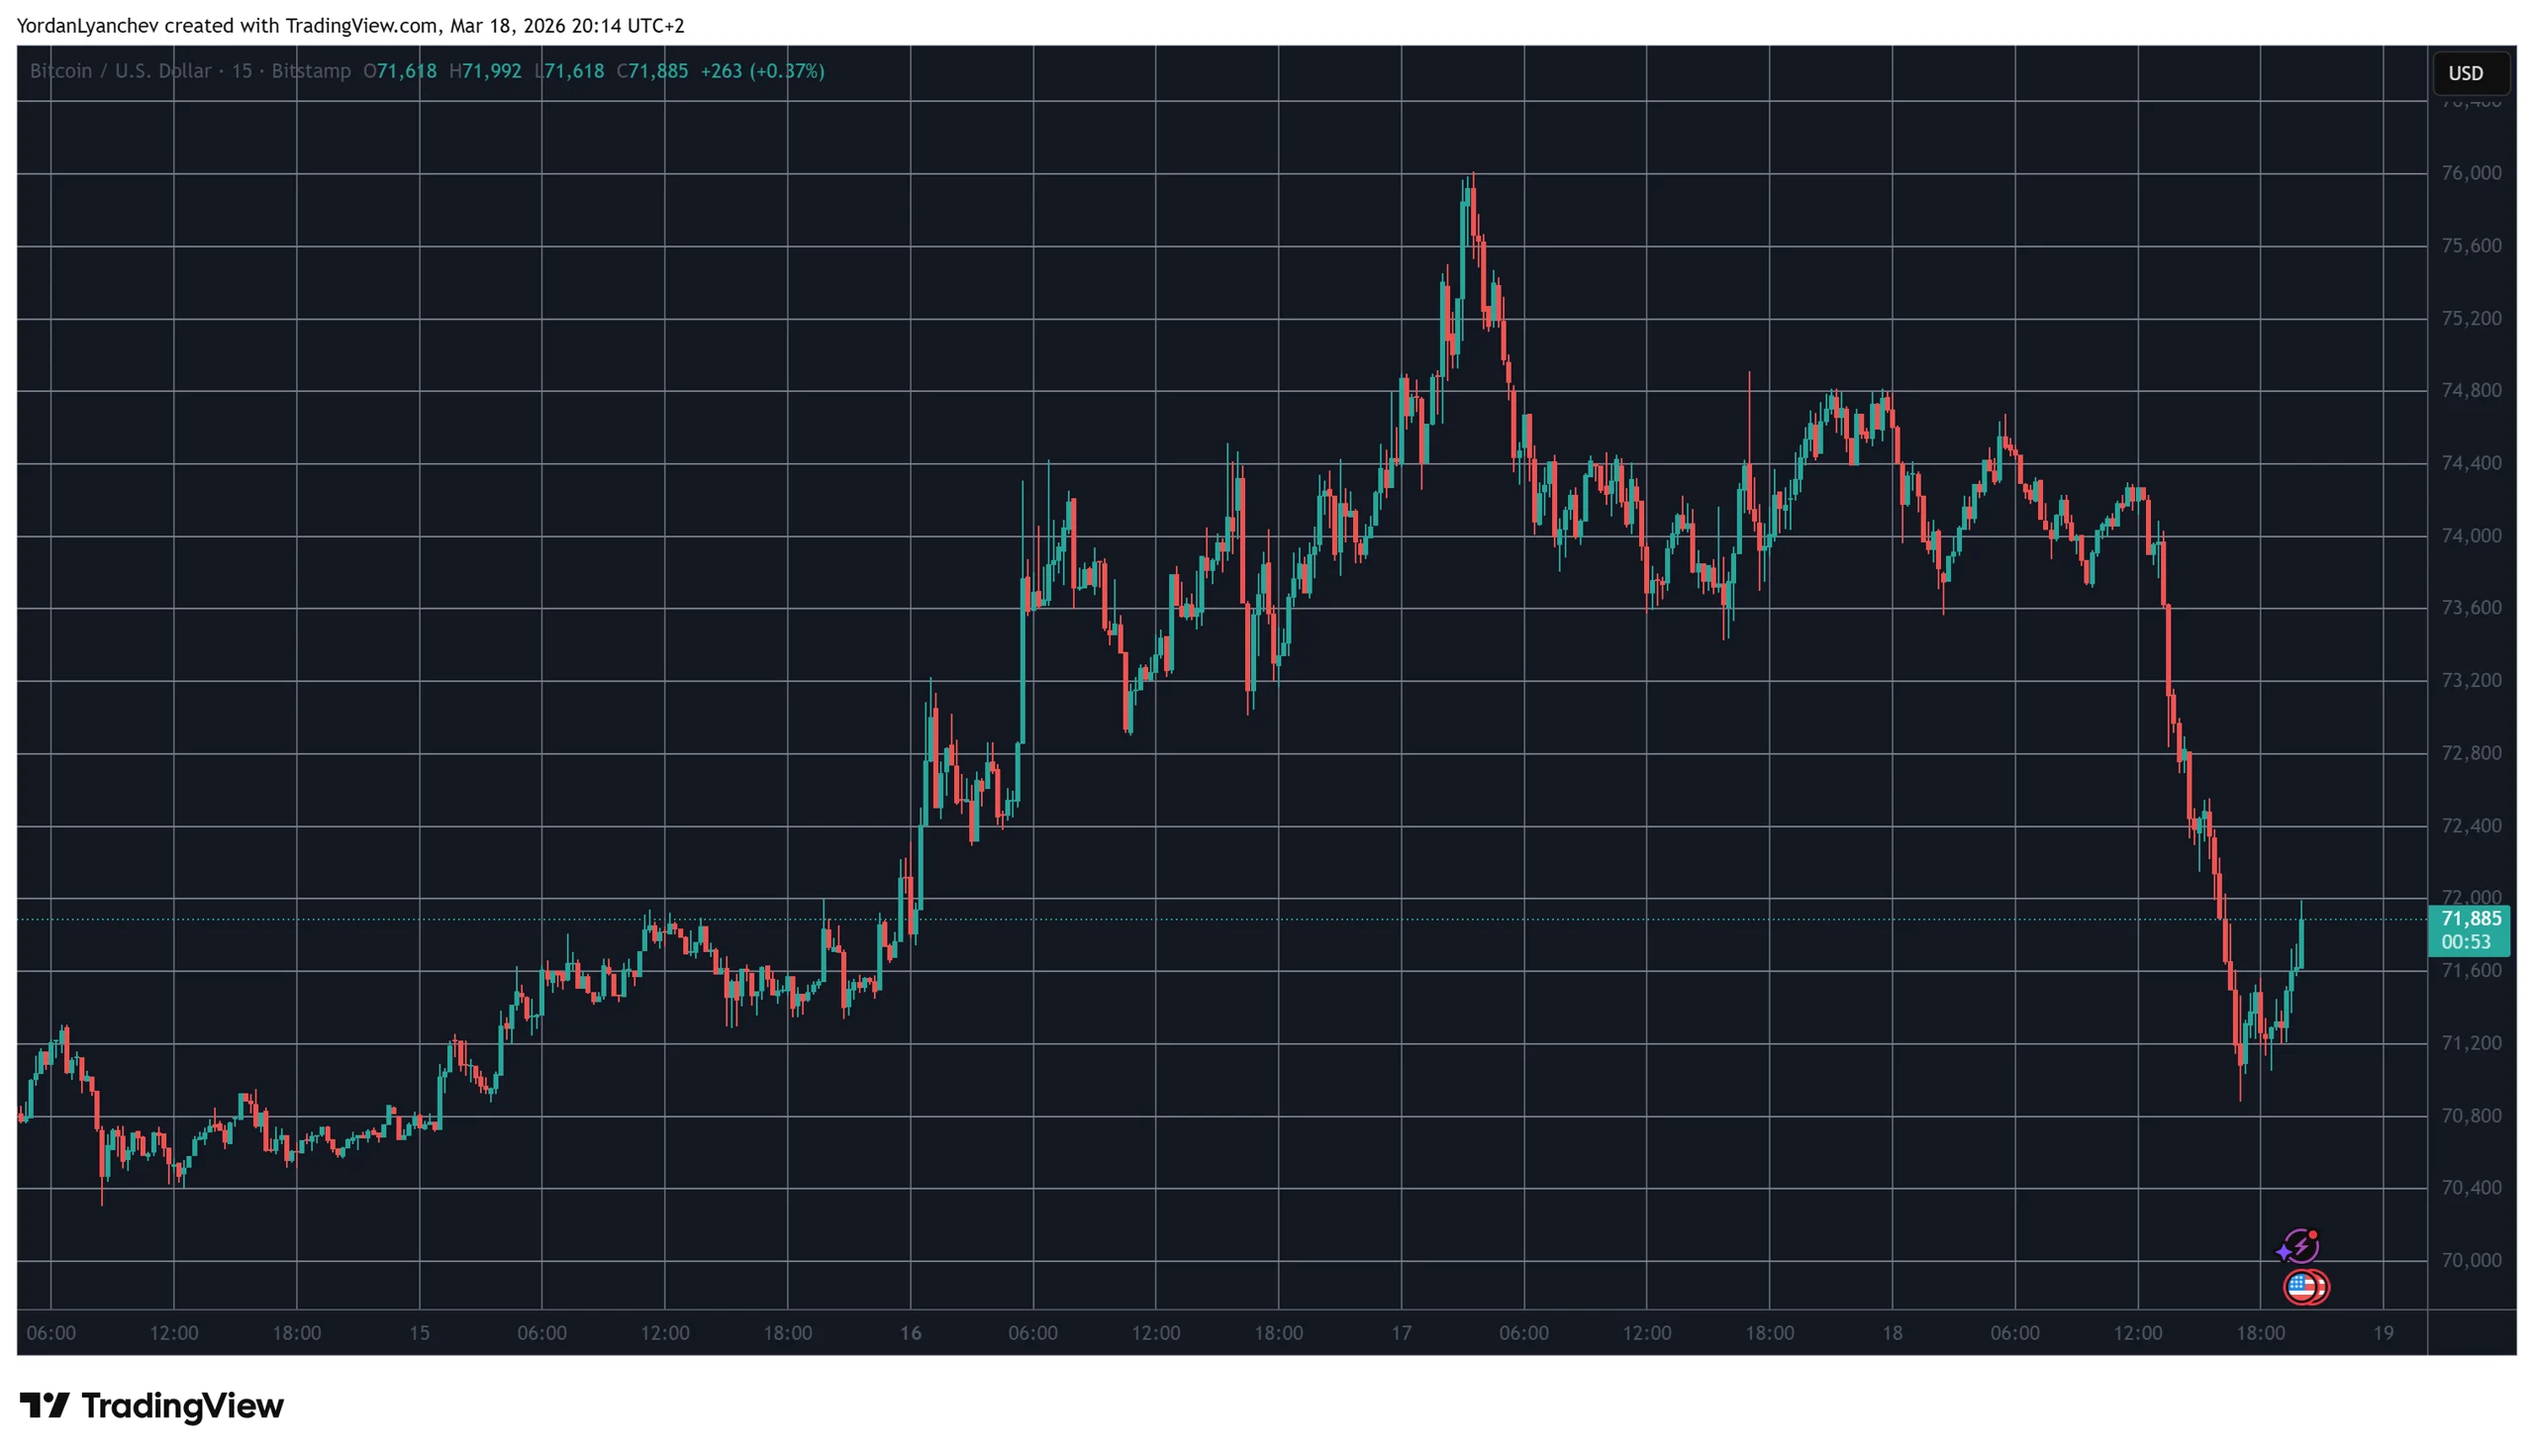
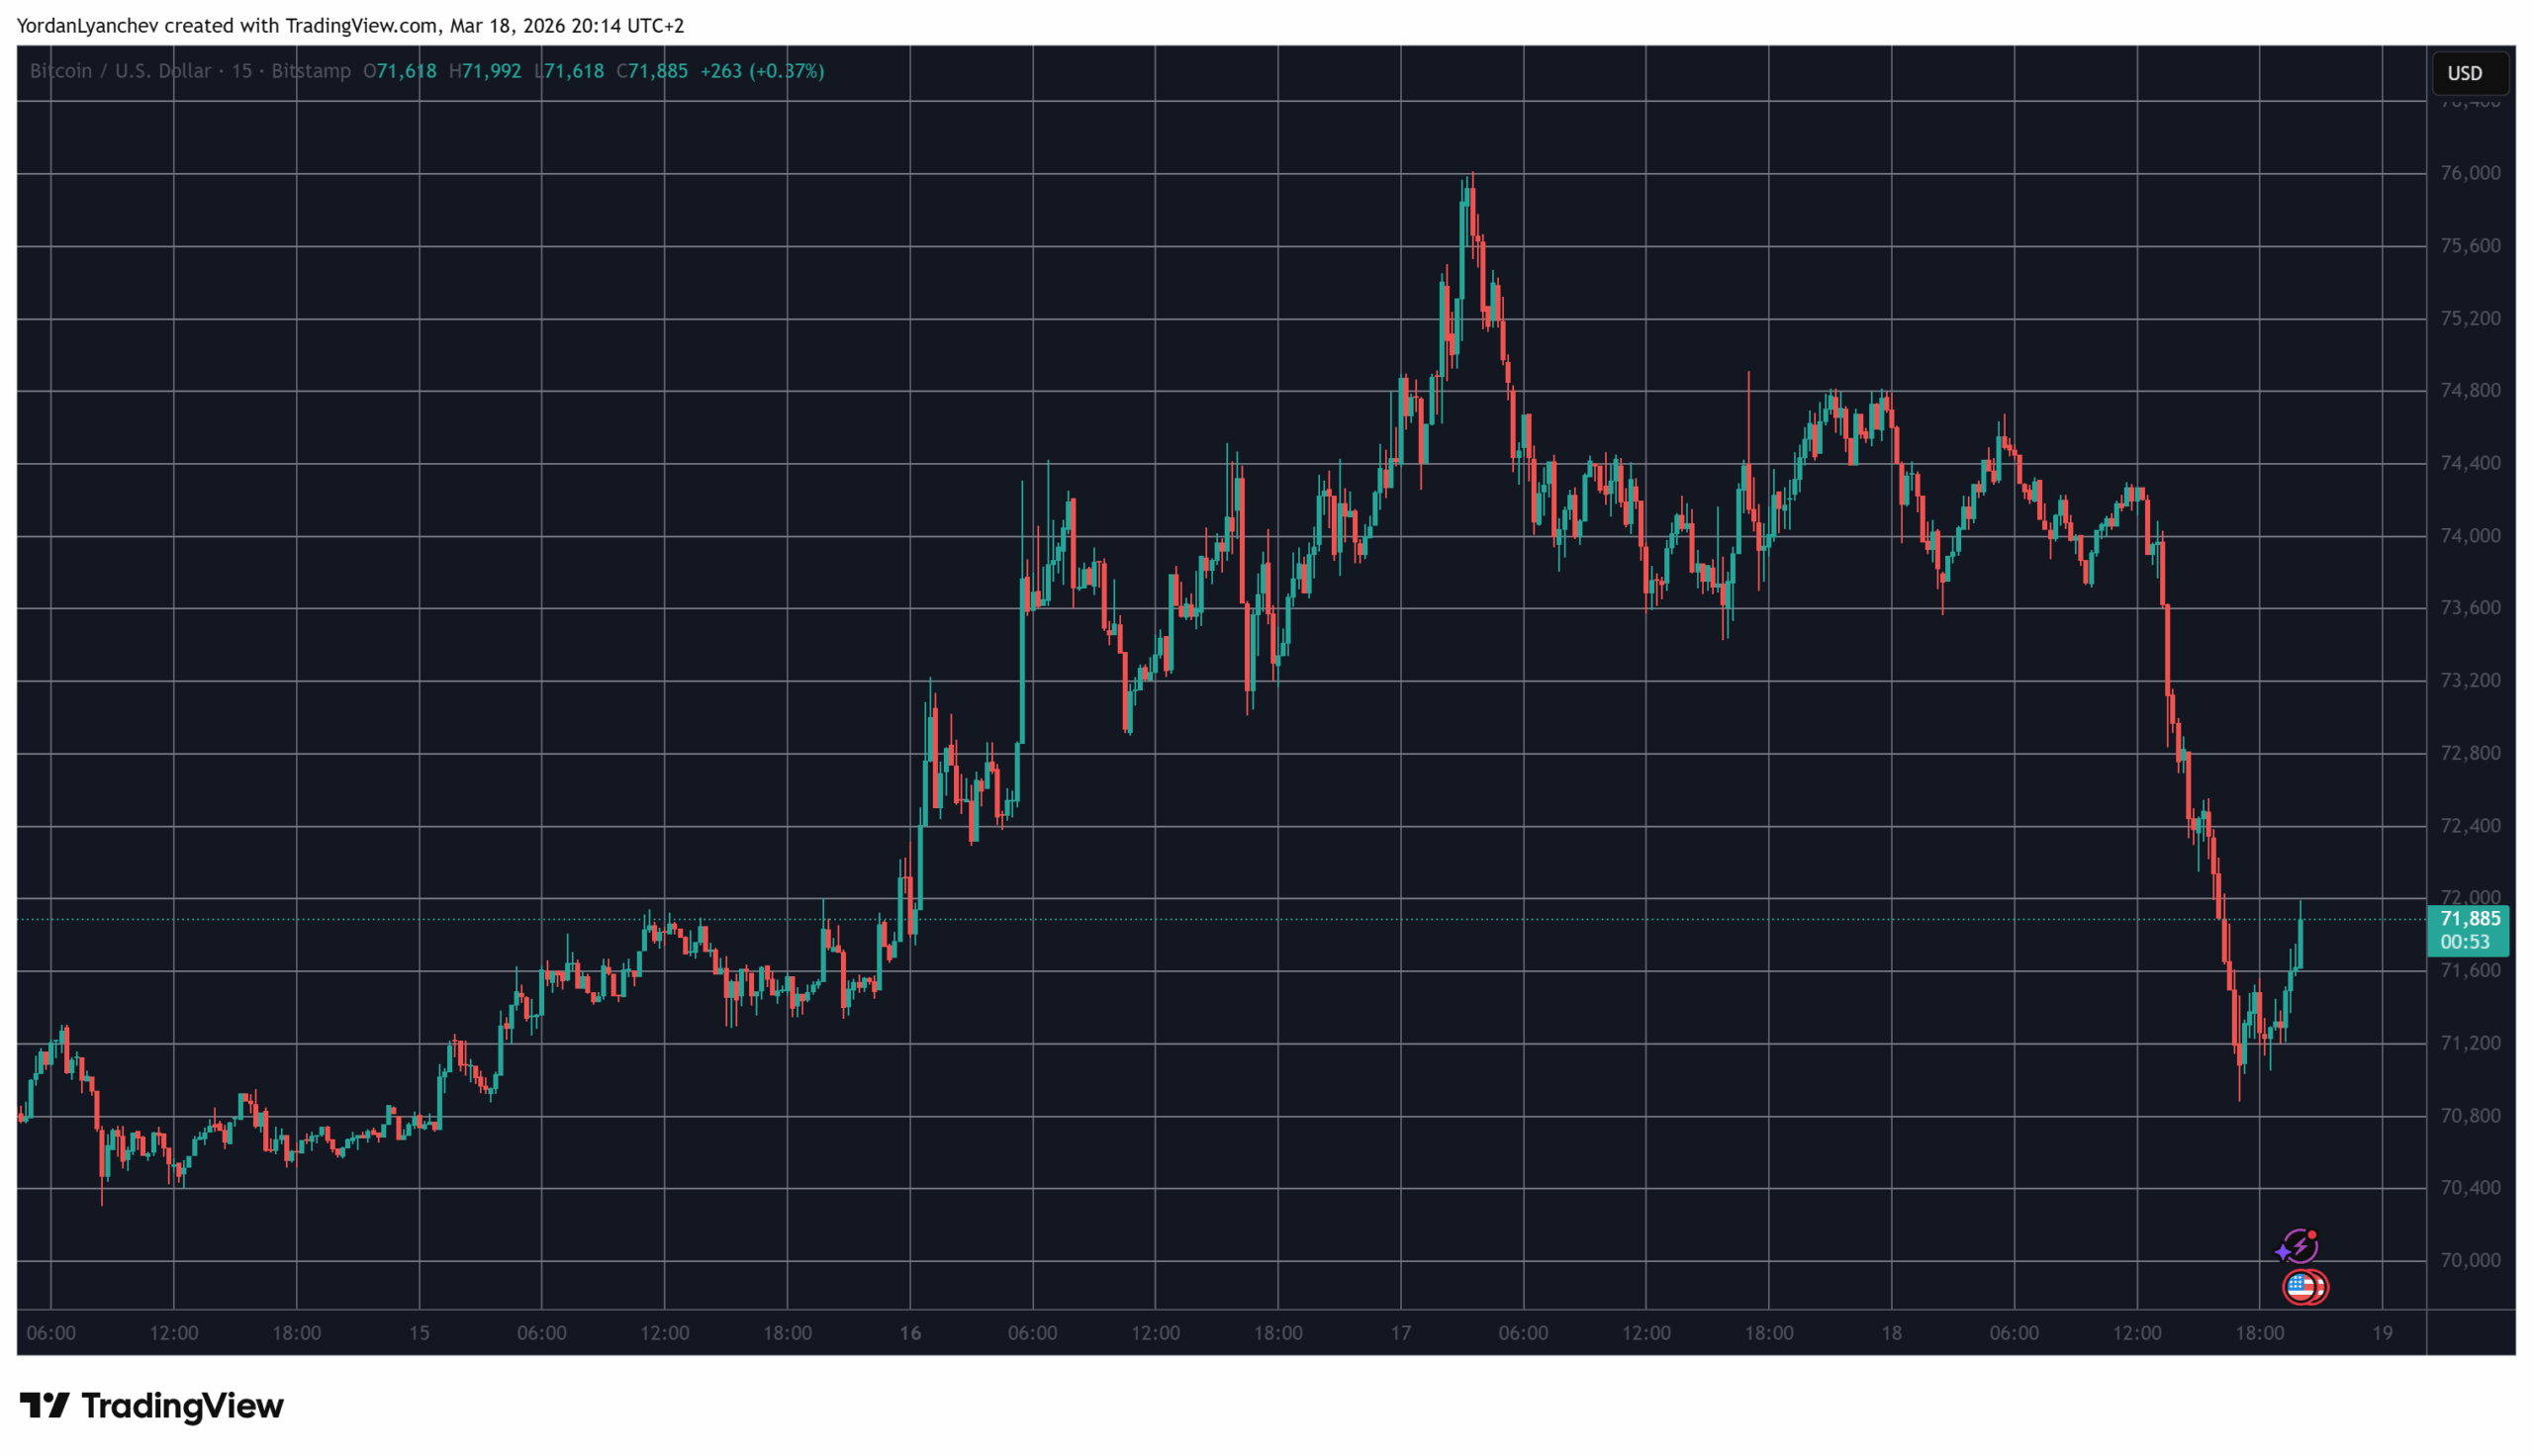
Bitcoin profit-taking meets bid absorption under $74,000
Prior to today’s correction, Bitcoin onchain data pointed to rising sell-side activity from short-term holders (STHs) on Tuesday. According to crypto analyst Darkfost, over 48,000 BTC in profit moved to exchanges in a single day as the price approached $75,000. This indicated that the buyers continued to lock in gains, treating the price rebounds as exit opportunities.
At the same time, CoinGlass data shows passive bids being filled during the drop to $71,000 from $74,000. Similar absorption patterns over the past two weeks have preceded short-term recoveries, highlighting consistent demand at lower levels.

Meanwhile, BTC’s reaction to the previous Federal Reserve meetings added insight. Market analyst Sherlock said that since June, 2025, Bitcoin has declined after each of the last six Federal Open Market Committee (FOMC) meetings, regardless of rate direction.
With the markets pricing in another hold on interest rates, traders’ attention may shift to how Bitcoin price reacts around current liquidity clusters, especially near $71,000.

Related: Bhutan offloads an additional $72.3M Bitcoin amid market downturn
This article does not contain investment advice or recommendations. Every investment and trading move involves risk, and readers should conduct their own research when making a decision. While we strive to provide accurate and timely information, Cointelegraph does not guarantee the accuracy, completeness, or reliability of any information in this article. This article may contain forward-looking statements that are subject to risks and uncertainties. Cointelegraph will not be liable for any loss or damage arising from your reliance on this information.
Bitcoin’s price tumbled before the news went out but it staged a minor recovery.
In alignment with most experts’ beliefs, the United States Federal Reserve kept the key interest rates unchanged for the second consecutive time in 2026.
BTC already experienced some volatility in the hours leading up to the second FOMC meeting of the year, dropping by $5,000 at one point. However, it has bounced toward $72,000 since the news went out.
America’s central bank maintained the federal funding rate, meaning what banks are charging each other for short-term loans, in the current range between 3.50% and 3.75%.
Experts noted before today’s announcement that the likely justification for this is the war that began in the Middle East, which has immediately impacted oil prices.
“The conflict with Iran has dramatically altered the backdrop to the March Federal Open Market Committee (FOMC) meeting and significantly increases the risks to inflation and the economy,” commented Oxford Economics’ chief US economist, Michael Pearce.
Bitcoin’s price reacted immediately to the news, even though it was expected. The asset had lost $5,000 earlier today in the hours leading up to the second FOMC meeting of the year, but bounced to $72,000 after the Fed’s decision went live.
Binance Free $600 (CryptoPotato Exclusive): Use this link to register a new account and receive $600 exclusive welcome offer on Binance (full details).
LIMITED OFFER for CryptoPotato readers at Bybit: Use this link to register and open a $500 FREE position on any coin!

Key Takeaways
- Cryptocurrency exchange Kraken postpones its anticipated $20 billion public offering due to unfavorable market conditions.
- Strategic acquisitions and platform expansion remain priorities as the company prepares for eventual market debut.
- Reduced trading activity and falling cryptocurrency valuations influence the timing delay.
- While some crypto companies proceed with listings, Kraken opts to wait for improved market sentiment.
- The exchange continues bolstering its infrastructure through key acquisitions ahead of future IPO attempt.
The cryptocurrency exchange Kraken has decided to postpone its public offering plans as digital asset markets experience an extended period of weakness. Following the submission of a preliminary S‑1 registration document to the Securities and Exchange Commission this past November, the company now faces challenging conditions characterized by depressed asset valuations and diminished trading activity.
Payward, the entity behind Kraken, achieved a $20 billion valuation following a successful $800 million capital raise. The financing round included a substantial $200 million investment from Citadel Securities, demonstrating institutional confidence in blockchain technology development. However, the cryptocurrency sector’s turbulence following Bitcoin’s peak price levels has created an unfavorable environment for public offerings.
Executives at the exchange have indicated plans to reconsider the public listing when market fundamentals demonstrate sustainable improvement. The combination of compressed valuations and subdued trading volumes has directly influenced decisions regarding IPO timing. Numerous cryptocurrency enterprises are carefully monitoring market dynamics before proceeding with their own public market debuts.
Cryptocurrency Sector Public Offering Landscape
The previous year witnessed an explosion of crypto-related IPO activity in 2025, with companies collectively securing $14.6 billion in capital. Notable participants included Circle, Bullish, and Gemini. This figure represented a dramatic leap from the modest $310 million accumulated during 2024. Positive regulatory developments from the SEC during that period created momentum for digital asset firms seeking public markets.
Currently in 2026, companies emphasizing infrastructure and compliance capabilities are leading the charge in public offering preparations. These organizations emphasize regulatory adherence, operational stability, and predictable revenue streams. Such characteristics resonate more effectively with conventional public market investors and meet stricter governance requirements.
BitGo emerged as 2026’s inaugural significant cryptocurrency public listing, successfully raising $213 million with shares priced at $18. Subsequently, the stock price declined roughly 44% amid broader market headwinds. This performance demonstrates how sensitive investor sentiment remains to cryptocurrency market fluctuations.
Strategic Positioning and Future Public Market Plans
Kraken has aggressively pursued strategic acquisitions to enhance platform capabilities, completing transactions for NinjaTrader and Backed Finance. The exchange also secured token management specialist Magna to diversify its digital asset service portfolio. Additionally, Kraken launched tokenized equity perpetual futures trading through its xStocks platform for international clients.
The postponement of public listing plans corresponds with organizational restructuring, including the earlier departure of CFO Stephanie Lemmerman this year. Leadership continues assessing optimal market timing for the eventual public debut. The acquisition strategy serves to strengthen operational infrastructure and market positioning ahead of renewed IPO efforts.
Meanwhile, other cryptocurrency platforms such as Securitize are advancing with public offering timelines despite challenging market dynamics. Securitize anticipates receiving SEC clearance and completing its Nasdaq listing during the second quarter. The company’s $225 million private investment in public equity (PIPE) financing provides financial cushioning amid ongoing market uncertainty.
Kraken’s public offering remains suspended as cryptocurrency markets work toward stabilization. Industry observers expect more favorable conditions will eventually emerge, catalyzing additional public offerings. The exchange’s current emphasis centers on operational excellence and sustainable expansion before ultimately pursuing its public market ambitions.


Bonnie Blue Hits Sex Snag In The UK After 400 Men Exploit

Israel is using AI rumours to hide its murderous tactics

PWHL lands first national TV deal for Walter Cup Finals


-
Crypto World5 days ago
HYPE Token Enters Net Deflation as HyperCore Buybacks Outpace Staking Rewards
-

 Tech3 days ago
Your Legally Registered ‘Motorcycle’ Might Not Count Under Proposed US Law
-

 Fashion5 days ago
Weekend Open Thread: Addict Lip Glow
-
Sports4 days ago
Why Duke and Michigan Are Dead Even Entering Selection Sunday
-

 Business3 days ago
Search for Savannah Guthrie’s Mother Enters Seventh Week with No Arrests
-
 Tech1 day ago
Are Split Spacebars the Next Big Gaming Keyboard Trend?
-

 Business4 days ago
US Airports Launch Donation Drives for Unpaid TSA Workers as Partial Government Shutdown Enters Fifth Week
-
Crypto World4 days ago
Coinbase and Bybit in Investment Talks: Could Bybit Finally Enter the US Crypto Market?
-

 Business4 days ago
Country star Brantley Gilbert enters growing non-alcoholic beer market
-

 Business2 days ago
Australian shares drop as Iran war enters third week
-

 Crypto World2 days ago
Crypto Lender BlockFills Enters Chapter 11 with Up to $500M in Liabilities
-

 Sports5 days ago
College Basketball Best Bets: Conference Tournament Semifinal Picks
-

 Politics10 hours ago
The House | The new register to protect children from their abusers shows Parliament at its best
-

 Crypto World7 days ago
Three Binance Charts May Be Hinting at Bitcoin’s Next Move
-

 Business6 days ago
Trump demands Powell cut rates as Iran conflict raises energy prices
-

 Crypto World6 days ago
Senate Votes to Include CBDC Ban in Bipartisan Housing Bill
-

 Fashion2 days ago
25 Celebrities with Curly Hair That Are Naturally Beautiful
-

 News Videos2 hours ago
RBA board divided on rate cut, unusually buoyant share market | Finance Report | ABC NEWS
-

 NewsBeat6 days ago
Deane Road crash near Bolton colleges and university
-

 News Videos6 days ago
Tom Lee: The 100x Opportunity EVEN Bigger Than Bitcoin (New Ethereum Prediction 2026)


You must be logged in to post a comment Login