

Crypto World
Is ETH Building a Base at $1.8K or Preparing for $1.5K?
Ethereum remains under sustained downside pressure after the February liquidation cascade, with the price now stabilizing around the mid-$1,800s.
The broader structure still reflects a cyclical correction rather than a completed bottom, but short-term momentum has cooled, and the market is attempting to build a base above a major higher-timeframe demand region.
Ethereum Price Analysis: The Daily Chart
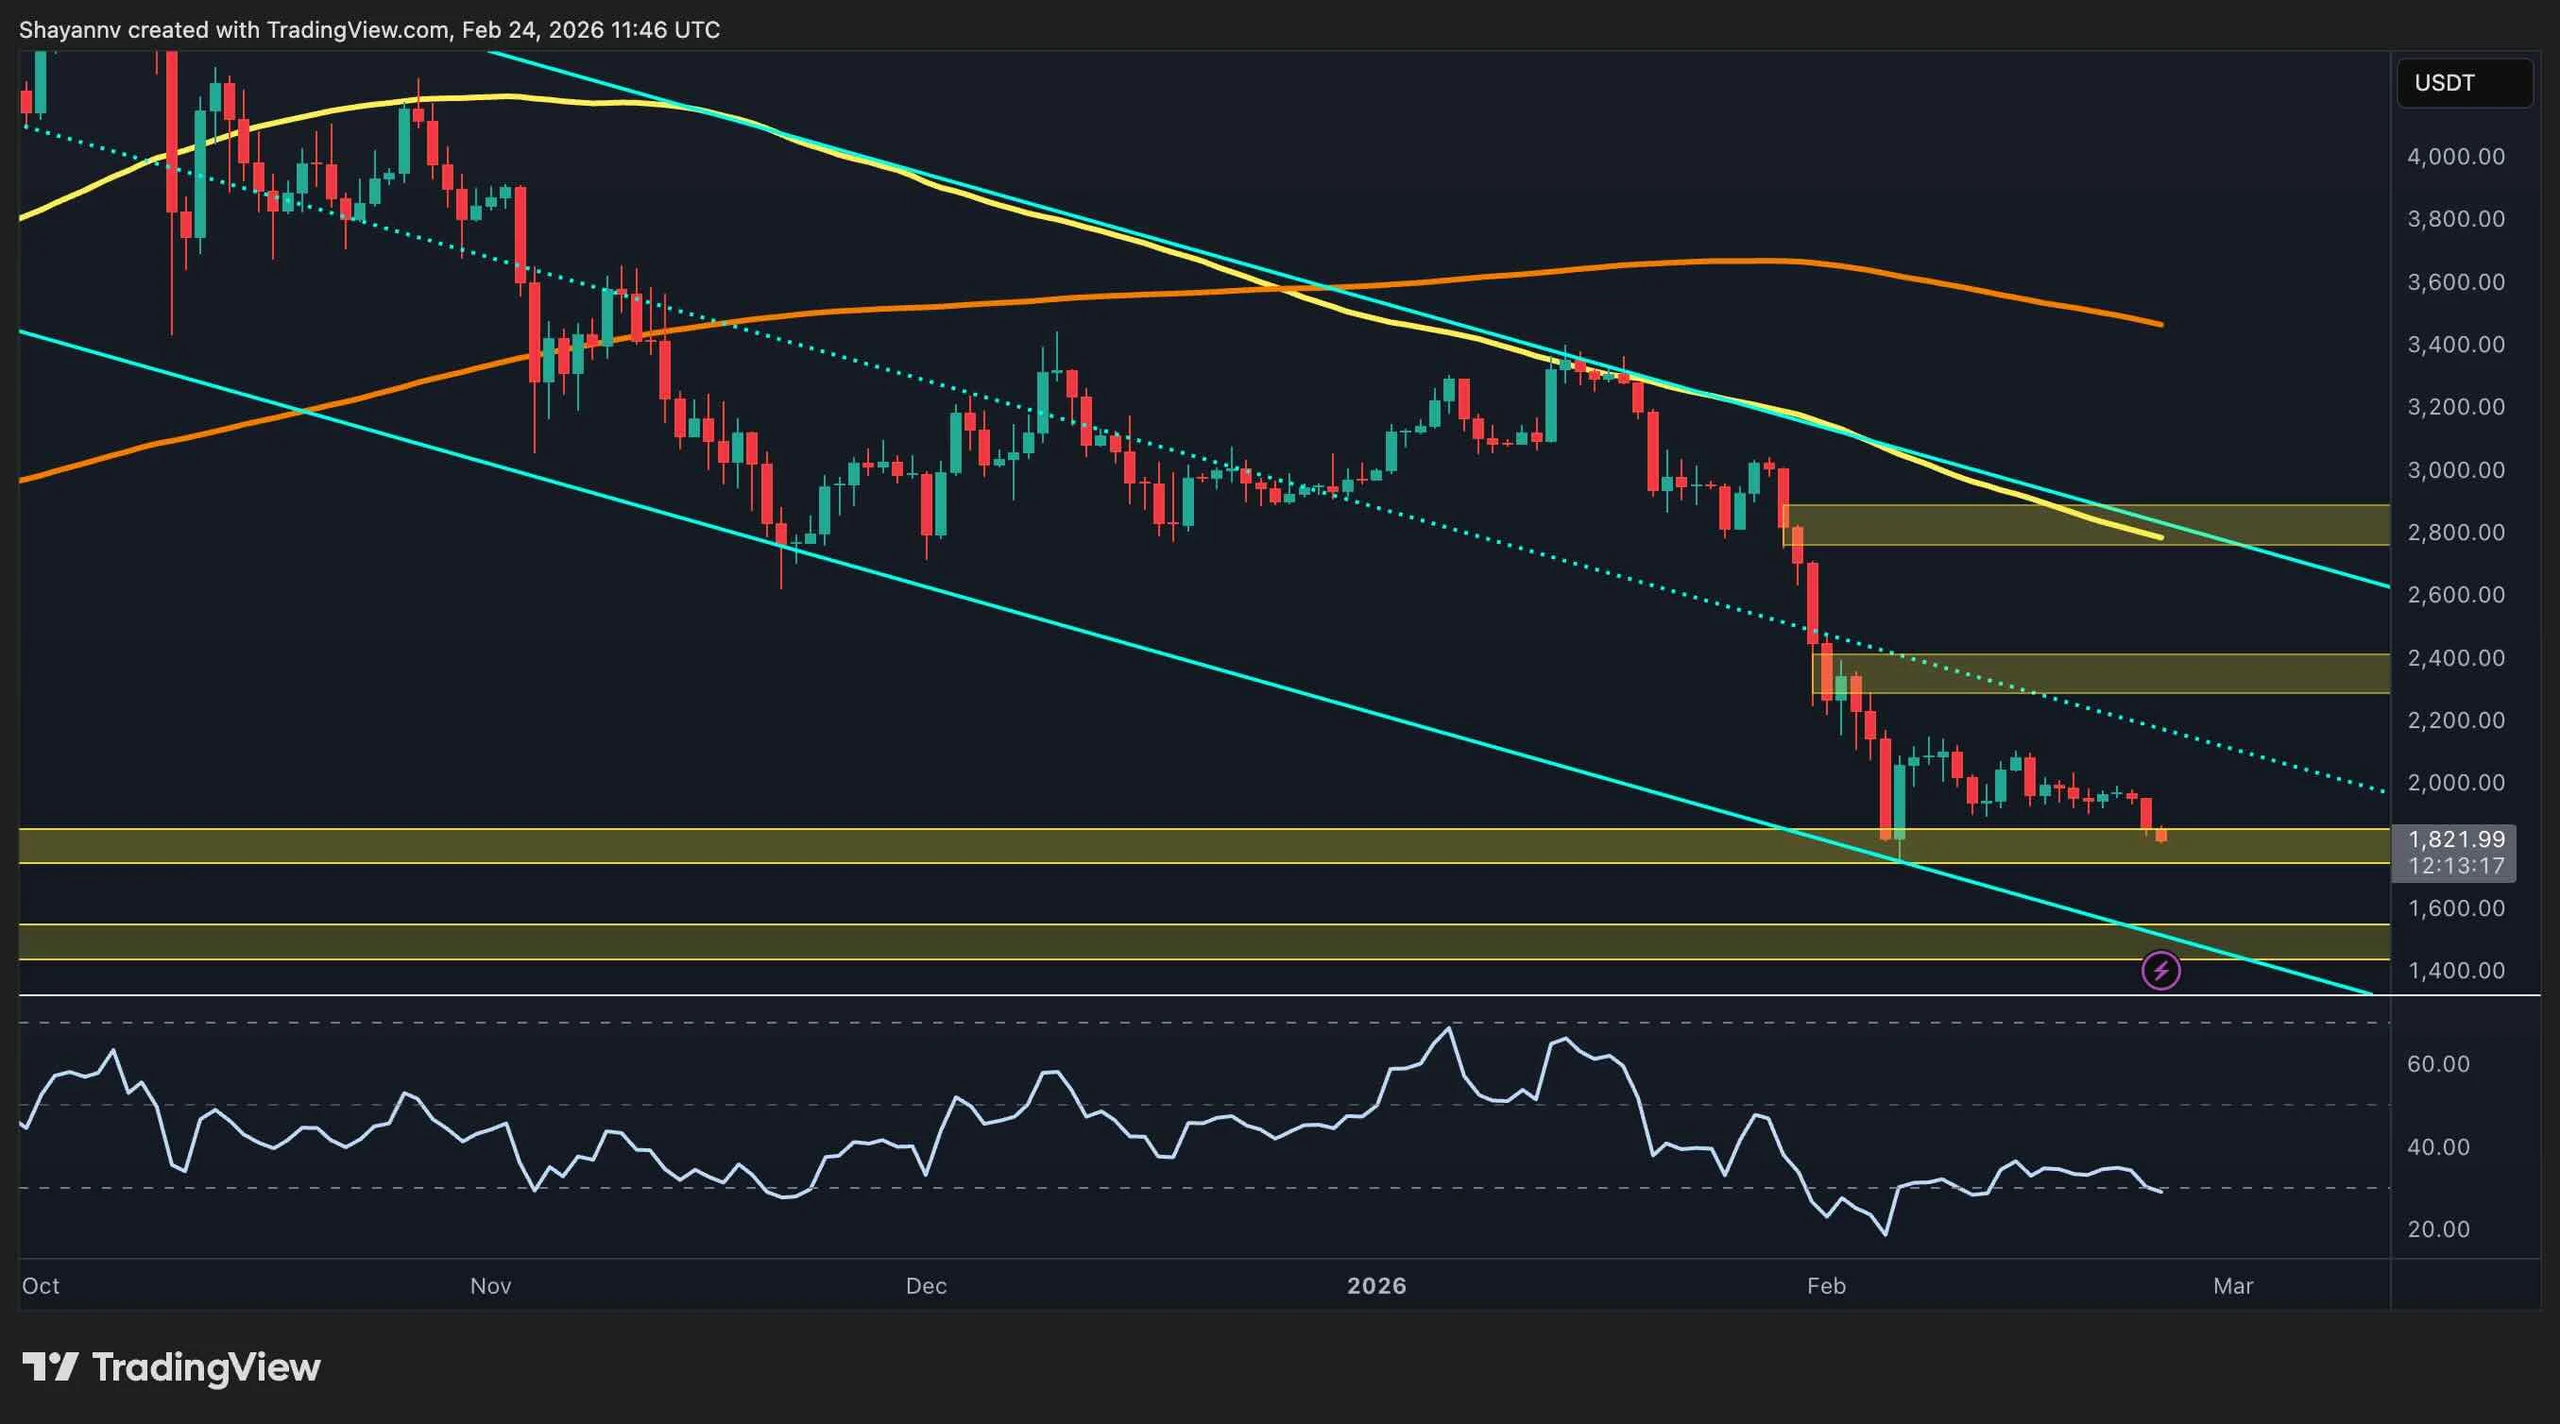
On the daily chart, ETH trades within a well-defined descending channel, with the price currently hugging the lower half of the structure near $1,800–$1,850. The breakdown from the $2,300–$2,400 support block and the rejection well below the declining 100-day and 200-day moving averages confirm a bearish medium-term trend, while the daily RSI remains depressed near oversold territory, consistent with a strongly extended move.
The immediate technical focus is the horizontal demand band around $1,750–$1,800, and sustained consolidation above this area could allow a mean-reversion bounce toward the $2,000–$2,200 zone, whereas a decisive loss of it would open the door toward deeper supports closer to $1,500–$1,600 and the lower boundary of the channel.
ETH/USDT 4-Hour Chart
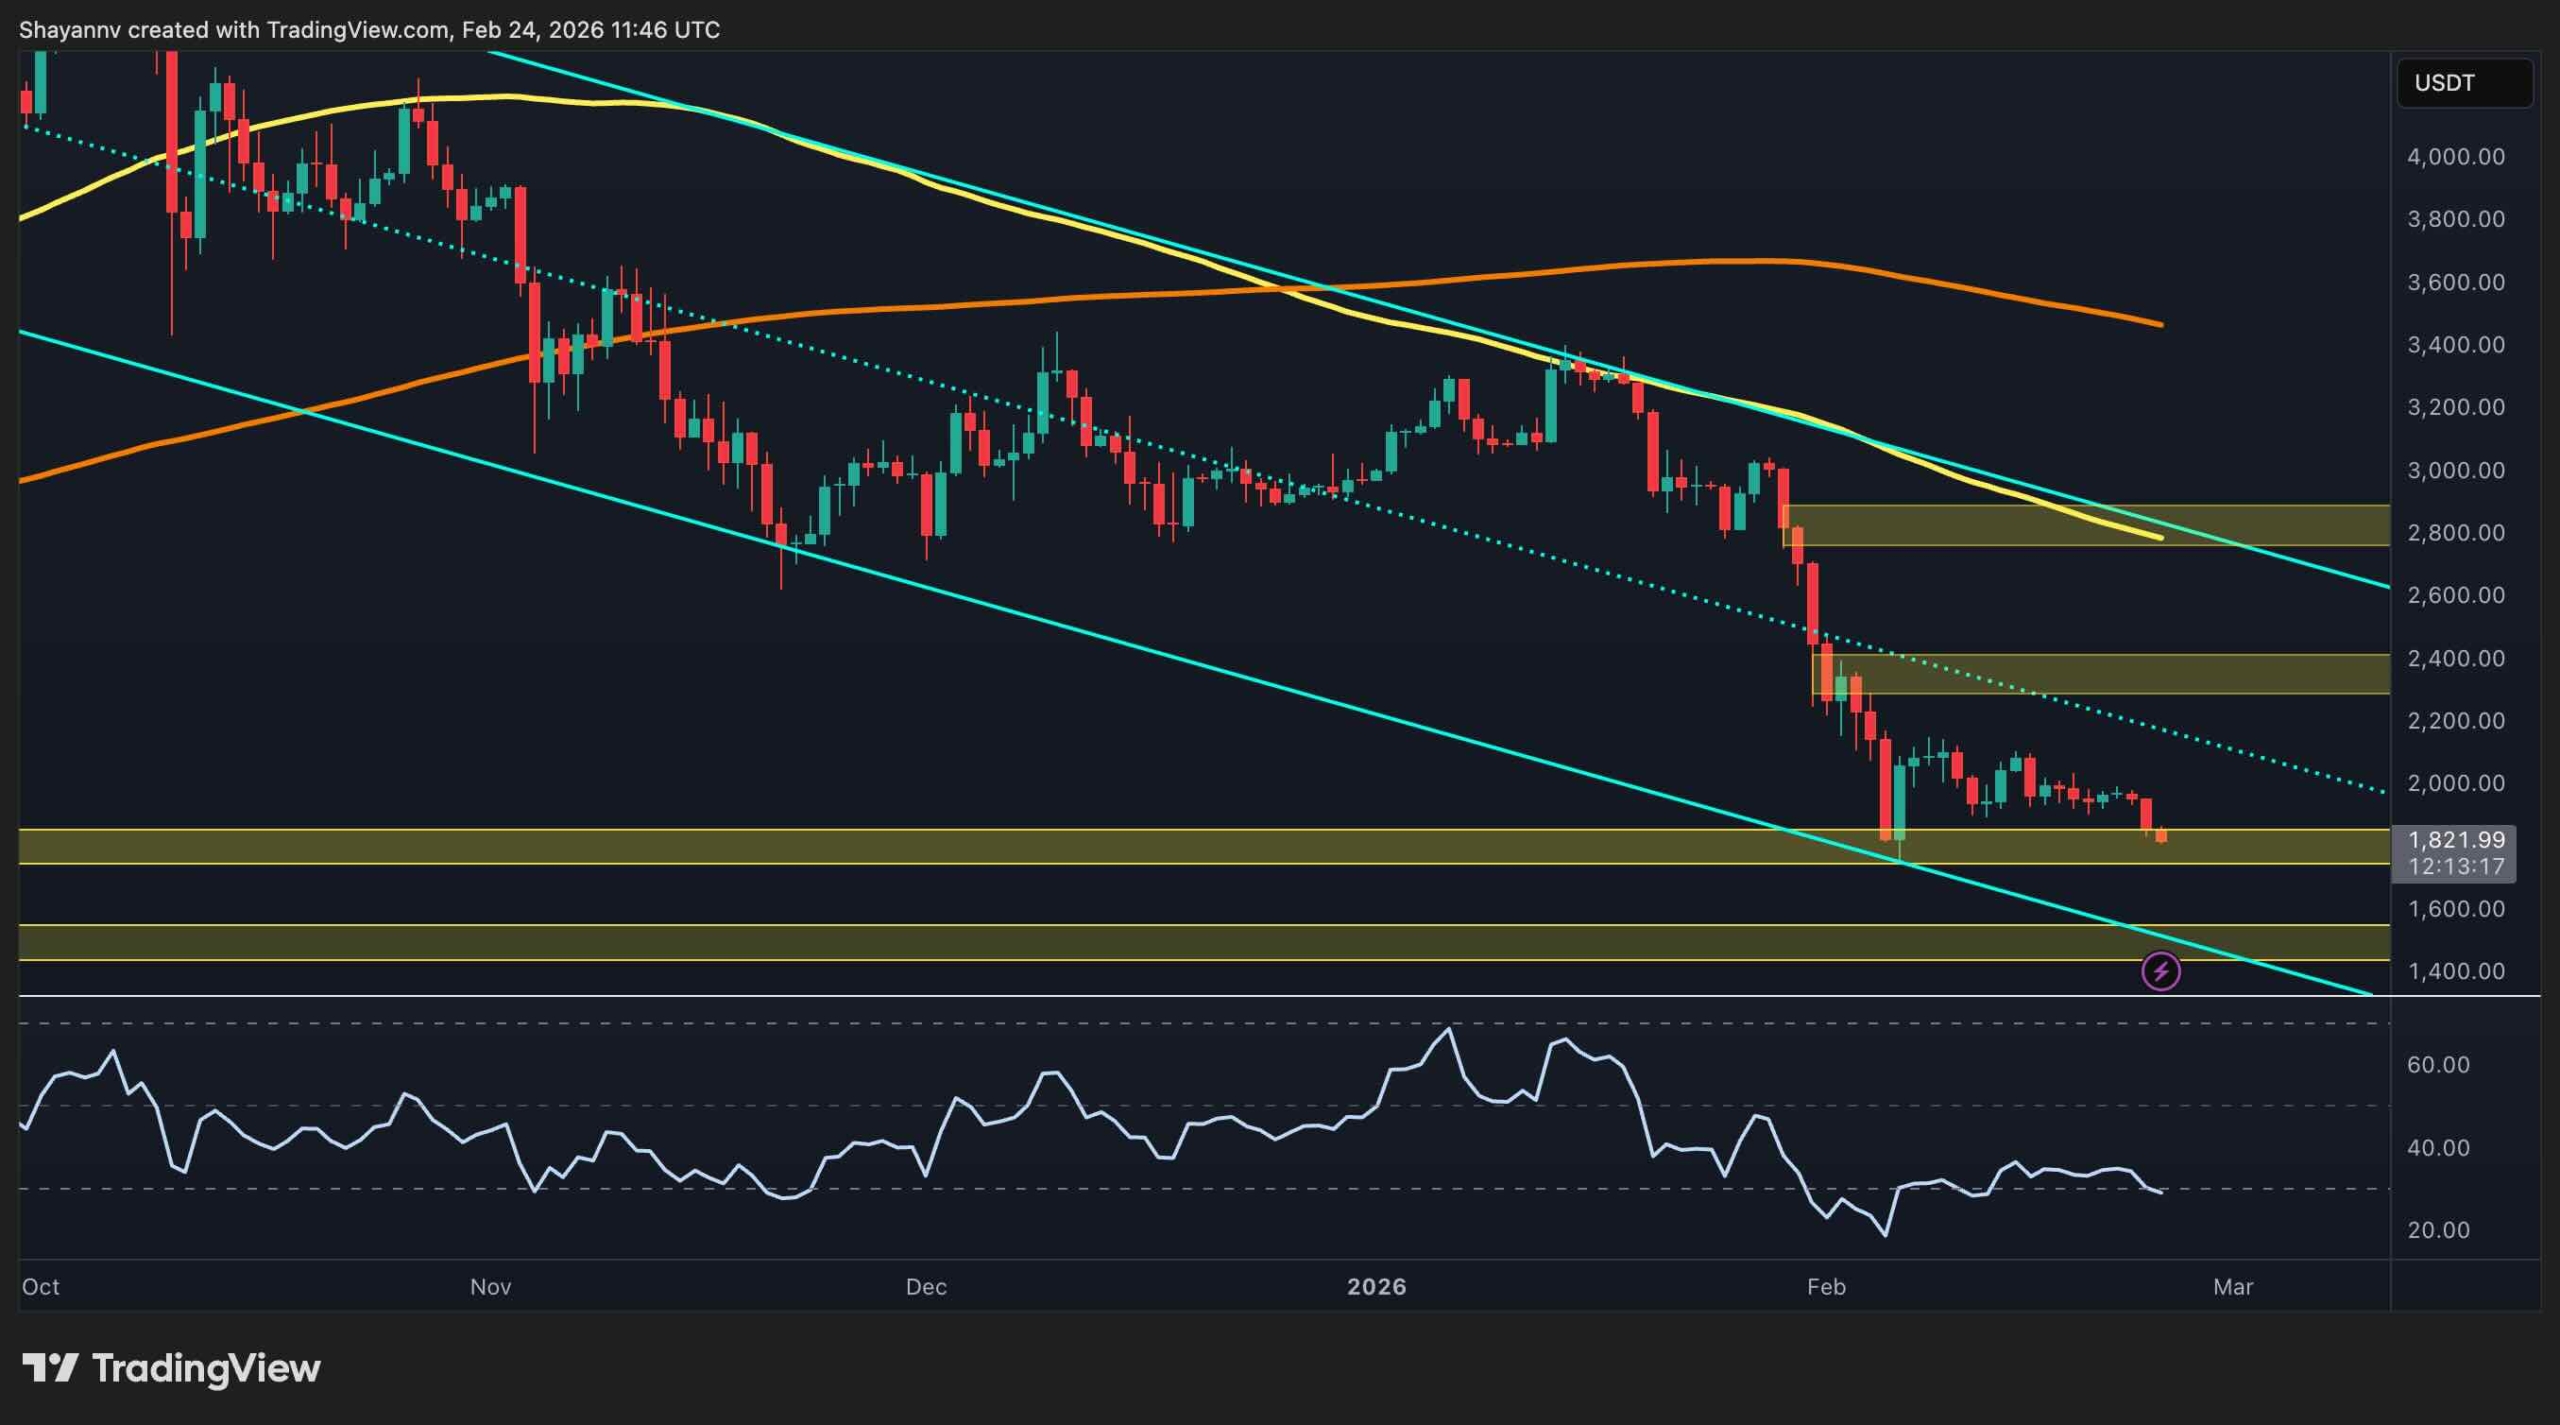
On the 4-hour chart, the prior ascending support line originating from the early-February low has been broken, and the asset is now consolidating just below that trendline inside the same $1,750–$1,850 demand zone. Short-term momentum is weak but no longer accelerating lower, with the RSI flattening after an oversold print, which often precedes either a sideways consolidation or a corrective rebound.
As long as the market holds above the recent intraday lows around the $1,750 mark, the structure allows for a retracement back toward $1,900–$1,950, where the former range floor and short-term moving averages converge. Failure to defend the $1,780 area would likely trigger another round of selling toward the next liquidity pocket below $1,700.

On-Chain Analysis
Perpetual futures positioning reflects a markedly defensive stance: funding rates across major exchanges have flipped sharply negative and remain below zero after the recent decline, indicating that short positions are paying longs and that the derivatives market is skewed toward bearish exposure.
This shift follows a prolonged period of mostly positive funding during the prior uptrend, suggesting that a large portion of the current move has been driven by aggressive shorting and long liquidations rather than organic spot selling alone.
While persistent negative funding can reinforce downside pressure if spot demand stays weak, in combination with an oversold technical backdrop, it also creates the preconditions for a short squeeze should price stabilize and buyers step in around the present support cluster.

Binance Free $600 (CryptoPotato Exclusive): Use this link to register a new account and receive $600 exclusive welcome offer on Binance (full details).
LIMITED OFFER for CryptoPotato readers at Bybit: Use this link to register and open a $500 FREE position on any coin!
Disclaimer: Information found on CryptoPotato is those of writers quoted. It does not represent the opinions of CryptoPotato on whether to buy, sell, or hold any investments. You are advised to conduct your own research before making any investment decisions. Use provided information at your own risk. See Disclaimer for more information.


A person using a laptop and mobile phone.
Tom Werner | Digitalvision | Getty Images
Applications are now open for the fourth edition of CNBC’s World’s Top Fintech Companies list, produced in partnership with market research firm Statista.
Each year, CNBC and Statista chart the top fintech players from around the world, ranging from startups to Big Tech names, across segments including payments, wealth technology, insurance and more.
Last year’s iteration included heavyweights such as Mastercard, Stripe and Visa, as well as many newer scaleups. Credit rewards company Bilt, payments upstart TerraPay and insurance platform Entsia made their debuts on the list.
The World’s Top Fintech Companies has been expanded this year, with regulation tech — companies helping others meet their financial regulatory obligations — becoming its own segment.
Over the years, fintech has progressed from a high-growth challenger segment to a core part of the global financial system, helped by a Covid-fueled race to digitize. Artificial intelligence has spurred the sector further, and has been tipped as a source of transformative change.
The global fintech market attracted $44.7 billion in investment across over 2,200 deals in the first half of 2025, according to the most recent report by KPMG, although this was lower than the $54.2 billion investment seen over the six months prior.
How to apply
Companies can submit their information for consideration by clicking here. Developing innovative, technology-based financial products and services should be the core business of nominees.
The form, hosted by Statista, includes questions about a company’s business model and certain key performance indicators, including revenue growth and employee headcount.
You can read more about the research project and methodology here.
The deadline for submissions is April 24, 2026.
For questions about the list or assistance with the form, please email Statista: topfintechs@statista.com.
Key takeaways:
-
ETH futures liquidations reached $224 million after a 9% price drop, while the network’s onchain activity fell to a 12-month low.
-
ETH’s high correlation with Bitcoin and massive outflows from exchange-traded funds suggest further downside risk for Ether price.
Ether (ETH) plunged to $1,800 on Tuesday, wiping out $224 million in leveraged bullish positions over 48 hours. This 14% price slide over the last 10 days has left top traders defensive. Options and futures data, sluggish onchain activity, and steady outflows from Ether spot exchange-traded funds (ETFs) all point to a shaky floor at $1,800.

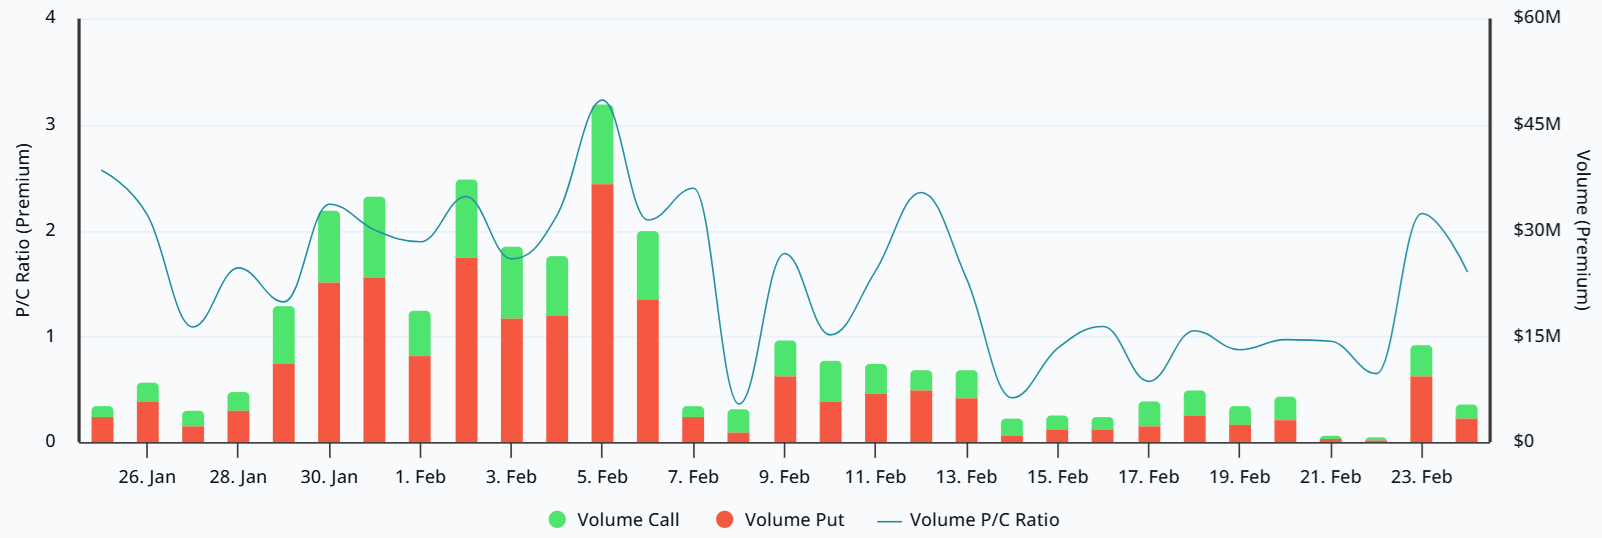
After demand for put (sell) and call (buy) options stayed fairly balanced from Monday through Saturday, things shifted quickly on Tuesday. The ETH put-to-call volume premium jumped to 2.2x, showing a sudden scramble for downside protection. While some might have sold puts to bet on a price bounce, the broader market seems to be bracing for more volatility.

The options delta skew (put-call) sat at 18% on Tuesday, meaning puts were trading at a clear premium. This lopsided demand shows that hedging is the priority right now. There is a real lack of confidence here, even with ETH sitting 63% below its all-time high. A lot of this frustration comes down to some pretty weak onchain numbers.

The total value locked (TVL) on Ethereum has slipped to $51 billion, which is the lowest level seen since May 2025. With fewer deposits hitting decentralized applications (DApps), network fees have taken a hit to $13.7 million over the last 30 days. That is a far cry from the $33 million average seen in late 2025. Traders are worried that ETH demand for data processing won’t return anytime soon.
Even though it was expected, the recent $7 million in ETH sales linked to Ethereum co-founder Vitalik Buterin haven’t helped the mood. The Ethereum co-founder earmarked ETH 16,384 of his personal holdings in January as donations to fund privacy-focused technologies, open source hardware and secure, verifiable software systems. Still, the optics of the move added another layer of bearish pressure to an already shaky week.
Outflows from Ether ETFs have only made things worse for investor sentiment. Usually, this kind of movement means institutional players are losing interest.
Related: Longest Ether dip since 2022 ignored by whales–What’s next for ETH?

The US-listed Ether ETFs have seen $405 million in net outflows since Feb. 11, which has pushed total assets under management down to $12.4 billion. This shift happened right as gold prices climbed above $5,150. In fact, gold ETFs pulled in $822 million in the week ending Feb. 20, according to gold.org.
Ether’s weak onchain and derivatives data is not a guaranteed death sentence. However, the fact that whales and market makers seem to be bracing for more downside definitely fuels the bearish mood. Ether’s price is also stuck to Bitcoin (BTC) right now as the assets’ 20-day correlation has stayed above 95% for the last three weeks.
The ETH drop to $1,800 has created a bit of a loop, where traders are still guessing at what is really driving this crypto bear market. That uncertainty is forcing traders to sell at a loss, and the situation may not change while professional traders display fear. Until those derivatives metrics stabilize, the odds of ETH sliding further are still on the table.
This article does not contain investment advice or recommendations. Every investment and trading move involves risk, and readers should conduct their own research when making a decision. While we strive to provide accurate and timely information, Cointelegraph does not guarantee the accuracy, completeness, or reliability of any information in this article. This article may contain forward-looking statements that are subject to risks and uncertainties. Cointelegraph will not be liable for any loss or damage arising from your reliance on this information.

TLDR:
- Ondo Finance deploys OUSG on the XRP Ledger, targeting institutional capital with a $5,000 minimum investment threshold.
- USDY on Stellar offers Treasury-backed yield to users in emerging markets where currency instability remains a persistent challenge.
- Ripple’s institutional stack pairs RLUSD, Hidden Road, and Metaco custody with Ondo’s tokenized Treasury products for enterprise use.
- Ondo Finance bridges the asset and payments sides of finance by supplying Treasury instruments across two structurally distinct networks.
Ondo Finance is expanding its real-world asset tokenization strategy beyond major Web3 chains. The protocol has deployed products on both the XRP Ledger and the Stellar network.
Each integration is designed to serve a distinct financial audience with a specific product offering. OUSG targets institutional capital on the XRP Ledger, while USDY addresses a broader user base on Stellar. This dual structure places Ondo Finance at the center of a growing tokenized Treasury market.
Ondo Finance and Ripple Target Institutional Capital Through Compliant Infrastructure
OUSG is a tokenized representation of short-term U.S. Treasuries. It carries a minimum investment threshold of $5,000. This structure is not built for retail DeFi participation. Instead, it targets institutional capital looking for compliant, dollar-denominated yield.
Web3Alert on X pointed out that Ondo Finance has paired OUSG with RLUSD on the XRP Ledger. RLUSD is widely recognized as one of the most regulated stablecoins available.
Together, OUSG and RLUSD create a pathway for institutional assets to settle across enterprise-grade rails. The XRP Ledger provides near-instant settlement suited to high-value transactions.
Ripple’s broader ecosystem adds further institutional depth to this arrangement. Metaco and Standard Custody serve as institutional custody solutions within the stack.
Hidden Road brings prime brokerage capability, while GTreasury integrations support treasury operations. These tools allow tokenized collateral to work across real-world financial workflows.
Ondo Finance functions as the asset origination layer within this framework. It provides the Treasury instruments that the XRP Ledger infrastructure settles and manages.
The combined model targets banks, asset managers, and corporate treasury teams. Regulated assets on regulated rails form the backbone of this institutional design.
Stellar Integration Extends Yield-Bearing Access to Emerging Markets
USDY is structurally different from OUSG in one important way. It accrues Treasury-backed returns while also functioning as a stable payment asset.
This makes USDY accessible to a much wider audience than institutional-grade products. Stellar’s network, built around financial inclusion and remittance corridors, is a natural fit.
Web3Alert observed that in regions facing currency instability or limited banking access, a 4–5% Treasury-backed yield addresses a real need. It helps individuals preserve the value of their money over time.
Traditional remittance platforms in developing economies do not offer this kind of return. A yield-bearing dollar provides measurably more utility than a static one.
Stellar’s infrastructure has long supported cross-border payments and financial access in underserved communities. USDY on Stellar merges the asset side and the payments side of finance into a single instrument.
Users in emerging markets can hold, send, and earn yield at the same time. This level of functionality has not been widely available through conventional financial services.
Ondo Finance sits between both institutional and retail ecosystems. It supplies the Treasury products that power each of these networks.
Ripple drives institutional RWA settlement infrastructure, while Stellar enables accessible, yield-bearing payments. Rather than competing, the two networks are building distinct verticals within the broader RWA economy.


Crypto asset manager Bitwise has acquired the staking services company Chorus One, which oversees more than $2.2 billion in staked assets and could help Bitwise expand its portfolio of crypto staking products.
Bitwise said on Tuesday that 50 of Chorus One’s employees will join Bitwise Onchain Solutions, where several billion dollars’ worth of crypto assets are already staked.
The acquisition could see Bitwise diversify its range of exchange-traded products, including staking, as the Securities and Exchange Commission has shown support for a broader range of crypto investment products.
Staking allows holders of crypto tokens to earn rewards, typically between 2% and 10% a year, by locking the tokens on a blockchain, providing investors with additional yield on top of potential appreciation of the underlying token.
The size of the acquisition deal was not shared. Bitwise did not immediately respond to a request for comment.

Bitwise CEO Hunter Horsley said staking remains “one of the most compelling growth opportunities” for its thousands of clients holding spot crypto assets.
Deal expands Bitwise staking to more chains
The Chorus One deal expands Bitwise’s staking capabilities on more than 30 proof-of-stake chains, including Solana, Hyperliquid, Monad, Avalanche, Sui, Aptos and Tezos.
Related: Bitcoin ETF sell-off is ‘purification’ of bull case, investor says
Chorus One has provided crypto staking infrastructure services since 2018 for finance firms, family offices, high-net-worth individuals, custodians, funds, exchanges and decentralized protocols.
Bitwise said the Chorus One team would join Bitwise, including Chorus One CEO Brian Crain, who will take on an advisory role.
Bitwise now has nearly 200 employees worldwide managing crypto exchange-traded products for its thousands of clients.
As of February, Bitwise has over $15 billion in assets under management across more than 40 investment products.
Its flagship products are the Bitwise Bitcoin ETF (BITB) and the Bitwise Ethereum ETF (ETHW), which have accumulated over $2 billion and $387 million worth of flows since launching in January and July of 2024, respectively.
Its other products include the Bitwise Solana Staking ETF (BSOL), Bitwise XRP ETF (XRP), the Bitwise Chainlink ETF (CLNK) and the Bitwise Dogecoin ETF (BWOW).
Magazine: DAT panic dumps 73,000 ETH, India’s crypto tax stays: Asia Express


Jane Street has returned to the spotlight after Terraform Labs’ bankruptcy estate accused the trading firm of insider trading tied to the May 2022 collapse of TerraUSD (UST) and LUNA.
The lawsuit alleges Jane Street used non-public information about Terraform’s liquidity withdrawals to exit positions and profit before the stablecoin lost its dollar peg.
Terraform Lawsuit Puts Jane Street Back Under Scrutiny
According to the complaint, Terraform quietly removed about $150 million of liquidity from Curve pools that supported UST. Shortly afterward, wallets linked to Jane Street allegedly withdrew or sold tens of millions of dollars worth of UST.
Terraform claims these actions accelerated the loss of confidence that triggered a broader collapse, wiping out about $40 billion in value.
However, these remain allegations. Jane Street has denied wrongdoing and said it will defend itself in court. No court has yet ruled on the claims.
A pattern of Indirect Links to Major Crypto Failures
Jane Street’s name has also surfaced repeatedly in connection with other major crypto collapses, including FTX. However, the firm has not been accused of wrongdoing in the FTX case.
Instead, the connection comes through people. Sam Bankman-Fried, founder of FTX and Alameda Research, previously worked as a trader at Jane Street. Alameda CEO Caroline Ellison also began her career at the firm.
These links reflect Jane Street’s role as a major training ground for quantitative traders. However, there is no verified evidence that Jane Street, as a company, played any role in FTX’s fraud or collapse.
Investigators have attributed the collapse to internal misuse of customer funds by FTX and Alameda leadership.
Jane Street’s Role as a Market Maker in Crypto
Jane Street operates as a global quantitative trading firm and liquidity provider. It uses algorithms and statistical models to trade stocks, bonds, ETFs, and increasingly, cryptocurrencies.
The firm does not run crypto exchanges or issue tokens. Instead, it acts as a market maker.
Market makers provide liquidity by continuously buying and selling assets, helping markets function smoothly.
Because of this role, Jane Street interacts with many crypto companies as a trading counterparty. This exposure often places it close to major market events, including collapses.
Jane Street became one of the largest crypto market makers during the industry’s rapid growth between 2020 and 2022. It traded on major exchanges and provided liquidity across multiple crypto assets.
This scale means its trading activity often appears in blockchain records and liquidity pools. However, visibility does not imply causation.
Regulators and courts have not found Jane Street liable for causing any major crypto collapse. The Terraform lawsuit marks the first major legal claim directly accusing the firm of wrongdoing related to a crypto failure.
Legal outcome could shape future scrutiny
The Terraform case may clarify whether Jane Street’s trading activity crossed legal boundaries or reflected standard market-making behavior.
The outcome could also shape how courts interpret insider information in decentralized markets.
For now, Jane Street remains a powerful but largely behind-the-scenes player in crypto. Its influence reflects its scale, technical expertise, and role in providing liquidity — even as questions about its involvement continue to emerge.


- Terraform lawsuit vs Jane Street puts Terra Classic (LUNC) in focus.
- Terra Classic (LUNC) shows technical resilience, eyeing $0.00003925 short-term.
- 2026 price range is expected to be between $0.0000242 and $0.000510.
The price of Terra Classic (LUNC) has been under the spotlight as legal tensions surrounding its parent company, Terraform Labs, continue to unfold.
Investors are watching closely after news emerged that the administrator overseeing the wind-down of Terraform Labs has sued trading firm Jane Street.
The lawsuit alleges the trading firm used non-public information from Terraform insiders to profit ahead of the collapse of TerraUSD in May 2022.
This legal move adds a new layer of uncertainty for LUNC holders.
Many remember that the original Terra blockchain was rebranded as Terra Classic after the collapse, while a new Terra 2.0 network was launched.
LUNC now trades at around $0.00003509, down roughly 46% over the past year, with a circulating supply of approximately 5.47 trillion coins.
Jane Street charges
The lawsuit centres on allegations that Jane Street gained access to confidential data through back channels.
This allegedly allowed the firm to strategically withdraw significant amounts of UST from liquidity pools just minutes after Terraform executed internal moves.
The complaint claims these trades contributed to the broader collapse of the stablecoin and accelerated losses for Terraform’s creditors.
Jane Street has denied the allegations, calling the claims baseless and emphasising that the market turmoil was driven by internal mismanagement within Terraform.
Legal observers note that the case could have implications not only for the firms involved but also for market perception around LUNC and other related assets.
LUNC price analysis
Despite its turbulent history, LUNC has shown some resilience.
The coin has been trading in a range of $0.0000343 to $0.00003516 over the past 24 hours, reflecting a small degree of stability.
Analysts like For-Exx Kripto note that the coin has remained inside a flag formation, though the pattern recently experienced a slight break.
This break could have signalled a sharp decline, yet LUNC did not fall dramatically.
This can be interpreted as a bullish signal in the short term, suggesting that a price attempt toward $0.00003925 could be on the horizon.
While the coin remains far from its historical highs, such technical patterns provide hints about potential upward momentum despite broader market challenges.
Trading volume has also been modest, with about $8.9 million changing hands in the last 24 hours.
Terra Classic price prediction
Looking ahead, analysts project that LUNC could trade within a wide range in 2026.
The minimum expected level is around $0.0000242, while the maximum target could reach $0.000510 by the end of the year.
Key levels to watch include support near the $0.000024 mark, which may act as a floor in case of market weakness.
Resistance lies around $0.000510, representing a potential upside target for traders seeking gains.
Short-term moves toward $0.00003925 could also provide intermediate targets, especially if the market reacts positively to technical signals or news from ongoing legal developments.


Meta has issued a request for proposals (RFP) to third-party firms for stablecoin-based payments, potentially marking a comeback in the stablecoin market with Stripe as a possible partner.
Meta is planning to deploy a stablecoin this year after issuing a request for proposals (RFP) to third-party companies, CoinDesk reported on Tuesday, Feb. 24.
CoinDesk also noted that a potential partnership with payments giant Stripe could be in the works, though no official confirmation has been made. A potential collaboration with Stripe would leverage the payment company’s expertise and existing infrastructure in the stablecoin domain.
The development comes as the company seeks to re-enter the stablecoin market following the collapse of its previous Libra/Diem project due to regulatory pressures. The stablecoin sector currently boasts a market capitalization of over $308 billion, up from $206 billion in January 2025, according to DeFiLlama.
Meta initially launched its Libra stablecoin in 2019, later rebranded to Diem, but the project was shuttered amid intense regulatory scrutiny. This setback underscored the challenges that large tech companies face in navigating the complex landscape of financial regulations.
This article was generated with the assistance of AI workflows.


Despite dumping its treasury, Bitdeer boosted self-mining above 63 EH/s and significantly increased year-over-year Bitcoin production amid market pressure.
In a bid to calm investor nerves after confirming that it has sold all of its Bitcoin holdings, Bitdeer Technologies framed the move as a deliberate liquidity decision rather than a bearish signal on the asset itself.
In a recent statement, the Singapore-based miner stated that converting newly mined Bitcoin into cash is a pragmatic step as it evaluates several non-binding opportunities to acquire powered land, a process that requires capital readiness well before deals are finalized.
Zero-BTC Balance Sheet
Despite the sale, Bitdeer continues to scale aggressively on the operational front. It ramped up self-mining capacity to more than 63 EH/s and sharply increased Bitcoin production year over year, even as it sold the entirety of its recent output rather than retaining it on the balance sheet. Its official announcement on X read,
“Our decision to sell Bitcoin should not be a concern for the broader market. Our hash rate will continue to grow, and we will continue to mine more Bitcoin for the interest of our shareholders.”
The latest move represents a significant departure from the balance-sheet accumulation strategy popularized by firms such as Strategy, which has treated Bitcoin as a long-term reserve asset.
At the same time, the firm is accelerating a strategic pivot that further explains its cash needs – expansion into AI and high-performance computing infrastructure. Deploying large-scale GPU systems and converting existing mining sites in the US and Europe into AI-ready data centers demands substantially more upfront capital than incremental mining buildouts, which makes the sale more rational.
Breaking From Miner Playbook
Bitdeer isn’t the only player to have offloaded its BTC stash. In fact, there has been an emerging pattern among public miners such as Riot Platforms, Bitfarms, and Core Scientific, many of which have partially sold mined Bitcoin or diversified into AI to stabilize cash flows.
Even so, Bitdeer’s decision to completely exit Bitcoin holdings places it outside the norm for publicly traded miners. Most of its peers still maintain sizable treasuries. For instance, MARA Holdings holds more than 53,000 BTC, while Riot Platforms retains close to 18,000 BTC.
You may also like:
Binance Free $600 (CryptoPotato Exclusive): Use this link to register a new account and receive $600 exclusive welcome offer on Binance (full details).
LIMITED OFFER for CryptoPotato readers at Bybit: Use this link to register and open a $500 FREE position on any coin!

Ether has faced renewed selling pressure, with traders watching a price drift toward a critical support zone as bearish sentiment deepens. A roughly 14% slide over the past 10 days culminated in a notable surge in leveraged liquidations, underscoring the fragility of near-term demand for the network’s data-processing capabilities. The latest move comes as broader market dynamics remain tethered to Bitcoin, with cyclical risk-off trades and hedging activity intensifying as on-chain activity cools and institutional flows remain unsettled.
Key takeaways
- ETH futures liquidations reached $224 million after a 14% price drop over 10 days, coinciding with a broad pullback in on-chain activity and a precarious bias in the options market.
- Derivatives data show a sharp shift toward downside hedging, with the ETH put-to-call volume premium spiking to 2.2x and the 30-day delta skew at 18%, signaling elevated demand for protection against further declines.
- Ethereum’s network fundamentals deteriorated, with total value locked (TVL) dipping to $51 billion—the lowest level since May 2025—and 30-day network fees sliding to $13.7 million, indicating waning activity on the chain.
- Valuable anchor events added pressure, including a reported $7 million in ETH sales tied to donations associated with Ethereum co-founder Vitalik Buterin, contributing to a cautious mood around the asset.
- US-listed Ether ETFs recorded outsized outflows, totaling about $405 million since Feb. 11, driving assets under management down to roughly $12.4 billion and signaling continued institutional repositioning.
- The price path remains tightly correlated with Bitcoin, as Ether’s and BTC’s 20-day correlation held in the upper echelons, reinforcing the perception that macro flows dominate near-term moves.
The latest price action saw Ether fall toward the $1,800 level, erasing a substantial portion of gains from late last year and prompting traders to reassess risk exposure. The pullback has not only tested support but also exposed the fragility of the current floor, particularly as options markets show a renewed appetite for hedges rather than directional bets. The sentiment is not just about a single order book imbalance; it reflects a combination of thinner on-chain activity, lower disposable fees, and a sense that investors are waiting for clearer catalysts before re-engaging with sustained long exposure.
On the derivatives front, the market’s mood shifted abruptly on Tuesday. The put-to-call volume premium in ETH options rose to 2.2 times, a visible tilt toward downside protection as market participants positioned for increased volatility. The delta skew—an indicator of the relative pricing of puts versus calls—stood at about 18% on that day, underscoring that hedging costs were skewed toward protection rather than speculative bets on immediate rebounds. In practice, this configuration implies a market bracing for further price disruption, even as some traders may still tilt toward selling puts to attempt a bounce, a strategy that often backfires in persistent drawdowns.
The chain’s fundamental metrics corroborate a darker near-term outlook. Ethereum’s total value locked declined to around $51 billion, marking a multi-quarter low that suggests reduced appetite for DeFi protocols and the kinds of capital-intensive activity that historically sustain higher gas demand. Network fees have also cooled, averaging roughly $13.7 million over the past 30 days—well below late-2025 levels—and hint at a softer cadence of user activity and contract interaction. Against this backdrop, sentiment around encoding and data processing on the network remains subdued, with potential knock-on effects for validators and ecosystem development projects.
Beyond the on-chain and derivatives signals, a notable social and governance dynamic has fed into the mood music. A recent round of ETH sales linked to donations associated with Vitalik Buterin, Ethereum’s co-founder, drew additional attention. In January, Buterin earmarked a considerable tranche of ETH—16,384 ETH—for philanthropic purposes spanning privacy-focused technologies, open-source hardware, and secure, verifiable software systems. While charitable in nature, the sale added a layer of bearish optics during a week already defined by fragile confidence and risk-off trading. The optics reflect a broader theme: even constructive or altruistic actions can weigh on investor sentiment when market participants are looking for signals of durable demand recovery.
Further pressure has come from ETF-related trends. Outflows from Ether ETFs have been persistent, with US-listed Ether ETFs recording net withdrawals that have pushed total assets under management down to around $12.4 billion. The pace of withdrawals has accelerated since mid-February, contributing to a sense that institutional players are rebalancing away from Ether in favor of other assets or strategies. The development occurs alongside broader gold-market activity, where gold ETFs saw sizable inflows in the latest reporting period, highlighting a contrast in capital allocation across traditional and crypto-linked investment products.
From a price-movement standpoint, Ether remains tightly correlated with Bitcoin, a relationship that has historically amplified both upside and downside in periods of macro-driven risk appetite. The 20-day correlation between Ether and Bitcoin has hovered in the high 90s, illustrating how a single market narrative—risk-off sentiment—can pull both assets in the same direction for extended stretches. This correlation complicates a clean technical recovery play for Ether, as a broad risk-off backdrop can forestall sustained rallies even when Ether-specific catalysts emerge.
Amid this confluence of signals, traders face a difficult calibration: hedge protection while recognizing the potential for further declines, weigh the durability of on-chain usage against the immediate squeeze on liquidity, and monitor the evolving flow dynamics that continue to shape institutional positioning. The current environment is not merely about price—it is about the balance between hedging demand, network activity, and the liquidity hooks that can either slow or accelerate a potential drag on Ether’s value.
The broader backdrop remains essential. As risk sentiment in crypto persists in a cautious mode and macro flow regimes continue to influence asset dispersion, Ether’s path will depend as much on the resilience of hedging mechanisms and ETF liquidity as on any single protocol upgrade or on-chain development. The market is currently prioritizing protection over speculation, and until derivatives metrics stabilize and on-chain usage strengthens, the path of least resistance could tilt lower rather than higher.
Market context: The current dynamics place Ether in a broader risk-off framework where liquidity, hedging, and ETF flows weigh as heavily as on-chain activity in determining near-term momentum. In such an environment, macro catalysts and cross-asset capital allocation will continue to shape the trajectory of Ether alongside Bitcoin and other major crypto benchmarks.
Why it matters
For investors, the confluence of a price drop, rising hedging activity, and persistent ETF outflows signals a period of heightened caution. The absence of a clear catalyst for a fast revival raises the probability that Ether could test lower supports before any durable recovery materializes. Traders must weigh the cost of hedges against the risk of a deeper drawdown, particularly in a landscape where futures positions can unwind rapidly in response to new macro cues.
For builders and protocol participants, the softness in on-chain activity and the readiness of markets to hedge rather than deploy funds may influence decisions around network improvements, layer-2 integrations, and development roadmaps. A sustained reduction in network usage could impact fee-based incentives for validators and the long-term economic design of the platform, prompting a closer look at throughput solutions and utilization strategies.
For policymakers and institutional watchers, the flow dynamics around Ether ETFs and other crypto investment products offer insight into how mainstream capital is approaching crypto assets during stress. The rate of outflows and the resilience of liquidity in key products can inform discussions about product design, investor protection, and the evolving regulatory framework governing crypto markets.
What to watch next
- Monitor Ether’s price action around the $1,800 level for any decisive break or a potential bounce in the next 1–2 weeks.
- Track Ether ETF inflows/outflows and any new filings or product adjustments that could signal shifting institutional appetite.
- Watch Deribit and other venues for changes in put-call ratios and delta skew, which would indicate evolving hedging pressure.
- Observe on-chain metrics like TVL and network fees for any uptick in activity that could precede a tactical recovery.
- Keep an eye on the 20-day ETH/BTC correlation, as a sustained decoupling would be a meaningful sign of evolving market dynamics.
Sources & verification
- ETH price movement to around $1,800 and the $224 million leveraged liquidations over 48 hours.
- Deribit-based derivatives data showing a 2.2x put-to-call premium and an 18% delta skew for ETH options.
- Ethereum network metrics: TVL at $51 billion and 30-day network fees at $13.7 million.
- Vitalik Buterin’s ETH sale tied to donations for privacy-focused technologies and open-source hardware (ETH donations noted in January).
- US-listed Ether ETF net outflows totaling approximately $405 million since Feb. 11, with AUM around $12.4 billion.
- BTC–ETH 20-day correlation readings indicating tight co-movement over recent weeks.


BTC fell about 5% in days as tariffs and geopolitics drove downside risk.
Summary
- BTC is in a sharp correction similar to equities, with renewed tariff uncertainty and geopolitical tensions cited as primary downside catalysts in the short term.
- Kraken VP Matt Howells-Barby flags ~$60k as critical support and warns a breakdown could open a path toward the mid-to-low $50k range.
- Historically, BTC has not bottomed until the 50-week MA drops below the 100-week MA in a death cross, implying potential further downside before a durable floor forms.
Matt Howells-Barby, Vice President of cryptocurrency exchange Kraken, identified critical price levels for Bitcoin as the digital asset undergoes a correction, according to statements from the executive.
Howells-Barby stated that Bitcoin is experiencing a sharp correction similar to movements in equity markets, with uncertainty surrounding tariffs cited as one of the primary factors driving the decline. The executive drew comparisons to macroeconomic pressure observed in April of the previous year, noting that geopolitical tensions could present additional downside risks in the short term.
The Kraken executive pointed to a critical support level as a technically significant threshold. According to Howells-Barby, a break below this support could push Bitcoin prices down to the lower-to-mid range.
Howells-Barby referenced historical data indicating that Bitcoin typically does not establish a clear bottom until the 50-week moving average falls below the 100-week moving average, a technical pattern known as a “death cross.” The absence of such a cross suggests the possibility of further declines extending below the lower range, according to the analysis.
Market analysts indicate that volatility may remain elevated in the current environment, with investors advised to focus on risk management strategies.

Phishing campaign targets freight and logistics orgs in the US, Europe

BridgeBio Pharma, Inc. (BBIO) Q4 2025 Earnings Call Transcript

CNBC World’s Top Fintech Companies 2026: Apply now


-

 Video5 days ago
XRP News: XRP Just Entered a New Phase (Almost Nobody Noticed)
-

 Fashion4 days ago
Weekend Open Thread: Boden – Corporette.com
-

 Politics3 days ago
Baftas 2026: Awards Nominations, Presenters And Performers
-

 Sports1 day ago
Women’s college basketball rankings: Iowa reenters top 10, Auriemma makes history
-

 Entertainment6 days ago
Kunal Nayyar’s Secret Acts Of Kindness Sparks Online Discussion
-

 Politics1 day ago
Nick Reiner Enters Plea In Deaths Of Parents Rob And Michele
-

 Tech7 days ago
Retro Rover: LT6502 Laptop Packs 8-Bit Power On The Go
-
 Sports6 days ago
Clearing the boundary, crossing into history: J&K end 67-year wait, enter maiden Ranji Trophy final | Cricket News
-

 Business2 days ago
Mattel’s American Girl brand turns 40, dolls enter a new era
-

 Crypto World17 hours ago
XRP price enters “dead zone” as Binance leverage hits lows
-

 Business2 days ago
Law enforcement kills armed man seeking to enter Trump’s Mar-a-Lago resort, officials say
-

 Entertainment6 days ago
Dolores Catania Blasts Rob Rausch For Turning On ‘Housewives’ On ‘Traitors’
-

 Business7 days ago
Tesla avoids California suspension after ending ‘autopilot’ marketing
-

 Tech2 days ago
Anthropic-Backed Group Enters NY-12 AI PAC Fight
-
 NewsBeat2 days ago
‘Hourly’ method from gastroenterologist ‘helps reduce air travel bloating’
-

 NewsBeat2 days ago
Armed man killed after entering secure perimeter of Mar-a-Lago, Secret Service says
-

 Politics2 days ago
Maine has a long track record of electing moderates. Enter Graham Platner.
-

 Crypto World6 days ago
WLFI Crypto Surges Toward $0.12 as Whale Buys $2.75M Before Trump-Linked Forum
-

 Tech7 hours ago
Unsurprisingly, Apple's board gets what it wants in 2026 shareholder meeting
-
 NewsBeat2 hours ago
Police latest as search for missing woman enters day nine