

Crypto World
Hut 8 stock price forms cup-and-handle ahead of earnings
Hut 8 stock price has risen for three consecutive months and is nearing its highest level this year as the company prepares to publish its financial results.
Summary
- Hut 8 share price has jumped for three consecutive months.
- The company has formed a cup-and-handle pattern.
- It will publish the financial results later on Tuesday.
Hut 8, a top company in the Bitcoin (BTC) mining and an upcoming artificial intelligence data center industry, rose to $57, up by over 1,285% from its lowest level in 2023. This surge has brought its market capitalization to over $6.2 billion.
Hut 8 has done well despite the ongoing Bitcoin price crash because of its pivot to the data center industry. It recently entered a major deal with Anthropic, the creator of Claude.
This deal will see it build the River Bend campus, which will have a capacity of 2,295 megawatts of infrastructure in three tranches. The deal will be worth billions of dollars in the next few years.
The next key catalyst for the Hut 8 stock price will be the upcoming earnings, which will come out on Tuesday.
Data compiled by Yahoo Finance shows that the revenue will be $95 million, up by 200% from the same period in 2024. Its annual revenue will be over $241 million, up by 48% on an annual basis.
Its deal with Anthropic and Google will help it grow its revenue this year to over $425 million, up by 76% on an annual basis. Analysts also expect the earnings-per-share will be a loss of 15 cents from a profit of 1.55 in the same period in 2024.
Wall Street analysts are largely bullish on the company. Some of the mosy bullish ones are HC Wainwright, Roth Mkm, and KBW, which have placed a target of $80, $80, and $75m respectively. The average target among analysts is $64, up by 12% from the current level.
Hut 8 stock technical analysis

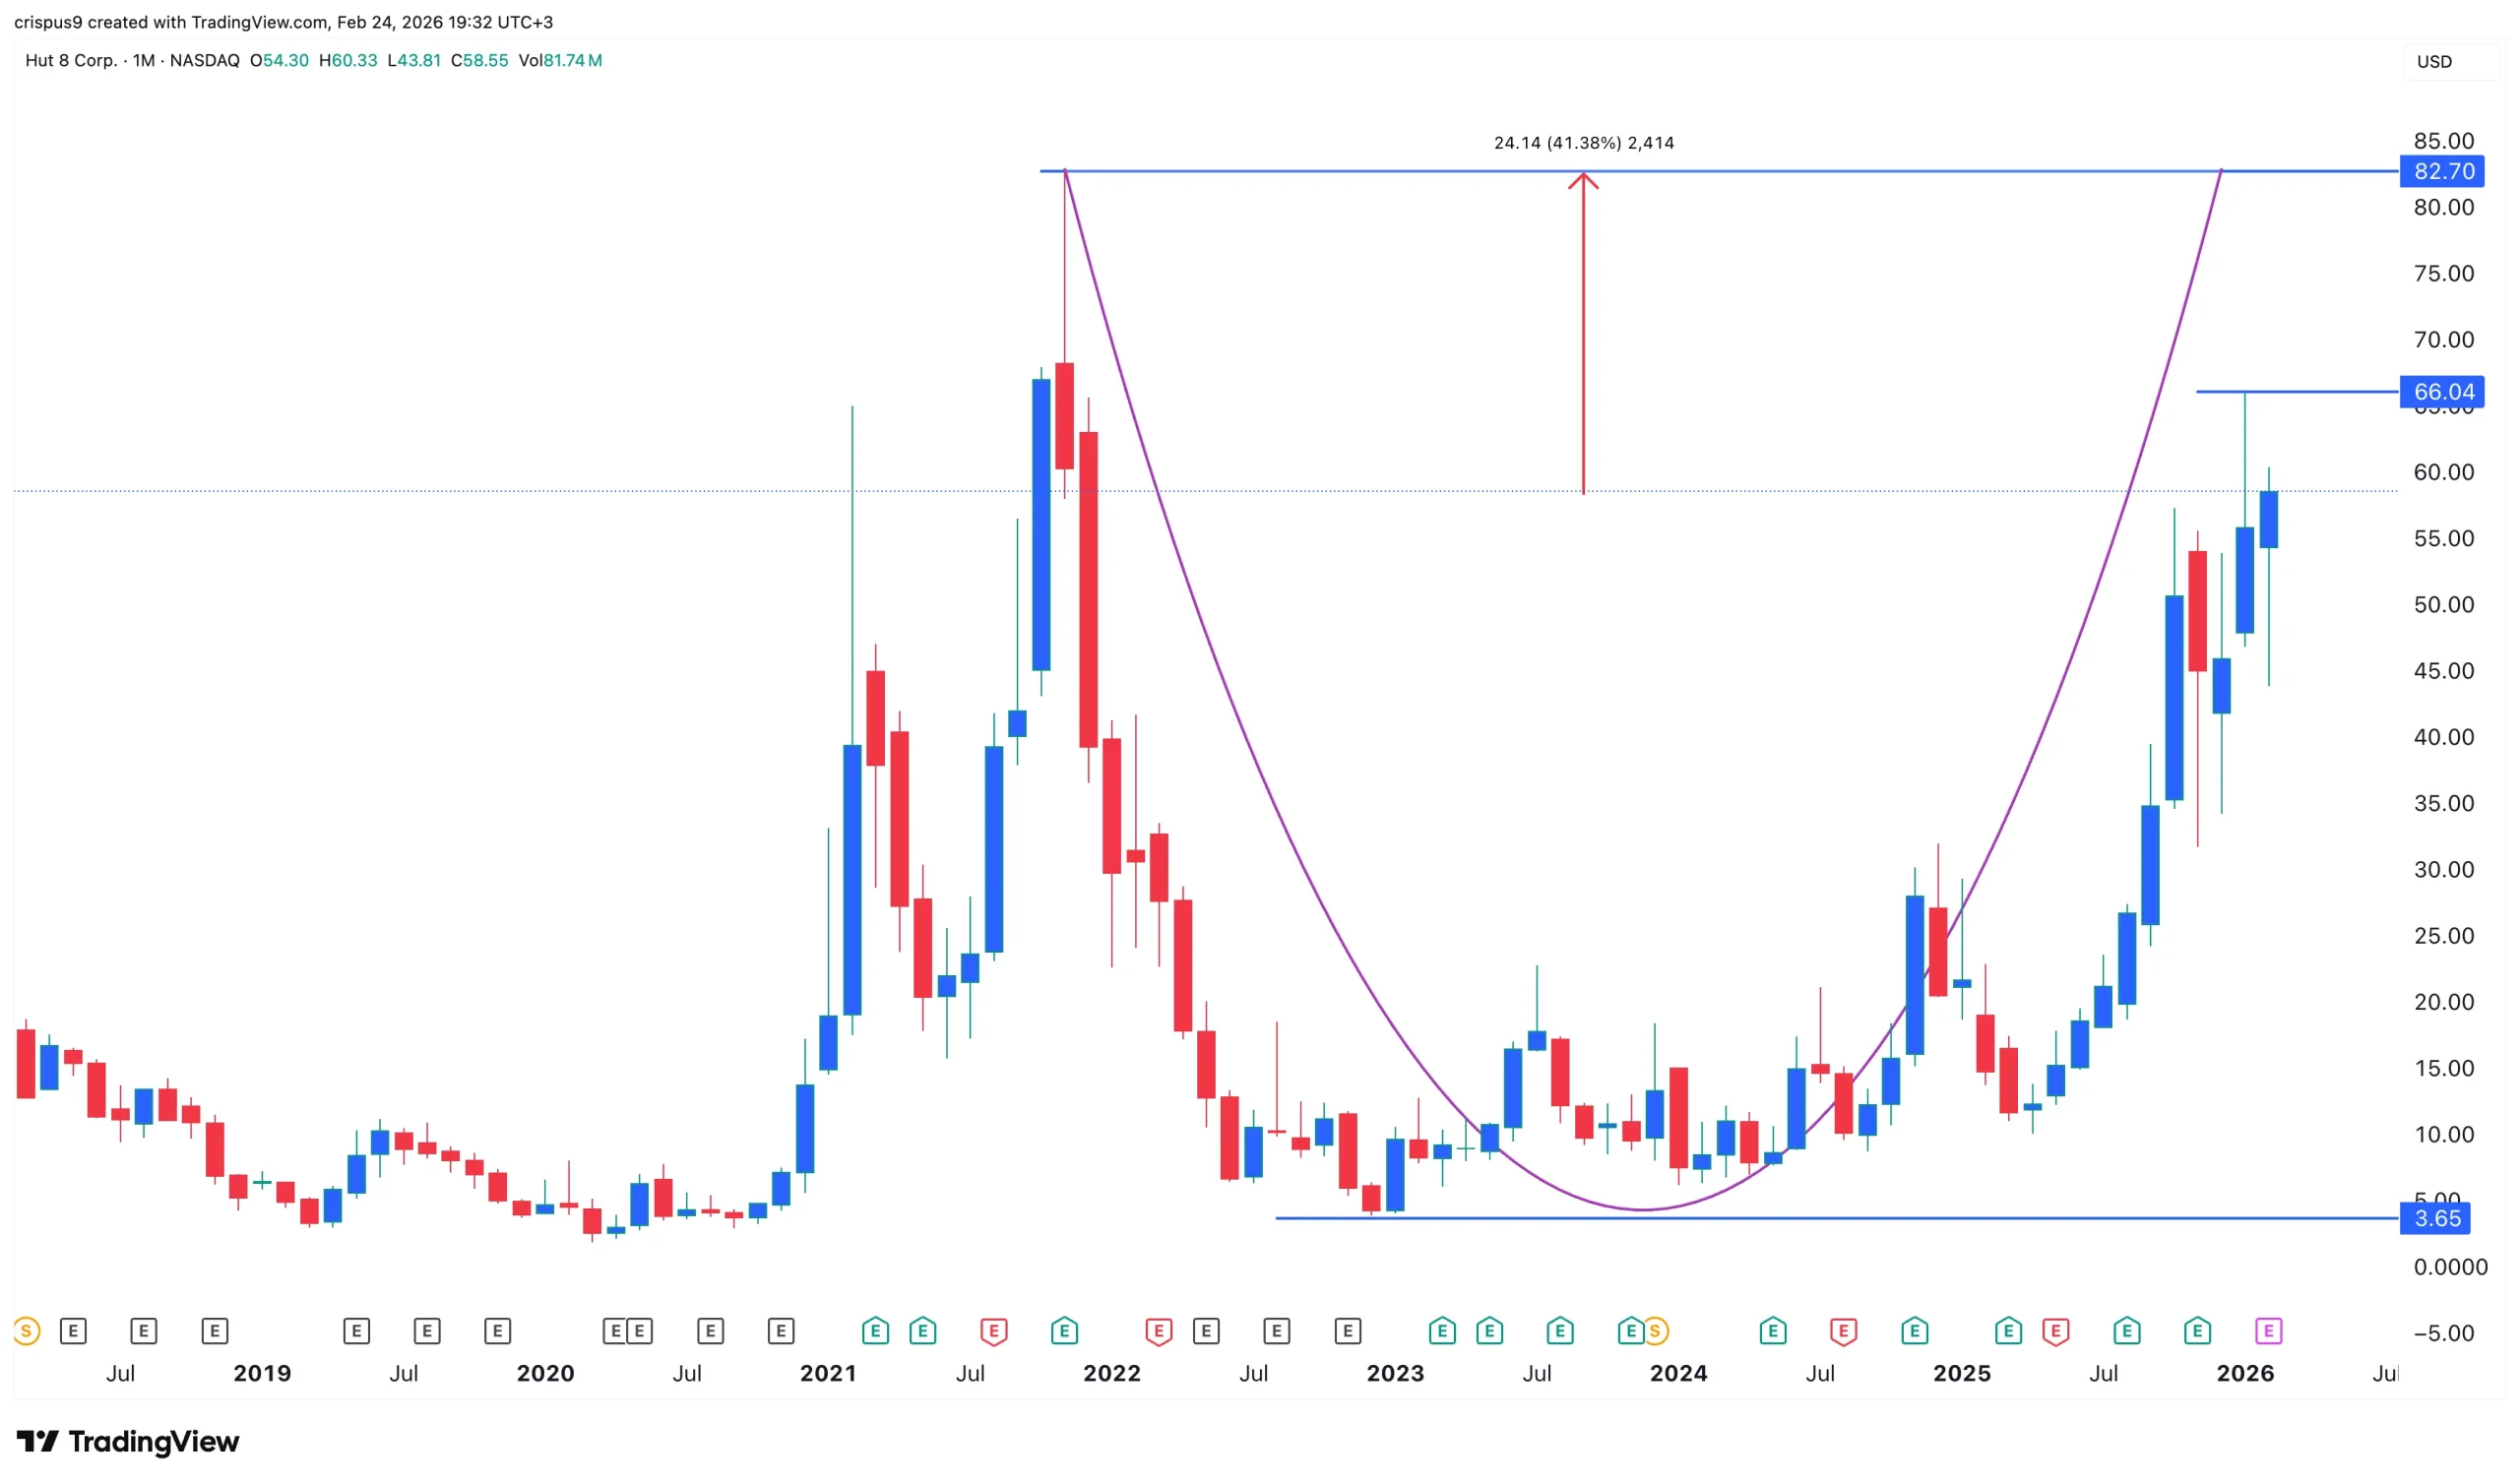
The monthly timeframe chart shows that Hut 8 share price has staged a strong comeback in the past few years. It has jumped from a low of $3.65 in 2023 to the current level.
The stock has jumped in the last three consecutive months and is nearing its highest level this year at $66. It has also moved above the 50-month moving average.
A closer look shows that it has formed a cup-and-handle pattern whose upper side is at $82.70, its highest level on record. Such a move will mark a 40% increase from the current level.
The caveat, however, is that this pattern has formed on the monthly chart, meaning that its outcome may take months or years to complete.

Ether (ETH) whale activity on a major exchange has slowed since the start of 2026, with roughly 2 million ETH traded in large-sized transactions over the past 45 days.
ETH is currently in the midst of its worst weekly losing streak since 2022, with exchange flow trends and futures market liquidation data impacting investor expectations for Ether’s short and long-term price direction in the broader market.
Ether whale order size hints at fading participation
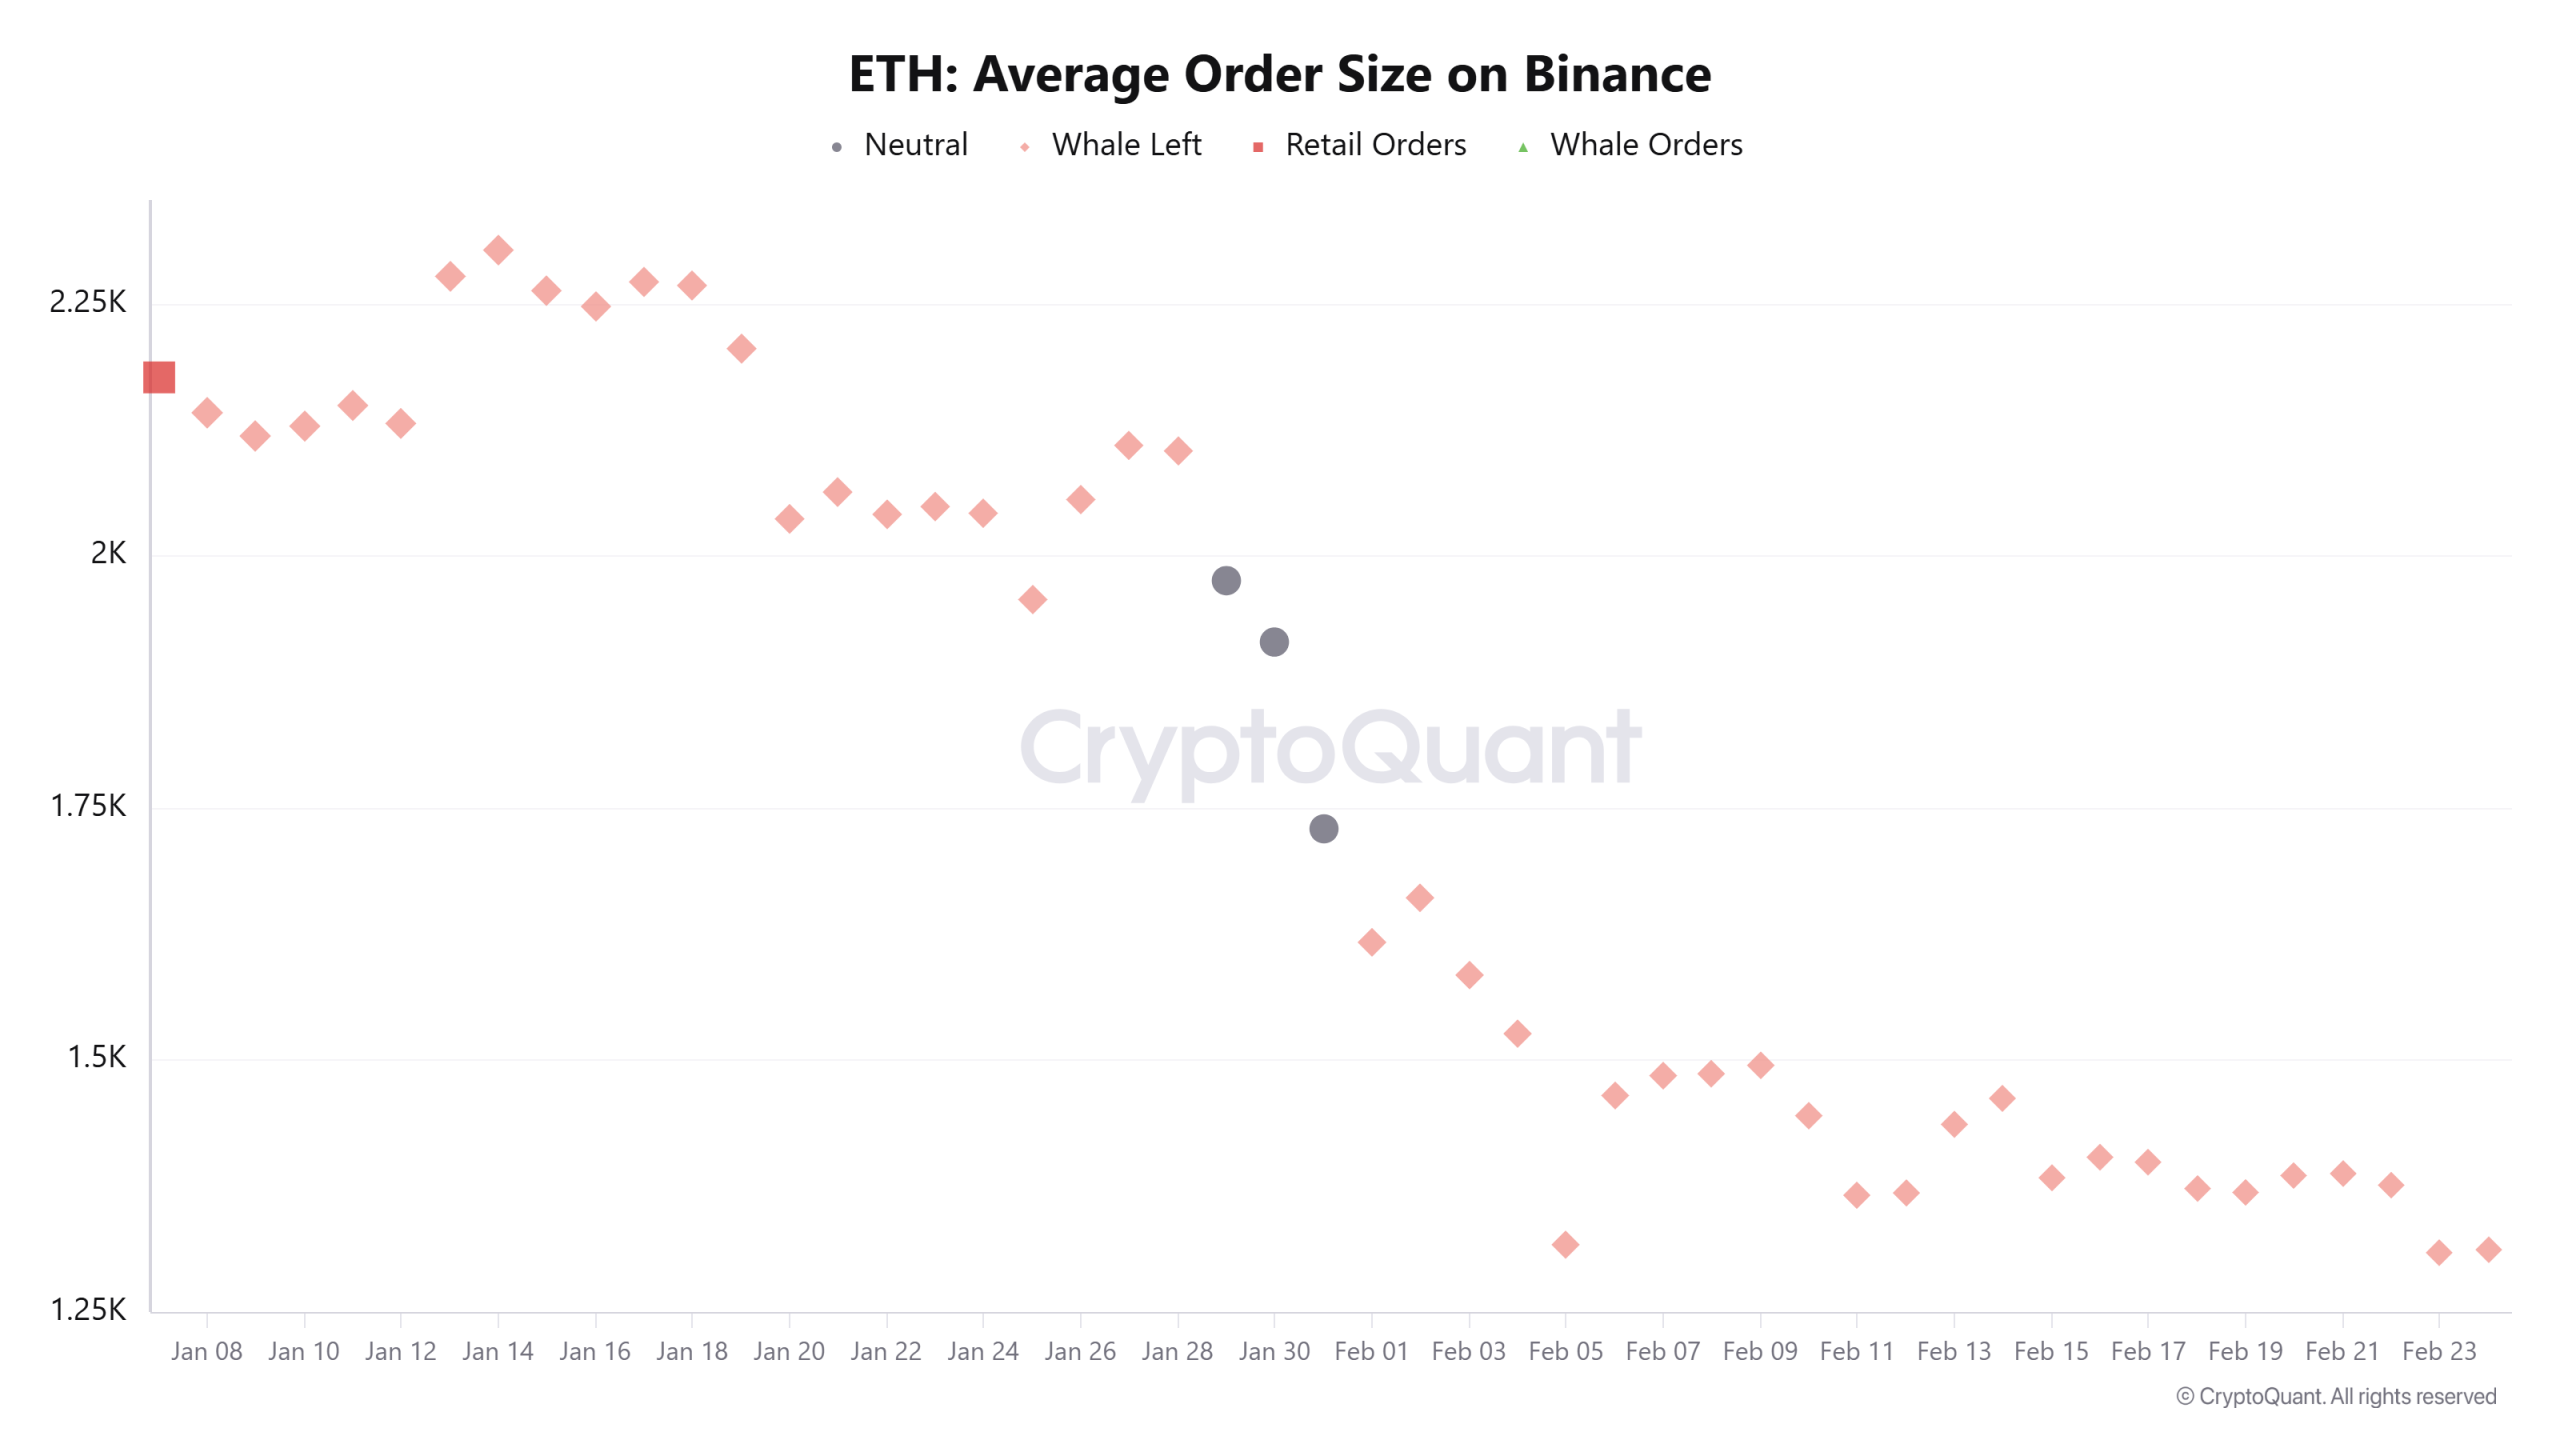
CryptoQuant data shows that the average ETH whale sell orders on Binance have fallen to around 1,350 ETH in recent weeks, down from roughly 2,250 ETH in early January. Assuming 15 to 35 whale-sized executions per day, the cumulative gross sell-side turnover since Jan. 8 is estimated at around 1.8 to 2 million ETH over the past 45 days.

Using an average price of $2,400, this activity equates to roughly $4.3 billion to $4.8 billion in large-order executions. The figure reflects gross traded volume, not confirmed net outflows, as part of the flows may relate to hedging or liquidity provision within the derivatives market.
Crypto analyst Darkfost said the decline in the average order size points to a “gradual disengagement” from larger participants. According to the analyst, smaller traders continue to transact at stable volumes, while bigger players are reducing direct interaction with the order books.
This shift indicates a temporary thinning of market depth. With fewer large resting orders, ETH’s capacity to absorb sharp price imbalances narrows in the short term.
Parallel to exchange flows, ETH accumulation addresses added more than 2.5 million ETH in February as the price fell about 20%. Total holdings climbed to 26.7 million ETH from 22 million at the start of 2026, signaling steady demand beneath the surface.
Related: Ethereum price drops to $1.8K as data suggests ETH bears are not done yet
Will Ether break its longest bearish streak since 2022?
Ether is now in its sixth straight week of losses, marking the longest uninterrupted weekly decline since the 10-week drawdown between March 2022 and June 2022. That earlier stretch unfolded during a broader bear market and led to a cycle bottom before price stabilized.

While the current pullback is not as long, the streak highlights sustained selling pressure and weakening momentum on the higher timeframe.
Historical market cycle data suggests that if the decline continues, a broad weekly demand zone between $1,384 and $1,691 may come into focus, an area that previously acted as accumulation during the early stages of the rally in 2023.
Futures market liquidation data shows more than $2 billion in short positions clustered around $2,000. This creates a dense liquidity pocket that may act as the near-term magnet for Ether price.
On the downside, approximately $682 million in long positions remain at risk if Ether drops to $1,600, indicating thinner liquidity compared to the upside cluster.
Crypto trader RickUntZ said he still sees potential for a V-shaped rebound from current levels, citing signs of underlying demand in the current structure. For now, data suggests that the $2,000 liquidation band remains the next key resistance to break.

Related: Ethereum Foundation starts staking ETH as client diversity concerns persist
This article does not contain investment advice or recommendations. Every investment and trading move involves risk, and readers should conduct their own research when making a decision. While we strive to provide accurate and timely information, Cointelegraph does not guarantee the accuracy, completeness, or reliability of any information in this article. This article may contain forward-looking statements that are subject to risks and uncertainties. Cointelegraph will not be liable for any loss or damage arising from your reliance on this information.
Crypto World
Millions in crypto funded tools to exploit U.S. software, Treasury says in new sanctions


The U.S. Treasury Department has sanctioned a Russian company, Operation Zero, and the individuals behind it after accusing them of buying stolen cyber tools for millions in cryptocurrency and re-selling those technologies, which were created to be used by the U.S. government.
The tools bought and sold by newly sanctioned Sergey Sergeyevich Zelenyuk and his business, Operation Zero, were said to be originally stolen by an Australian national, Peter Williams, who once worked at the defense contractor that made the national-security focused software “for the exclusive use of the U.S. government and select allies.” Williams pleaded guilty last year to selling trade secrets.
“Treasury will continue to work alongside the rest of the Trump Administration to protect sensitive American intellectual property and safeguard our national security,” said Secretary of the Treasury Scott Bessent in a statement.
Zelenyuk and the others are said to be the first people to be sanctioned under the Protecting American Intellectual Property Act. The sanctions by the Office of Foreign Assets Control block U.S. people from any business dealings with those flagged or with others who do business with them.”Operation Zero has sought to recruit hackers to support its activities and develop business relationships with foreign intelligence agencies through use of social media,” the Treasury Department said in its statement. The accusations say the tools were offered for sale to those seeking to exploit vulnerabilities in computer software.
While the Treasury’s Office of Foreign Asset Control alleged that cryptocurrencies were used in the transactions, it did not list specific addresses for blacklisting.
Read More: Criminal use of crypto spikes after years of steady decline, TRM report says


A veteran bull said that the Bitcoin Core team is “fighting the last war.”
The blockchain’s quantum conundrum is intensifying, raising fresh concerns about whether Bitcoin can survive the long-term threat posed by quantum computing.
A veteran bull has warned that it poses Bitcoin’s first truly existential risk, but is being ignored.
“Fighting the Last War”
Charles Edwards, founder of Capriole Investments, said he is more concerned about Bitcoin’s future today than at any point across multiple market cycles, while citing the growing threat posed by quantum computing.
In a post on X, Edwards explained that he had previously remained confident through extreme price crashes, exchange shutdowns, hacks, and major frauds such as the collapse of FTX. He said those events never undermined his long-term outlook on Bitcoin.
However, the current risk is different in nature, according to Edwards, who warned that Bitcoin’s existing cryptographic defenses are not adequate to withstand advances in quantum technology. He compared the situation to outdated military strategies being deployed against modern warfare, and stated that Bitcoin “does not stand a chance” without adaptation.
The investor also added that the most troubling aspect is not only the severity of the quantum threat itself, but what he described as the dismissal and lack of urgency surrounding the issue.
CryptoQuant founder Ki Young Ju had also voiced concerns about the growing quantum computing threat facing Bitcoin. He said that protecting the network may require difficult decisions. One potential solution, according to Ju, could be freezing older Bitcoin addresses as part of a quantum-resistant upgrade.
You may also like:
He added that implementing such changes would be challenging, as the crypto community has often struggled to agree on protocol updates. Ju even went on to add that assets considered secure today may not remain safe if quantum technology continues to advance.
Industry Remains Divided
Not everyone in the crypto industry agrees on how urgent the threat to the world’s largest cryptocurrency really is. In December, Jameson Lopp, co-founder and chief security officer of Casa, said quantum computers do not pose a near-term risk to Bitcoin. He believes the technology remains far from being able to break Bitcoin’s cryptography. Lopp acknowledged that researchers should continue monitoring progress in the field, but said fears of an imminent threat are premature. He also noted that preparing Bitcoin for a post-quantum future would be a long process.
Similar views have been expressed by Grayscale, which said in a recent report that quantum computing is unlikely to have a meaningful impact on crypto markets in 2026. While acknowledging long-term risks, the firm downplayed short-term consequences.
More recently, Strategy co-founder Michael Saylor also minimized the concern. Speaking on Coin Stories with Natalie Brunell, Saylor said most cybersecurity experts believe any credible quantum threat remains more than a decade away.
Binance Free $600 (CryptoPotato Exclusive): Use this link to register a new account and receive $600 exclusive welcome offer on Binance (full details).
LIMITED OFFER for CryptoPotato readers at Bybit: Use this link to register and open a $500 FREE position on any coin!

Solana price has formed a swing failure pattern at the 0.618 Fibonacci support, signaling potential demand and raising the probability of a short-term reversal.
Summary
- Swing failure pattern formed at key 0.618 Fibonacci support
- $78 resistance reclaim needed to confirm reversal structure
- Upside target toward $88 if bullish momentum strengthens
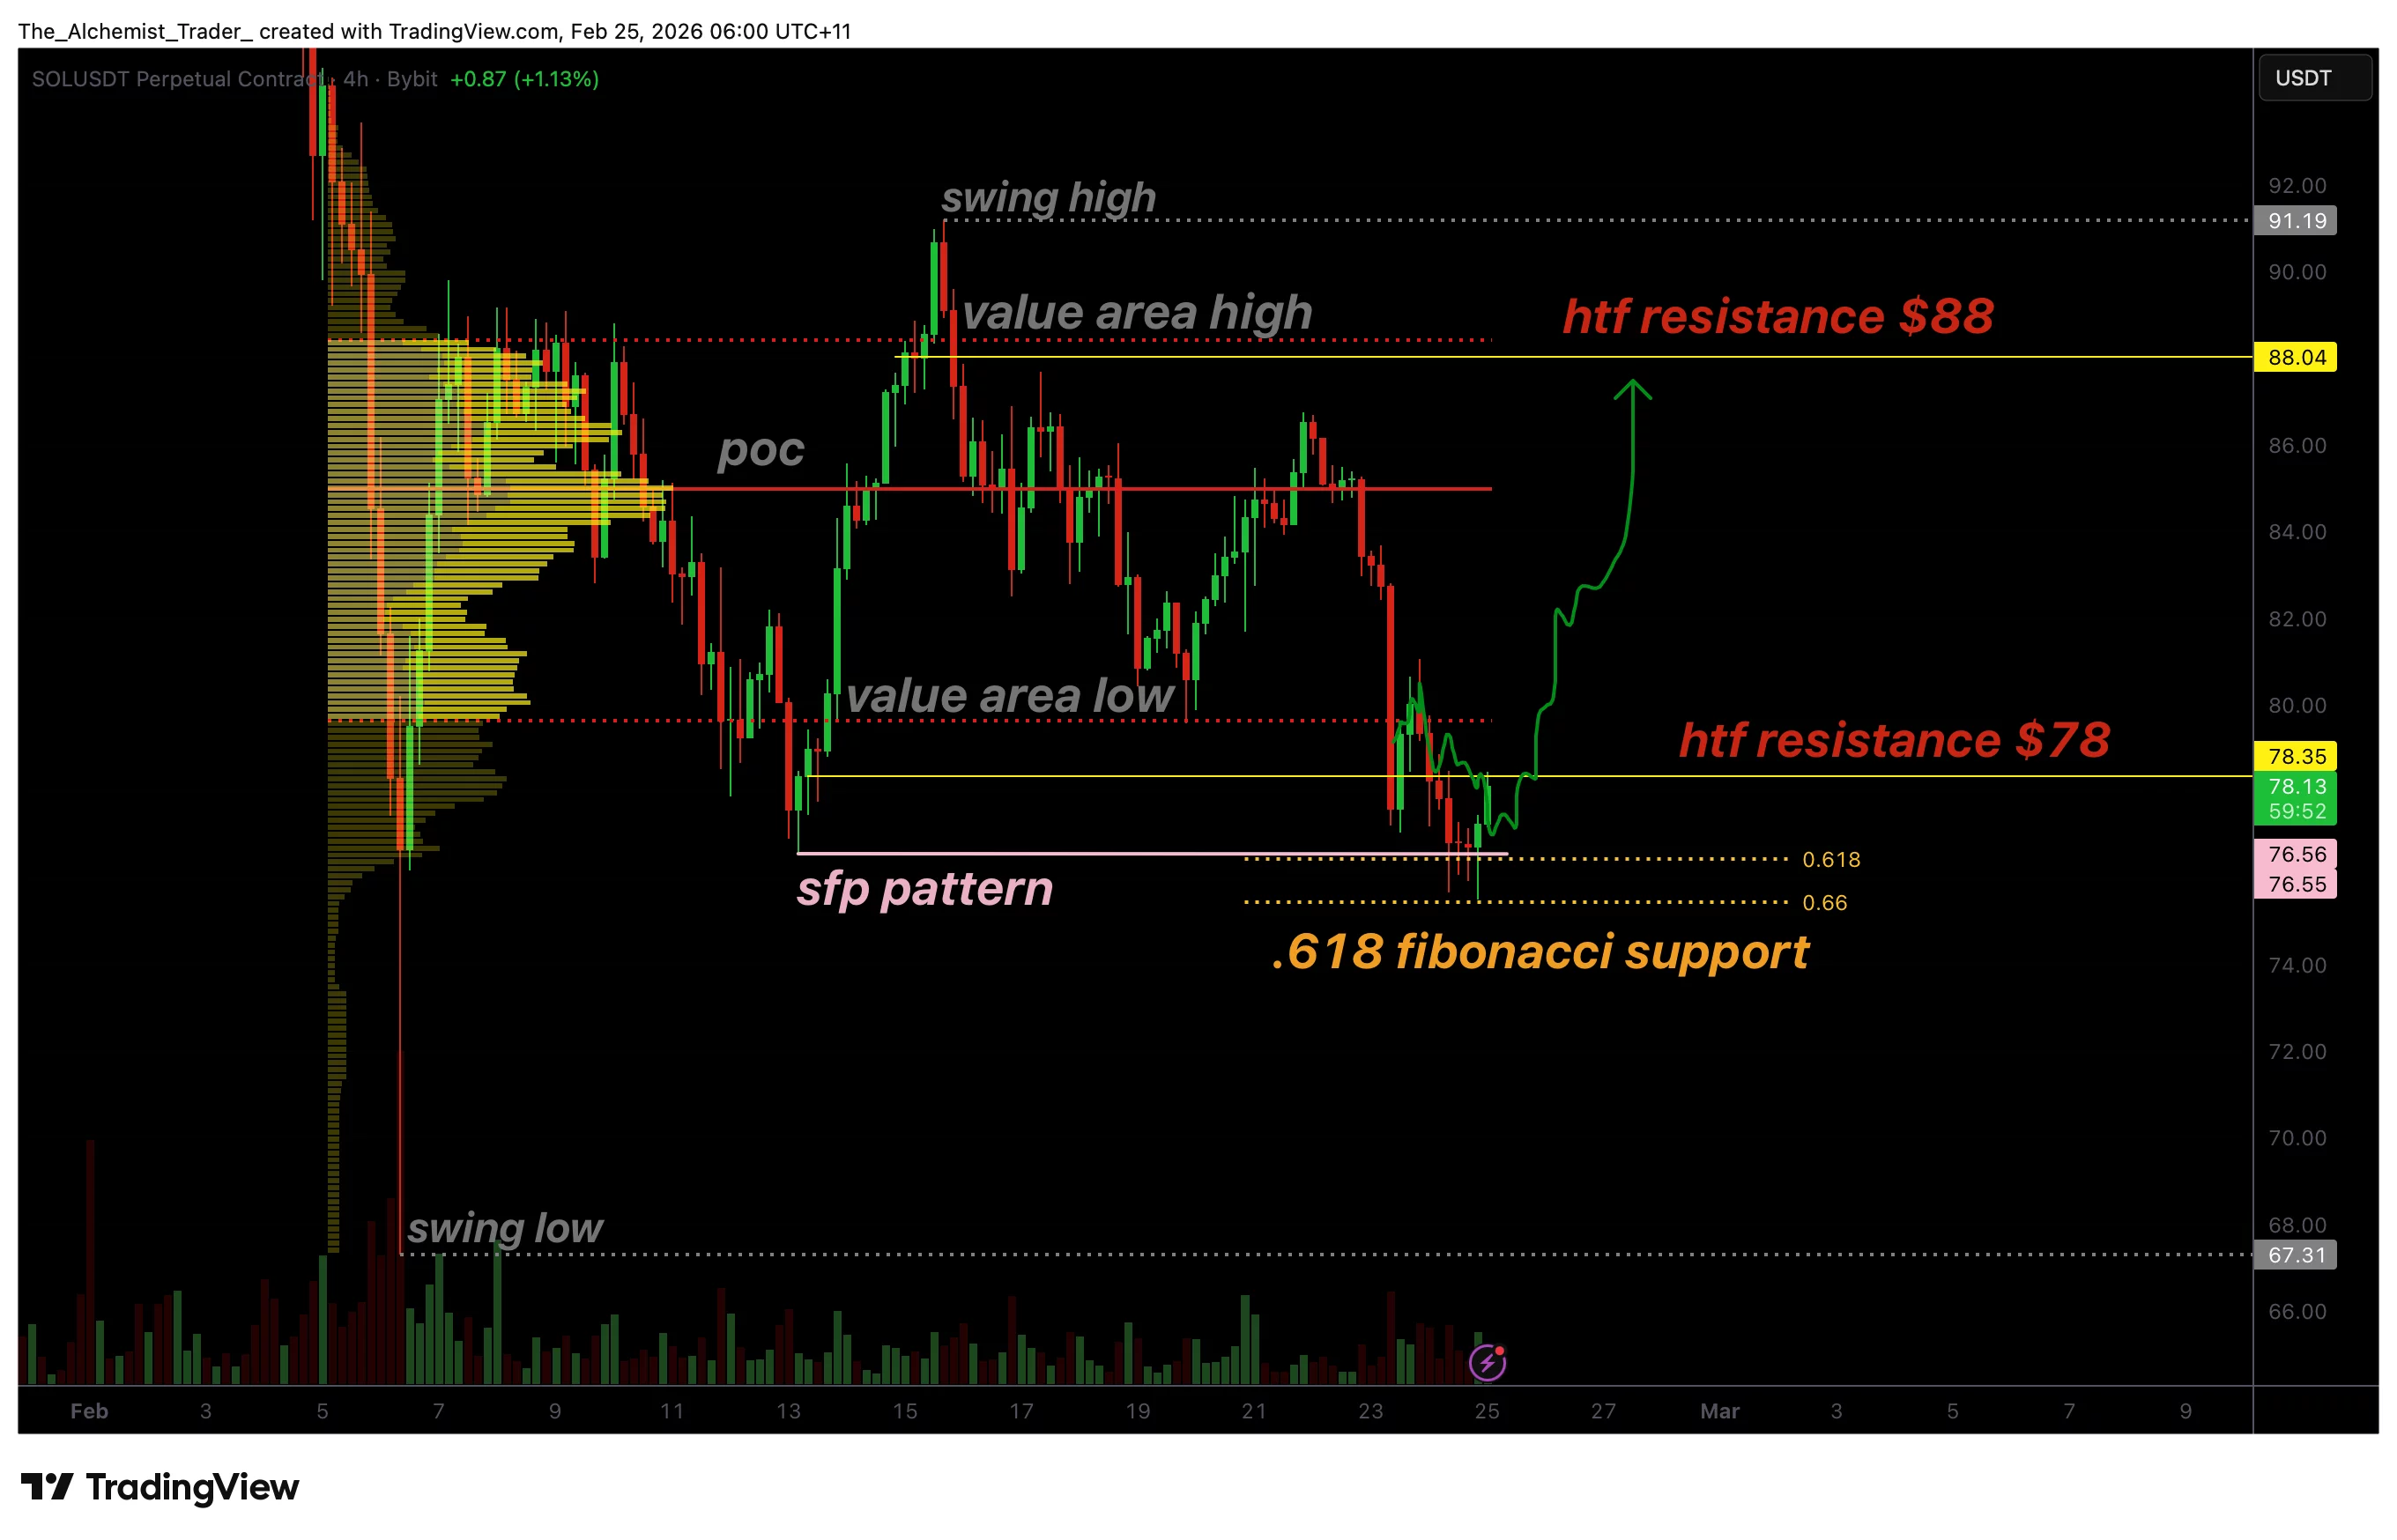
Solana (SOL) price action is displaying a technically significant development as a swing failure pattern (SFP) forms at a key Fibonacci support level. After an extended corrective move, Solana briefly broke below its previous swing low, only to quickly reclaim it, leaving multiple downside wicks on the chart. This type of price behavior often signals liquidity absorption and the presence of underlying demand.
The SFP has emerged at the 0.618 Fibonacci retracement level, a historically important support area that traders closely monitor during pullbacks. When liquidity is swept below prior lows and price immediately recovers, it frequently indicates that sellers are losing momentum and buyers are stepping in at discounted levels.
While confirmation is still required, the current setup raises the question of whether Solana is forming a local bottom within its broader trading structure.
Solana price key technical points
- Swing failure pattern confirmed: Previous low swept with strong rejection
- 0.618 Fibonacci support respected: Key retracement level attracting demand
- $78 resistance pivotal: Reclaim could trigger acceleration toward $88
The defining feature of this setup is the swing failure pattern itself. An SFP occurs when price breaks below a prior swing low, triggers stop-loss liquidity, and then quickly reverses back above that level. This behavior traps aggressive sellers and often fuels short-term upward momentum.
In Solana’s case, multiple wicks below the previous low demonstrate that price attempted to trade lower but failed to find acceptance. Instead, buyers absorbed the selling pressure and pushed price back into prior structure.
These types of technical reactions are especially meaningful when they occur at major Fibonacci levels, even as broader ecosystem developments, including Step Finance shutting down its Solana-based platforms after a January hack that reportedly drained up to $40 million, continue to influence market sentiment.
The 0.618 retracement is widely regarded as one of the most important levels in technical analysis. Markets frequently react strongly here, as it represents a deep corrective zone within a broader trend. Solana’s ability to defend this level strengthens the argument that a bounce may already be underway.
Market structure shifts toward reversal potential
From a market structure perspective, early signs of reversal are beginning to form. The SFP suggests that downside momentum may be fading, but confirmation requires a shift in local resistance levels.
The key level to monitor now is $78. This region represents local resistance and an important decision point. For Solana to transition from corrective bounce to confirmed reversal, price must reclaim and hold above $78. Acceptance above this level would signal structural improvement and invalidate the immediate bearish bias.
Reclaiming $78 would also position Solana back above the value area low, an important benchmark in volume-based analysis. When price regains this level, it often reflects improving sentiment and increasing participation from buyers, particularly as ecosystem developments continue to evolve, including Zora expanding onto the Solana blockchain with its new “attention markets” product beyond its earlier NFT and Ethereum focus.
$88 emerges as next upside objective
If Solana successfully reclaims $78, the probability increases for an accelerated move toward the next high-timeframe resistance at $88. This level aligns with prior distribution zones and serves as a natural liquidity target following a confirmed SFP.
The move toward $88 would represent not only a relief rally but also a meaningful structural recovery within the broader market context. A break above this level would further reinforce the bullish thesis and potentially shift the medium-term outlook.
However, failure to reclaim $78 would weaken the setup. In that scenario, the SFP may represent only a temporary reaction rather than the start of sustained upside continuation.
What to expect in the coming price action
From a technical, price action, and market structure perspective, Solana is at a critical inflection point. The swing failure pattern at the 0.618 Fibonacci support suggests a potential local bottom may be forming. Confirmation now hinges on a decisive reclaim of the $78 resistance level. If achieved, Solana could accelerate toward $88 and reclaim higher value zones in the short term.
Until then, the market remains in a reaction phase, with traders closely watching resistance for validation of a broader reversal.
Crypto World
58% of Ethereum’s wealth is hiding in plain sight, and half of DeFi is built on thin air
Disclosure: This article does not represent investment advice. The content and materials featured on this page are for educational purposes only.
Ethereum’s top holders double in size when tokens and stablecoins are included in on-chain valuations.
Summary
- Aggregating ETH with tokens shows top holders control $426 billion, over 2x higher than ETH-only rankings reveal.
- Including ERC-20s shifts power view, with smart contracts holding nearly 40% of top Ethereum balances.
- New PPI metric flags self-minted DeFi exposure, warning of fragility if selling pressure triggers unwind risks.
Ethereum’s balance sheet looks nothing like what it looked like a couple of years ago.
A new on-chain analysis has found that 58% of capital held by Ethereum’s largest addresses exists outside of Ethereum (ETH) entirely — sitting in ERC-20 tokens and stablecoins that traditional rankings simply don’t capture.
When Ethereum addresses are ranked by ETH balance alone, the top 10,000 hold a combined $189 billion. Rank those same addresses by total assets — ETH plus ERC-20 tokens and stablecoins — and that figure climbs to $426 billion. The capital sitting at the top of Ethereum’s economy is more than twice as large as conventional rankings suggest.
The gap is not just a numbers story. It reveals an entirely different cast of major holders. Among the top 1,000 addresses, only 537 appear in both the ETH-only and the aggregated rankings, meaning nearly half of Ethereum’s largest holders are effectively invisible when the market looks at ETH balances alone.
The composition of those holdings tells its own story. ETH now represents just 42% of what the largest addresses hold. Stablecoins account for roughly 26%, with the remaining share spread across ERC-20 tokens. A form of dominance shift has already taken place through quiet balance-sheet accumulation across protocols and tokens while prices remained largely range-bound.
Smart contracts are a central part of this new picture. Through an ETH-only lens, they appeared as minor participants in Ethereum’s wealth distribution. In the aggregated ranking, they control nearly 40% of top-holder capital. This roughly three times their previous share. Risk, the report argues, has migrated from individual holders making decisions to automated mechanisms governed by code, collateral design and token economics.
That shift in who holds capital leads directly to a harder question: what is that capital actually made of?
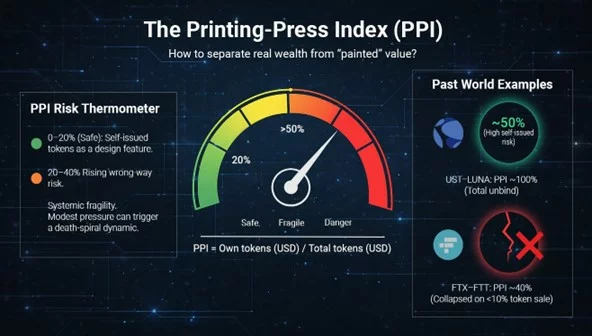
To answer it, the report introduces the Printing-Press Index, which is a measure of how much of a protocol’s token holdings are made up of its own self-issued tokens. Among DeFi protocols, that figure clusters around 50%, with names like Uniswap, Aave and Mantle among the examples cited.

The report identifies roughly 20% as the point where self-issued tokens begin to introduce meaningful risk, and 40-50% as the threshold where a protocol enters fragile territory. At those levels, a balance sheet is no longer primarily backed by external capital — it is partially backed by confidence in itself.
Modest selling pressure can impair that confidence, compress liquidity, and trigger the kind of reflexive unwind seen in the LUNA-UST collapse, where a Printing-Press Index near 100% contributed to a full death spiral within days.
The implication for how Ethereum’s economy is analyzed is significant. Once tokens represent the majority of large-address holdings and smart contracts control nearly 40% of that capital, balance size alone becomes a poor indicator of resilience. The Printing-Press Index offers a practical way to look past headline figures and assess what is actually backing the wealth that aggregated rankings are now beginning to reveal.
Disclosure: This content is provided by a third party. Neither crypto.news nor the author of this article endorses any product mentioned on this page. Users should conduct their own research before taking any action related to the company.


- Bitcoin Cash price dropped more than 10% as bears hit the crypto market on Tuesday.
- The altcoin fell to lows of $481 and risked further losses amid Bitcoin weakness.
- Analysts say demand recovery could help bulls bounce.
Bitcoin Cash price has extended its downward trajectory, shedding more than 10% in value over the past 24 hours to touch lows of $481 in early trading on February 24, 2025.
The declines come as bearish sentiment grips the broader cryptocurrency market, with top coins plunging alongside Bitcoin’s fall below $63,000.
While some analysts note that the market could see a potential for a short-term recovery, prevailing headwinds favour sellers.
Other altcoins, including Ethereum, XRP, and BNB, have also marked steep declines as negative sentiment dominates.
BCH drops amid macro and geopolitical headwinds
Fresh tariff threats from US President Donald Trump, following a recent Supreme Court ruling on Trump’s 2025 tariffs, have triggered risk-off sentiment.
This has been compounded by other factors, including geopolitical uncertainty, which has prompted investors to seek safer assets and steer clear of volatile cryptocurrencies.
Weak sentiment has, in turn, suppressed crypto bids and contributed to huge outflows from digital asset investment products.
Tightening liquidity and elevated liquidations have further weighed on risk appetite, capping Bitcoin’s rebound.
The dump to lows of $62,700 for BTC accelerated losses for Bitcoin Cash amid this outlook, with bears showing greater appetite as daily volume jumped 46% to over $545 million.
Analysts say the macroeconomic picture and potential escalation in US-Iran tensions could cue further losses.
However, resolutions in favour of bulls will help cut the impact of the correction.
Bitcoin Cash price analysis
As noted, Bitcoin Cash traded as low as $481 on February 24, slipping by double digits in 24 hours as sellers pulled prices from highs of $570.
The fresh selling that has driven BCH below $500 aligns with technical indicators that paint a mostly bearish picture.

Bitcoin Cash’s recent declines have pushed the 50-day moving average toward the 200-day moving average, outlining a possible death cross pattern.
Increased losses and confirmation will come with intensified bearish momentum.
Meanwhile, the RSI and MACD indicators are also slipping lower, signaling bearish control.
According to CryptoQuant, Bitcoin’s slide from near $68k to under $63k coincides with the Coinbase Premium Index (SMA 30) rejecting downward.
The index gauges price premium on Coinbase versus global exchanges, and its downtrend for over a month suggests US selling pressure remains.
Failure to recover in the latest sessions highlights continued institutional hesitation.
Analysts at Bitfinex also share a similar outlook.
$BTC can bounce on positioning, but it rallies on spot demand.
CVD implies roughly $2.5B of net market sells since Feb 20 across centralised exchanges. That is not “one bad actor”, it is broad distribution.
Until that slows, breakouts often fade. pic.twitter.com/sR3vfvaZVi
— Bitfinex (@bitfinex) February 24, 2026
If Bitcoin drops to $50k or lower, a cascade of sell-off pressure will exacerbate BCH’s losses.
In the short term, BCH faces continued selling toward $425 and possibly $378.
On the upside, initial resistance is at the $500 mark, and then the moving average levels.
Currently, the 50-day and 200-day MA are converging near $560-$566.

A major shareholder in Empery Digital has urged the company to abandon its Bitcoin-focused strategy, sell its digital asset holdings, and return the proceeds to investors, while calling for the resignation of the CEO and the entire board. In a letter dated February 23, 2026, Tice P. Brown, who owns about 9.8% of Empery Digital’s outstanding shares, argued that management has insulated itself at holders’ expense and pushed for a governance reset to unlock shareholder value. Brown’s appeal arrives as the company faces questions about whether its Bitcoin-centric approach remains viable amid a tighter funding environment and shifting volatility in crypto markets.
Brown’s leverage escalated just days after he disclosed that Empery Digital privately approached him on February 18 with an offer to repurchase all of his shares at a price equal to 100% of their market net asset value (mNAV), a premium he described as sizable relative to prevailing valuations. He rejected the proposal, saying it appeared designed to preserve management’s positions rather than to return capital to shareholders. The disclosure underscores a broader tension between insiders who favor propping up the company’s strategy and dissident investors seeking a more liquid, investor-friendly outcome.
Brown has been vocally critical of Empery Digital’s capital allocation decisions, governance posture, and its buyback strategy, arguing for a pivot away from a Bitcoin-centric model. In his view, the company should reposition toward liquidity, diversification, and a clearer path to capital returns for holders. Empery Digital has publicly pushed back, asserting that Brown’s characterization of events is distorted and that management remains open to arrangements that align with the long-term interests of the company and its shareholders.
The tensions come as Empery Digital, formerly known as Volcon, restructures its identity around a Bitcoin-focused corporate treasury. The company began its pivot in mid-2025 with the aim of becoming a Bitcoin aggregator, amassing a sizable position in the cryptocurrency. As of the latest disclosures, Empery Digital holds 4,081 BTC, placing it among the top 25 publicly traded Bitcoin holders globally. That concentration has become a focal point for critics who question whether a treasury strategy anchored to a volatile asset class can sustain long-term shareholder value, especially when market conditions compress valuations across the sector.
Analysts and observers have noted that digital asset treasuries have faced renewed pressure as crypto prices retrace and equity valuations across the sector compress. Standard Chartered recently warned that the sustainability of many crypto-treasury models depends on maintaining a premium valuation relative to the underlying Bitcoin holdings, a premium that has proved increasingly difficult to defend in current markets. The dynamic raises questions about whether Empery Digital’s current structure can weather declines in Bitcoin’s price, while still delivering meaningful upside to investors if market sentiment improves.
Meanwhile, the market context for crypto treasuries remains nuanced. On one hand, Bitcoin remains a focal point for investors seeking on-chain exposure within corporate balance sheets. On the other, the performance and governance of firms with large digital-asset holdings are scrutinized more closely, given concerns about liquidity, transparency, and the ability to liquidate assets without triggering adverse price moves. The public discourse around Empery Digital’s strategy reflects a broader debate about the role of crypto-treasury functions within traditional corporate structures and the potential need for governance safeguards to protect minority holders during periods of volatility.
Empery Digital’s Bitcoin gambit could be upended
The dispute highlights growing tensions around Empery Digital’s business model, which now centers on holding Bitcoin as its principal asset rather than pursuing a diversified corporate portfolio. The company’s strategic direction—pursuing a Bitcoin-centered treasury that aspires to function as a Bitcoin aggregator—has drawn both curiosity and criticism. If Brown’s push gains traction and the board yields to investor demands, a liquidation or partial divestment of the BTC holding could dramatically reframe the company’s value proposition and alter investor expectations about future returns.
Empery Digital’s origin story adds another layer to the narrative. It began life as Volcon, a maker of electric off-road vehicles and related equipment, before pivoting to a crypto-centric treasury strategy in 2025. The shift represents a broader trend in which corporate treasuries allocate to digital assets as a hedge or growth engine, a move that has attracted both interest and regulatory scrutiny. The transformation also places Empery Digital at the center of conversations about governance, capital allocation, and the sustainability of asset-backed valuations in the crypto era.
Brown’s stance, backed by his 9.8% stake, has already prompted public statements from Empery Digital. The company contends that Brown “continues to misrepresent and distort the facts,” arguing that any repurchase discussions were solely driven by a desire to act in the best interests of all shareholders. The public exchange signals a potential turning point for Empery Digital, as management seeks to defend a strategy that has become highly scrutinized in a market where liquidity and asset valuations can swing rapidly. This back-and-forth underscores the challenges faced by crypto-treasury businesses when governance decisions intersect with market cycles and investor sentiment.
Beyond Empery Digital’s shores, the broader crypto market has watched closely. Bitcoin’s price dynamics have influenced how investors evaluate crypto treasuries, with some market participants arguing that pure BTC accumulation strategies may need to be complemented by liquidity options, hedging mechanisms, or revenue-generating activities to weather downturns. As the sector collectively reassesses the economics of digital-asset holdings in corporate portfolios, Empery Digital’s situation could serve as a barometer for how governance disputes, minority shareholder rights, and strategic pivots are resolved in real time.
The discord also touches on the question of whether a company can sustain a premium to its net asset value (NAV) when its core asset—the cryptocurrency—suffers price fluctuations. If the market reassesses the premium to NAV or doubts the ability to liquidate Bitcoin holdings efficiently without impacting prices, investors may demand more transparent pathways to value realization. In that context, Empery Digital’s leadership transition discussions and potential strategic recalibration become critical signals for the market around risk, governance, and the alignment of incentives between management and shareholders.
As the story unfolds, market observers will be watching for three key developments: the board’s response to Brown’s letter and any concrete governance changes, the outcome of any discussions about liquidating or reallocating the BTC holdings, and how Empery Digital communicates its strategic considerations to investors going forward. The stakes extend beyond a single shareholder dispute; they touch on how crypto-treasury strategies are evaluated, priced, and regulated within traditional capital markets. The unfolding narrative will likely influence how other publicly traded entities with cryptocurrency holdings approach governance, disclosures, and capital-allocation decisions in an environment characterized by ongoing scrutiny and evolving market dynamics.
What to watch next
- Public response from Empery Digital’s board and any formal governance votes or resolutions related to Brown’s requests.
- Updates on the company’s BTC holdings, including any implications for liquidity, NAV, and potential sale or diversification plans.
- forthcoming statements or filings detailing the timeline of any share repurchase discussions or revised capital-allocation strategies.
- Market reaction to governance developments and any subsequent price or volatility shifts in the company’s shares or BTC exposure.
Sources & verification
- Shareholder letter from Tice P. Brown to Empery Digital’s board (Feb 23, 2026) as published in GlobeNewswire.
- Empery Digital’s statement addressing Brown’s characterization (as referenced in FT Markets reporting on Feb 24, 2026).
- StreetInsider coverage of the shareholder push for CEO and board resignations.
- BitcoinTreasuries.NET page documenting Empery Digital’s BTC holdings (Volcon Inc) and its ranking among public holders.
Empery Digital’s Bitcoin strategy under pressure as investor calls for governance shakeup
Empery Digital has built a Bitcoin (CRYPTO: BTC)-centric treasury, accumulating 4,081 BTC to date and positioning itself among the world’s more prominent public holders. The approach, intended to create value through crypto asset appreciation, has become a focal point for governance scrutiny after a major shareholder demanded a major strategic pivot. The confrontation began with a February 23 letter from Tice P. Brown, who holds roughly 9.8% of the company’s outstanding shares, urging the removal of CEO Ryan Lane and the entire board, and calling for a sale of the company’s Bitcoin stash with proceeds redistributed to shareholders. Brown contends that the current management team has entrenched itself in a way that undermines shareholder interests and capital efficiency.
The letter revealed a concrete counterproposal: a prior private offer to repurchase Brown’s shares at 100% of market net asset value (mNAV), framed as a premium to current market valuations. Brown rejected the deal, arguing that such a transaction would simply preserve existing control structures rather than deliver meaningful capital returns to investors. The exchange underscores a broader debate about whether a Bitcoin-centered strategy can deliver durable value in a market characterized by price swings, regulatory shifts, and evolving liquidity dynamics. While Brown framed the buyback as an opportunity to unlock value, Empery Digital characterizes the proposal as misaligned with the company’s long-term interests and governance standards.
Empery Digital’s response emphasizes that its leadership sought to engage Brown in a manner consistent with shareholder value creation, while maintaining a careful stance on the timing and method of any liquidity actions. The company’s board contends that Brown’s public portrayal of events does not accurately reflect the negotiation process, and insists that discussions were conducted with the aim of safeguarding the equity base. This exchange highlights the delicate balance between a treasury strategy anchored in a volatile asset and the expectations of public investors who seek predictable returns and governance accountability.
Looking ahead, the market will assess whether Empery Digital’s Bitcoin holdings—built over the course of 2025 and sustained into 2026—can withstand a shifting macro backdrop. Standard Chartered’s warnings about the sustainability of a premium to NAV in crypto-treasuries add a layer of caution to the conversation. If the market shifts away from valuing Bitcoin-heavy treasuries at a premium, companies like Empery Digital may need to demonstrate enhanced liquidity options, transparent capital-allocation policies, and credible pathways to returning capital to shareholders. The ongoing debate is not merely about whether to hold or sell; it is about how a crypto-native strategy integrates with corporate governance norms, investor expectations, and the regulatory environment that shapes disclosures and financial performance.
In the near term, investors will look for clarity on governance and strategy. Brown’s letter has already sparked a public debate about whether a Bitcoin-focused corporate treasury can deliver consistent shareholder value without sacrificing governance and liquidity. Empery Digital’s next moves—whether they entail partial divestitures, strategic diversification, or a recalibration of its capital-allocation framework—will be closely watched by a spectrum of investors, from crypto-focused funds to traditional equity holders seeking risk-adjusted exposure to digital assets. The outcome could influence how other companies with crypto holdings articulate their governance structures and communicate with shareholders in a market that remains sensitive to both asset volatility and governance signals.


Pi Network’s co-founder Nicolas Kokkalis asserted that KYC and migration remain a top priority.
Earlier this month, Pi Network celebrated the first anniversary of its Open Network launch.
To mark the milestone, the co-founders of the controversial crypto project answered a series of questions to offer users more insight into Pi’s future strategy, approach, and current work.
KYC And More
The co-founders, Chengdiao Fan and Nicolas Kokkalis, started by praising the “incredible advances” in Pi Network’s activity, app development initiatives, and platform-level utility releases over the past year. Fan asserted that in the next 12 months, the team will focus on expanding its ecosystem by creating additional opportunities for users.
Then they moved to the first question: what makes Pi Network different from other blockchains, and why does utility matter? Fan described Pi as “nonconformist,” emphasizing that it sets itself apart in several fundamental ways. She highlighted that the project has never conducted an ICO, is built on a mobile-first approach, is free to mine, and has already amassed tens of millions of verified users worldwide.
From there, the discussion shifted toward Pi Network’s emphasis on real-world utility. Fan explained that Pi’s vision has always centered on enabling tokens to participate in genuine economic activity rather than relying solely on abstract financial mechanisms. In her view, this approach is reinforced by Pi’s fully KYC-verified user base, which the team considers essential for supporting real-world assets and meaningful value creation across the ecosystem.
The next question, “What is the network working on now?” was answered by Kokkalis. He asserted that KYC and migration remain a top priority, adding that the team has started increasing KYC throughput, unblocking more users, boosting speed, and allowing second migrations.
“We are also on track to roll out KYC validator rewards this quarter in a secure and scalable way. In terms of Developer tools and support, we’re supporting developers, lowering the barrier to building on Pi through improved tooling and simpler integrations, including new tools like much faster Pi payment setups, along with ongoing support to help developers launch and scale real utilities,” he added.
Moreover, Kokkalis said the team will continue working on Nodes, protocol upgrades, and components like DEX functionality and liqduity pools.
You may also like:
Perhaps the most important question intriguing a large part of the community is the significance of the Know-Your-Customer process and what comes next. Kokkalis said the team has spent years building its KYC solution, explaining that because Pioneers are spread across the globe, the system needed to achieve broad geographic coverage and scalability.
The co-founder added that the heavy investment in the function was intentional, as identity verification is important to the integrity and authenticity of the entire network. Looking ahead, he noted that the team intends to offer its KYC technology as a service to external projects, thus turning it into a capability that could support Web3 and traditional businesses.
PI Tokens and AI
Another question for the founders focused on clarifying what Pi ecosystem tokens actually are. Fan explained that those are coins created by the community and issued on Pi.
“As many of you know, ecosystem tokens have already been released on Testnet, and we are finalizing their implementation on Mainnet. While technology and product are obviously important, we believe the most critical factor on Mainnet will be their design,” she added.
Fan believes that the ability to issue tokens is an “important superpower” of Web3, yet she thinks many coins in the crypto space are designed with no real-world use.
The last question focused on the fast-evolving Artificial Intelligence sector and how Pi Network plans to integrate that technology. Fan explained that AI is reshaping how value is created, making it essential for blockchain networks to support real-world production rather than rely on speculation. She stated that Pi’s strategy is to build AI-powered apps using tools such as Pi App Studio.
Are Pioneers Satisfied?
Judging by the comments under Pi Network’s anniversary announcement, plenty of users continue to struggle with major issues and urged the team to act more urgently.
Some Pioneers claimed they’ve been waiting for five-six years to complete the necessary verification steps and migrate to the mainnet, yet still haven’t been able to do so. Others went even further, calling Pi Network “a dirty scam project.”
Binance Free $600 (CryptoPotato Exclusive): Use this link to register a new account and receive $600 exclusive welcome offer on Binance (full details).
LIMITED OFFER for CryptoPotato readers at Bybit: Use this link to register and open a $500 FREE position on any coin!
Disclaimer: Information found on CryptoPotato is those of writers quoted. It does not represent the opinions of CryptoPotato on whether to buy, sell, or hold any investments. You are advised to conduct your own research before making any investment decisions. Use provided information at your own risk. See Disclaimer for more information.


The EF has created a team to support DeFi builders, focusing on privacy, security, and open-source principles.
The Ethereum Foundation is doubling down on decentralized finance this year, forming a dedicated internal unit to support builders and to scale what it calls “cypherpunk values alongside market growth.”
In a blog post published on Monday, Feb. 23, the organization framed DeFi as the “inevitable evolution of finance,” adding that “it’s been a critical driver of Ethereum’s growth and adoption.”
The foundation is explicit about the kind of DeFi it supports: “permissionless, censorship-resistant, privacy-first, self-custodial, and open source.”
The focus of the new DeFi unit, which sits within the organization’s App Relations team, is to guide DeFi development on Ethereum, support teams building in the space, and make sure projects stick to those principles. According to the blog post, the unit is led by Charles St. Louis and IvanGBI, both veterans from projects like DELV, MakerDAO, and Gearbox Protocol.
“The Ethereum Foundation believes in Defipunk: not finance that’s marginally better than TradFi, but finance that couldn’t exist without Ethereum,” the blog post reads.
First announced last year, “Defipunk” is the EF’s new framework that supports privacy- focused DeFi projects, as The Defiant reported earlier.
Ethereum remains the largest blockchain network by total value locked in DeFi, with $53.8 billion.
Priorities for 2026
To support the outlined plan, the foundation plans to set up “clear channels for DeFi teams to connect with the EF and each other,” though it didn’t provide specifics.
For 2026, the foundation is zeroing in on a set of priorities such as building stronger relationships with teams, improving security, supporting decentralization, advancing privacy, and conducting research.
Looking ahead, the Ethereum Foundation is also watching emerging intersections with AI, institutional adoption, stablecoins and new financial primitives, promising content and support in these areas.
To keep up with the trends, the organization has already set up a new unit dubbed the “dAI Team,” which aims to make Ethereum the “preferred settlement and coordination layer” for AI agents and the machine economy, The Defiant reported back in September.
The pledge to double down on DeFi comes just weeks after Tomasz Stańczak — who led the EF’s platform and EcoDev teams and founded execution-client project Nethermind — announced in mid-February that he would step down as co-executive director of the Ethereum Foundation.
Stańczak, who has served in the role for just under a year, said in a post on X that Bastian Aue will take over as interim co-ED alongside current co-ED Hsiao-Wei.

A major shareholder in Empery Digital has called on the company to abandon its Bitcoin-centric strategy, sell its digital asset holdings and return the proceeds to investors, along with demanding the resignation of the CEO and the entire board of directors.
In a letter to the company’s board on Monday, Tice P. Brown, who is the beneficial owner of roughly 9.8% of Empery Digital’s outstanding shares, accused management of entrenching themselves at shareholders’ expense.
Brown said that Empery Digital’s leadership privately approached him on Feb. 18 with an offer to repurchase all of his shares at a price equal to 100% of their market net asset value (mNAV), which he called “a large premium to prevailing market valuations.” He declined the proposal, saying it was designed to preserve management’s positions rather than return capital to shareholders.
Brown previously criticized the company’s capital allocation decisions, particularly its governance and buyback strategy, and urged a complete pivot away from its Bitcoin (BTC) strategy.
In response to Brown’s recent letter demanding both the Bitcoin sale and the immediate resignation of CEO Ryan Lane and the entire board, Empery Digital said the dissident investor “continues to misrepresent and distort the facts to further his self-serving campaign.”

In its statement, the company pushed back on Brown’s characterization of events, saying: “Mr. Brown intimated his interest in having his shares repurchased by the company but initially demanded a significant premium to NAV. Management attempted to reach an agreement with Mr. Brown as it believed such an agreement would be in the best interests of the Company and all its shareholders.”
Related: Bitcoin ETFs still sit on $53B in net inflows despite recent outflows: Bloomberg
Empery Digital’s Bitcoin gambit could be upended
The revolt by a major shareholder highlights mounting tensions around Empery Digital’s business model, which is built on accumulating and holding Bitcoin as its principal asset. A push to liquidate that stash could upend the strategy and reshape investor expectations of the company’s value.
Empery Digital, formerly known as Volcon, began as an electric power sporting goods company producing electric off-road vehicles and related products. It pivoted to a Bitcoin-centric corporate treasury strategy in mid-2025, adopting the new focus with the stated goal of becoming a Bitcoin aggregator.
Since then, Empery has accumulated 4,081 BTC, making it one of the top 25 publicly traded Bitcoin holders globally.

Digital asset treasuries have come under pressure as crypto prices have retraced and equity valuations across the sector have compressed.
Analysts at Standard Chartered recently warned that the sustainability of many crypto treasury companies hinges on their ability to maintain a premium valuation relative to their underlying Bitcoin holdings, commonly measured by market net asset value. That premium has become increasingly difficult to sustain amid current market conditions.
Related: Crypto’s 2026 investment playbook: Bitcoin, stablecoin infrastructure, tokenized assets
All Plants in Garden Horizons

San Francisco AI startup Nooks makes engineering push in Seattle

Financial Struggles & YouTube | ft. Ayush Bhandari #themotormouth #ayushbhandari #challenge

Smart energy pays enters the US market, targeting scalable financial infrastructure

Why Israel is blocking foreign journalists from entering

Bitcoin: We’re Entering The Most Dangerous Phase
Financial Struggles & YouTube | ft. Ayush Bhandari #themotormouth #ayushbhandari #challenge

“Now We Know Why They Crashed Bitcoin On Purpose” – Mike Novogratz Reveals Everything

Live Crypto And Gold Scalping Trading | 24 Feb 2026 #cryptoscalping #xauusdlive
-

 Video5 days ago
XRP News: XRP Just Entered a New Phase (Almost Nobody Noticed)
-

 Fashion4 days ago
Weekend Open Thread: Boden – Corporette.com
-

 Politics3 days ago
Baftas 2026: Awards Nominations, Presenters And Performers
-

 Sports1 day ago
Women’s college basketball rankings: Iowa reenters top 10, Auriemma makes history
-

 Business7 days ago
Infosys Limited (INFY) Discusses Tech Transitions and the Unique Aspects of the AI Era Transcript
-

 Entertainment6 days ago
Kunal Nayyar’s Secret Acts Of Kindness Sparks Online Discussion
-

 Politics1 day ago
Nick Reiner Enters Plea In Deaths Of Parents Rob And Michele
-

 Tech6 days ago
Retro Rover: LT6502 Laptop Packs 8-Bit Power On The Go
-
 Sports6 days ago
Clearing the boundary, crossing into history: J&K end 67-year wait, enter maiden Ranji Trophy final | Cricket News
-

 Business2 days ago
Mattel’s American Girl brand turns 40, dolls enter a new era
-

 Crypto World12 hours ago
XRP price enters “dead zone” as Binance leverage hits lows
-

 Business2 days ago
Law enforcement kills armed man seeking to enter Trump’s Mar-a-Lago resort, officials say
-

 Entertainment6 days ago
Dolores Catania Blasts Rob Rausch For Turning On ‘Housewives’ On ‘Traitors’
-

 Business7 days ago
Tesla avoids California suspension after ending ‘autopilot’ marketing
-

 Tech2 days ago
Anthropic-Backed Group Enters NY-12 AI PAC Fight
-
 NewsBeat1 day ago
‘Hourly’ method from gastroenterologist ‘helps reduce air travel bloating’
-

 NewsBeat2 days ago
Armed man killed after entering secure perimeter of Mar-a-Lago, Secret Service says
-

 Politics2 days ago
Maine has a long track record of electing moderates. Enter Graham Platner.
-

 Crypto World6 days ago
WLFI Crypto Surges Toward $0.12 as Whale Buys $2.75M Before Trump-Linked Forum
-

 Tech2 hours ago
Unsurprisingly, Apple's board gets what it wants in 2026 shareholder meeting