

Crypto World
Trump’s State of the Union Signals No Relief on Rates, Ignores Crypto

The US President Donald Trump delivered a nearly two-hour State of the Union address on Tuesday — the longest in US history — touting economic gains, warning Iran against pursuing nuclear weapons, and defending his tariff agenda after a Supreme Court setback.
Yet in a speech that touched on taxes, AI, housing, and healthcare, digital assets were entirely absent.
All the Trumps Were There, but Not Crypto
The omission is striking. All of Trump’s children were in attendance, including sons Donald Jr. and Eric, who have been deeply involved in crypto ventures such as World Liberty Financial and various token launches.
The president himself has repeatedly pledged to make the US “the crypto capital of the planet.” None of that made it into the address.
Tariff Chaos and Sticky Inflation Keep the Fed on Hold
For crypto markets, the most consequential signals were macro, not legislative.
Trump called the Supreme Court’s ruling striking down his emergency tariffs “very unfortunate” and vowed to maintain them under alternative legal authorities, insisting “congressional action will not be necessary.”
But the rollout quickly turned chaotic. Trump first announced a 10% replacement rate, then revised it to 15% days later. Yet official documents show the lower rate took effect Tuesday with no directive to raise it. The EU suspended ratification of its summer trade deal on Monday; India deferred scheduled talks.
Trump repeated his claim that tariffs could “substantially replace” income taxes. Economists call this implausible. The federal government collected $2.4 trillion in income taxes in 2024 but took in only about $300 billion from tariffs — and must now refund roughly half of that under the court ruling. Also, US importers pay the tariffs, not foreign governments.
On inflation, Trump claimed core inflation fell to 1.7% in late 2025. The reality is more complicated. The Fed’s preferred gauge — core PCE — accelerated to 3% in December, well above the 2% target.
With inflation sticky and tariff policy unresolved, the Fed is widely expected to hold rates steady for the foreseeable future. The three-quarter-point cuts delivered late last year appear to be the last for some time. For risk assets, including crypto, the higher-rate environment persists.
AI Gets Attention, Crypto Does Not
While crypto went unmentioned, AI earned a dedicated segment. Trump announced a “ratepayer protection pledge” requiring tech companies to build their own power plants for data centers, acknowledging the grid “could never handle” surging demand.
First Lady Melania Trump‘s AI legislation work was also highlighted — a sign that AI policy occupies a far more prominent place in the administration’s agenda than digital asset regulation.
The Bottom Line
Trump’s record-length address was a midterm election pitch built on economic optimism. But for crypto participants, the takeaways are clear: no legislative momentum for digital assets despite the president’s family being neck-deep in the industry, unresolved tariff turmoil injecting macro uncertainty, and a Fed locked in place by sticky inflation. The conditions weighing on risk assets aren’t likely to change anytime soon.

Crypto World
FG Nexus Sells Another 7,550 ETH Worth $14.06 Million as Total Reported Losses Reach $82.8 Million

TLDR:
- Lookonchain reported FG Nexus sold 7,550 ETH today, valued at approximately $14.06 million on the open market.
- FG Nexus originally bought 50,770 ETH for $196 million at an average entry price of $3,860 per token in 2025.
- The firm has offloaded 21,025 ETH at roughly $2,649 average, well below its original cost basis of $3,860 per token.
- FG Nexus still holds 30,094 ETH worth about $57.5 million, with total reported losses now standing at around $82.8 million.
According to Lookonchain, Ethereum treasury firm FG Nexus sold another 7,550 ETH today, worth approximately $14.06 million. The sale adds to a growing pattern of divestment that has drawn wide attention across the crypto market.
FG Nexus originally purchased 50,770 ETH between August and September 2025 for approximately $196 million. That position was acquired at an average price of $3,860 per token.
The firm currently holds 30,094 ETH valued at roughly $57.5 million, with total reported losses now at approximately $82.8 million.
Lookonchain Flags FG Nexus Latest ETH Sale of 7,550 Tokens
Lookonchain, a widely followed on-chain analytics platform, reported the latest FG Nexus transaction on its official channels.
The firm sold 7,550 ETH for approximately $14.06 million, continuing a trend that began in late 2025. Lookonchain has been tracking the firm’s movements closely, offering a transparent look at how its Ethereum position has deteriorated over time.
The on-chain data reveals that FG Nexus built its initial position across August and September 2025. During that window, the firm accumulated 50,770 ETH at an average cost of $3,860 per token.
The total outlay for that position came to approximately $196 million, reflecting a large institutional bet on Ethereum at the time.
However, as Ethereum prices declined, FG Nexus began moving in the opposite direction from its original strategy.
Rather than continuing to accumulate, the firm started reducing its holdings. That shift marked a notable reversal and set the stage for the losses now being tracked by Lookonchain.
FG Nexus Selling Activity Points to a Growing Realized and Unrealized Loss
Before today’s sale, FG Nexus had already sold 21,025 ETH at an average price of approximately $2,649 per token. That average exit price sits roughly $1,211 below the firm’s original average entry price of $3,860. The gap between those two figures captures how much value the firm surrendered on each token sold.
Today’s additional sale of 7,550 ETH at approximately $14.06 million further extends that loss gap. Lookonchain’s tracking shows the cumulative exit prices remain well below the original cost basis.
Combined, the sold ETH represents a substantial portion of what the firm once held across its peak position.
FG Nexus currently holds 30,094 ETH, valued at approximately $57.5 million according to Lookonchain data. Measured against the original $196 million purchase, the firm’s total reported loss stands at around $82.8 million.
That figure covers both realized losses from completed sales and the unrealized loss on the remaining position. A meaningful recovery in Ethereum prices would be necessary for that gap to narrow from this point forward.

Crypto World
Sen. Blumenthal probes Binance over alleged $1.7 billion in crypto Iran-linked transactions


U.S. Senator Richard Blumenthal, a top Democrat on the Senate Homeland Security Committee, on Tuesday opened a probe into alleged sanctions violations at crypto exchange Binance, the New York Times reported on Wednesday.
Blumenthal, who represents Connecticut, sent Binance a letter asking about the $1.7 billion allegedly transferred from accounts on the platform to Iran-linked organizations, including Yemen’s Houthi militants. The violations were identified by internal Binance investigators who were subsequently dismissed, according to several news reports. The world’s largest crypto exchange denied the allegations in an email to CoinDesk.
“The New York Times’ prior reporting is wrong. Binance has strict KYC (know-your-customer) and compliance procedures in place, and there are no Iranian users on the platform,” a Binance spokesperson said in the email. The spokesperson also reiterated the exchange’s stance “against false claims in these reports”, referring to articles by the New York Times, Wall Street Journal and Fortune about the alleged dismissal of the four investigators involved.
Blumenthal sent a letter to Binance’s co-chief executive Richard Teng asking for records of the company’s dealings with two Hong Kong entities identified by the investigators as the origin of the transfers to Iran, the New York Times said.
One of the accounts was registered to Blessed Trust, a Hong Kong company that served as a Binance vendor. According to the newspaper, a Binance representative said the exchange canceled the accounts and stopped working with Blessed Trust in January.
“Binance appears to have ignored warnings and recommendations to prevent Iranian money laundering schemes on its cryptocurrency exchange,” Blumenthal wrote. The lawmaker also asked Teng to hand over records about “the suspension and dismissal of compliance staff and investigators” who flagged the alleged violations.
Binance’s founder and former CEO, Changpeng Zhao pleaded guilty in November 2023 to violating anti-money-laundering laws and allowing customers in countries under sanctions, including Iran, to transact on the platform. The company agreed to pay $4.3 billion in penalties and leave the U.S. market. Zhao served four months in prison for his role before being pardoned by President Donald Trump.
Binance said in a blog post on Sunday that its “sanctions-related exposure is minimal.” Rachel Conlan, another spokesperson, told the Times, there is an ongoing internal investigation at the exchange and that a full report would be sent to the U.S. Justice Department on Feb. 25.
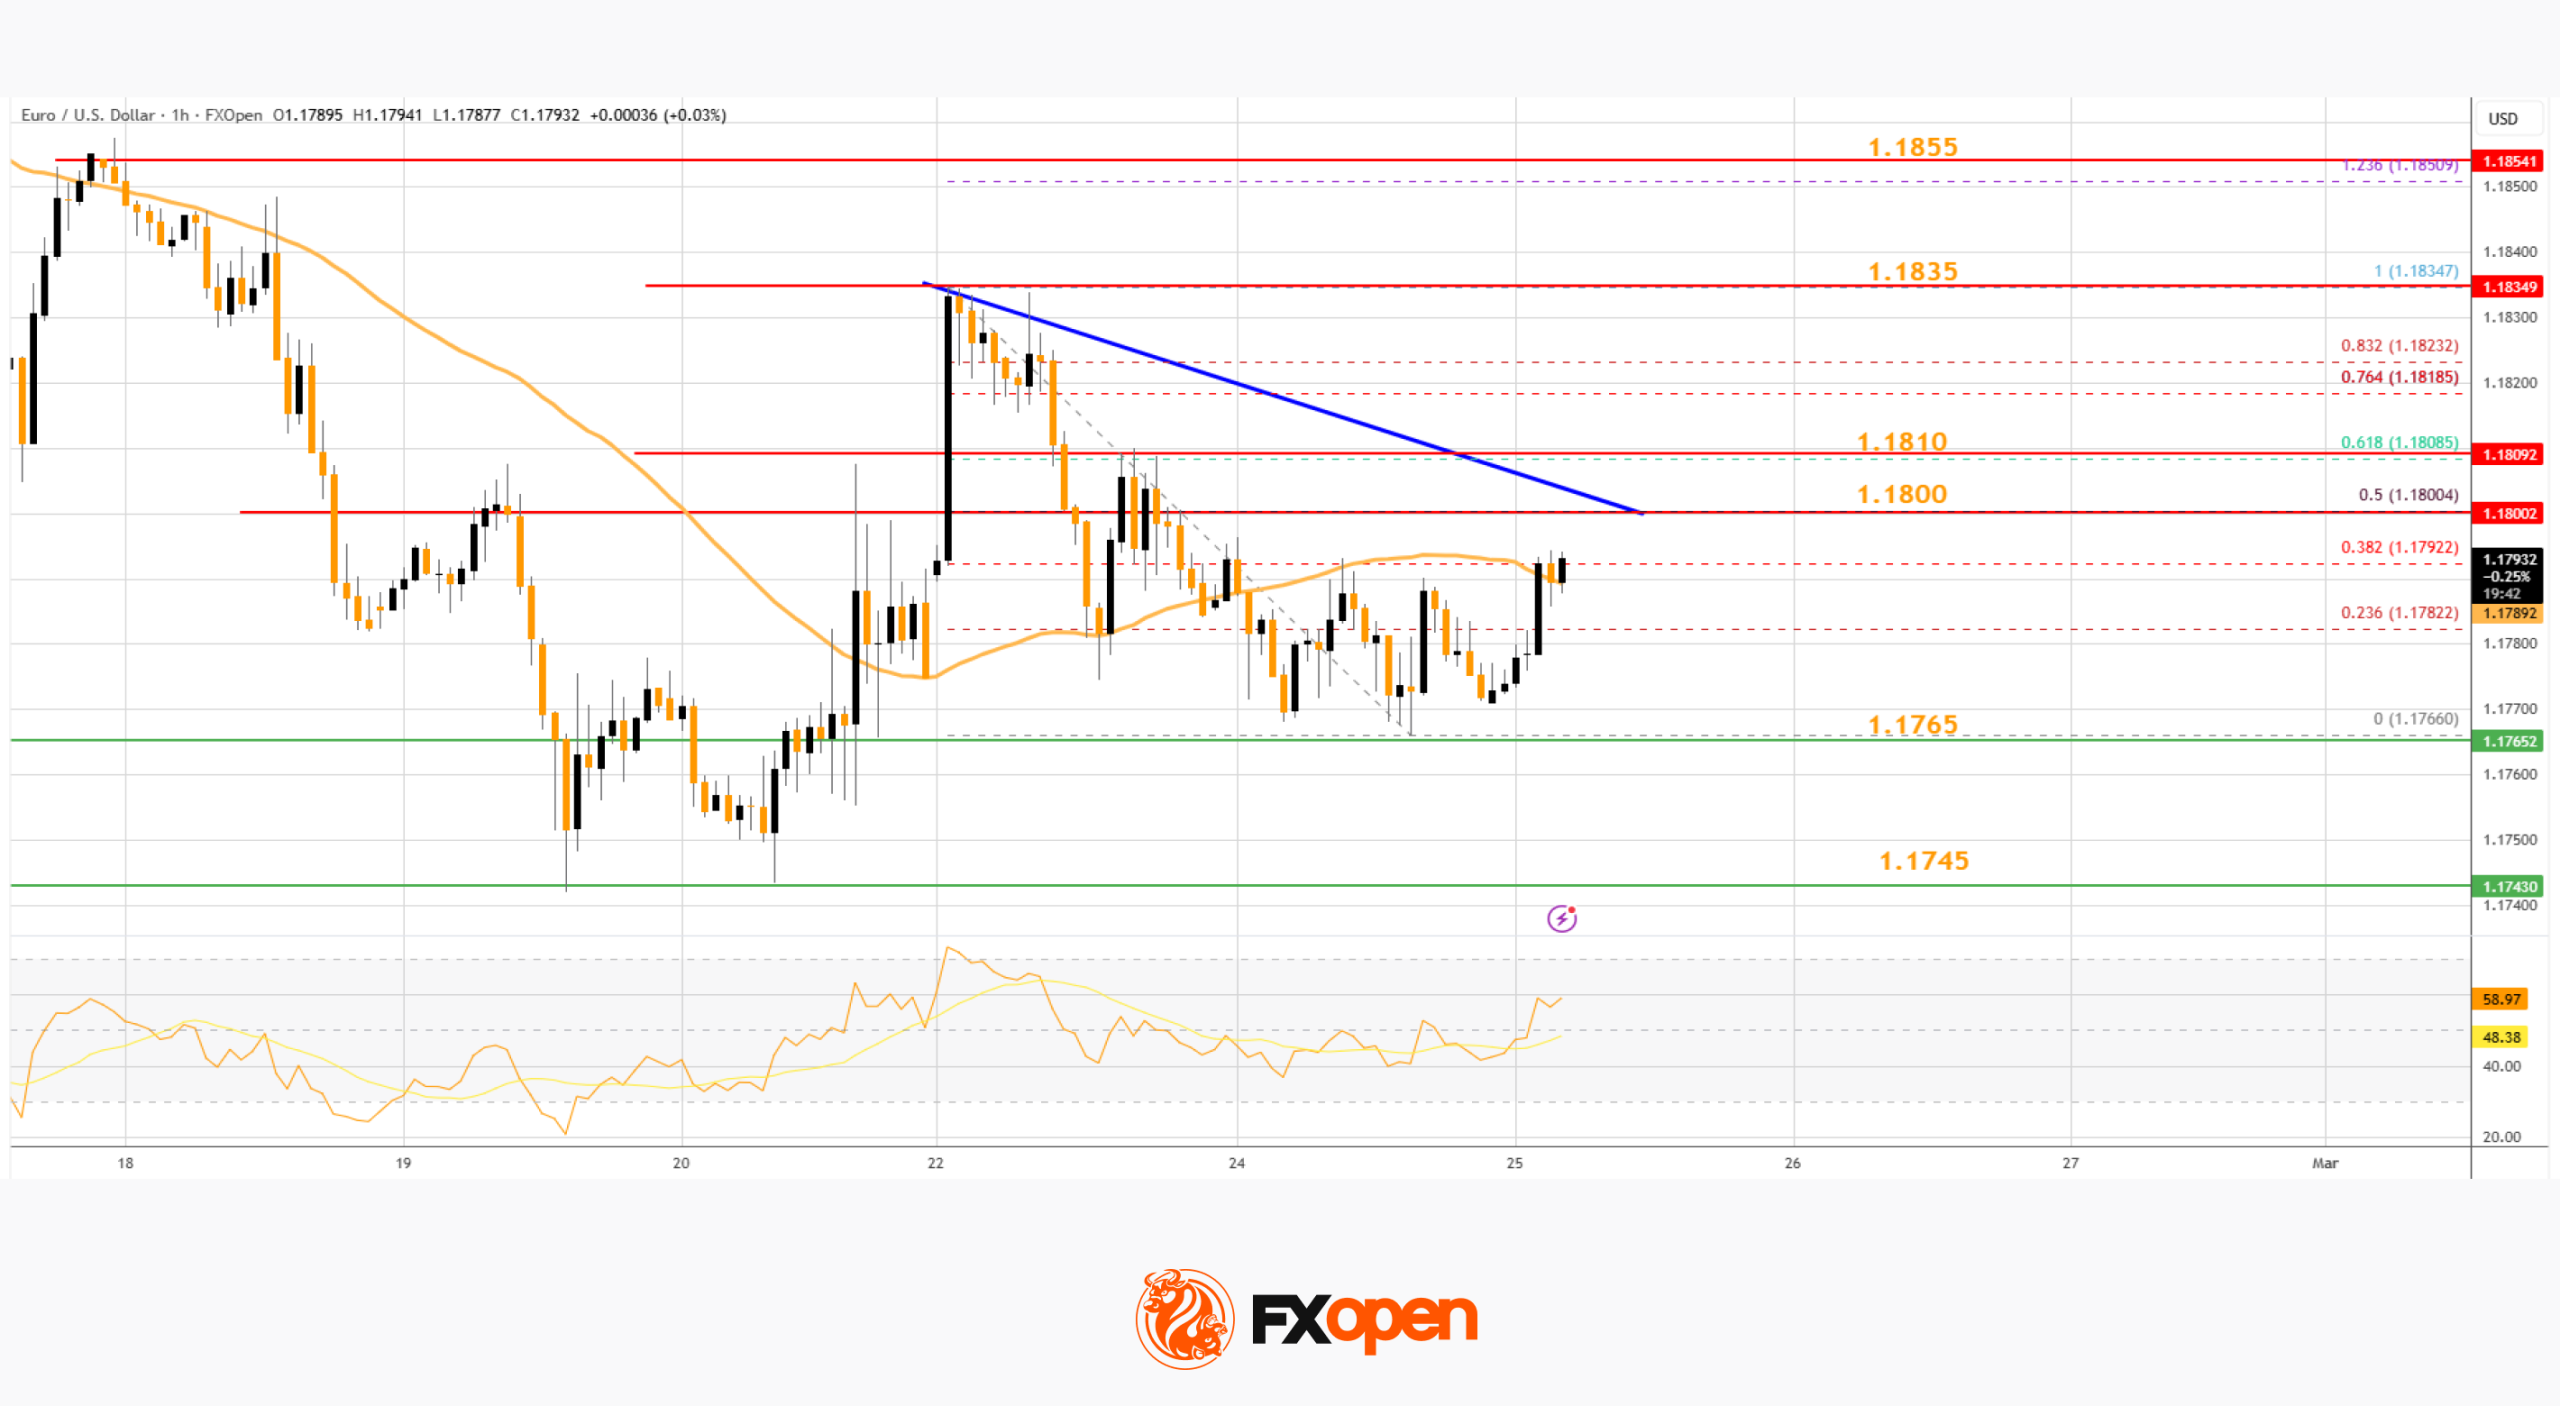
EUR/USD started a fresh increase above 1.1780. USD/CHF declined from 0.7770 and is now struggling to stay above 0.7925.
Important Takeaways for EUR/USD and USD/CHF Analysis Today
· The Euro started a decent upward move from 1.1750 against the US Dollar.
· There is a key bearish trend line forming with resistance at 1.1800 on the hourly chart of EUR/USD at FXOpen.
· USD/CHF declined below the 0.7725 and 0.7710 support levels.
· There is a major contracting triangle forming with resistance near 0.7765 on the hourly chart at FXOpen.
EUR/USD Technical Analysis
On the hourly chart of EUR/USD at FXOpen, the pair started a fresh increase from 1.1745. The Euro cleared 1.1765 to decrease bearish pressure and move into a bullish zone against the US Dollar.
The bulls pushed the pair above the 50-hour simple moving average and 1.1780. It opened the doors for a move toward the 50% Fib retracement level of the downward move from the 1.1834 swing high to the 1.1766 low.

The first key hurdle on the EUR/USD chart is near a bearish trend line at 1.1800. The next barrier for a fresh increase sits near the 61.8% Fib retracement at 1.1810. An upside break above 1.1810 might send the pair toward 1.1835.
The next major area of interest for the bears might be 1.1855. Any more gains might open the doors for a move toward 1.1880. Immediate support on the downside is near the 50-hour simple moving average and 1.1785.
A close below 1.1785 could spark more bearish moves and send the pair toward 1.1765. The next major hurdle for the bears might be 1.1745. Any more losses might send the pair into a bearish zone toward 1.1720.
USD/CHF Technical Analysis
On the hourly chart of USD/CHF at FXOpen, the pair started a fresh decline after it failed to stay above 0.7765. The US Dollar dropped below 0.7755 to move into a negative zone against the Swiss Franc.
There was a move below the 50% Fib retracement level of the upward move from the 0.7710 swing low to the 0.7768 high. The bears pushed the pair below the 50-hour simple moving average and 0.7945.
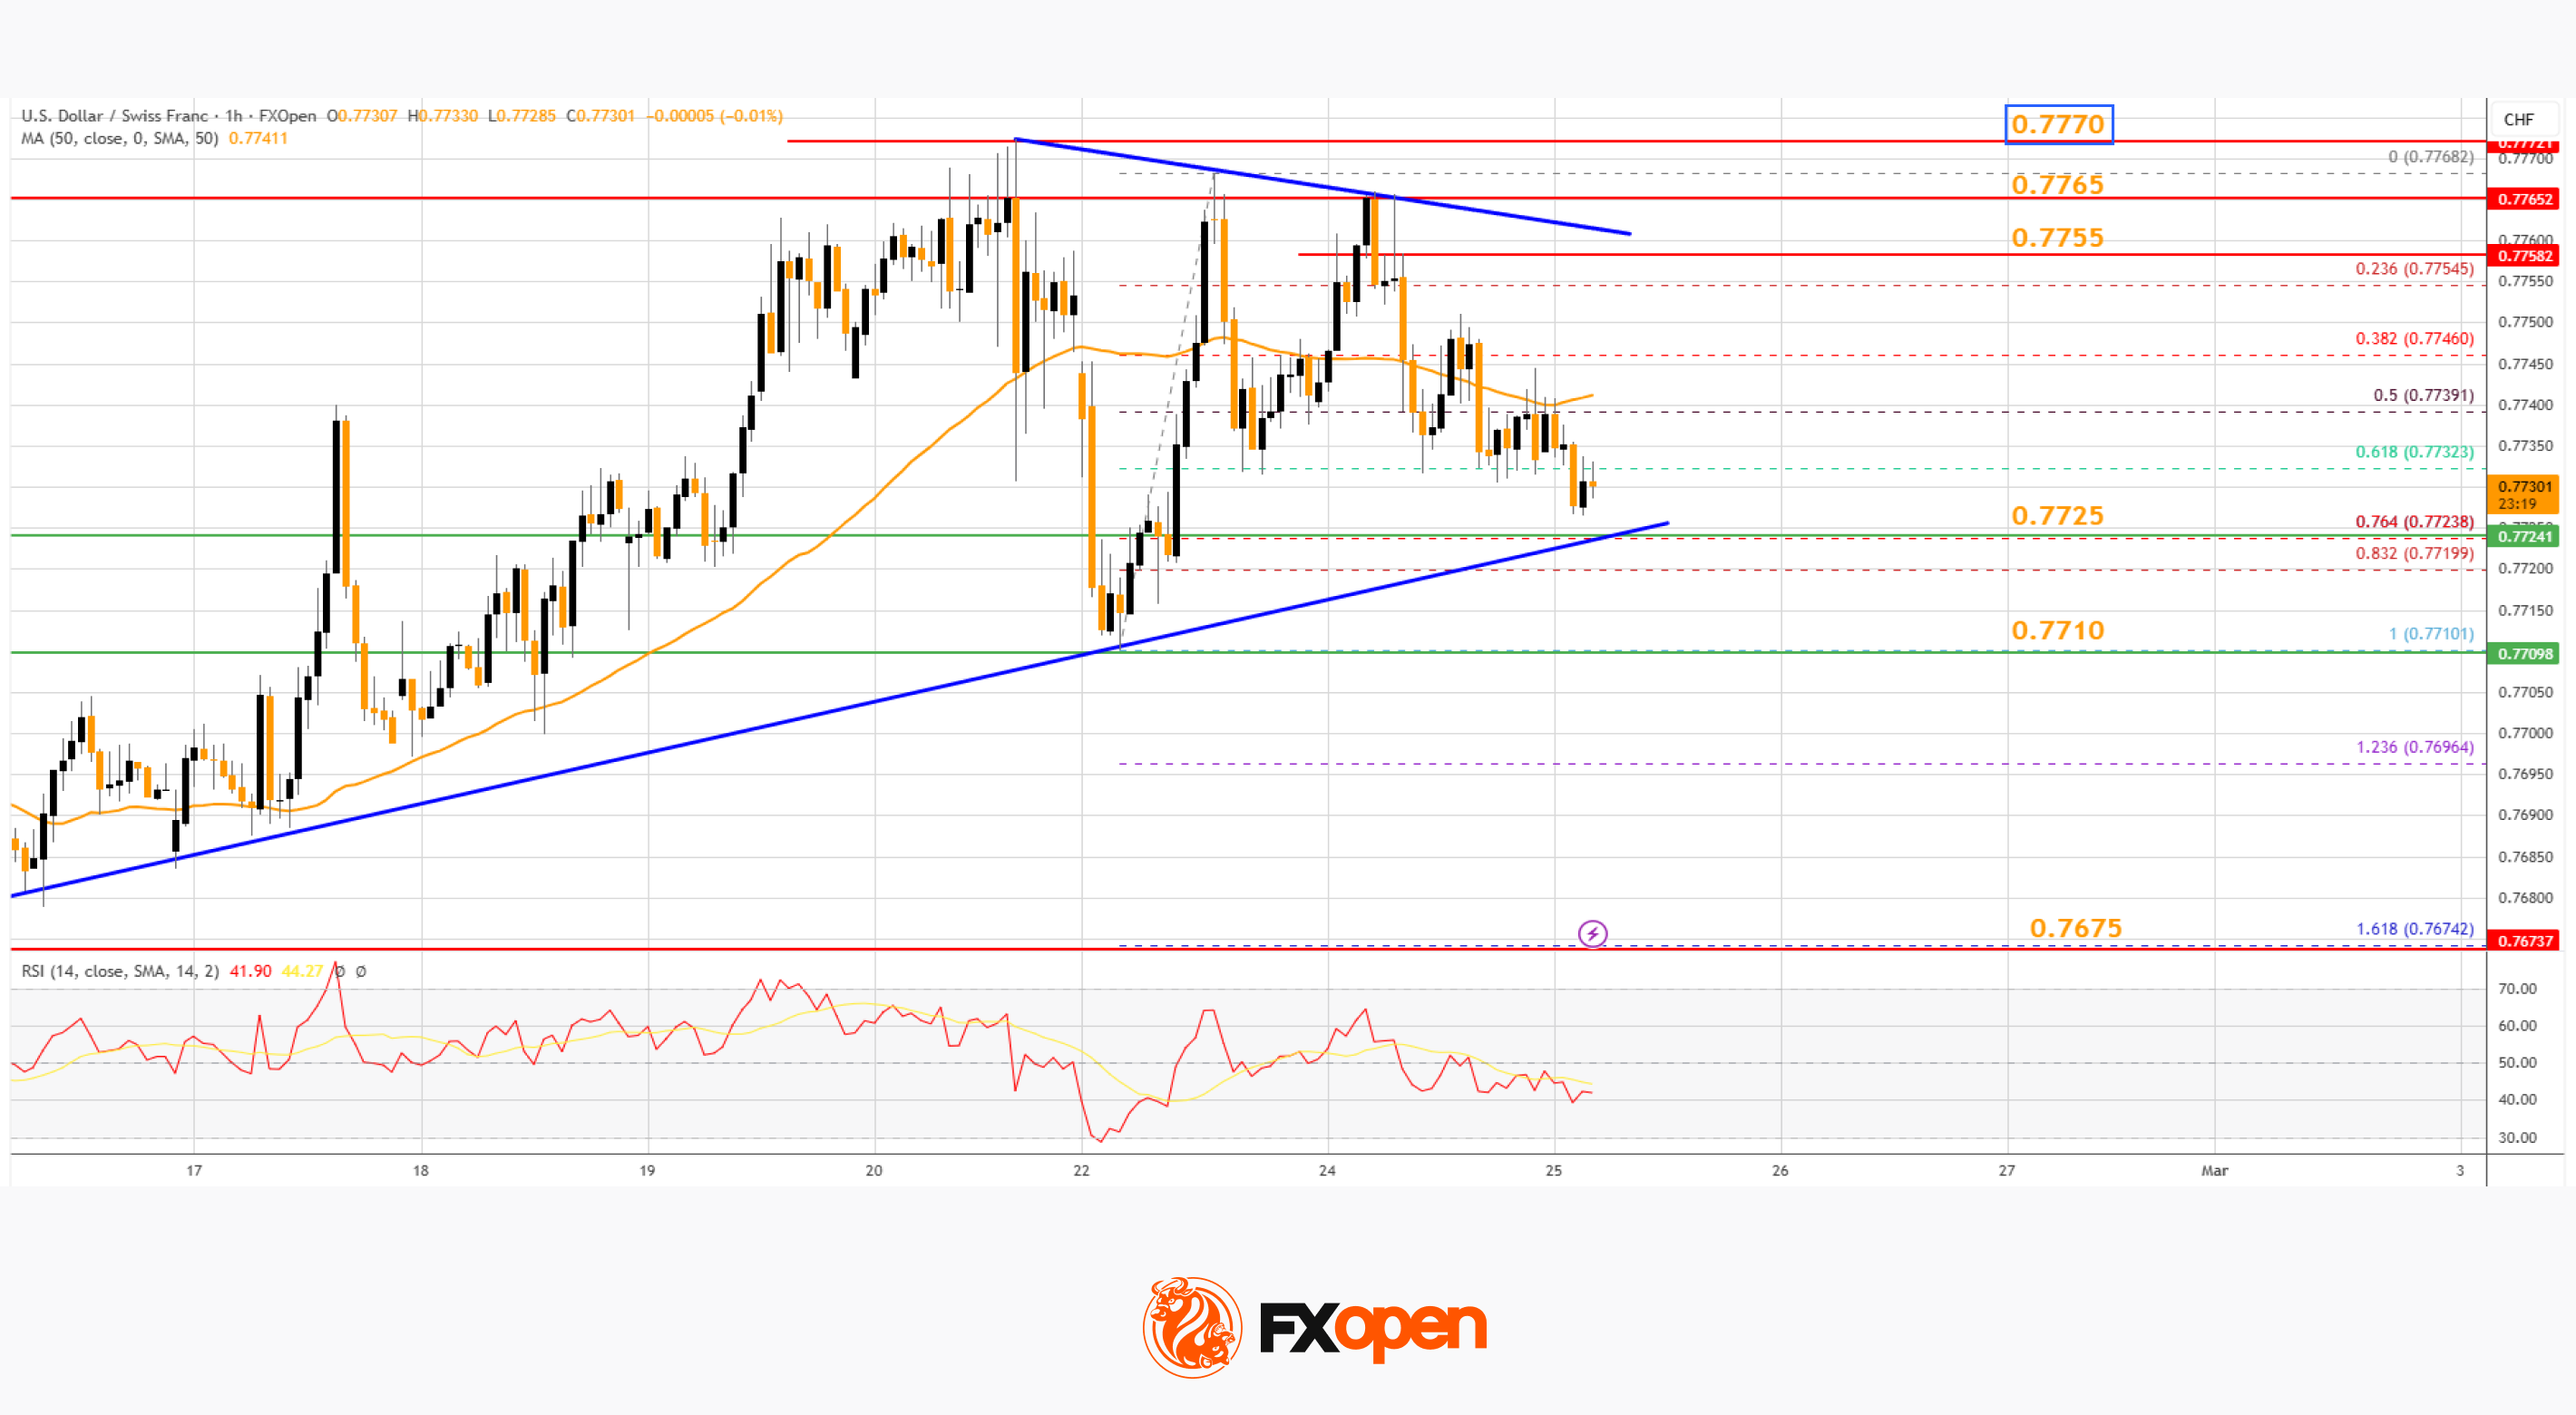
On the downside, immediate support on the USD/CHF chart is 0.7725 and the 76.4% Fib retracement. The first major area of interest could be 0.7710. Any more losses may possibly open the path for a move toward the 0.7675 level in the coming sessions.
On the upside, the pair is facing resistance near the 50-hour simple moving average at 0.7940. A clear move above 0.7740 could send the pair to 0.7755 and a major contracting triangle.
The next major barrier for the bulls might be 0.7765, above which the pair could test the 0.7770 level. If there is a clear break above 0.7770, the pair could start another increase. In the stated case, it could even surpass 0.7820.
Trade over 50 forex markets 24 hours a day with FXOpen. Take advantage of low commissions, deep liquidity, and spreads from 0.0 pips (additional fees may apply). Open your FXOpen account now or learn more about trading forex with FXOpen.
This article represents the opinion of the Companies operating under the FXOpen brand only. It is not to be construed as an offer, solicitation, or recommendation with respect to products and services provided by the Companies operating under the FXOpen brand, nor is it to be considered financial advice.

Bitcoin (CRYPTO: BTC) traded toward the $66,000 level as US equities regained ground, signaling renewed risk appetite after a softer spell for crypto markets. The move followed a broad market rally led by technology and AI names, with the Nasdaq posting modest gains and the S&P 500 edging higher. Observers said the resilience reflects a combination of regained liquidity, regulated access via spot BTC ETFs, and a return of domestic buyers. Data points include Tuesday’s net inflows of roughly $258 million into spot BTC funds and a positive swing in the Bitcoin Coinbase Premium Index, a sign that US demand is re-emerging after weeks of caution. Longer-term narratives around BTC’s role as a hedge and its place within diversified portfolios continue to persist even as near-term price moves respond to liquidity shifts.
Key takeaways
- Bitcoin climbed toward the $66,000 mark as US stock markets recovered, signaling renewed demand for BTC alongside broad market strength.
- The Bitcoin Coinbase Premium Index flipped to positive territory, aligning with notable ETF inflows into spot BTC products.
- BTC’s correlation with stocks and gold has weakened to levels not seen since 2022, though analysts expect reversion during risk-on cycles.
- Crypto-linked equities rose modestly, with Coinbase (NASDAQ: COIN) and MicroStrategy (NASDAQ: MSTR) posting gains as liquidity returned.
- On-chain and liquidity narratives point to BTC remaining a long-run inflation hedge and collateral narrative, even as near-term flows swing with risk appetite.
Tickers mentioned: $BTC, $COIN, $MSTR
Sentiment: Bullish
Price impact: Positive. The combination of BTC’s price uptick, ETF inflows and renewed US demand supports a constructive near-term bias.
Trading idea (Not Financial Advice): Hold. With market liquidity improving but macro risks still present, maintain balanced exposure and avoid aggressive positioning on a single catalyst.
Market context: The latest move ties BTC to broader market liquidity and risk sentiment, with renewed appetite for regulated access to crypto exposure through ETFs and a visible return of US buyers. The dynamic comes as traders reassess macro risk, liquidity conditions and the evolving landscape for crypto products in traditional financial channels.
Why it matters
The recent price action underscores a maturation in the crypto market’s relationship with traditional asset classes. After a period of decoupling or weaker cross-asset correlations, BTC has shown episodes of co-movement with equities when liquidity and risk appetite rise, while still maintaining a distinct narrative as a potential inflation hedge and a form of collateral. The inflows into spot BTC ETFs and the renewed US demand flagged by the Coinbase Premium Index together suggest that investors are seeking regulated, transparent routes to gain exposure to Bitcoin’s upside while managing counterparty risk.
Analysts framing the longer-term picture argue that the current dislocation between stocks, gold and BTC could revert to historical patterns during moments of liquidity expansion. Santiment recently highlighted that when BTC diverges significantly from stocks and gold, the longer-term bias tends to tilt toward upside for Bitcoin and altcoins once liquidity returns. While such reversion is not guaranteed, the historical tendency is to see BTC catch up with equities during growth phases, a view echoed by market observers who see liquidity as the primary driver of BTC’s near-term trajectory.
Additionally, industry voices emphasize that the present dynamics are less about Bitcoin’s price alone and more about market structure and availability of capital for crypto exposure. Darius Sit, founder and CIO of QCP Capital, has argued that the BTC-versus-gold narrative can obscure the true driver: liquidity. He notes that Bitcoin’s longer-term narrative as a hedge persists even as near-term price action can be influenced by hedging costs, leverage unwinds and shifts in risk tolerance. In this light, BTC’s resilience and the appetite for regulated access could reinforce its status as a mature asset class for institutional and strategic investors alike.
For investors tracking adoption, the trend remains one of broad institutional participation. Bitcoin’s maturation—spurred by greater adoption among financial institutions, banks, merchants and even some public-sector actors—continues to support a structural case for BTC beyond speculative trading. Cointelegraph has documented how adoption expanded in 2025, reinforcing the narrative of Bitcoin as a credible, long-term asset rather than a purely cyclical play. This backdrop helps explain why even as prices fluctuate, structural demand remains a persistent force behind BTC’s trajectory.
The near-term implications hinge on continued liquidity and the durability of US demand. If ETF inflows persist and the Coinbase Premium Index sustains its positive tilt, BTC could consolidate above key levels and test new resistance zones as market participants reassess risk. Conversely, any rolling back of liquidity or a shift back toward risk-off posture could curtail the immediate upside. Still, the framework described by market observers points to a scenario where BTC’s trajectory is increasingly tethered to market-wide liquidity dynamics rather than isolated crypto-specific catalysts.
“Historically, when an asset that is usually correlated breaks away in this dramatic fashion, it typically does not stay disconnected forever. In the long term, this unusual separation actually argues for significant upside for Bitcoin and altcoins.”
The ongoing discussion around BTC’s price discovery and its role within asset allocations remains central for traders and institutions alike. As adoption accelerates and regulated access grows, the market is likely to price in both the structural case for Bitcoin as a reserve-like asset and the cyclical demand tied to macro liquidity conditions. In this environment, a decisive shift in risk appetite or regulatory clarity could tilt BTC back toward a more pronounced correlation with risk-on cycles, potentially delivering meaningful upside if fundamentals align with liquidity conditions.
What to watch next
- Continued ETF inflows into spot BTC products—monitor next week’s data for signs of sustained demand.
- BTC trading near the $66k level and testing for persistence above the level as liquidity conditions evolve.
- Updates to the Bitcoin Coinbase Premium Index and other on-chain indicators for signs of durable US buying interest.
- Liquidity dynamics and leverage flows in risk assets that could influence BTC’s near-term trajectory.
- Regulatory or product-launch developments that could improve or constrain access to BTC exposure via regulated vehicles.
Sources & verification
- ETF inflows: Spot Bitcoin ETFs drew about $258 million in net inflows on Tuesday. (Source material references a Cointelegraph report on ETFs.)
- Coinbase Premium Index: Data showing the index turning positive, indicating renewed US demand. (Source: CoinGlass data referenced in the original article.)
- Correlation and on-chain analysis: Santiment’s notes on BTC’s correlation with stocks and gold. (Source: Santiment’s posts cited in the article.)
- Liquidity and market structure comments: Darius Sit of QCP Capital discussing liquidity as a primary driver for BTC movement. (Source: QCP Capital insights.)
- Adoption narrative: BTC adoption growth among institutions and broad market participants. (Source: Cointelegraph’s reporting on Bitcoin adoption.)
Bitcoin price action and institutional demand: toward 66k, ETF inflows revive risk appetite
Bitcoin (CRYPTO: BTC) moved back toward the $66,000 threshold as a renewed bid for risk assets underpinned the move, aligning BTC with the day’s broader market strength in U.S. equities. The rally followed a period of softness earlier in the week and came as investors rotated into higher-yielding assets and defensive hedges alike, suggesting a cautious but constructive stance among market participants. The move above $66k is notable given the backdrop of mixed macro signals and ongoing debates about liquidity, making BTC a focal point for traders watching how crypto assets interact with traditional markets.
Institutional demand appeared to re-emerge, with spot BTC exchange-traded products and related vehicles drawing renewed attention. Reports indicated around $258 million in net inflows flowed into spot BTC ETFs on Tuesday, signaling that regulated pathways for price exposure are gaining traction again as investors seek transparent access to Bitcoin’s upside potential. The inflows also support a broader comeback in regulated crypto products that had faced headwinds in the prior quarters.
Meanwhile, the Coinbase Premium Index, a gauge of price gaps between major exchanges, shifted into positive territory for the first time since Jan. 15, implying that buyers in the United States were returning to the market. Market observers cautioned that the premium’s durability matters; a sustained positive reading would indicate ongoing demand, whereas a quick reversal could signal exhaustion and prompt a retreat. The index’s turn to positive aligns with the broader risk-on posture and with spot-btc inflows, but it does not guarantee a sustained rally on its own.
In equities, tech-focused names continued to lead, with the Nasdaq rising around 1% on the day and the S&P 500 gaining roughly 0.7%. The general market bid helped ease risk-off pressure on crypto, enabling BTC to recover some of the losses incurred during prior sessions. Crypto-related equities also benefited, with Coinbase (NASDAQ: COIN) edging higher and MicroStrategy (NASDAQ: MSTR) posting modest gains as investors recalibrated exposure to the broader technology and financial services ecosystem. The cross-asset bid reinforced the view that liquidity and risk appetite largely drive BTC’s near-term trajectory rather than a pure crypto-specific dynamic.
From a broader perspective, BTC’s recent decoupling from the stock and gold markets has drawn attention from researchers and traders. Data from on-chain analytics provider Santiment shows the daily correlation between BTC and the S&P 500 slipping toward its weakest levels since the FTX era’s upheavals, while correlation with gold has also cooled. The firm’s analysts observed that when such a dramatic separation occurs, the longer-term bias tends to tilt toward upside for Bitcoin and altcoins once liquidity returns. In practical terms, this could mean more upside for BTC if liquidity conditions permit, even if macro headwinds persist in the near term. Cointelegraph has documented Bitcoin adoption as a booming trend, reinforcing the narrative of a maturing asset class with broader institutional resonance.
The ongoing discussion around BTC’s price discovery and its role within asset allocations remains central for traders and institutions alike. As adoption accelerates and regulated access grows, the market is likely to price in both the structural case for Bitcoin as a reserve-like asset and the cyclical demand tied to macro liquidity conditions. In this environment, a decisive shift in risk appetite or regulatory clarity could tilt BTC back toward a more pronounced correlation with risk-on cycles, potentially delivering meaningful upside if fundamentals align with liquidity conditions.
Yesterday, it was reported that Advanced Micro Devices (AMD) has expanded its collaboration with Meta Platforms. The companies struck an agreement under which:
→ Meta will purchase AMD equipment with a total capacity of 6 gigawatts for its AI infrastructure. Deliveries are scheduled to begin in the second half of 2026.
→ AMD’s portfolio could include around 160 million META shares, representing roughly 10% of the company.
The market interpreted the news as a signal that AMD is successfully establishing itself as the second major chip supplier to tech giants, challenging Nvidia’s monopoly (incidentally, the market leader is due to release its quarterly report today).
Following yesterday’s trading, AMD shares jumped more than 8%, closing near the highs on rising volume—a bullish sign. This partially offset the decline seen after the early-February earnings report, which was influenced by falling margins, supply chain issues, concerns over deliveries to China, and other factors.

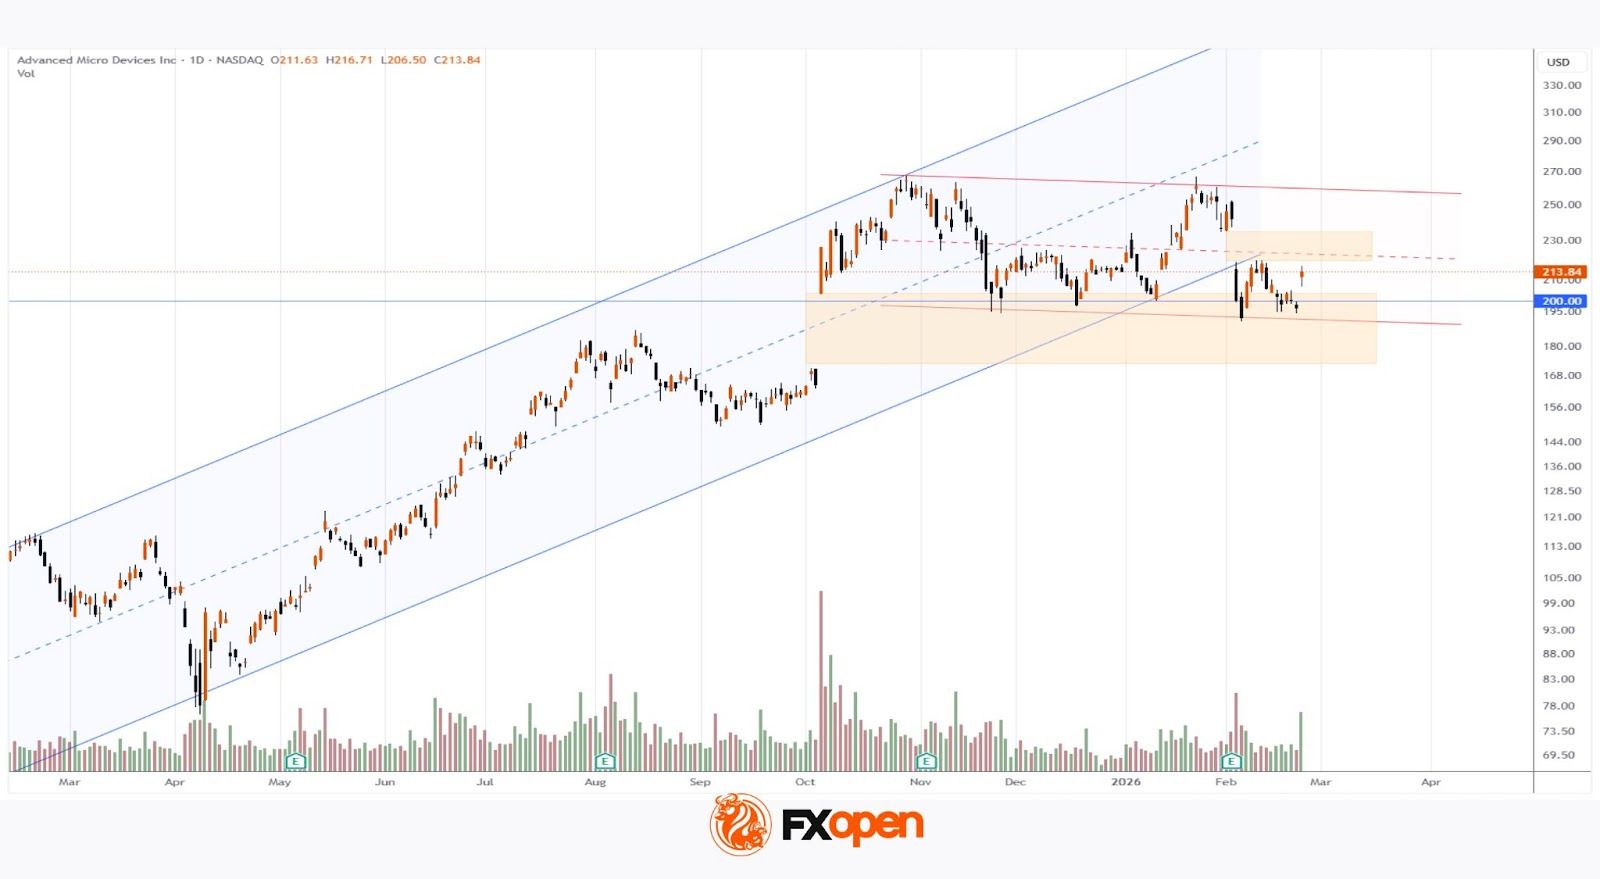
Technical Analysis of AMD Shares
Analysis of AMD’s chart indicates that the ascending channel (shown in blue), which guided price growth throughout 2025, is losing relevance.
Currently, AMD’s shares are trapped between two gaps:
→ Support is provided by the bullish gap from 6 October, which includes the psychological $200 level, offering additional support for buyers.
→ Resistance comes from the bearish gap of 4 February, which aligns with the median of the descending channel (shown in red).
It is reasonable to suggest that yesterday’s positive news offset the earlier negative sentiment, and in the short term, AMD shares may stabilise between the areas of the identified gaps.
Buy and sell stocks of the world’s biggest publicly-listed companies with CFDs on FXOpen’s trading platform. Open your FXOpen account now or learn more about trading share CFDs with FXOpen.
This article represents the opinion of the Companies operating under the FXOpen brand only. It is not to be construed as an offer, solicitation, or recommendation with respect to products and services provided by the Companies operating under the FXOpen brand, nor is it to be considered financial advice.

Ethereum price is facing a period of increased scrutiny as on-chain data reveals significant selling pressure originating from its co-founder, Vitalik Buterin.
Summary
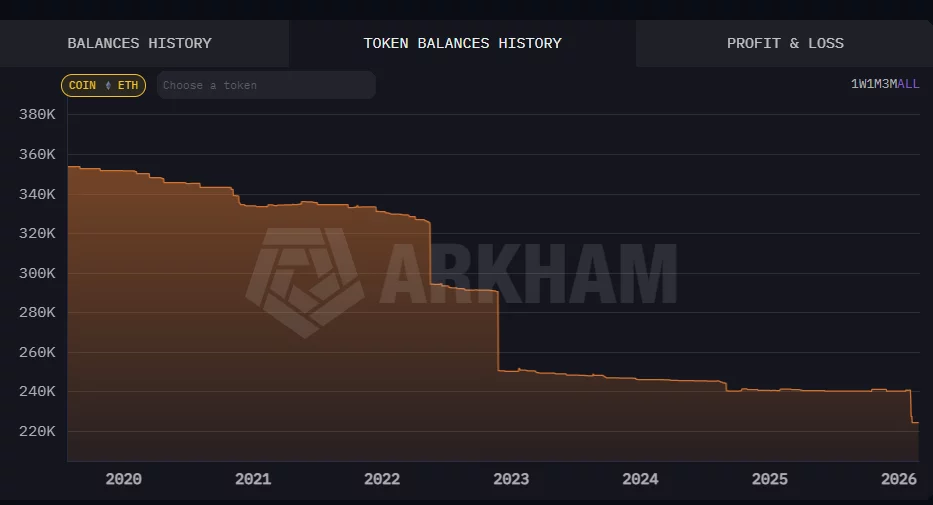
- On-chain data from Arkham Intelligence reveals that Vitalik Buterin’s associated wallets saw a steady decline from 241,000 ETH to 224,000 ETH in February.
- The sales were executed through the CoW Protocol using small, staggered swaps to minimize market impact.
- Ethereum is currently battling to maintain the $1,900 level; while the RSI suggests it is in oversold territory, the price remains firmly below its 50-day SMA ($2,538), with major support now sitting at $1,800.
According to data from Arkham Intelligence, wallets associated with Buterin have been remarkably active throughout February, offloading approximately 17,000 ETH. These transactions have sparked concerns regarding market sentiment among long-term holders.
Vitalik Buterin’s wallets saw their holdings decrease from approximately 241,000 ETH at the start of February to 224,000 ETH following a consistent series of monthly outflows.
The sheer volume of 17,000 ETH entering the liquid market has created a psychological headwind for traders.
While Buterin has historically sold portions of his holdings for charitable donations or to support ecosystem development, the timing of these sales, occurring amidst a broader market consolidation, has intensified the focus on Ethereum’s short-term price stability.
Ethereum price analysis: Bulls fight to hold $1,900
Looking at the daily ETH/USDT chart, Ethereum (ETH) is currently navigating a precarious recovery phase. After a sharp decline from the $3,400 level earlier in the year, the price found temporary footing near the $1,800 psychological support zone.
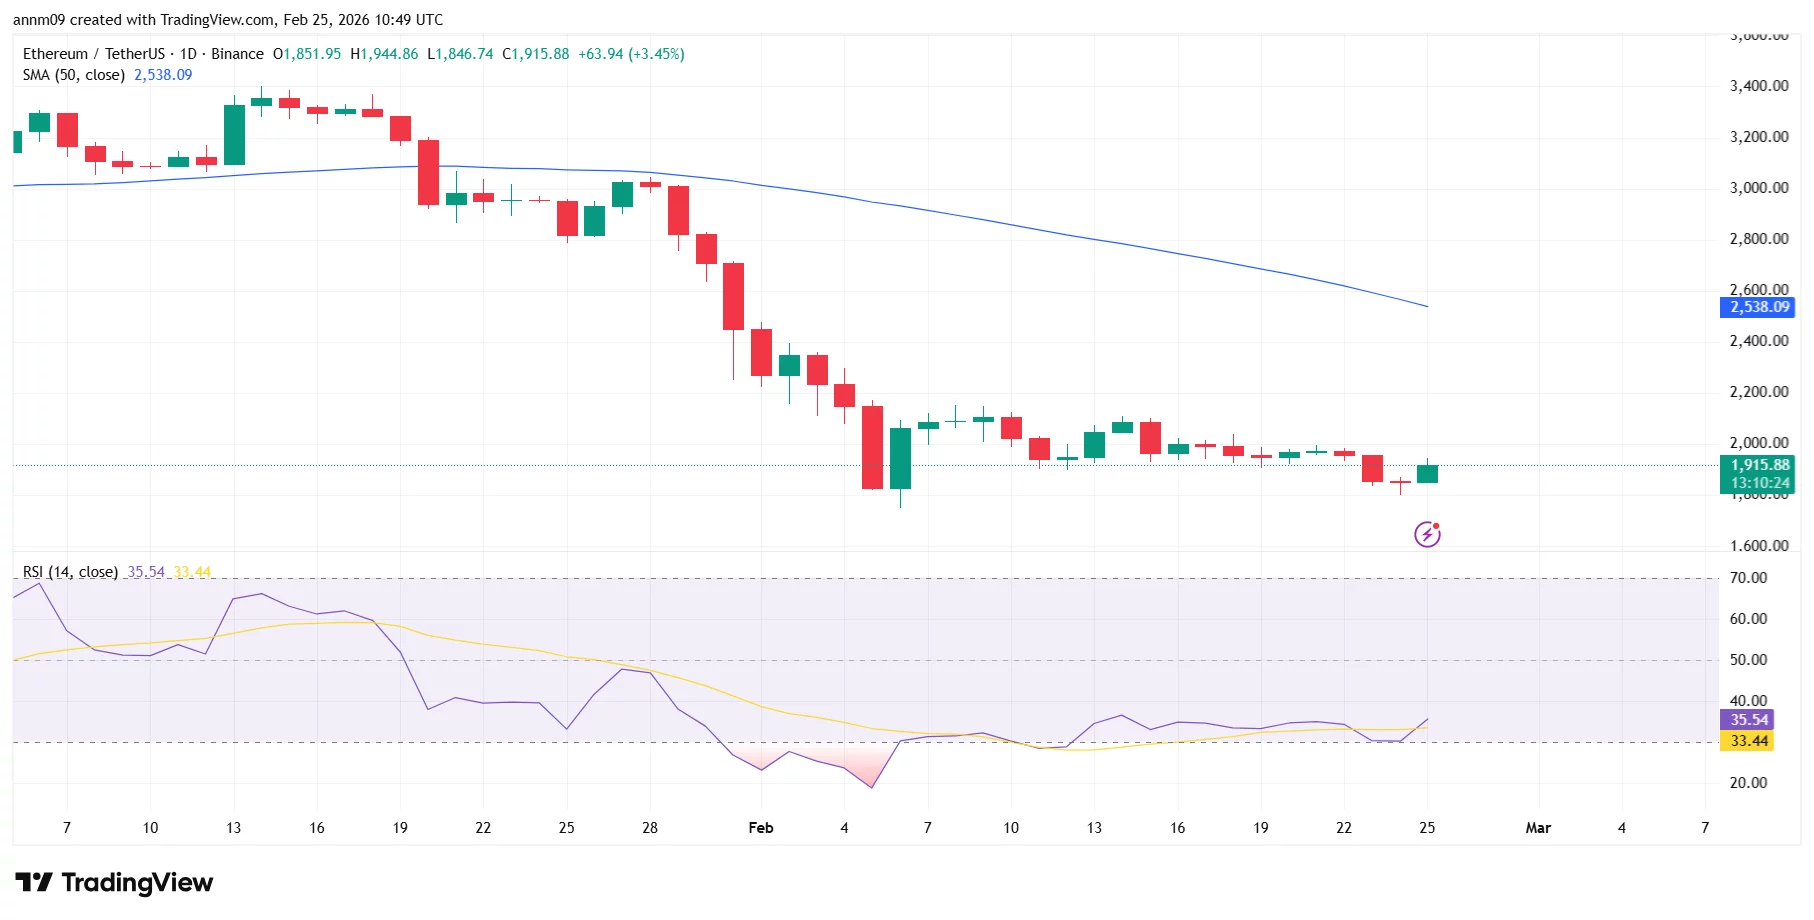
As of February 25, ETH is trading at approximately $1,915, marking a modest 3.45% intraday gain.
The price action remains dominated by a bearish trend, as evidenced by the 50-day Simple Moving Average (SMA), which sits far above the current price at $2,538. This indicates that the medium-term momentum is firmly in the hands of the bears.
Immediate resistance is located at the $2,000–$2,100 cluster, where the price previously stalled. A breakout above this level is required to shift the narrative toward a recovery.
Conversely, the RSI offers a glimmer of hope. Currently at 35.54, the RSI is recovering from “oversold” conditions. The bullish divergence forming on the RSI suggests that the downward momentum is exhausting, potentially leading to a relief rally.
If $1,850 fails to hold as support, the next major downside target lies at the $1,700 horizontal support. For now, Ethereum remains in a “wait-and-see” zone, caught between Buterin’s sell-side pressure and technical oversold signals.
Ethereum price is up about 3.4% in the past 24 hours, continuing a rebound signal that first appeared on technical charts yesterday.
But this recovery may be more than a simple bounce. A deeper look shows a quiet positioning shift that many traders might have missed. Ethereum whales have been aggressively accumulating during the recent crash, even as leverage collapsed and fear dominated the market.
Ethereum Whales Added 9 Million ETH Even as Price Crashed and Leverage Collapsed
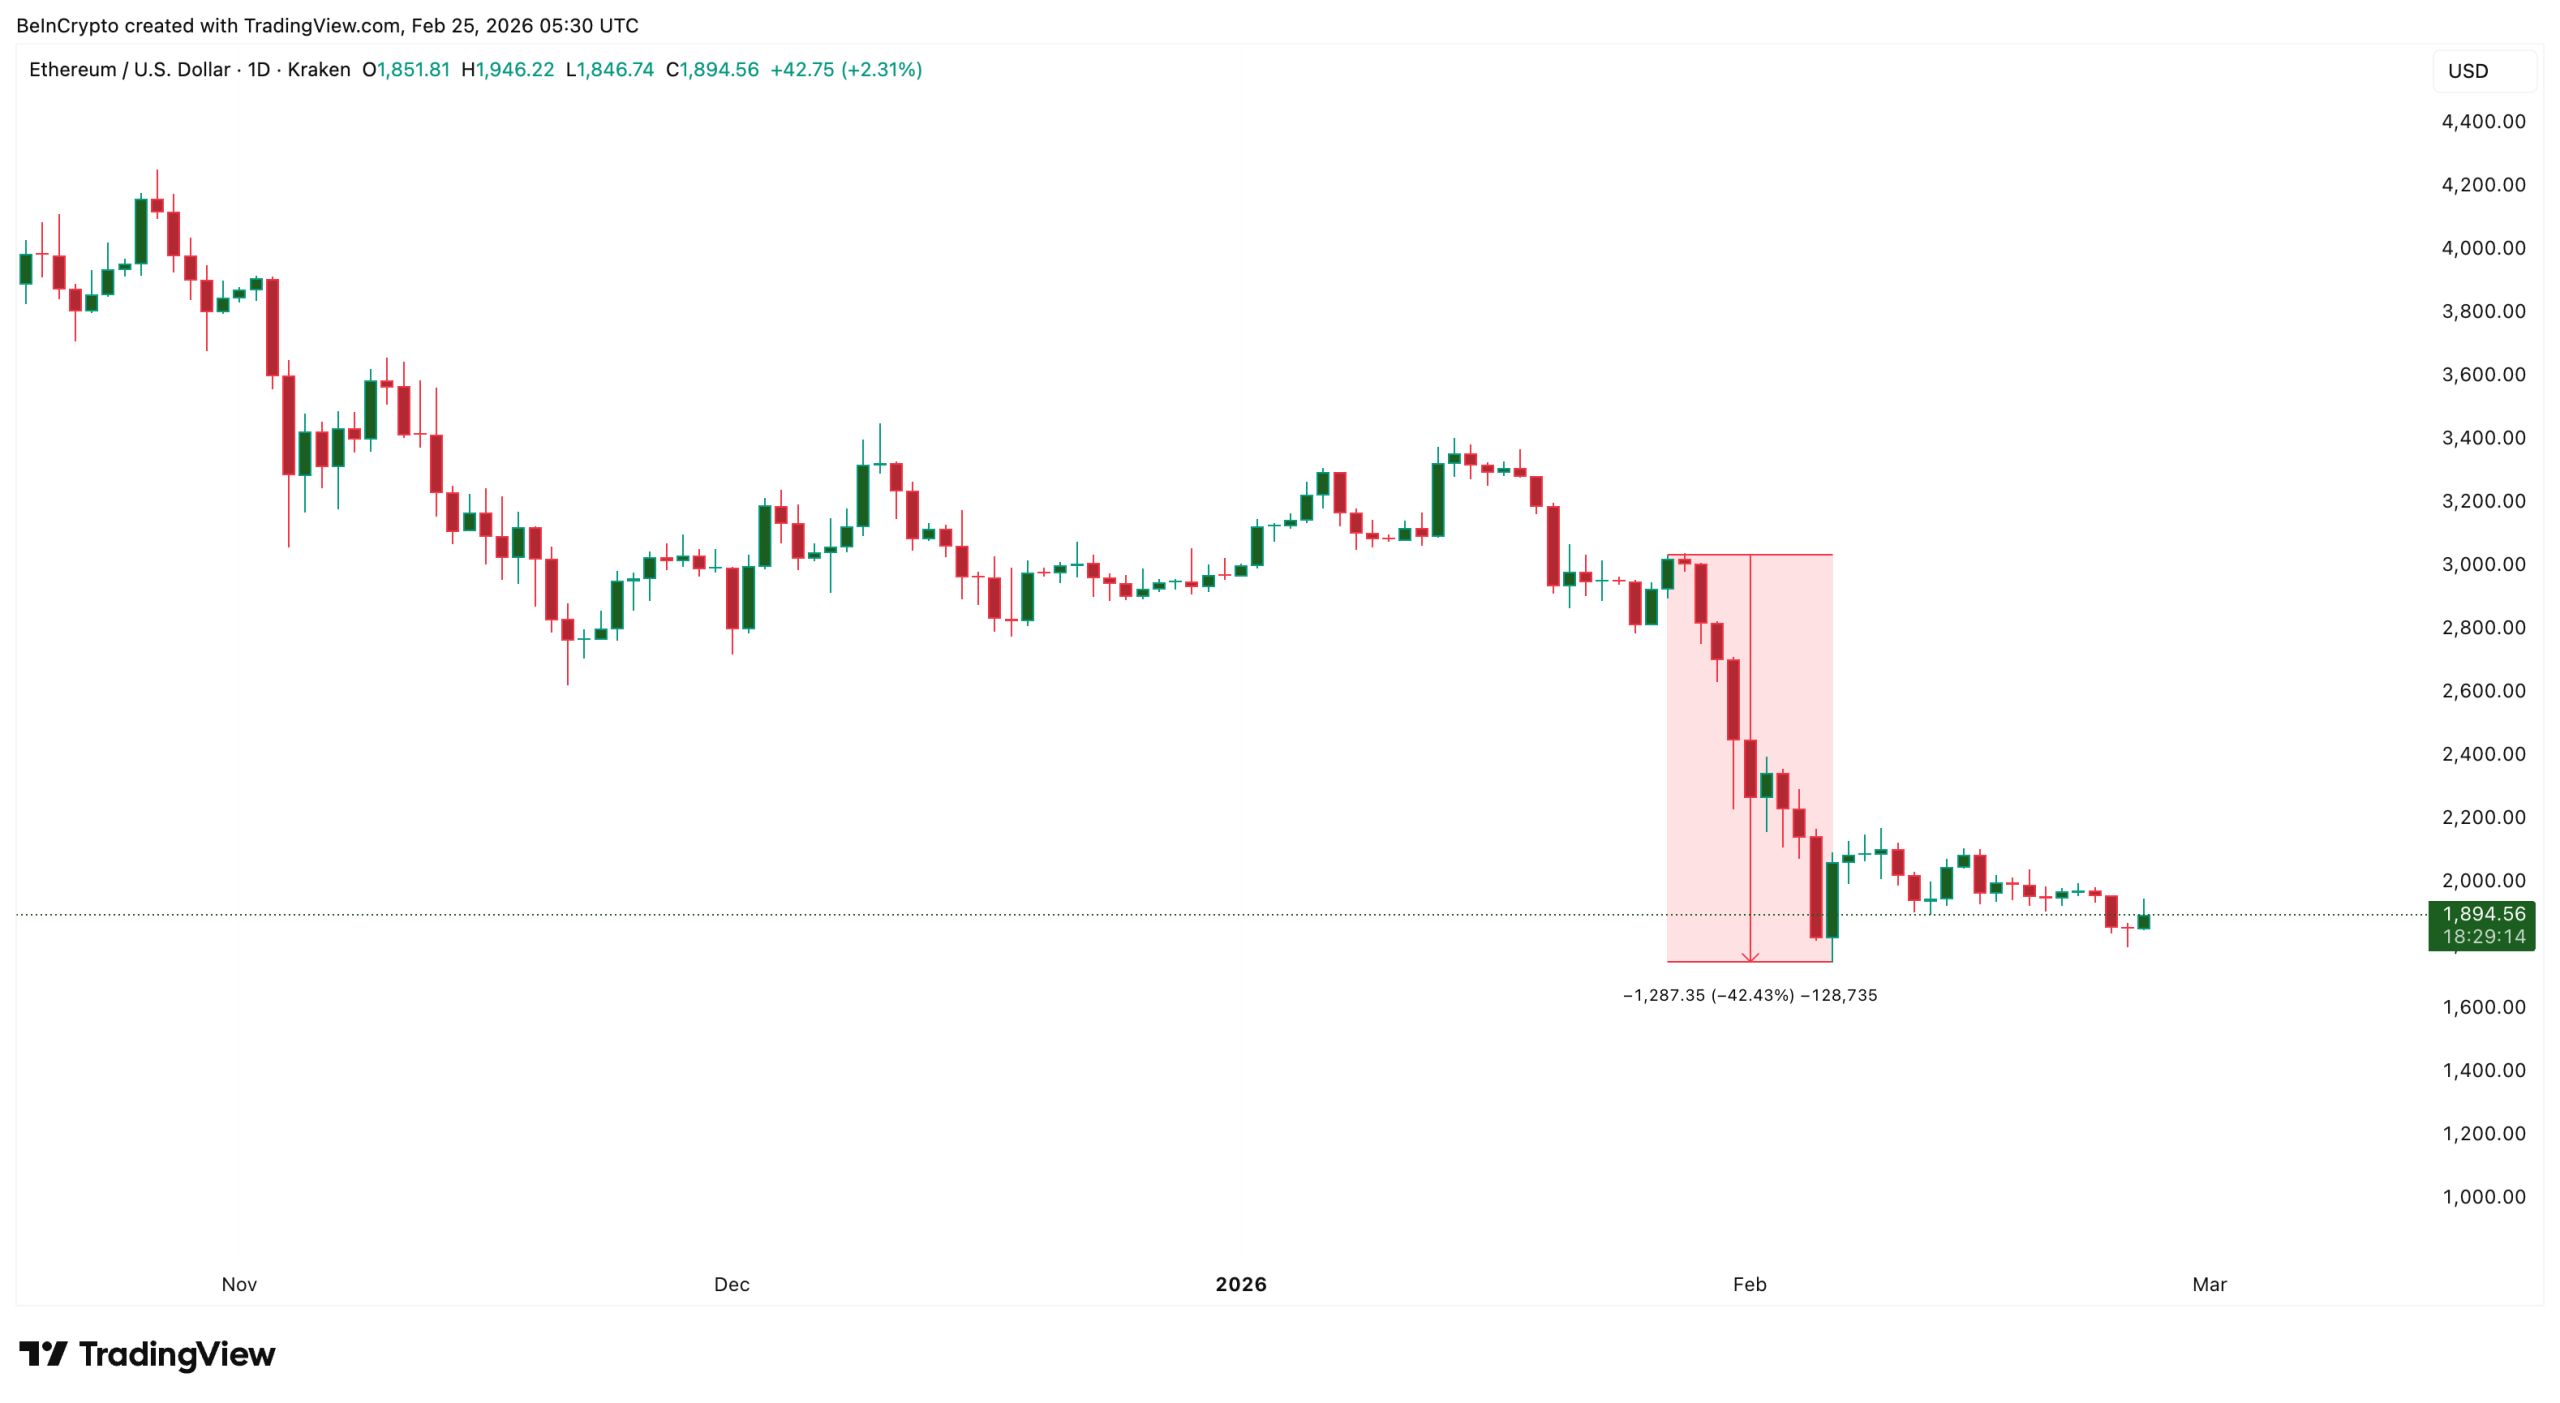
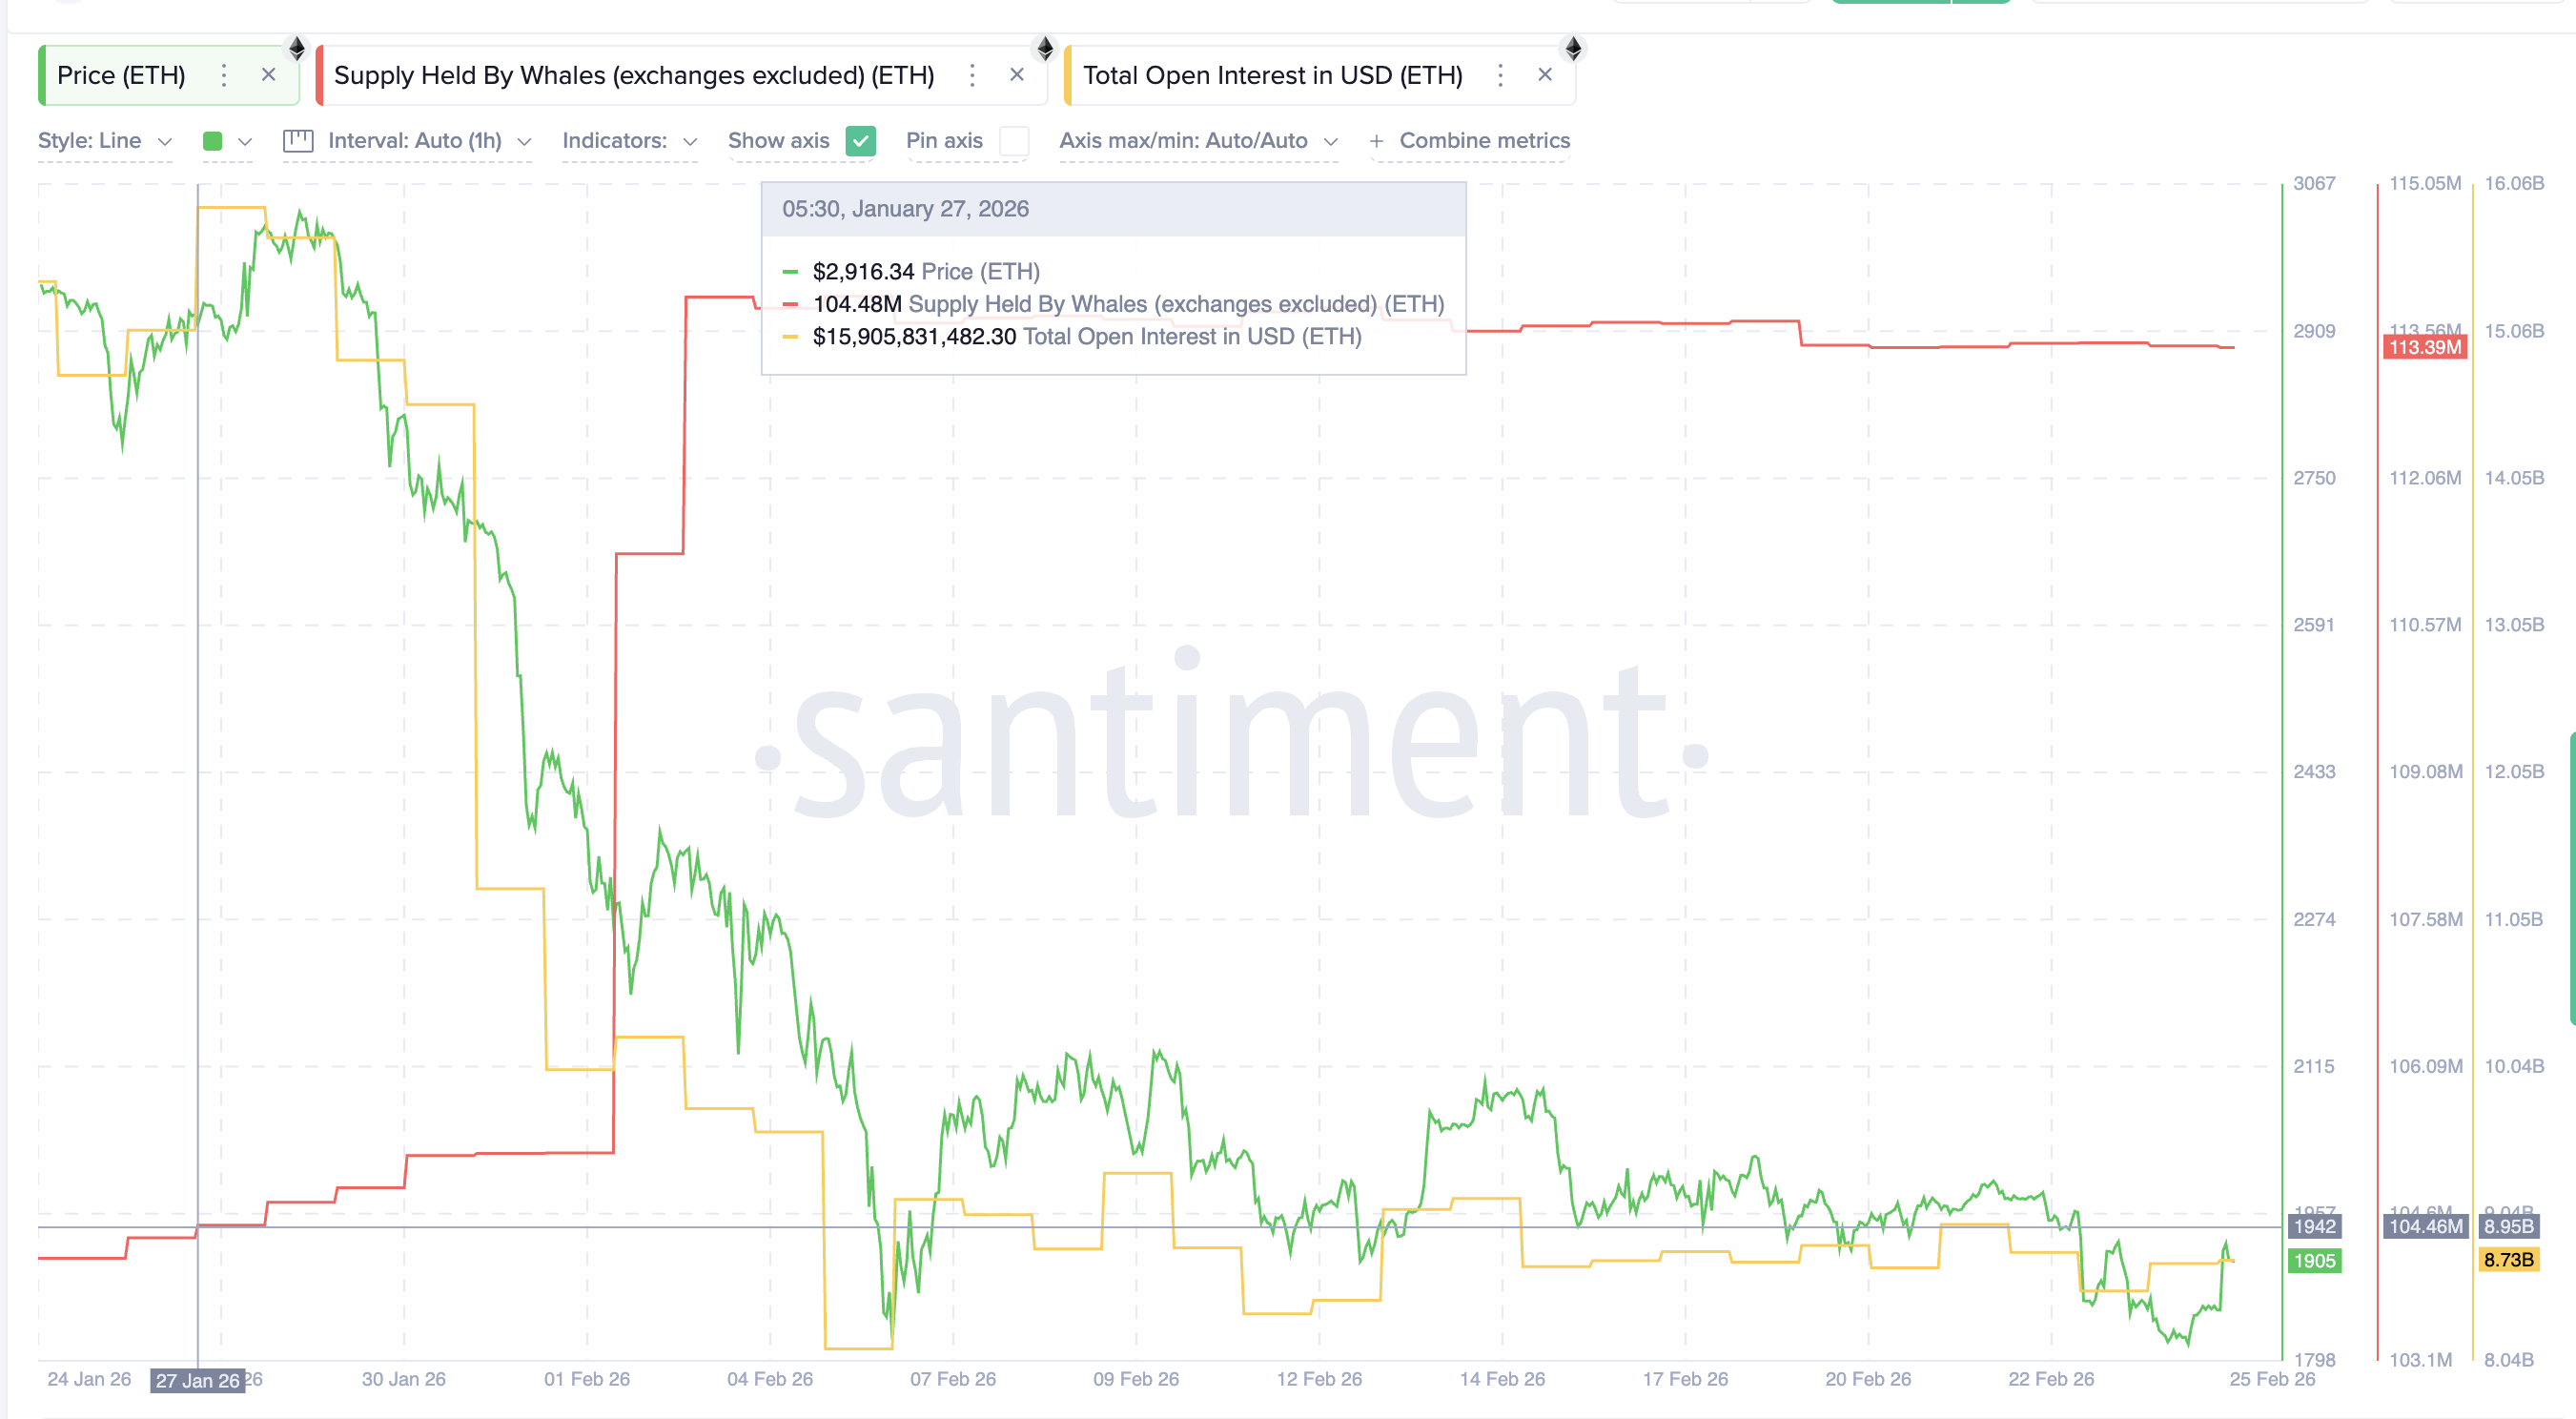
Ethereum’s recent crash wiped out both price and leverage. Between January 27 and February 6, the Ethereum price fell about 43%. During the same period, total open interest fell from $15.9 billion and is currently holding around $8.73 billion. Open interest measures total leveraged futures positions, so this $7.17 billion drop confirms a massive leverage flush.

Want more token insights like this? Sign up for Editor Harsh Notariya’s Daily Crypto Newsletter here.
A leverage flush happens when leveraged traders are forced out of positions, usually during sharp price drops. This removes speculative pressure from the market.
But while traders were force exiting, whales were doing the opposite.
Large Ethereum holders increased their holdings from 104.48 million ETH on January 27 to 113.39 million ETH now, barring a few smaller dumps in between. This means whales net added 8.91 million ETH during the crash. At an estimated average price near $2,100 during this period, that equals roughly $18.7 billion worth of accumulation.
This shows whales were not panic-selling. Instead, they were absorbing supply during forced liquidations. This type of behavior usually signals long-term positioning rather than short-term trading.
Long-Term Holders and Exchange Flows Now Align With Whale Accumulation
Whales alone do not confirm a structural shift. Long-term ETH holders must also show conviction.
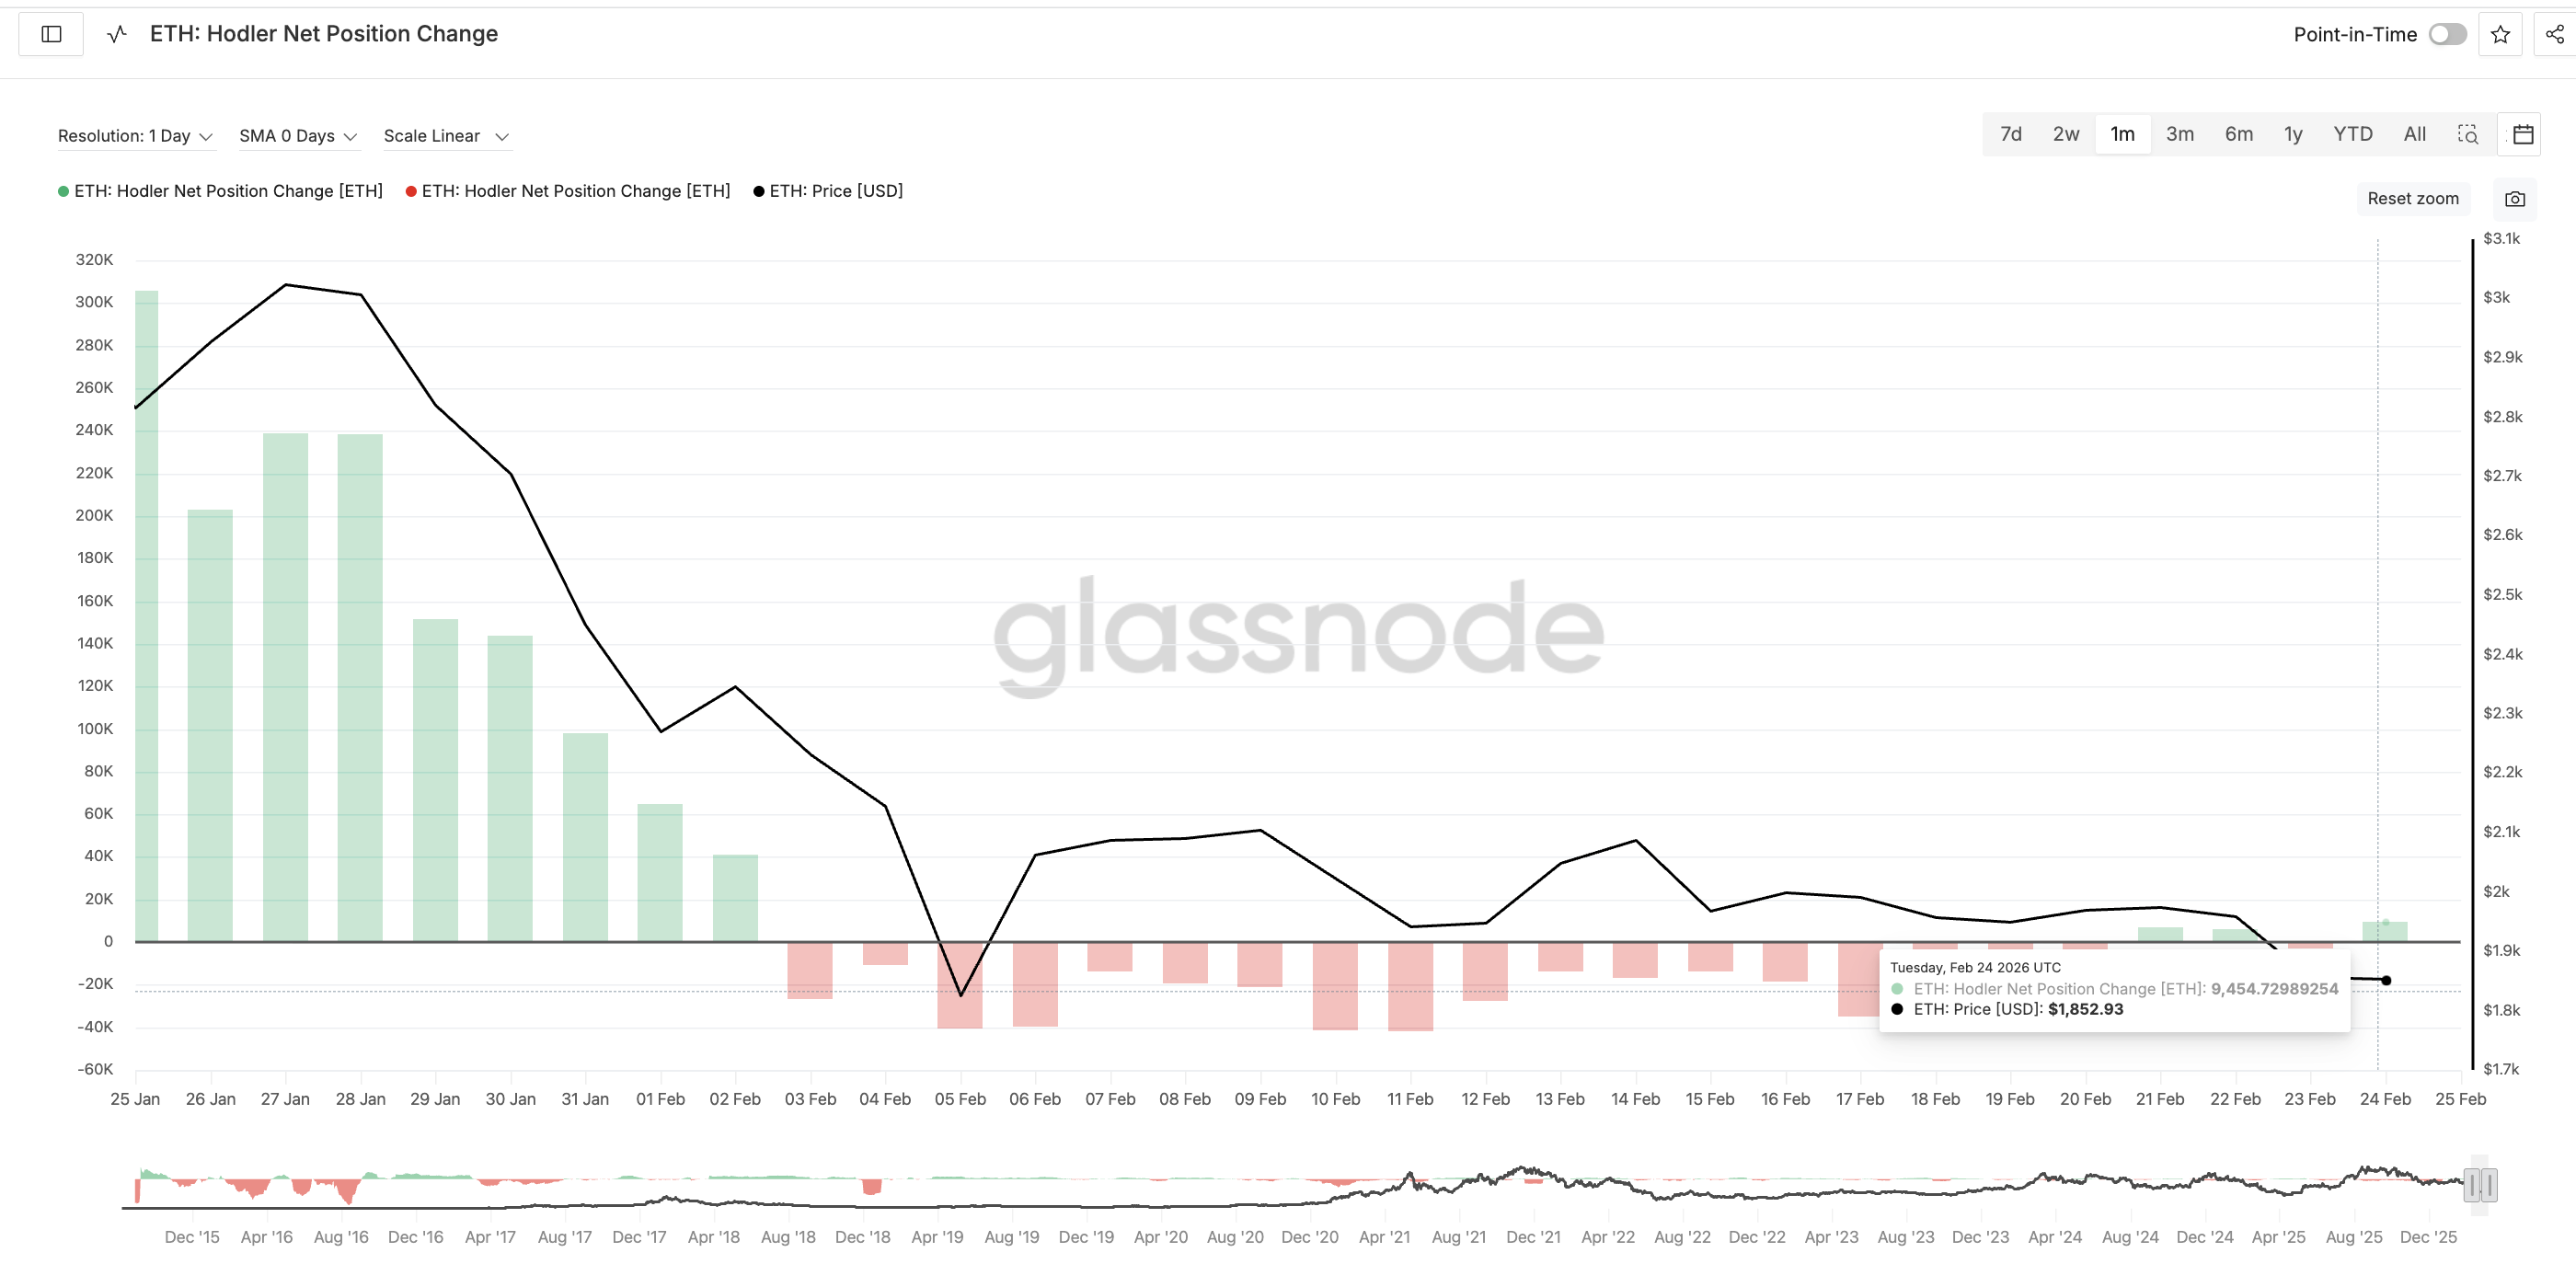
Initially, long-term holders showed uncertainty. The HODLer Net Position Change metric stayed negative through most of early February, showing selling pressure even among experienced investors. The price dip seems to have scared them off eventually,
But this behavior has recently changed.
On February 21, long-term holders began accumulating again. By February 24, they added 9,454 ETH in a single day. This shift suggests long-term investors are starting to align with whale accumulation after weeks of hesitation. Exchange flow data adds another important layer.
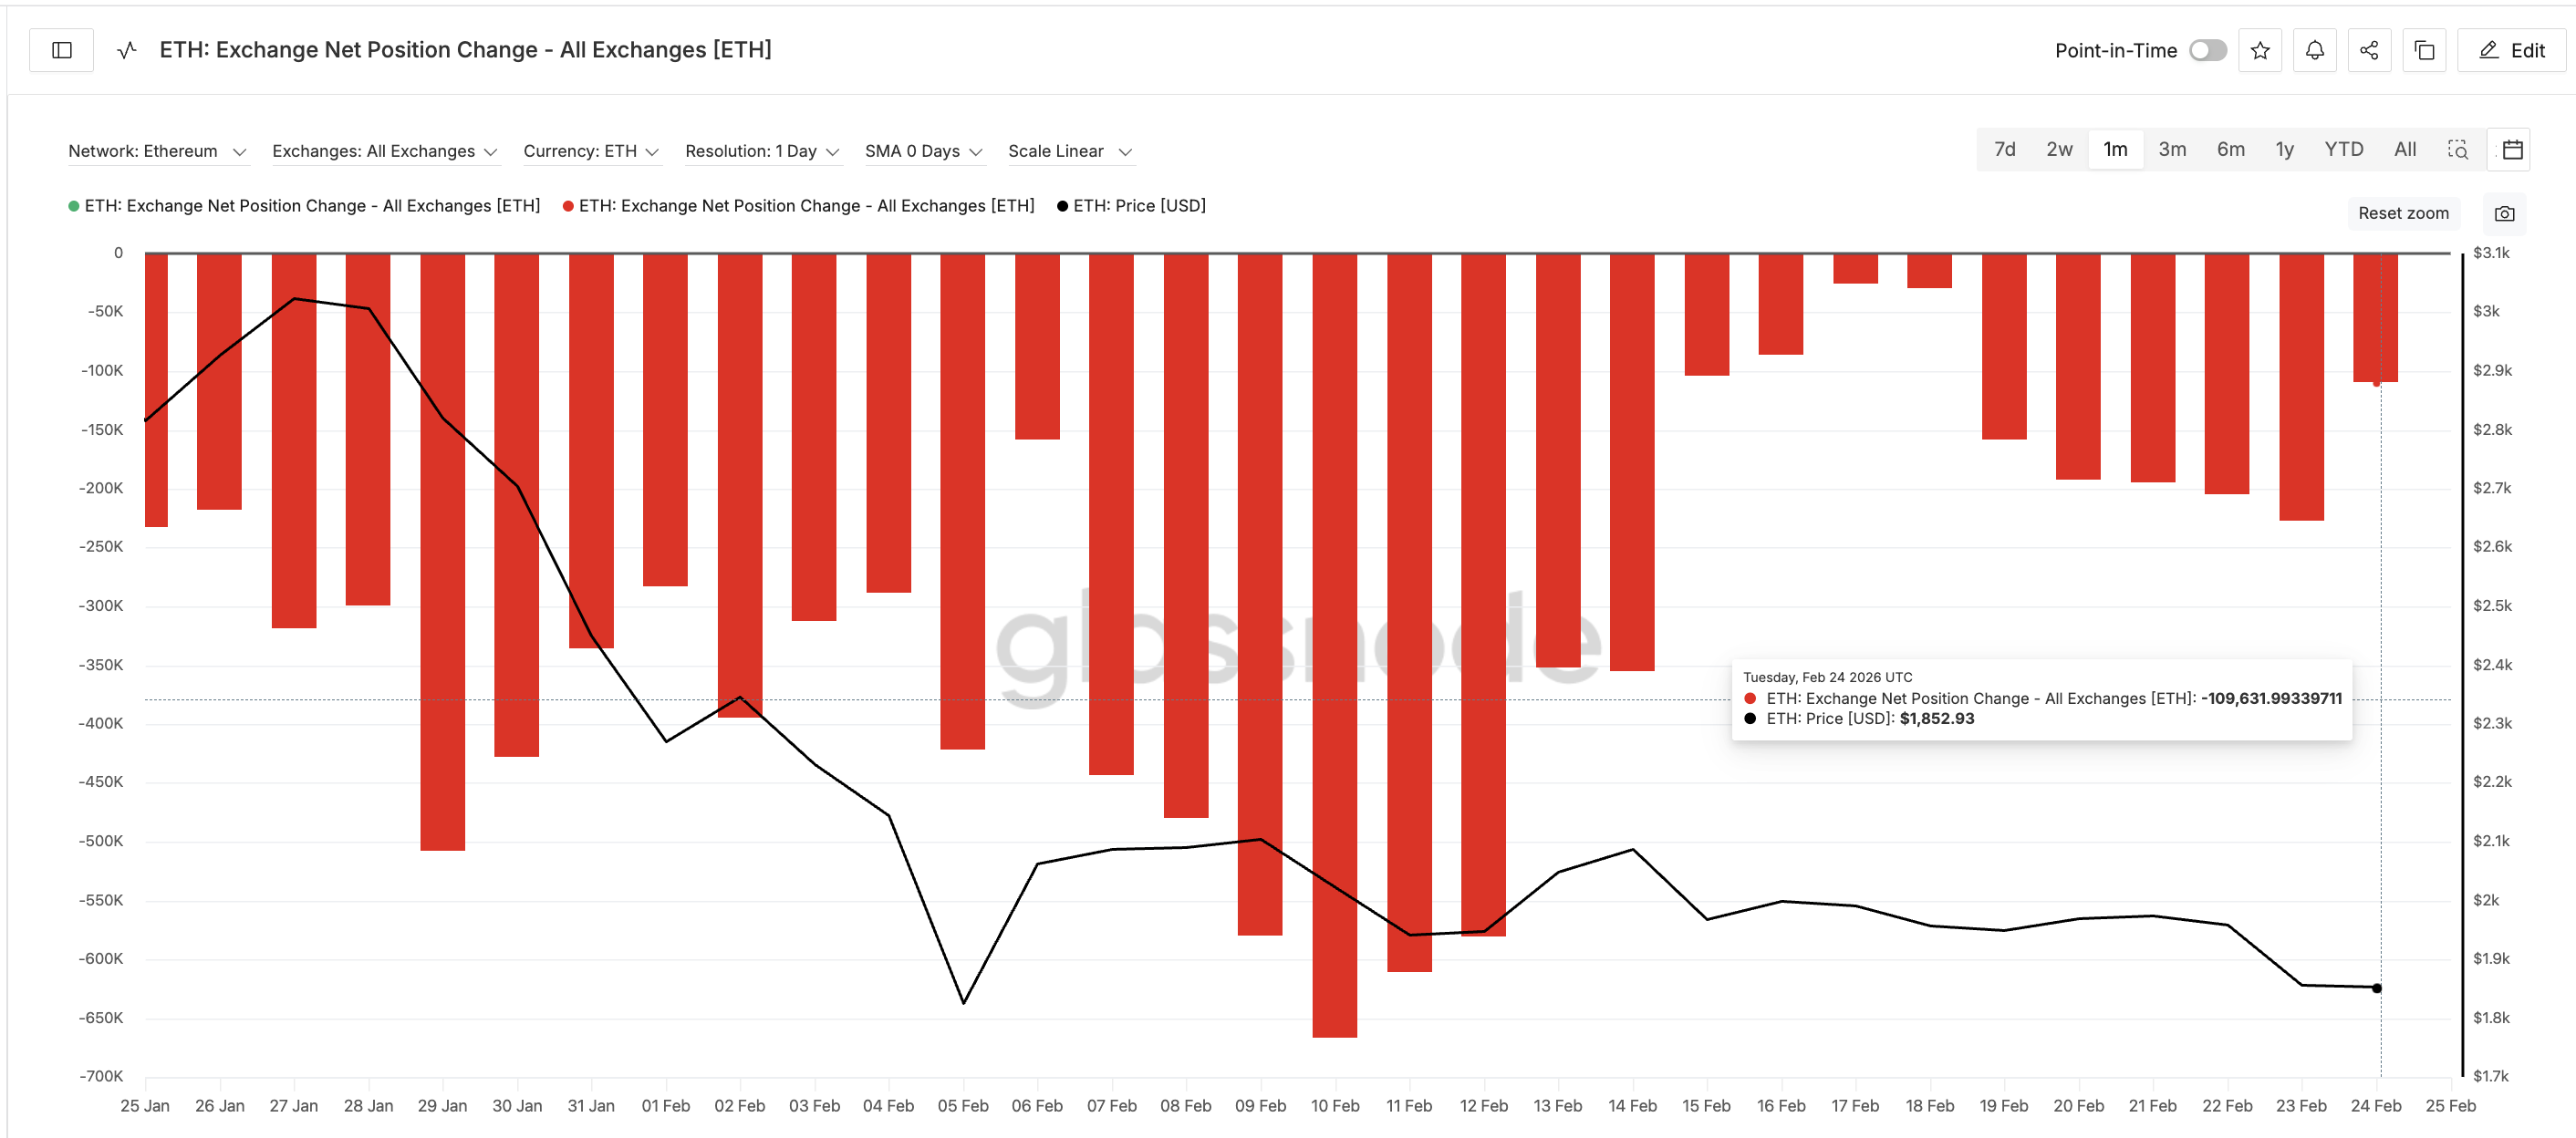
Exchange Net Position Change remained negative throughout the crash. Negative values mean coins are leaving exchanges rather than entering them. This shows investors were moving ETH into private wallets instead of preparing to sell.
For example, exchange outflows reached 227,300 ETH on February 23. Although outflows have slowed to 109,631 ETH on the next day, the trend still shows net accumulation rather than panic selling.
And also, the reduced outflows can be good news. Here is how:
Short-term holders also appear to be exiting.
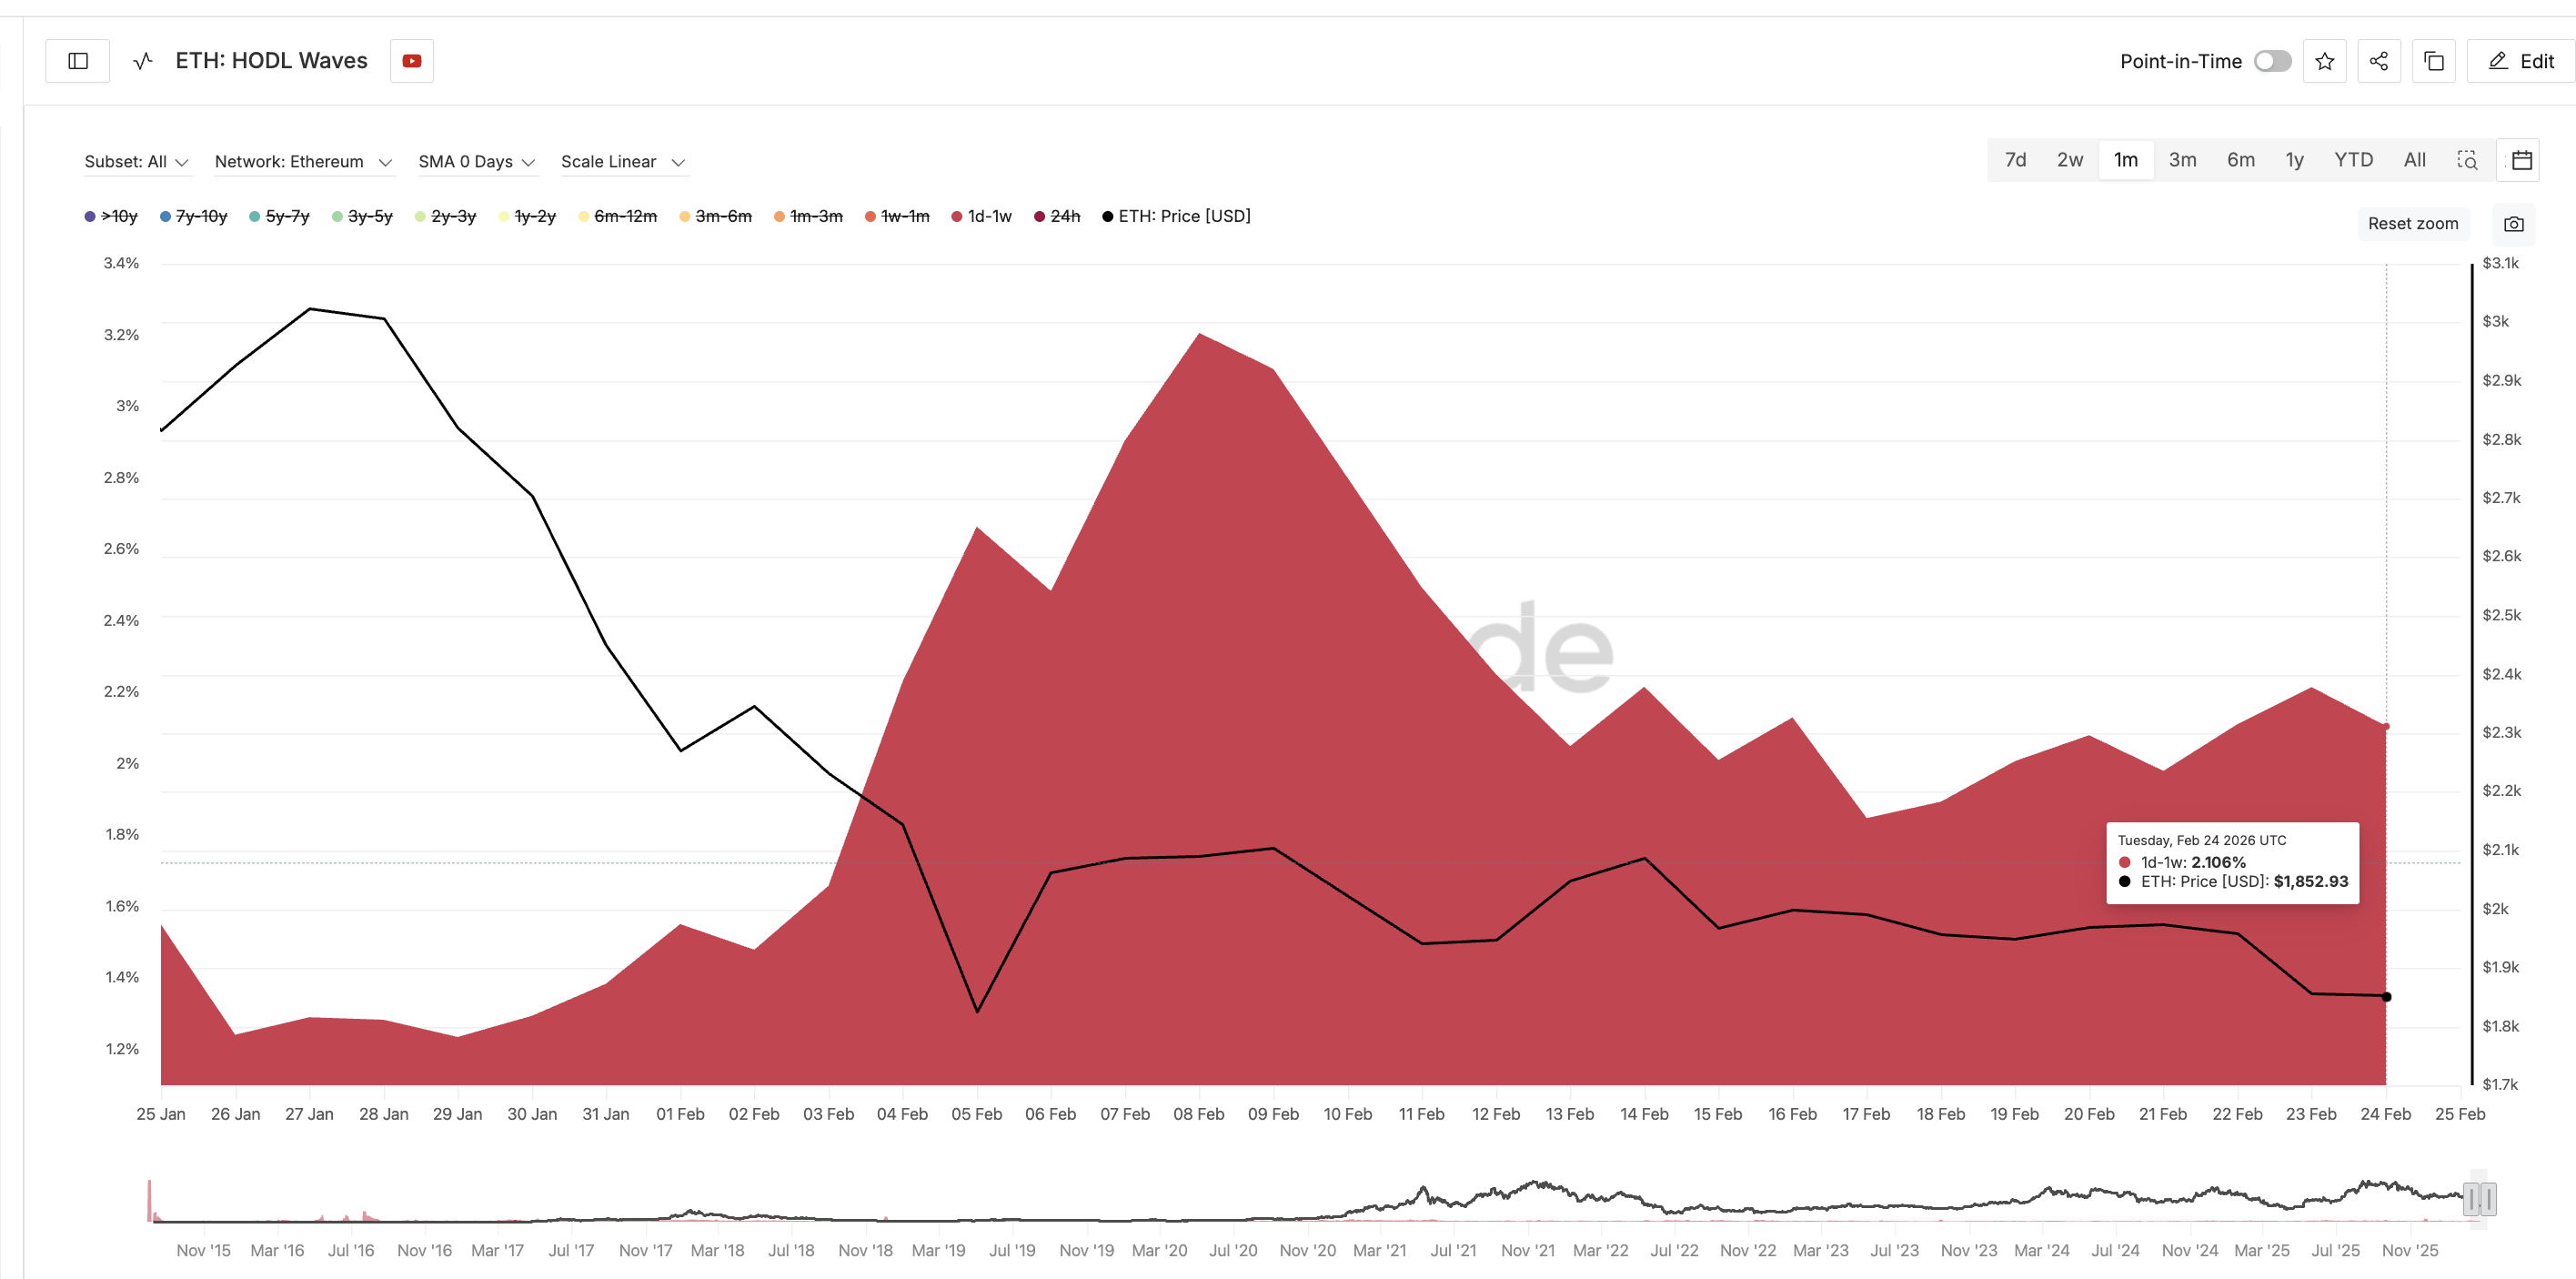
The share of Ethereum supply held by short-term holders, defined as those holding for less than one week, dropped from 3.2% in early February to 2.1% now. This trend was revealed using the HODL Waves metric, which segregates cohorts by time held.
This confirms speculative traders have been flushed out of the market. That could also explain the lower outflow number.
When weak hands exit and strong hands accumulate, markets often move toward structural bottoms. This supports the bullish market shift thesis discussed earlier.
Ethereum Price Now Tests Structural Reversal Zone After Whale Accumulation
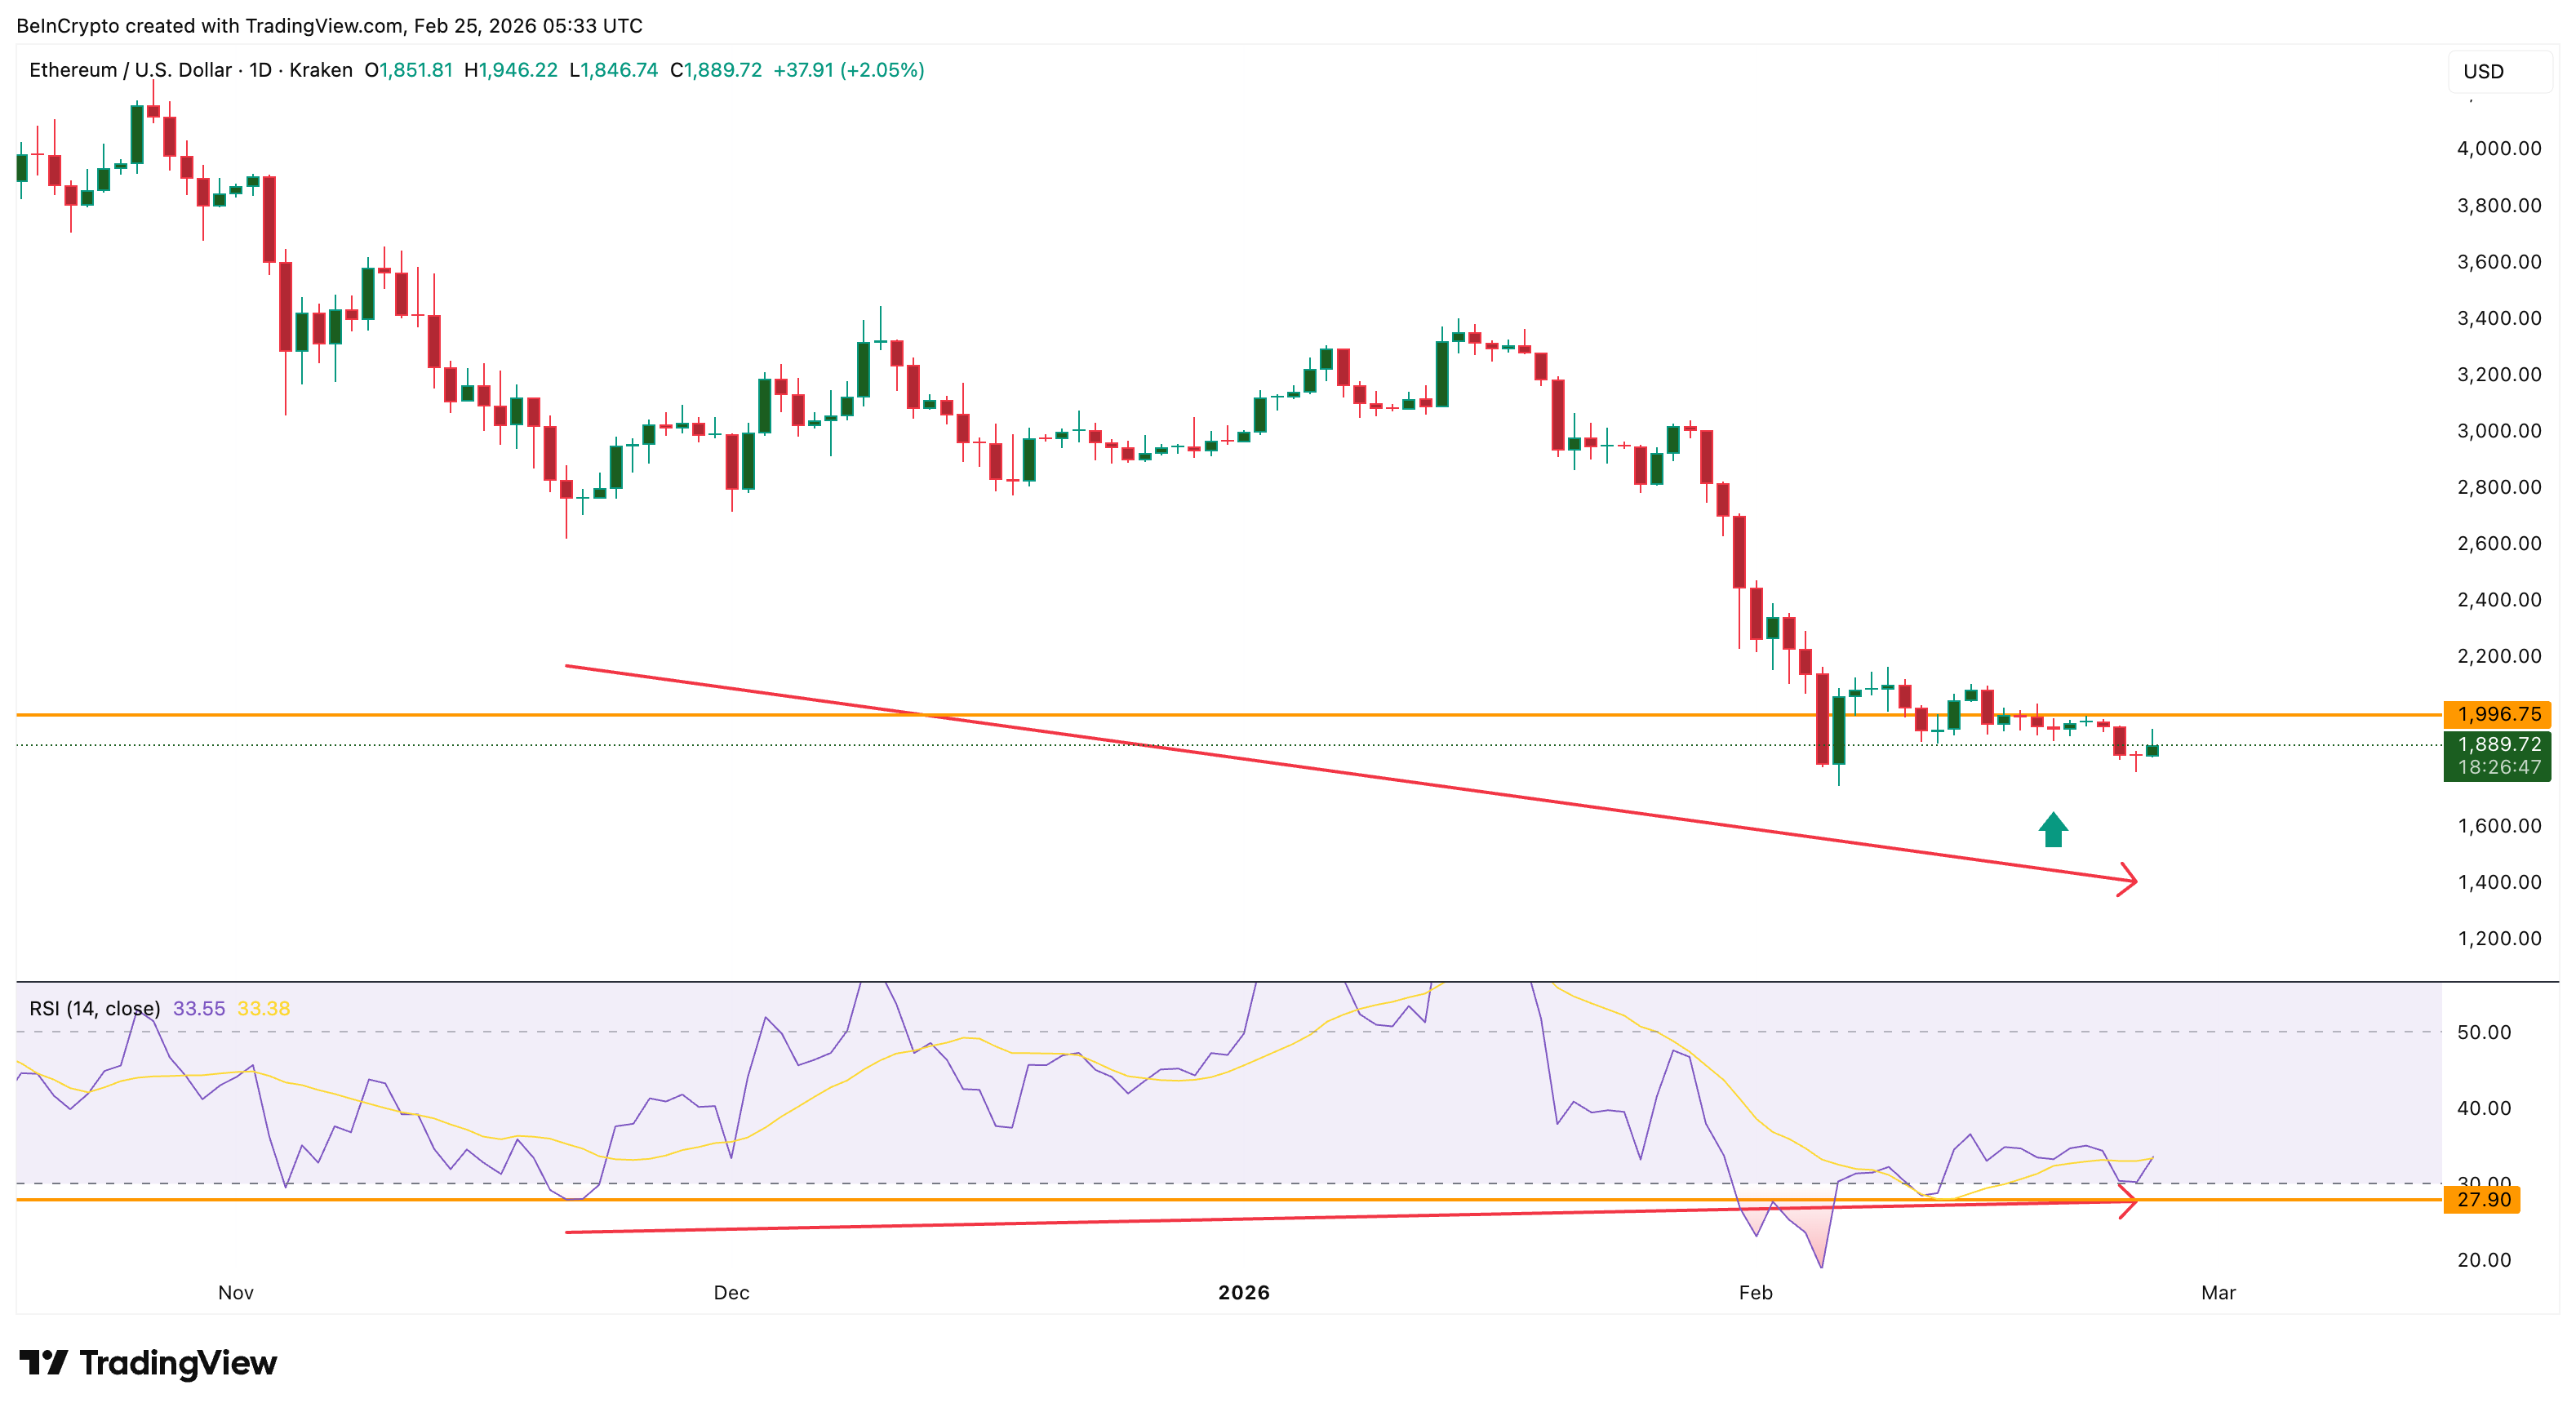
Ethereum’s price structure is now beginning to reflect these accumulation signals. The Relative Strength Index (RSI), which measures momentum, is showing a bullish divergence. Between November 21 and February 24, the Ethereum price formed a lower low, but the RSI formed a higher low.
This signals that selling pressure is weakening even though the price has not fully recovered, a technical bullish sign we mentioned earlier in the intro.
A similar divergence appeared on February 19, but it probably failed because long-term holder support was weaker at that time. The current setup differs because accumulation is now occurring across whales, long-term holders, and exchange flows. This increases the probability of a stronger rebound attempt, if not a theoretical reversal.
Ethereum is now testing a critical recovery zone.
The first resistance sits at $1,990. If Ethereum breaks above this level, the next target becomes $2,050. A move above $2,240 would confirm a larger recovery and signal that the structural bottom may already be in place. This would represent about a 20% move from current levels. However, downside risks remain.
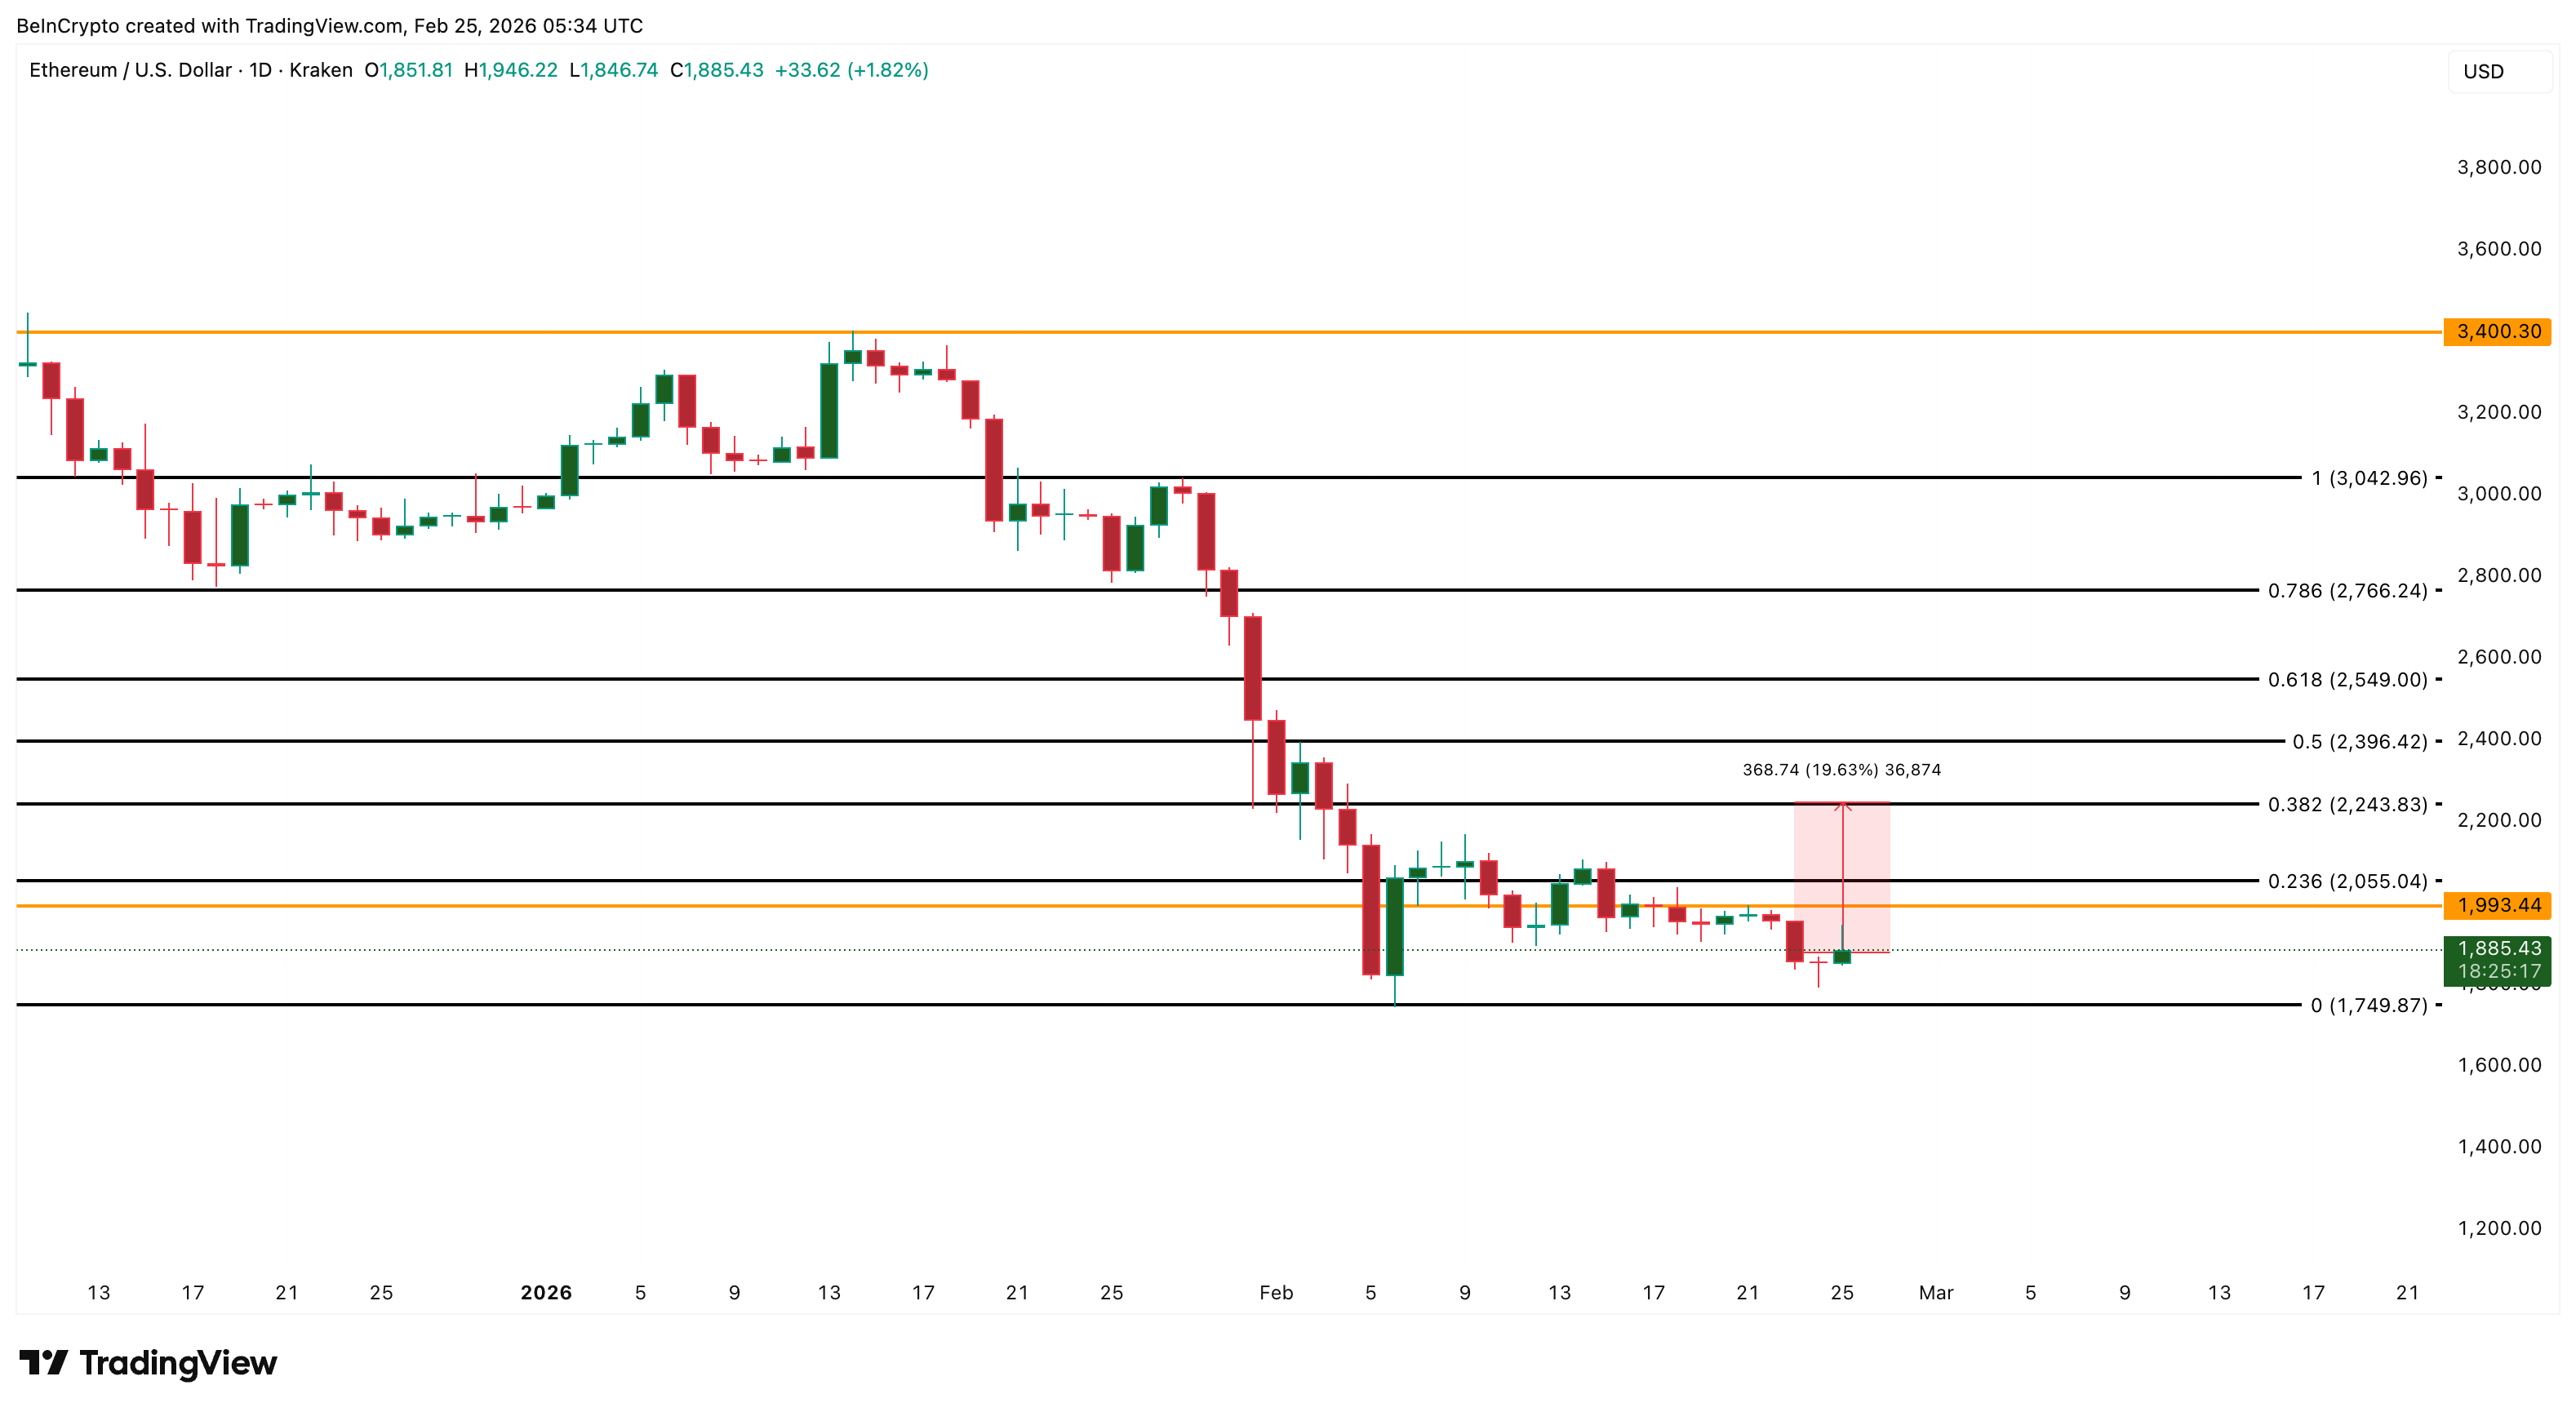
If Ethereum falls below $1,740 before rebounding higher, the structural bottom thesis would fail. This would signal that whales may have accumulated at a local bottom, while the broader downtrend remains active.
For now, the data shows a rare alignment. Whales added nearly 9 million ETH during a $7 billion leverage collapse. Long-term holders have resumed accumulation. Exchange outflows remain dominant, and weak hands are exiting. Ethereum’s next move will now decide whether this accumulation marks the beginning of a true structural bottom or just another temporary pause in a larger downtrend.
Crypto World
Why Bitcoin’s Next Big Move Hinges on $60K and $82K According to Coinbase Institutional’s GEX Report
TLDR:
- Coinbase Institutional’s GEX report identifies $60,000 as the thickest BTC support zone in current market structure.
- Negative gamma between $60K and $70K could accelerate Bitcoin’s downside beyond what discretionary buyers anticipate.
- Positive gamma from $85K to $90K points to a slow, choppy grind rather than a sharp breakout for Bitcoin.
- The report favors call spreads over outright calls above $82K, reducing theta bleed during uncertain market conditions.
Gamma Exposure (GEX) is now part of Coinbase Institutional’s latest Bitcoin analysis report. The report combines options market data with key support and resistance levels. It identifies $60,000 and $82,000 as critical price zones for BTC.
The findings suggest that negative gamma could accelerate downside moves, while positive gamma above $85,000 may slow upside momentum. Traders are urged to adjust their strategies based on these dynamics.
Negative Gamma Raises Downside Risk Below $70K
Coinbase Institutional’s report introduces GEX as a tool that turns the options market into a hidden liquidity layer. It helps traders decide between range trades and breakout strategies. The metric tracks how options dealers hedge their positions when Bitcoin’s price shifts.
Gamma measures how quickly an option’s price sensitivity changes as BTC moves. When dealers are short gamma, they tend to buy as prices rise and sell as prices fall. This behavior can turn small price moves into sharper, faster trends.
The report shows a pronounced negative gamma band concentrated between $60,000 and $70,000. That setup means any move toward $60,000 could accelerate beyond what typical buyers expect. Liquidation-style cascades become more likely in this zone.
Support near $60,000 remains the thickest demand cluster in the current price structure. However, the GEX data advises against buying the initial selloff. Traders are better positioned to enter only after a confirmed reclaim of that level.
Positive Gamma Between $85K and $90K Signals a Slow Grind
Above $82,000, the gamma picture shifts toward stabilization. A breach and hold above $82,000 would suggest that supply at that level has been absorbed. From there, BTC would likely move toward the next liquidity bands higher up.
The $85,000 to $90,000 range carries meaningful positive gamma. In positive gamma zones, dealers sell into strength and buy into weakness. That pattern tends to reduce volatility and create a slow, choppy upward grind.
Because of this chop risk, the report favors call spreads over outright calls in an $82,000 breakout scenario. Call spreads retain convexity while cutting theta bleed during a grind. That trade structure fits an environment where the macro catalyst remains unclear.
For traders managing existing long portfolios, protective put spreads offer a cleaner hedge if $60,000 fails. Bear put spreads are preferred over outright short positions, given the elevated risk of sharp reversals.
The report concludes that the $82,000 level remains the key gate that must open before any sustained upside becomes probable.

Bitcoin (BTC) surged more than $2,000 to reclaim the $66,000 level Tuesday evening, driven by risk-on positioning ahead of the State of the Union address by President Donald Trump.
While the asset has since retraced slightly to trade near $65,500, according to CoinGecko, the move signals a potential localized bottom as traders digest the administration’s economic messaging amidst a broader equity rally.
Key Takeaways
- The Catalyst: Trump’s claims of “plummeting inflation” and economic turnaround fueled a 3.5% relief rally across risk assets.
- The Level: Bitcoin rejected immediate resistance at $66,000 but held support above $64,500, creating a tight consolidation range.
- The Setup: Traders are eyeing Nvidia earnings Wednesday as the critical volume trigger to confirm or invalidate the bounce.
Trump Address Fuels Risk-On Rotation into Bitcoin
The immediate catalyst for the price action was the State of the Union address, where President Trump framed his first year back in office as an economic “turnaround for the ages.”
By highlighting falling mortgage rates and a 1.7% decline in core inflation over the last three months of 2025, the address provided a macro tailwind for risk assets that had been battered by regulatory uncertainty.
Markets reacted favorably to the pledge that the U.S. economy would “never go back” to previous policies, spurring a relief bounce that saw Bitcoin climb from approximately $64,000 to peak at $66,000 just before the 9 pm ET speech.
This reaction starkly contrasts with earlier volatility, where Bitcoin price fell below $65k on Trump tariff risk-off fears, highlighting the market’s extreme sensitivity to fiscal signaling.
Post-Trump Address: Can Bitcoin Bulls Defend $64,500?
Bitcoin’s rejection at $66,000 has left price action in a precarious consolidation zone. The asset is currently trading up about 3.7% on the day, but the inability to close a 4-hour candle above $66,500 suggests buy-side exhaustion is still present.
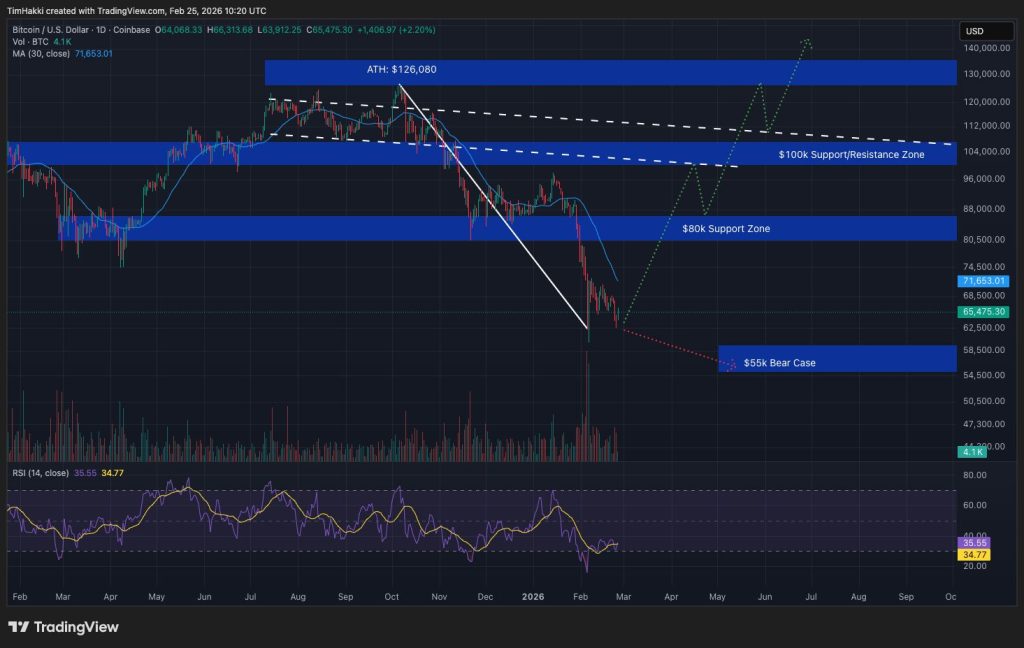
Support is forming firmly at $64,500. If that slips, it gives weight to claims by Polymarket and CryptoQuant that $55,000 may be the next local bottom.
Recent data shows that $370M in liquidations were required to defend the $60k level earlier this week, indicating that deep support exists lower down, but bulls cannot afford another tests of those lows if the recovery narrative is to hold.
Three metrics are currently flashing capitulation-level readings, with Bitcoin still down nearly 50% from its October 2025 ATH. While short-term engagement has increased, the lack of follow-through volume at $66,000 remains a concern for technical traders looking for a trend reversal.
Discover: Best meme coins To Buy Now
Risk Sentiment and Nvidia Correlation
The broader market context suggests Bitcoin is once again trading in high correlation with equities. Asian stocks rallied overnight, and markets are optimistic ahead of Nvidia’s earnings report due Wednesday.
This tech-led optimism has spilled over into crypto, specifically benefiting altcoins a little more than Bitcoin, like Solana, which is up 8% in the last 24 hours, and Chainlink, which rose 5% in the same period.
JUST IN: — Watcher.Guru (@WatcherGuru) February 18, 2026
 Eric Trump says Bitcoin will reach $1 million.
"I've never been more bullish on Bitcoin in my life." pic.twitter.com/niJH5ILfh9
However, institutional flows tell a more cautious story. Recent ETF outflows signal institutional caution, with smart money hesitating to deploy capital aggressively until a clear break above structural resistance occurs.
If Nvidia earnings disappoint, the risk-off rotation could drag Bitcoin back toward the $63,000 range regardless of Trump’s fiscal promises.
Discover: Top crypto for portfolio diversification
What Happens Next?
Traders must watch two specific levels in the next 24 hours. For the bullish rebound to sustain, Bitcoin needs to reclaim $67,500 to confirm a break from the local downtrend. A close above this level opens the path to $70,000.
Conversely, a breakdown below $64,000 invalidates the post-speech bounce. Market sentiment remains fragile; currently, Polymarket odds show traders pricing in a potential drop to $55k if macro headwinds persist. Until $67,500 is reclaimed, the trend favors the bears.
The post Bitcoin Rises as Markets Price State of the Union Trump Address appeared first on Cryptonews.
TLDR:
- Terraform Labs’ bankruptcy administrator filed a lawsuit against Jane Street in Manhattan in February 2026.
- Jane Street allegedly dumped 85M UST minutes after Terraform pulled 150M UST liquidity from Curve Finance.
- A private chat called “Bryce’s Secret” allegedly gave Jane Street insider knowledge before the Terra-Luna collapse.
- Jane Street reportedly avoided over $200M in losses while retail investors suffered catastrophic and unrecoverable financial damage.
Jane Street, the prominent trading firm, faces a lawsuit filed by Terraform Labs’ bankruptcy administrator in Manhattan.
The February 2026 complaint accuses Jane Street of orchestrating the collapse of TerraUSD (UST) and LUNA in May 2022.
The event wiped out approximately $40 billion within days. It also triggered a broader crypto market downturn lasting well into 2023. Jane Street has denied all allegations, calling the lawsuit “baseless.”
The Alleged Timeline Behind the Terra Collapse
The lawsuit outlines a specific sequence of events from May 2022. According to the complaint, Terraform quietly withdrew 150 million UST from the Curve liquidity pool.
Minutes after that withdrawal, Jane Street allegedly dumped 85 million UST into the market. That move reportedly triggered immediate panic among investors and traders across the ecosystem.
The panic then accelerated UST’s loss of its one-dollar peg. Once UST depegged, LUNA’s mint-and-burn mechanism caused it to hyperinflate rapidly and uncontrollably.
This is how the $40 billion wipeout unfolded within just a few days. The lawsuit argues the sequence was not coincidental but rather a coordinated effort.
The complaint further claims Jane Street had access to insider information before the event. A former Terraform intern, who later joined Jane Street as a trader, allegedly shared critical details.
This exchange reportedly occurred through a private group chat named “Bryce’s Secret.” This alleged insider access forms a central pillar of the legal argument presented.
Because of this reported advance knowledge, Jane Street allegedly positioned itself ahead of the collapse. The firm is accused of avoiding over $200 million in losses as a result.
Additionally, the complaint claims Jane Street profited during the meltdown. Meanwhile, retail investors absorbed devastating and largely unrecoverable losses.
Broader Market Fallout and New Questions Raised
The Terra collapse did not remain isolated to LUNA and UST alone. The event created a domino effect that spread rapidly across the broader crypto market.
Several major firms with exposure to Terra faced severe liquidity crises shortly after. This chain reaction contributed directly to what became known as the 2022 crypto winter.
The lawsuit has also reignited ongoing debates about institutional manipulation in crypto markets. Analysts and observers began drawing comparisons to other unexplained market events.
Some pointed specifically to the October 10 crash, questioning whether similar tactics were deployed then. The complaint, however, does not formally allege Jane Street’s involvement in that separate event.
Jane Street has responded firmly, publicly denying every allegation contained in the lawsuit. The firm has not addressed specific claims surrounding “Bryce’s Secret” or the insider trading accusations.
Legal proceedings are currently active in Manhattan federal court. The outcome could establish an important precedent for institutional accountability in crypto.
This lawsuit stands as one of the most serious legal actions linked to the 2022 Terra collapse. It places direct scrutiny on institutional trading conduct during periods of extreme crypto market volatility. The case is expected to progress through federal court in the coming months.

Lily-Rose Depp Gets Dreamy in Chanel’s Denim Makeup
Attract birds to any garden with RSPCA’s ‘easy’ method for spring
Trainline shares slump as CEO Jody Ford announces departure


-

 Video5 days ago
XRP News: XRP Just Entered a New Phase (Almost Nobody Noticed)
-

 Fashion5 days ago
Weekend Open Thread: Boden – Corporette.com
-

 Politics3 days ago
Baftas 2026: Awards Nominations, Presenters And Performers
-

 Entertainment7 days ago
Kunal Nayyar’s Secret Acts Of Kindness Sparks Online Discussion
-

 Sports2 days ago
Women’s college basketball rankings: Iowa reenters top 10, Auriemma makes history
-

 Politics2 days ago
Nick Reiner Enters Plea In Deaths Of Parents Rob And Michele
-
 Sports6 days ago
Clearing the boundary, crossing into history: J&K end 67-year wait, enter maiden Ranji Trophy final | Cricket News
-

 Crypto World1 day ago
XRP price enters “dead zone” as Binance leverage hits lows
-

 Business3 days ago
Mattel’s American Girl brand turns 40, dolls enter a new era
-

 Business3 days ago
Law enforcement kills armed man seeking to enter Trump’s Mar-a-Lago resort, officials say
-

 Entertainment7 days ago
Dolores Catania Blasts Rob Rausch For Turning On ‘Housewives’ On ‘Traitors’
-

 Tech3 days ago
Anthropic-Backed Group Enters NY-12 AI PAC Fight
-
 NewsBeat2 days ago
‘Hourly’ method from gastroenterologist ‘helps reduce air travel bloating’
-

 NewsBeat3 days ago
Armed man killed after entering secure perimeter of Mar-a-Lago, Secret Service says
-

 Politics3 days ago
Maine has a long track record of electing moderates. Enter Graham Platner.
-

 Tech18 hours ago
Unsurprisingly, Apple's board gets what it wants in 2026 shareholder meeting
-

 Crypto World7 days ago
WLFI Crypto Surges Toward $0.12 as Whale Buys $2.75M Before Trump-Linked Forum
-
 NewsBeat13 hours ago
Police latest as search for missing woman enters day nine
-

 Crypto World6 days ago
83% of Altcoins Enter Bear Trend as Liquidity Crunch Tightens Grip on Crypto Market
-
 Sports2 days ago
2026 NFL mock draft: WRs fly off the board in first round entering combine week