

Crypto World
Solana Price Rises 9%, But Holder Shift Raises New Crash Risk
Solana price has rebounded nearly 9% after falling to around $75 on February 23, and it is still holding most of those gains above $82.
This kind of bounce normally attracts strong buyers because it suggests the worst may be over. But that is not what is happening this time. The investors who usually step in during recoveries — long-term holders — are stepping back instead. This creates an unusual disconnect between price and conviction, and it helps explain why Solana’s rebound is already facing pressure.
Long-Term Holder Buying Has Dropped Nearly 62% Despite the Price Bounce
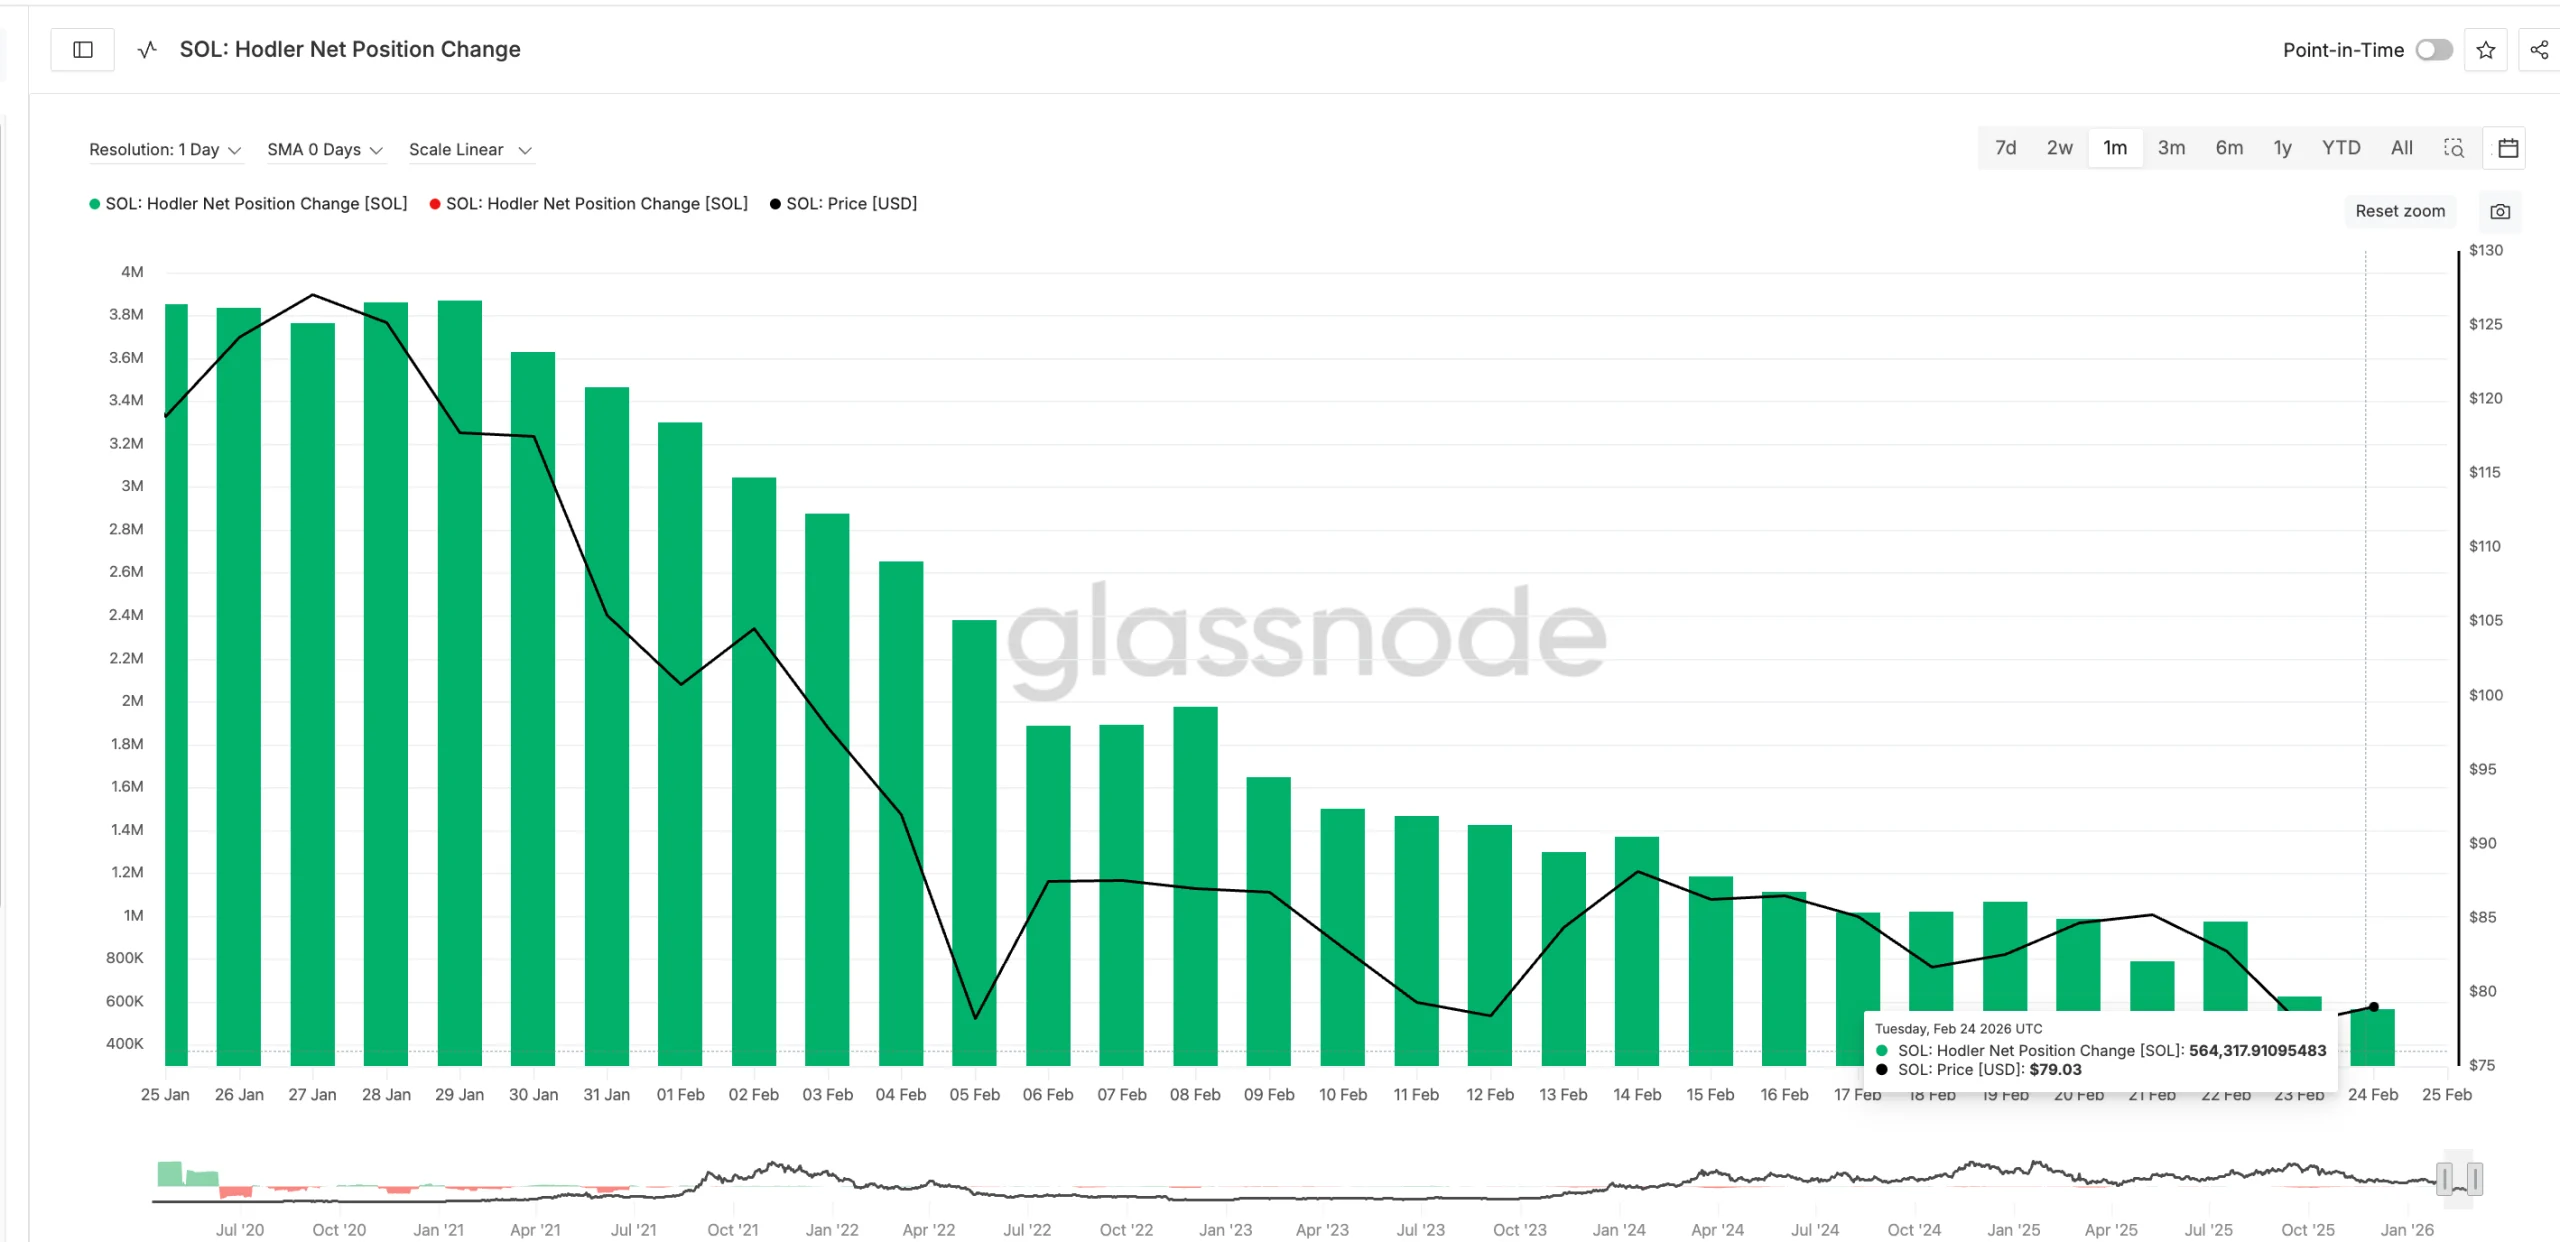
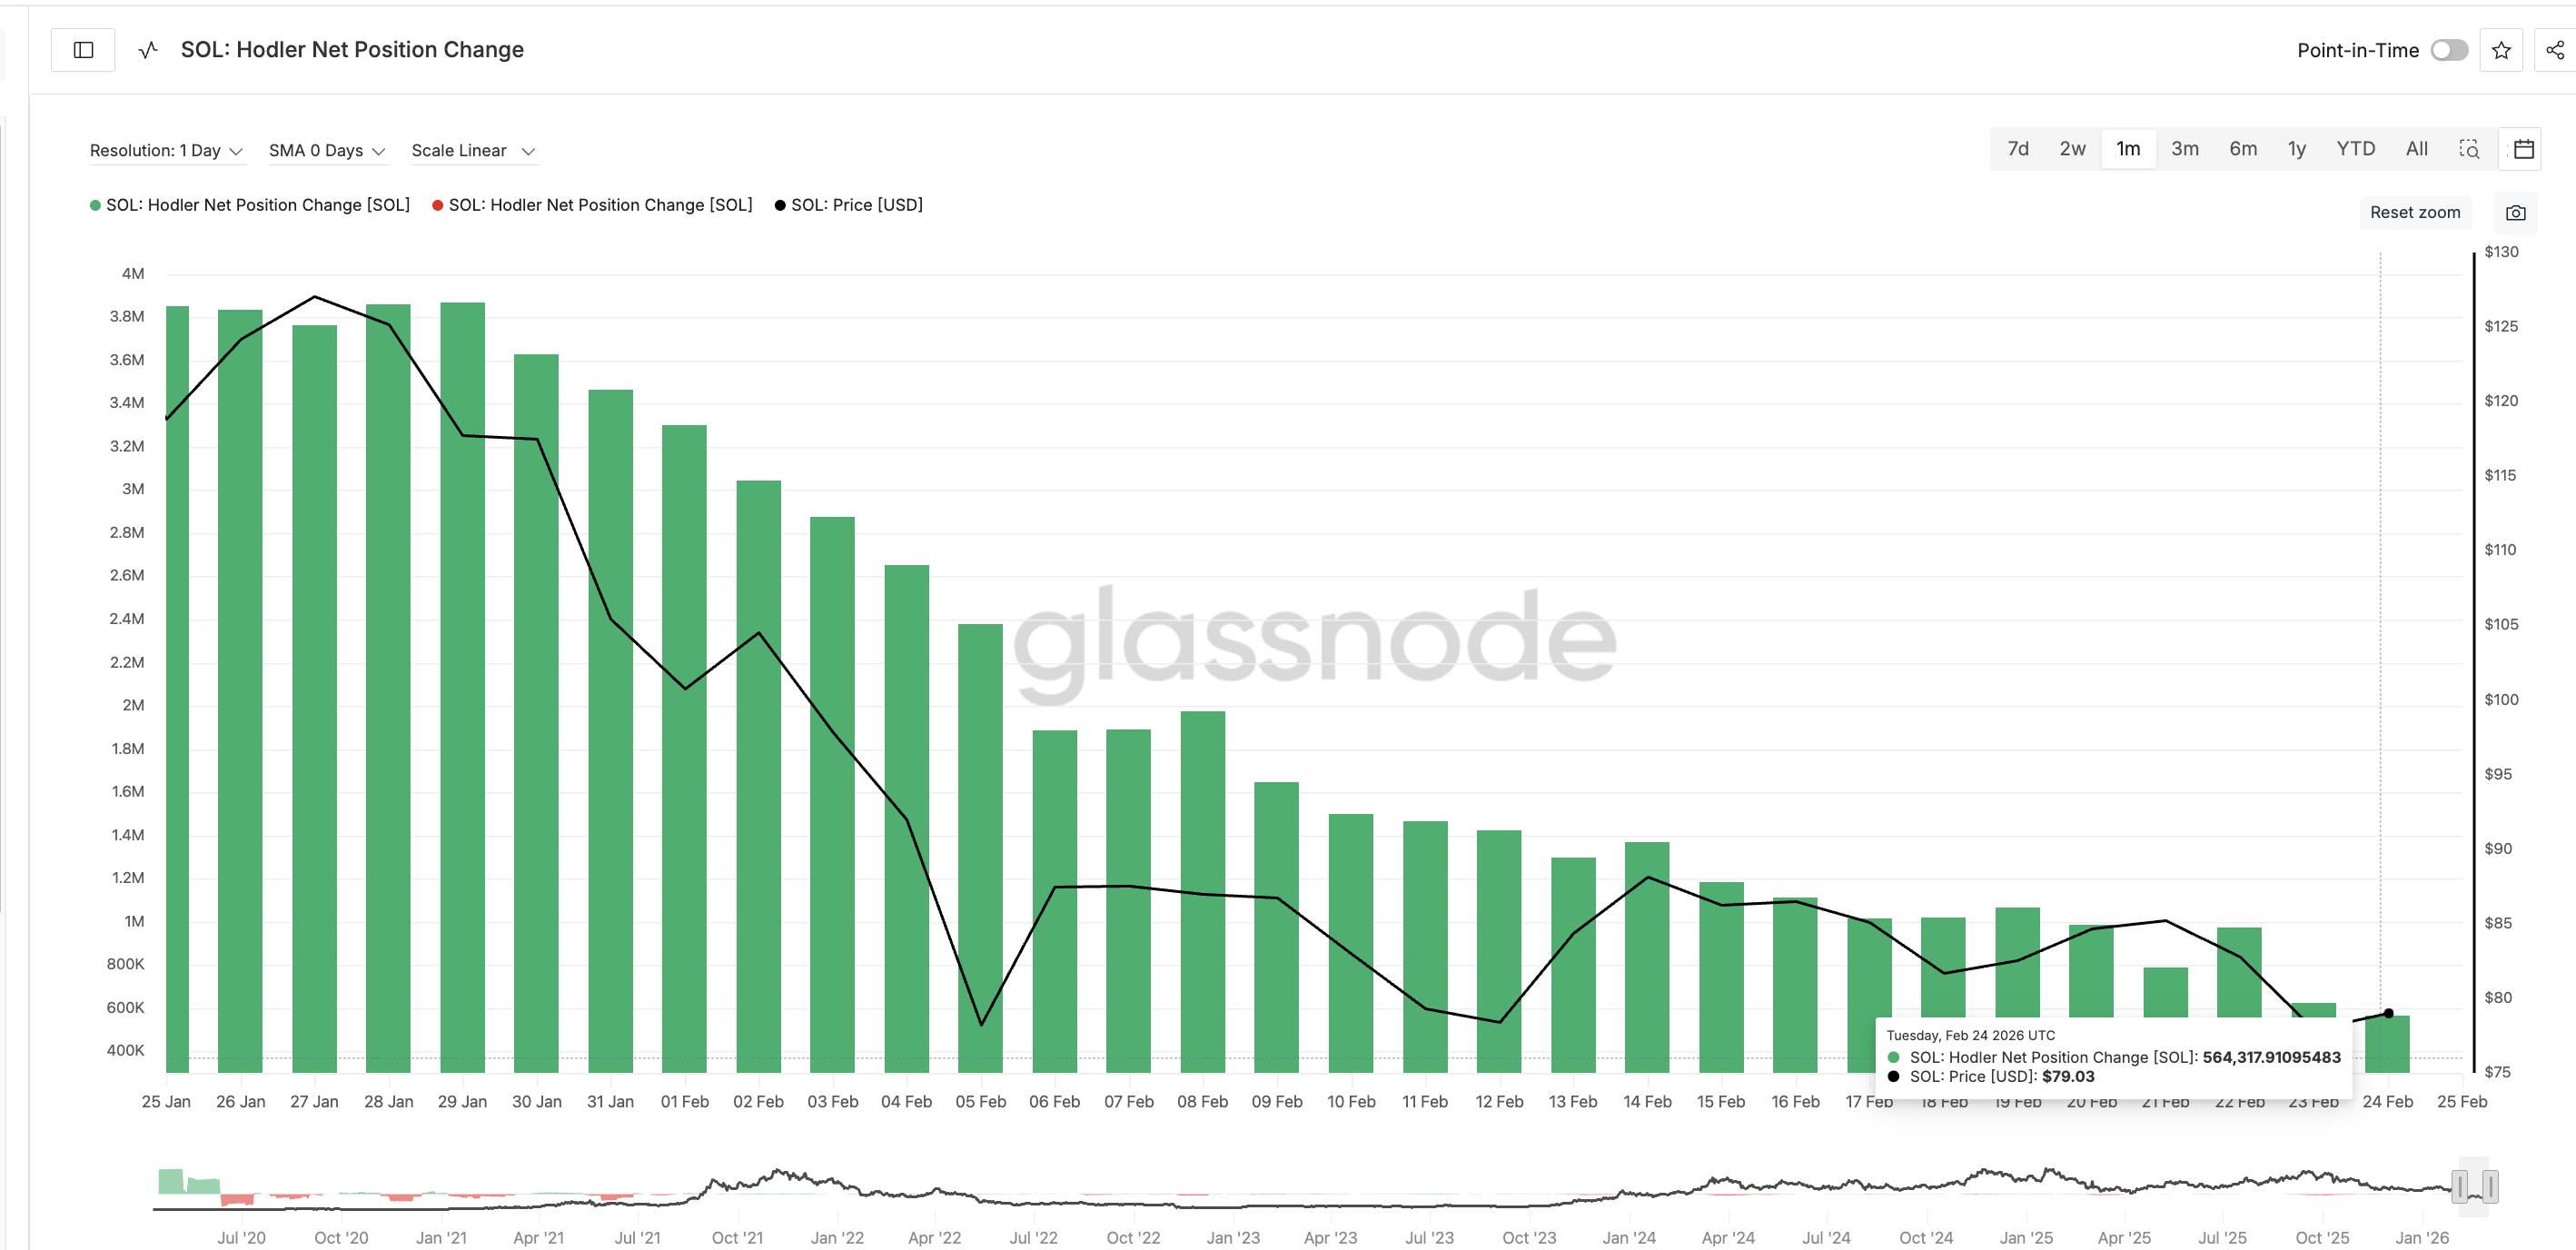
The clearest sign of weakening conviction comes from the HODLer Net Position Change metric. This indicator measures how much long-term holders, defined as wallets holding Solana for more than 155 days, are adding or reducing over a rolling 30-day period.
On February 10, long-term holders added about 1.5 million SOL. By February 24, that number had fallen sharply to just 564,317 SOL. This marks a drop of about 62.5% in accumulation within two weeks. This decline happened even as Solana’s price stabilized and rebounded, which makes the shift especially important.
Want more token insights like this? Sign up for Editor Harsh Notariya’s Daily Crypto Newsletter here.
In simple terms, Solana’s strongest holders were buying aggressively earlier in the month, but that confidence has faded significantly. When accumulation falls this sharply, it suggests these investors are no longer convinced the current bounce is the start of a sustained recovery. Despite the SOL price bounce, the Hodler positioning is at its lowest monthly level.
Disclaimer: This does not mean long-term holders are heavily selling, but it shows their buying momentum has weakened sharply.
This shift is not limited to the oldest holders. Mid-term holders, who have held Solana between one month and three months, have also been reducing their exposure. Their share of total supply fell from 19.52% on January 25 to about 14.08% on February 24. This represents a 27.9% relative decline in their supply share in just one month.
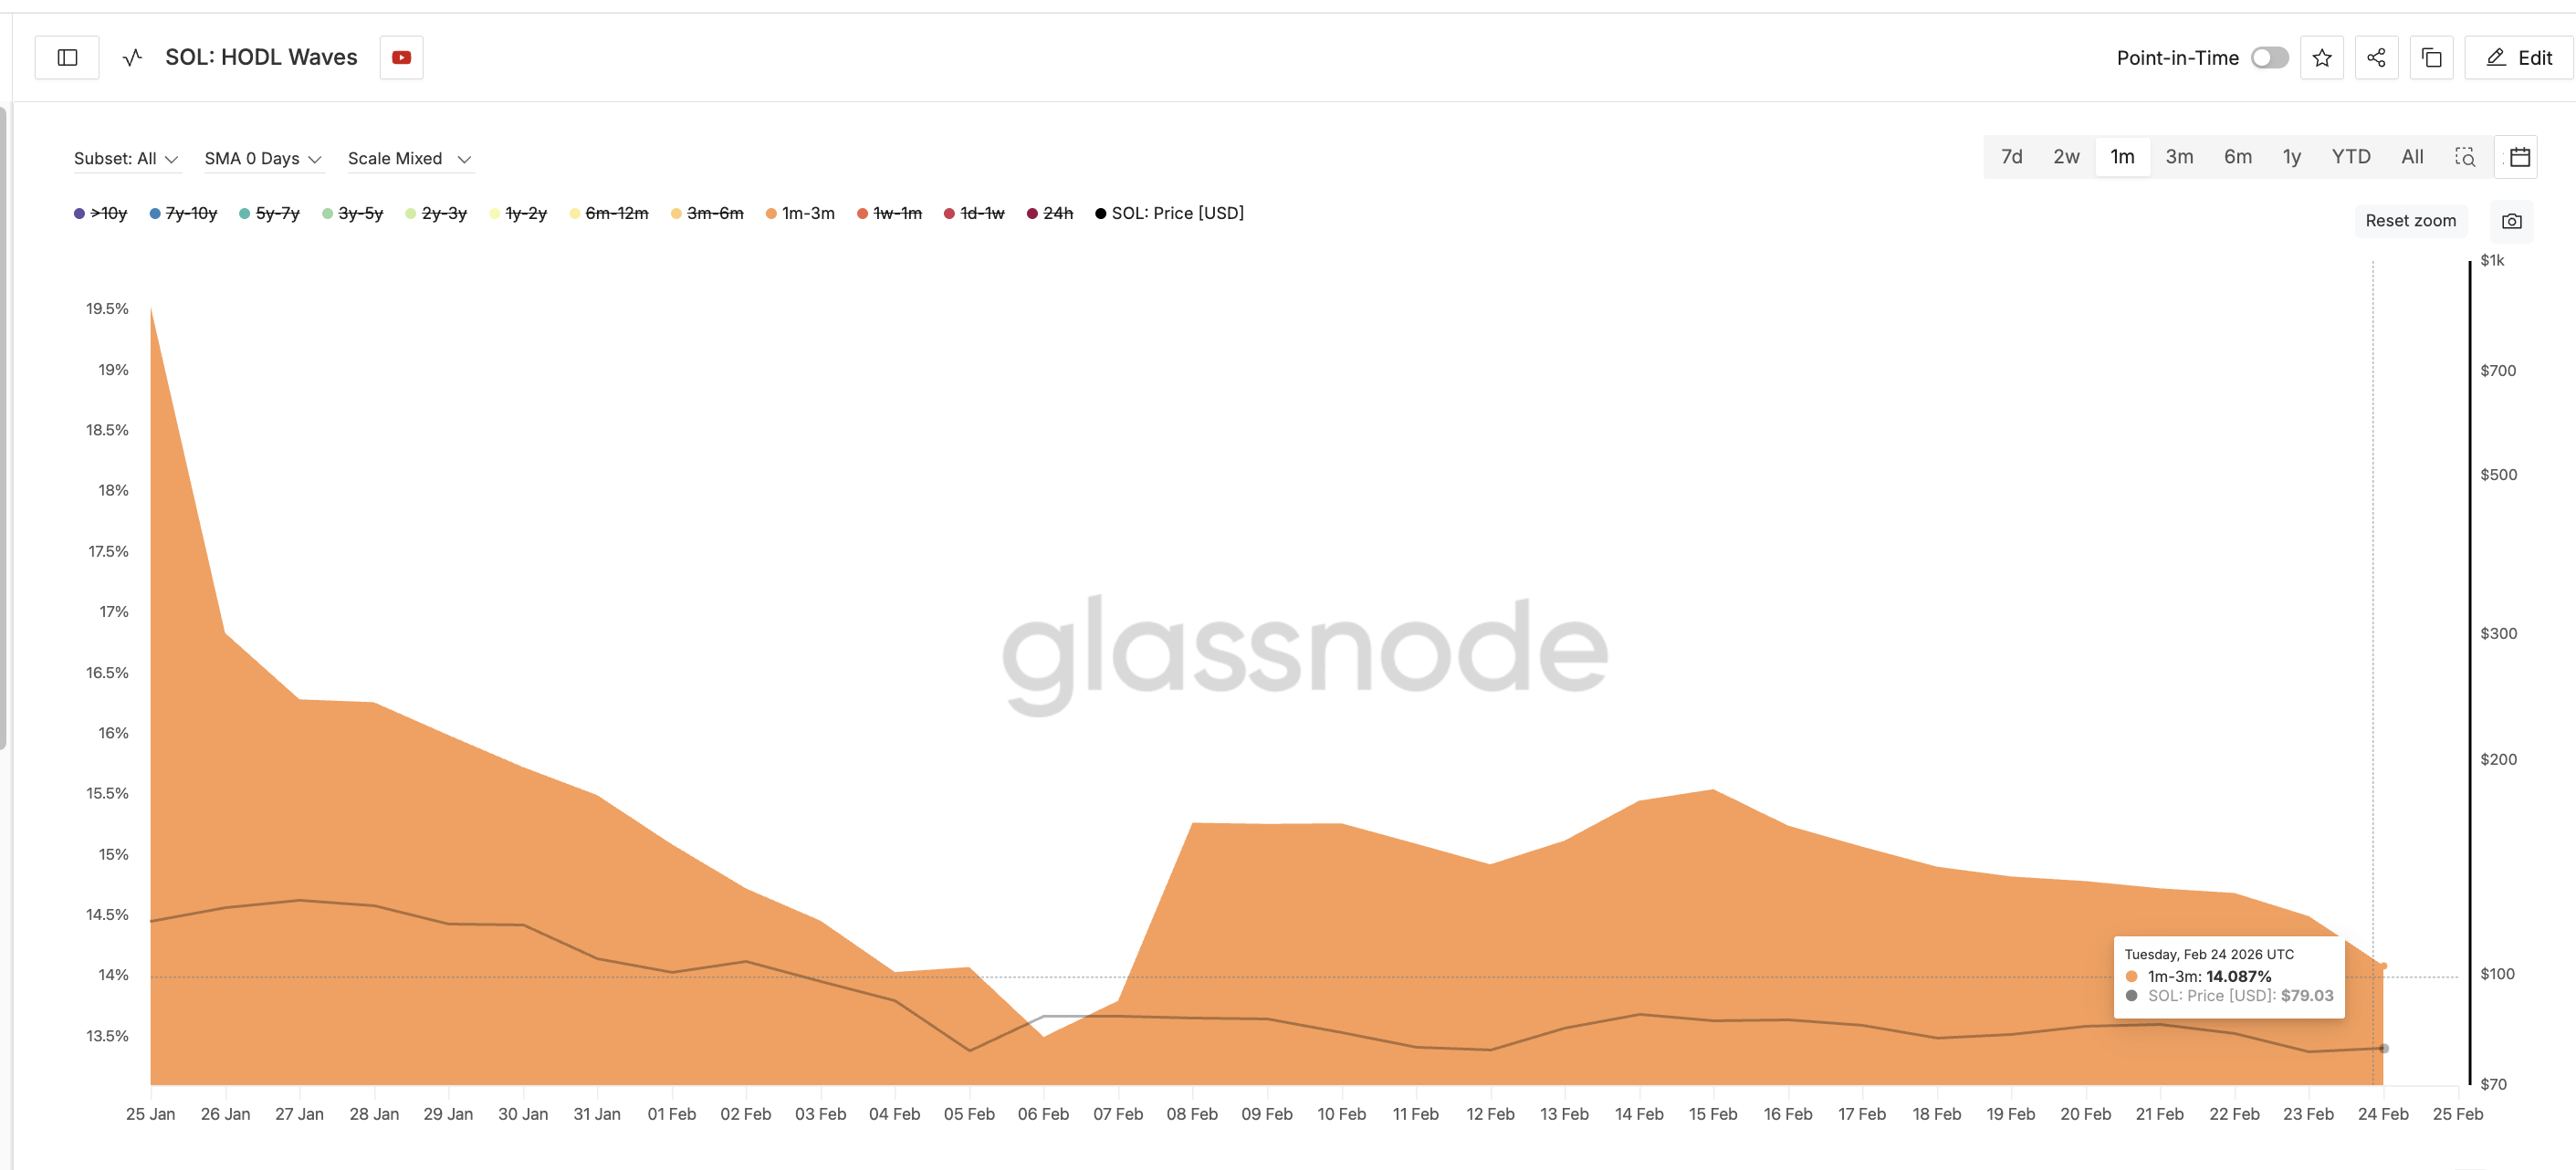
What makes this important is the timing. This reduction persisted even as Solana’s price rose over the past two days. Instead of buying the rebound, many holders appear to be using it as an opportunity to exit.
A 22 Million SOL Supply Wall Is Blocking the Recovery
The lack of strong buying becomes more concerning when combined with Solana’s cost basis distribution data, which reveals where investors last bought their coins.
This data shows a major concentration of supply between $82.81 and $83.79. More than 22.16 million SOL was accumulated in this range. This is one of the largest supply clusters currently sitting above the price.
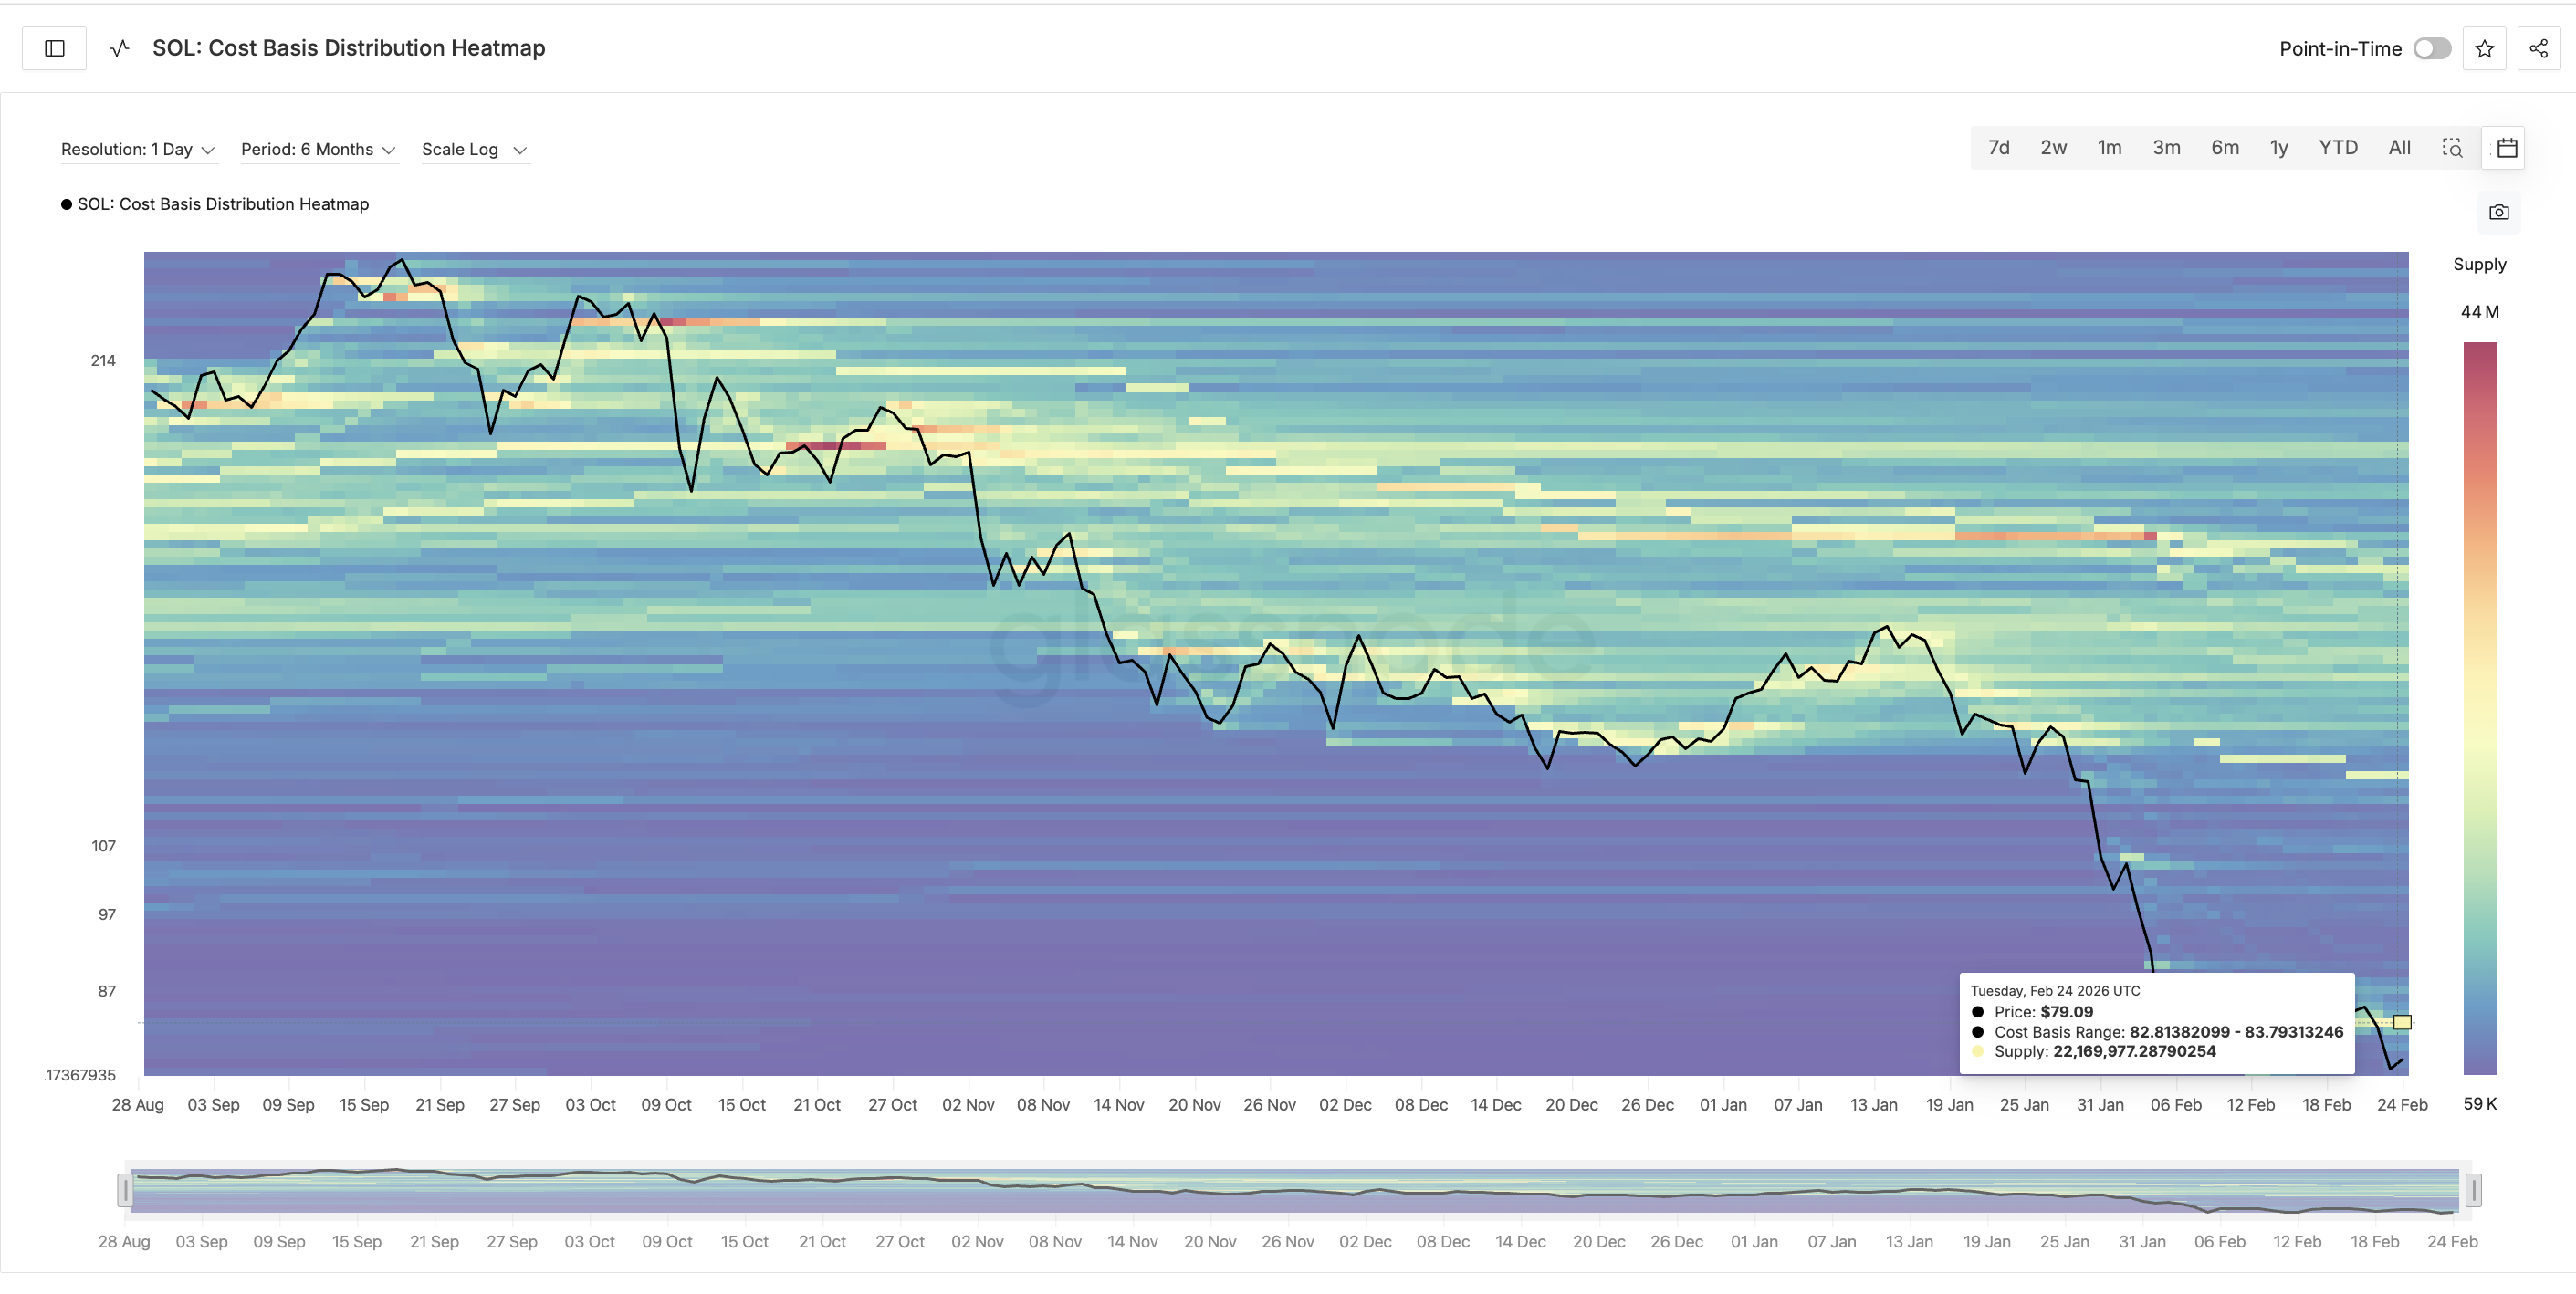
This range represents a break-even zone for many holders who bought earlier and held through the previous dips. When price returns to their entry level, these investors often sell to recover losses or reduce risk in a weaker market.
This helps explain why Solana’s rebound is already slowing near $82.91. The price is running into a large group of holders waiting to exit at break-even.
At the same time, long-term holder accumulation has already dropped by more than 60%, which means there are fewer strong buyers available to absorb this supply. This imbalance between sellers and buyers makes it harder for the rebound to continue.
Solana Price Path Still Points to a 17% Drop
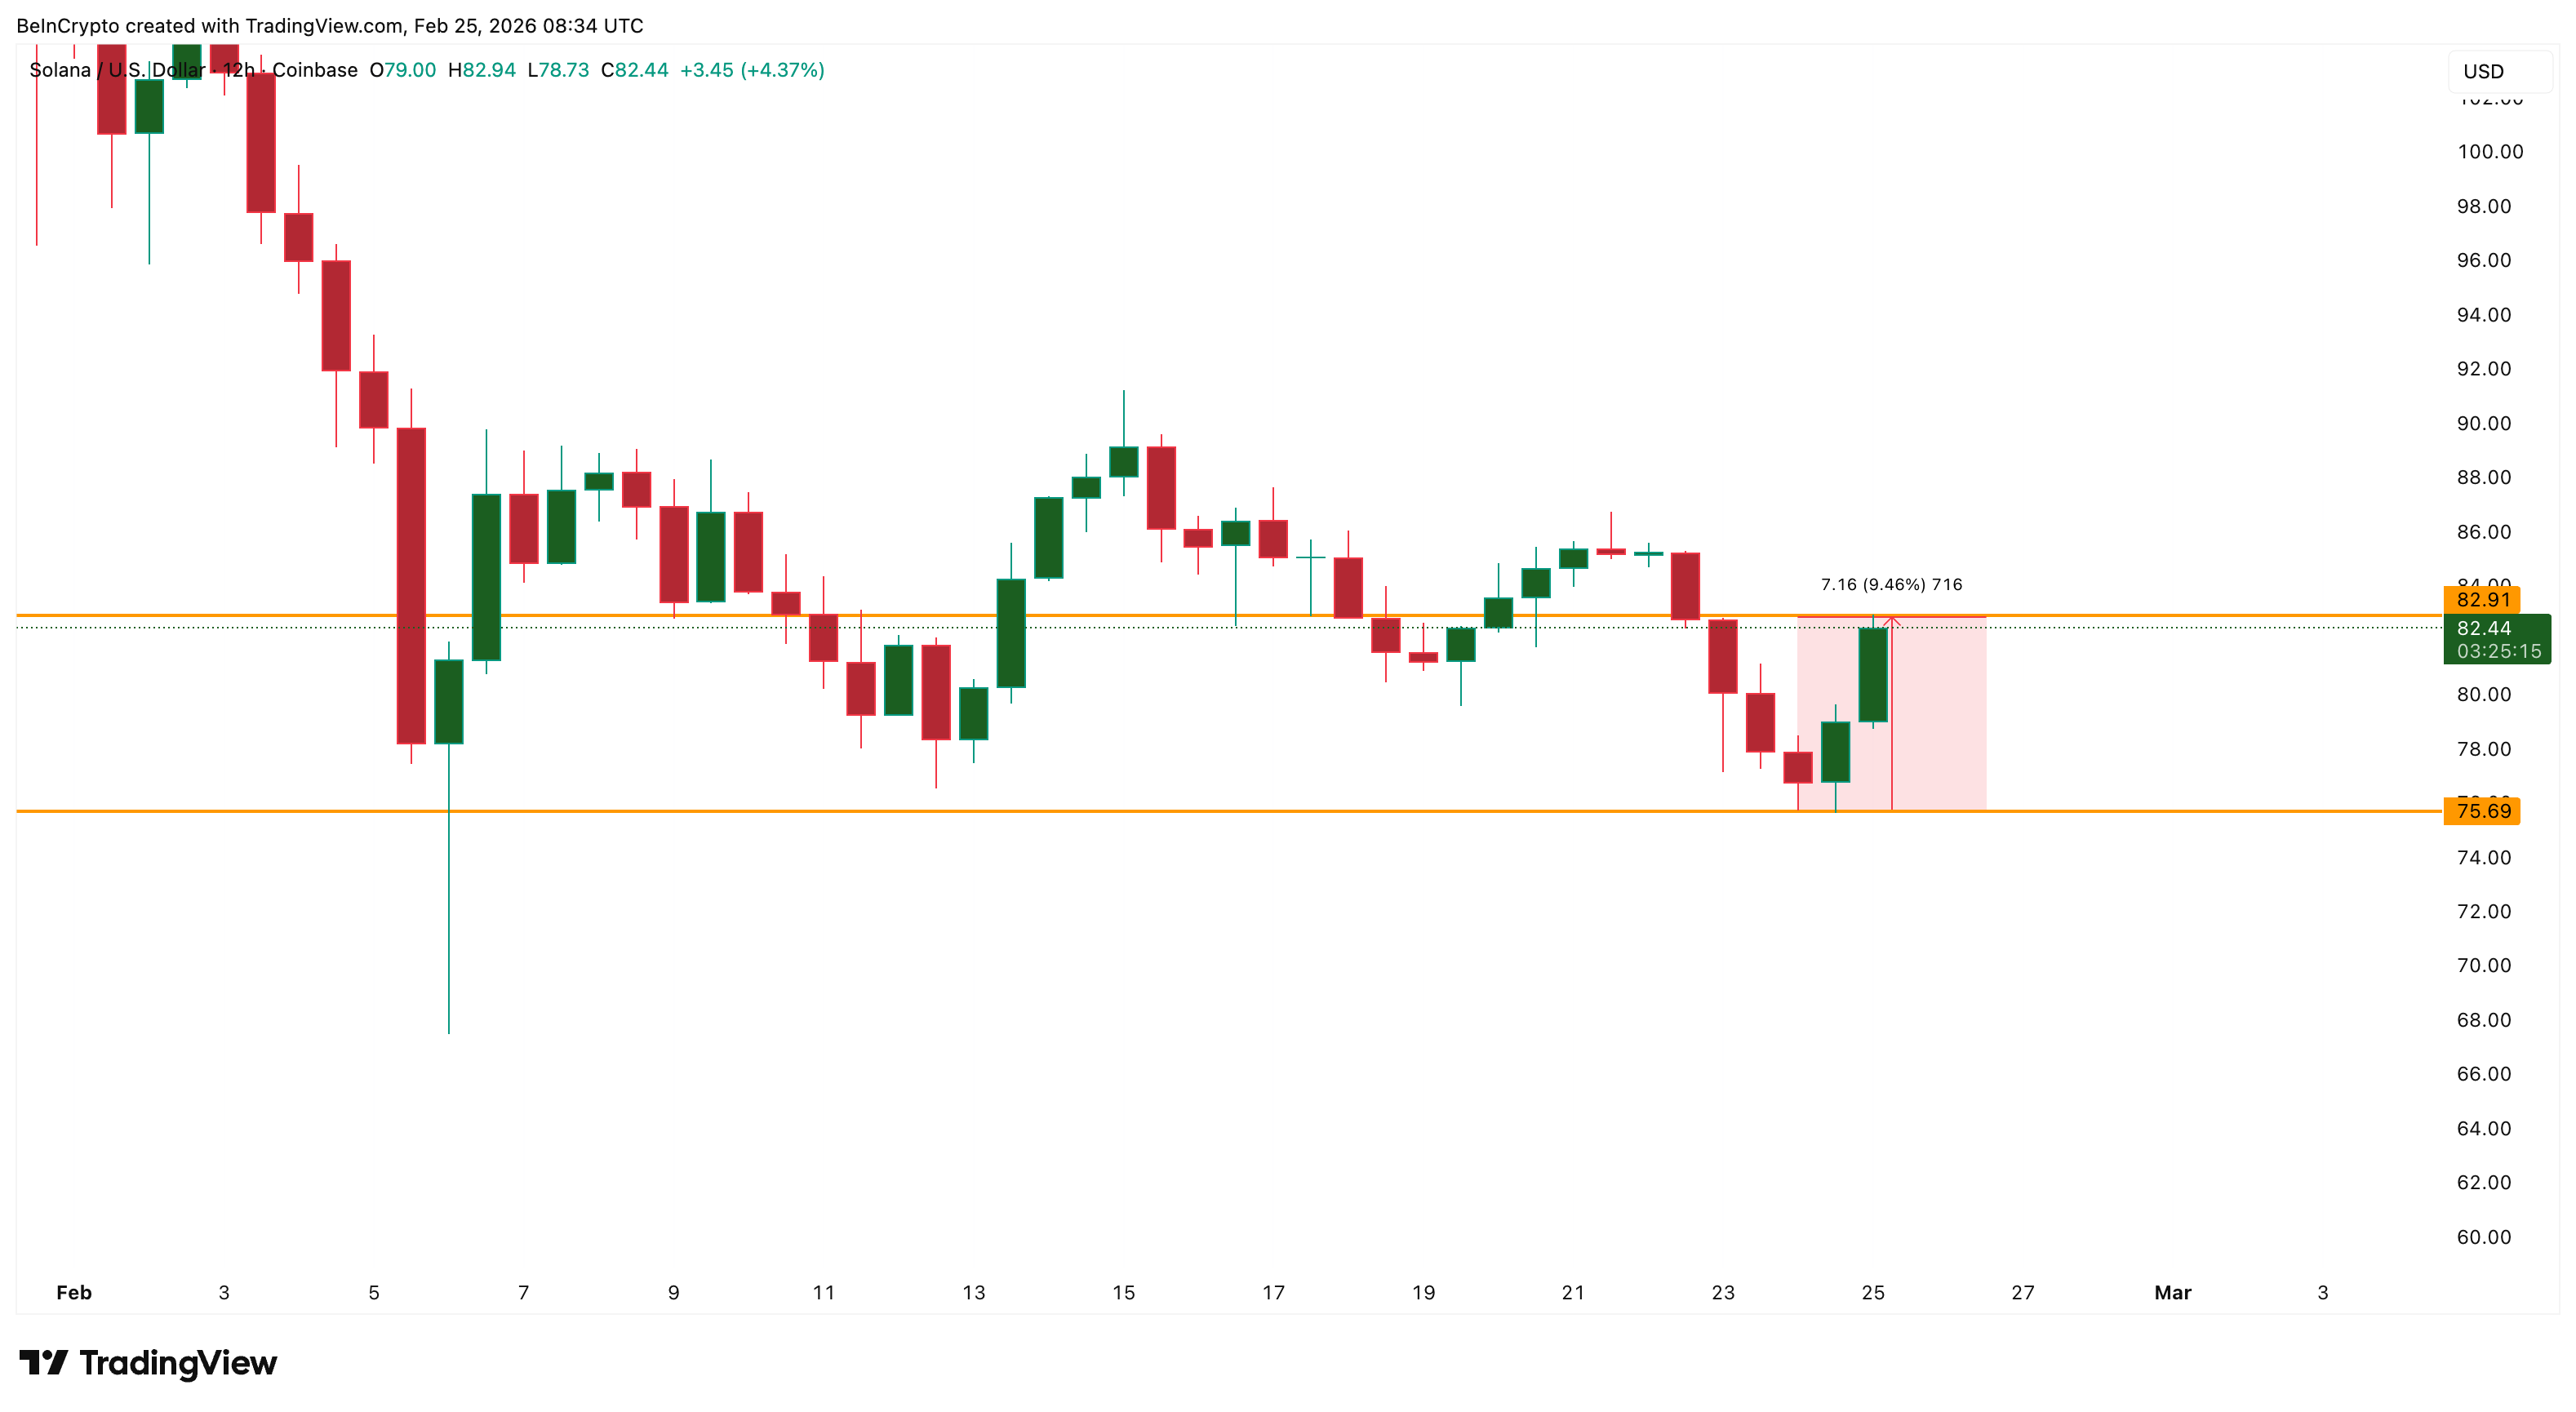
Solana’s technical structure adds another layer of risk to the current rebound. Before this bounce, Solana confirmed a bearish head-and-shoulders pattern and dropped to around $75.69.
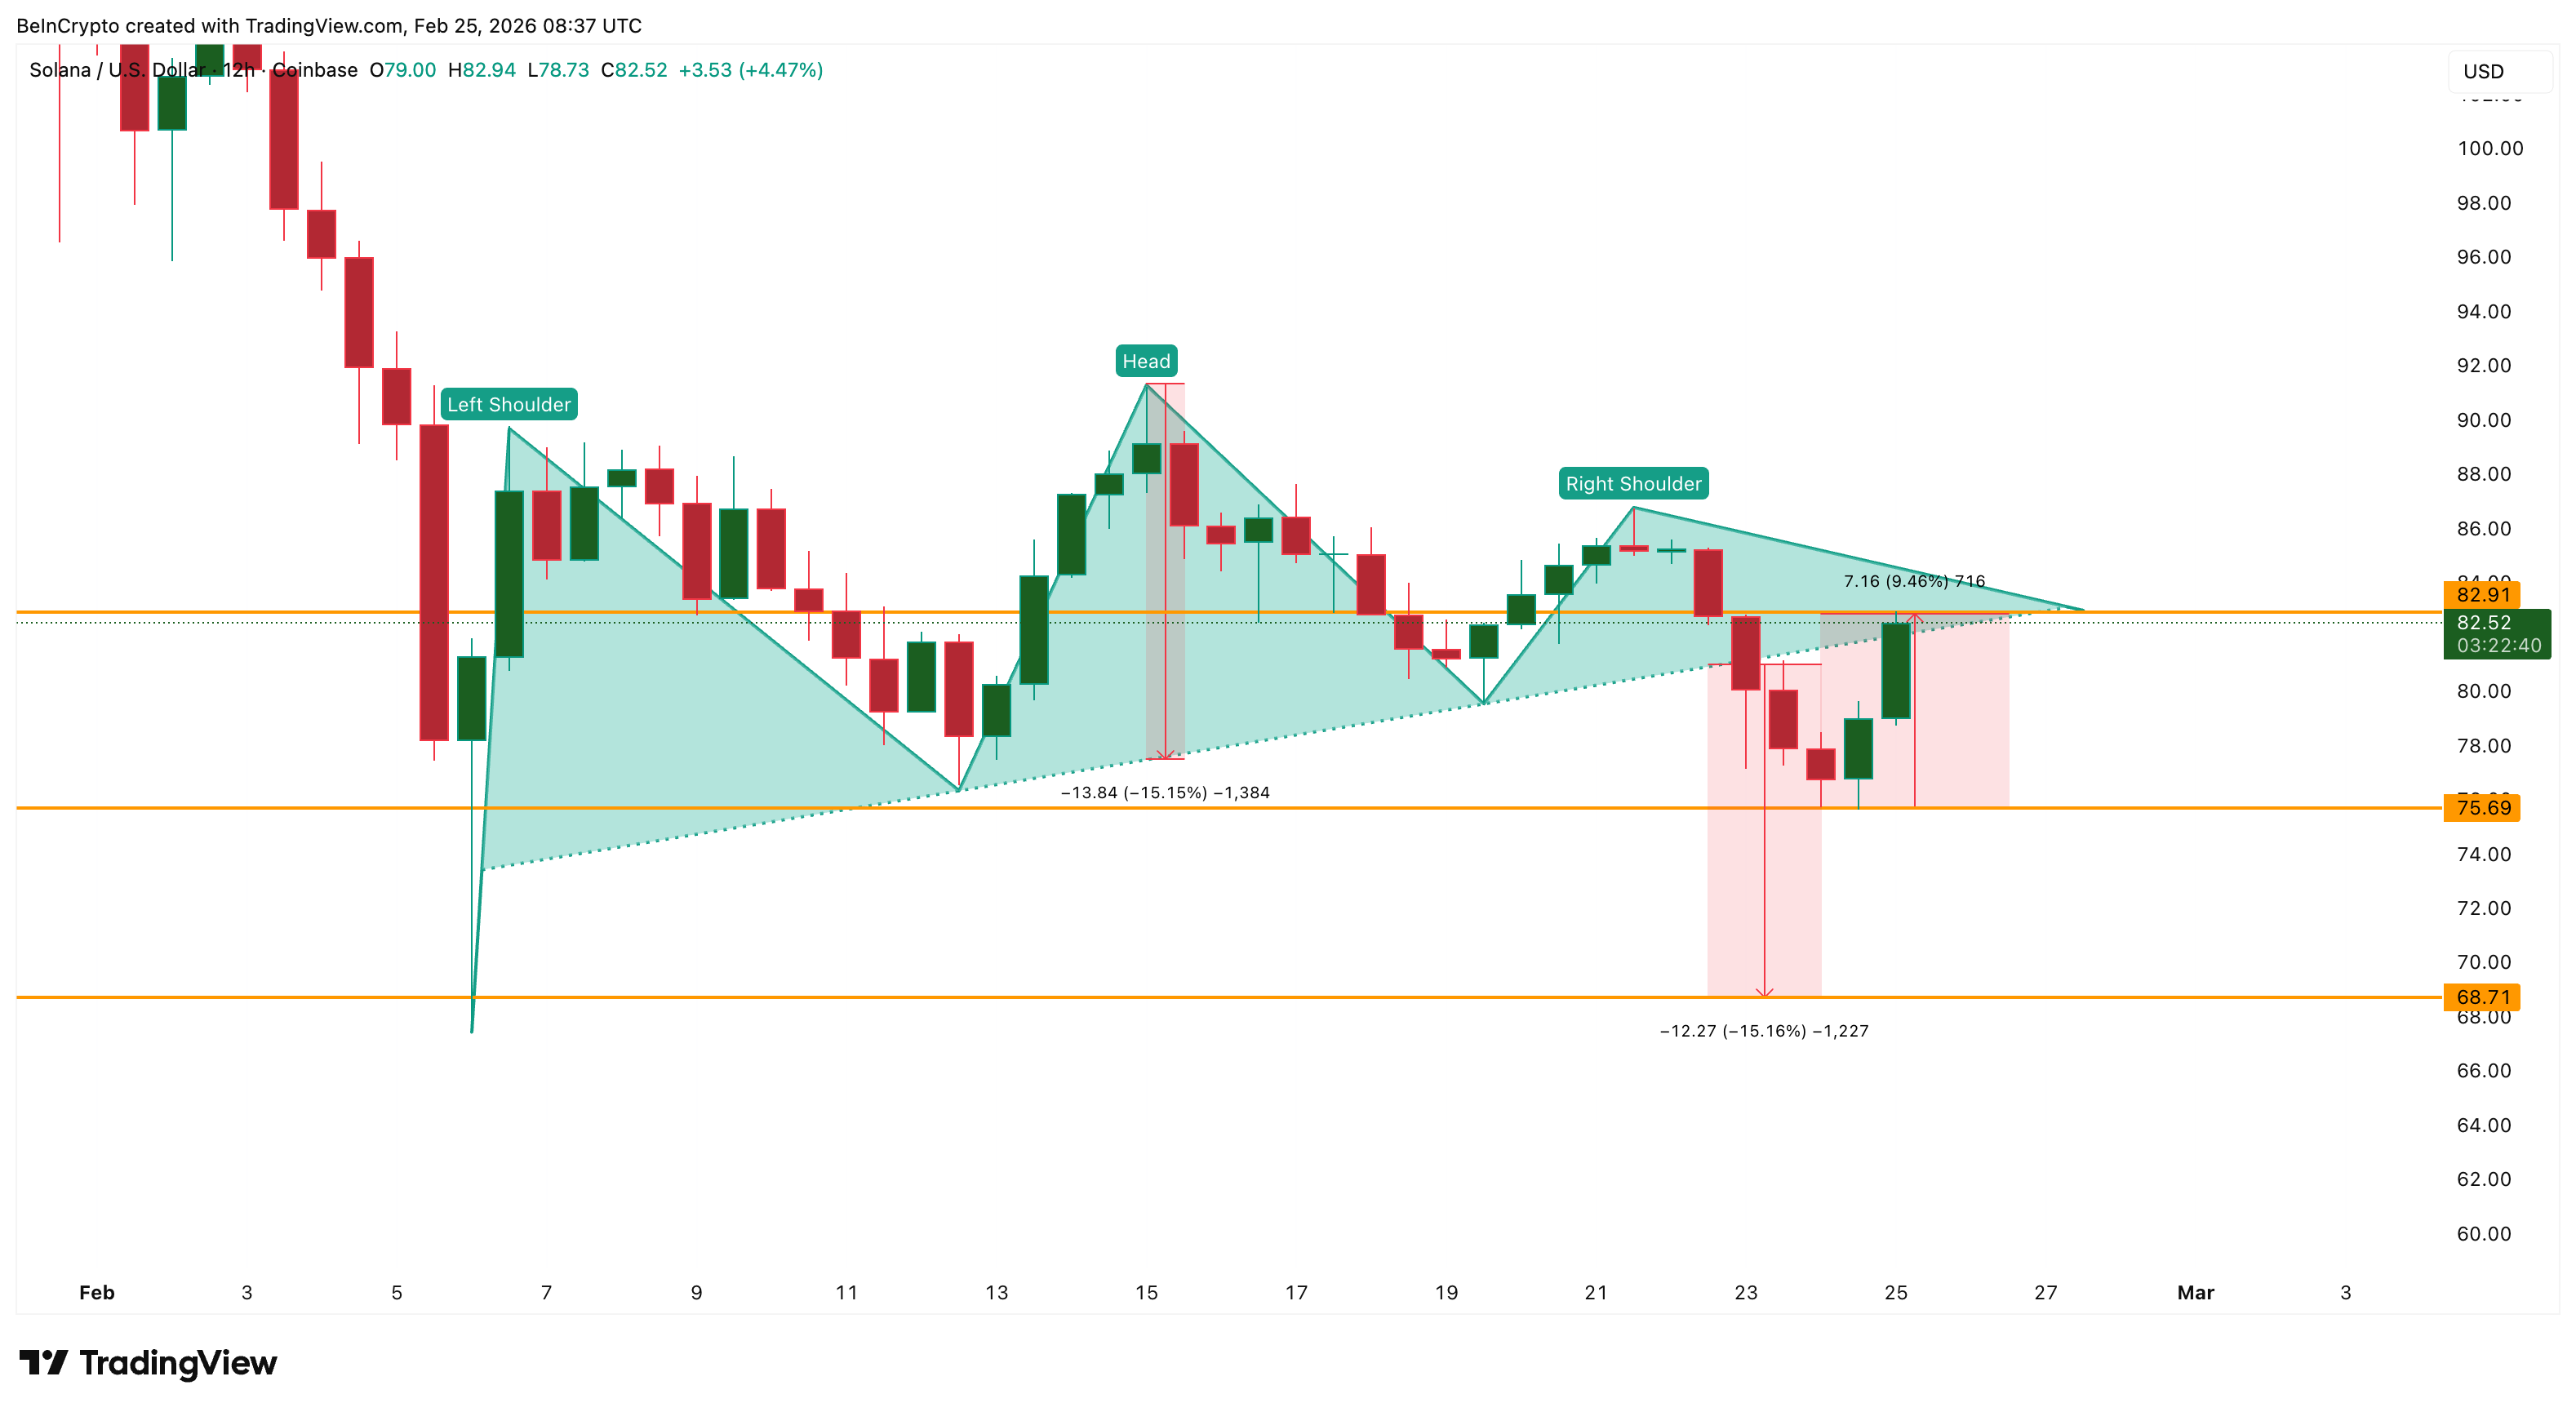
Even after the recent rebound, the projected downside target from that pattern still points toward the $68.71 region. From the current price near $82.52, a drop to $68.71 would represent an additional decline of about 17%. This means the recent 9% bounce has not yet invalidated the broader bearish structure. Moreover, Solana tried to cross the $82.91 mark but failed, largely due to the supply cluster around that level highlighted earlier.
For the recovery to strengthen, Solana must first break and hold above $82.91, which is the immediate resistance created by the supply cluster. If that level is cleared, the next resistance sits near $86.82. A move above $91.33 would fully invalidate the bearish pattern and confirm that the downtrend has ended.
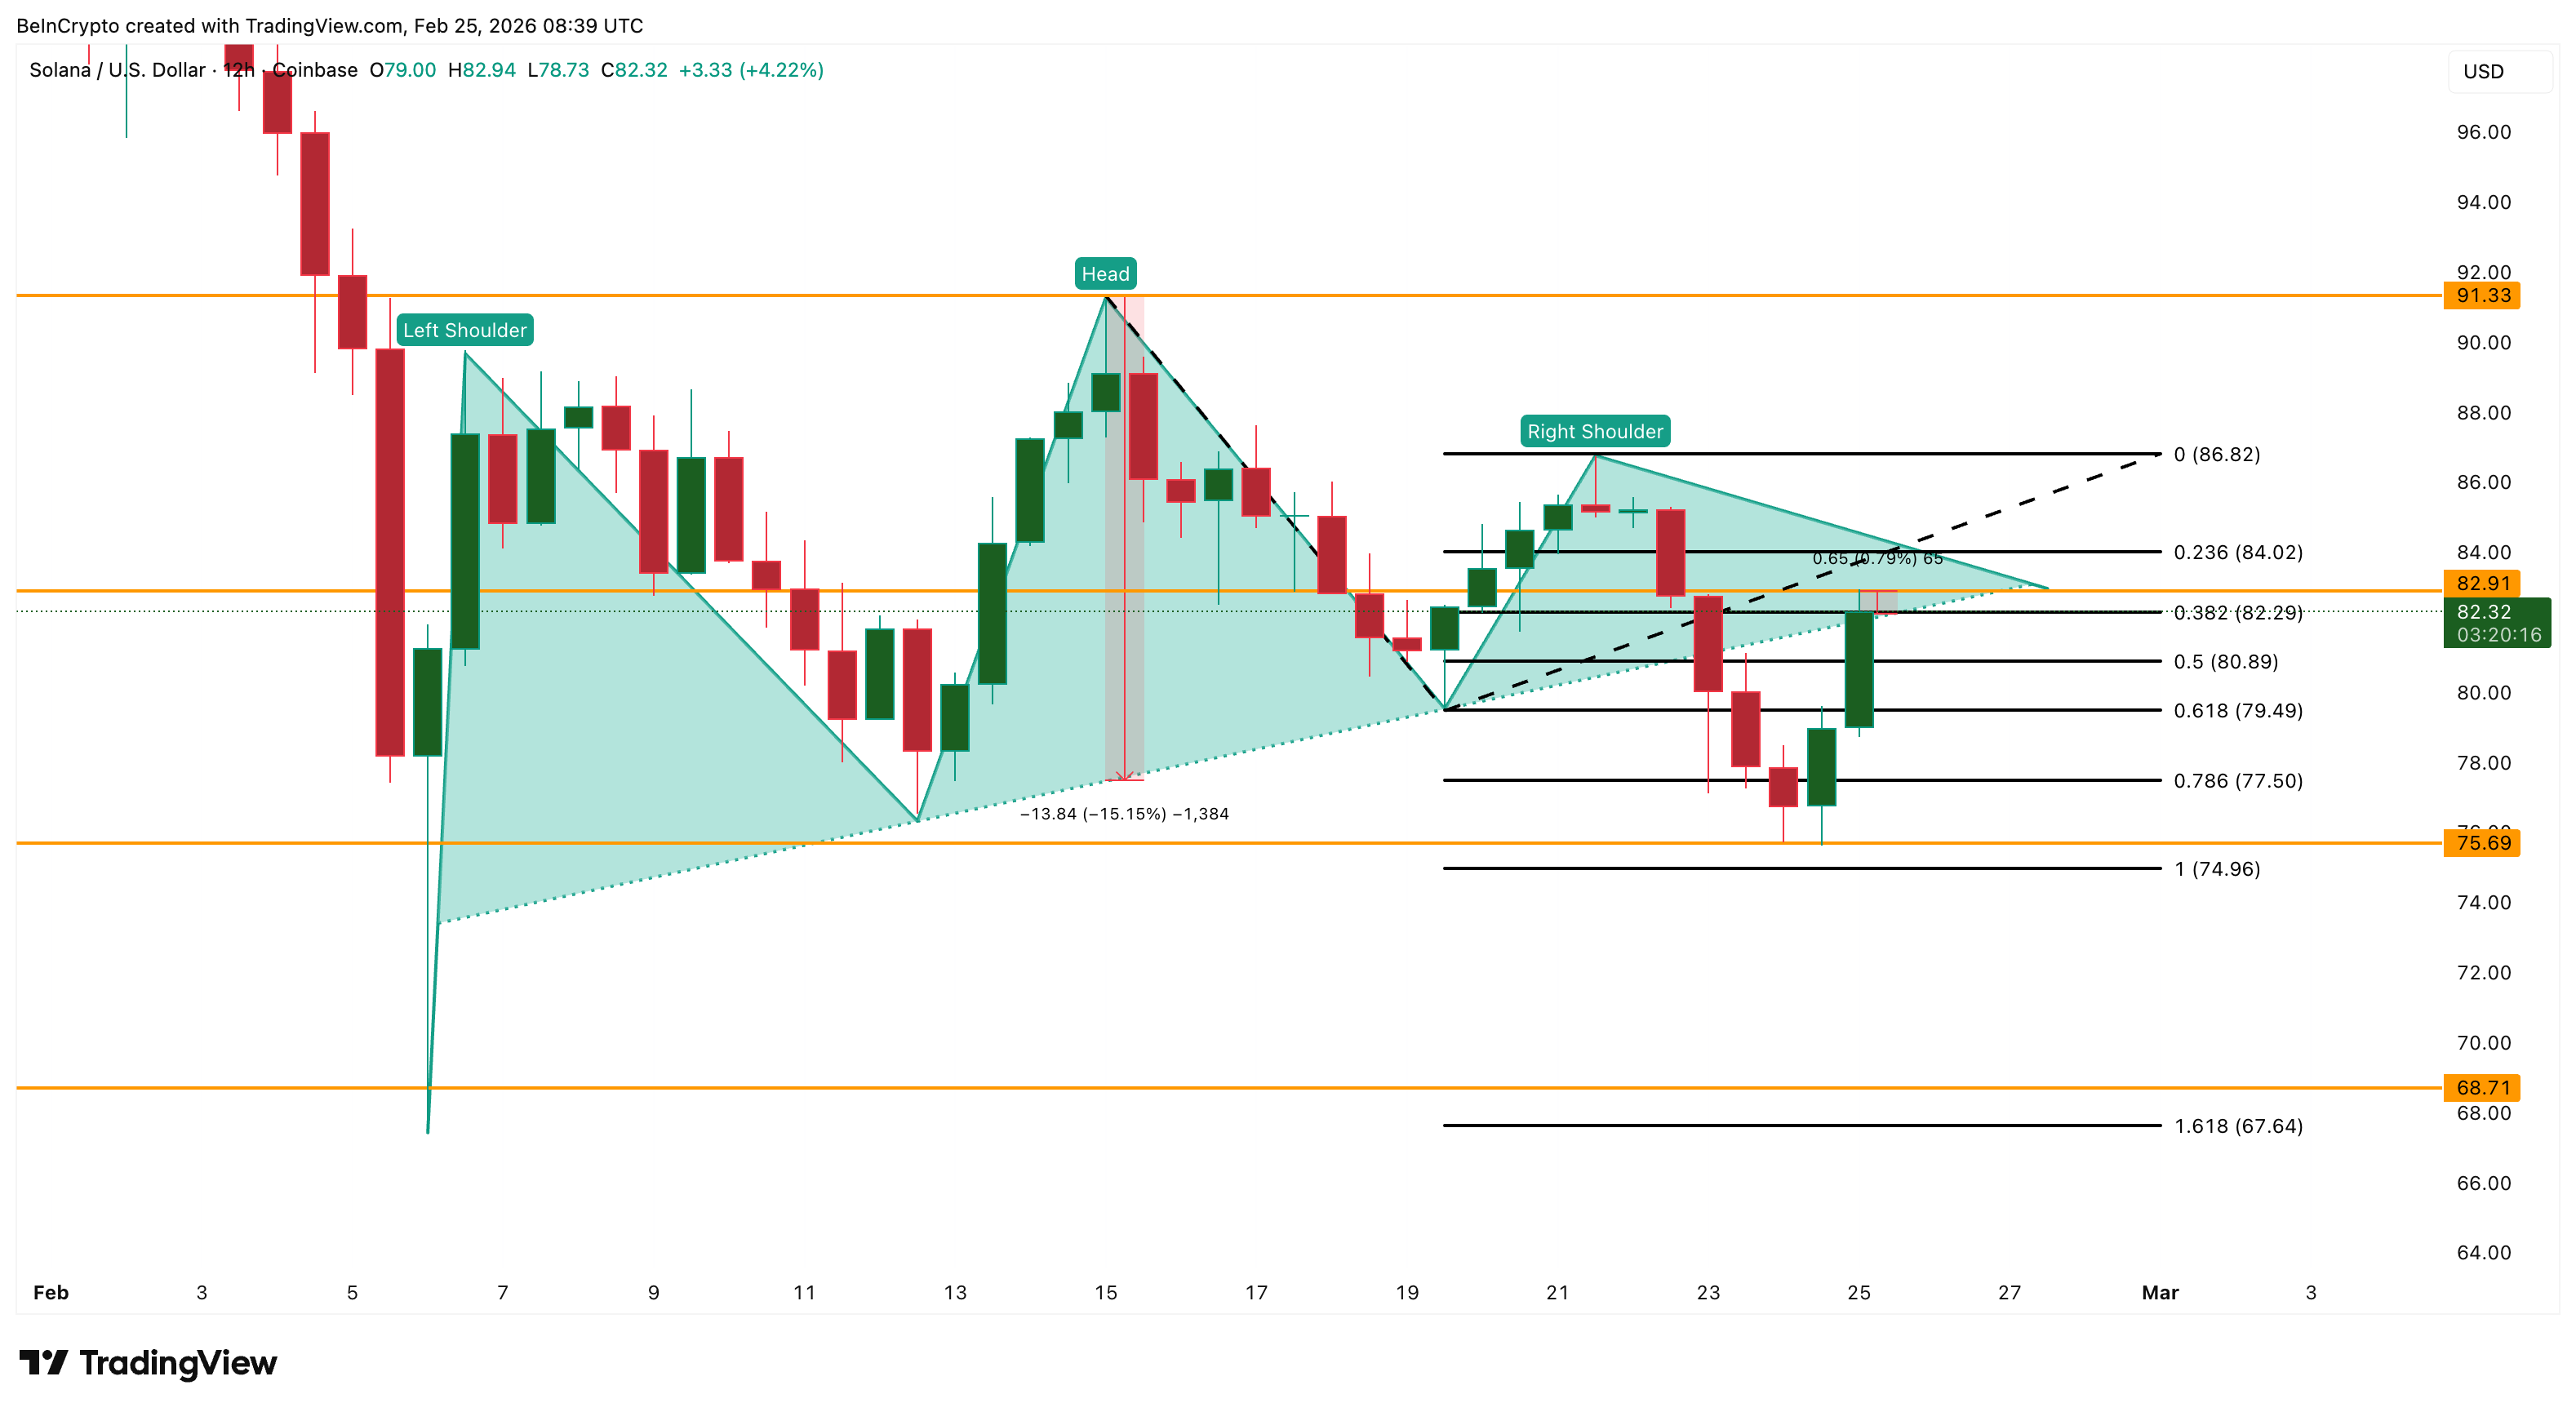
However, continued rejection at $82.91 would increase downside risk.
If Solana falls below $80.89 again, it could quickly retest $74.96. A break below that would reopen the path toward $68.71 and other lower levels, which remain the active downside projection from the bearish pattern.

Key points:
-
Bitcoin bulls have pushed the price above $69,000, signaling solid dip buying at lower levels.
-
Several major altcoins have turned up sharply, suggesting that selling pressure is reducing.
Bitcoin (BTC) bulls purchased Tuesday’s dip and are attempting to sustain the price above $69,000 on Wednesday. According to SoSoValue data, BTC exchange-traded funds recorded net inflows of $257.7 million on Tuesday, the largest inflows since Feb. 6. That suggests investors are viewing the dips near $60,000 as a buying opportunity.
Santiment said in a post on X that BTC’s correlation with stocks has broken down in the past six months. The S&P 500 rose 7% during the period, while BTC fell 43%. However, the on-chain data provider added that the disconnection is unlikely to stay forever. If BTC follows its historical pattern of tracking equities during economic expansions, then “it may have significant room to catch up.”

Not everyone is bullish on BTC’s prospects in the short term. Glassnode said in a post on X that BTC’s realized profit/loss ratio (90-day moving average) slipped below 1. Historically, breaks below 1 have resulted in at least six months of loss realization before the level was reclaimed.
Could BTC and select major altcoins break above their overhead resistance levels? Let’s analyze the charts of the top 10 cryptocurrencies to find out.
Bitcoin price prediction
BTC has risen sharply from the $62,510 level on Tuesday, indicating that the bulls are vigorously defending the $60,000 level.

Buyers will attempt to thrust the Bitcoin price above the 20-day exponential moving average ($69,375). If they succeed, the BTC/USDT pair may rally to the breakdown level of $74,508, where the bears are again expected to mount a strong defense.
Sellers will have to successfully defend the 20-day EMA if they want to retain the advantage. If the price turns down sharply from the 20-day EMA, the $60,000 support may be at risk of breaking down. If that happens, the pair may plummet to $52,500.
Ether price prediction
Ether (ETH) turned up from the $1,800 level on Tuesday, indicating that the bulls are attempting to retain the price inside the $1,750 to $2,111 range.

The relief rally is expected to face selling at the $2,111 level. If the Ether price turns down sharply from $2,111, the ETH/USDT pair may extend its stay inside the range for a few more days.
Alternatively, if buyers propel the price above the $2,111 level, it suggests that the bears are losing their grip. The pair may then surge to the 50-day SMA ($2,540), where the bears are again expected to step in.
XRP price prediction
XRP (XRP) turned up sharply and has reached the 20-day EMA ($1.46), indicating that the bulls are attempting a comeback.

If the XRP price closes above the 20-day EMA, the XRP/USDT pair may rally to the 50-day SMA ($1.70) and eventually to the downtrend line. Buyers will have to clear the hurdle at the downtrend line to signal a potential trend change.
Sellers are likely to have other plans. They will attempt to defend the moving averages and pull the price below the support line. If they can pull it off, the pair may nosedive to the Feb. 6 low of $1.11 and then $1.
BNB price prediction
BNB (BNB) has risen sharply from $577, indicating that the bulls are aggressively defending the $570 level.

Buyers will have to swiftly drive the price above the 20-day EMA ($641) to strengthen their position. If they manage to do that, the BNB/USDT pair may rise to $669 and eventually to $730.
Contrary to this assumption, if the BNB price turns down and breaks below $570, it indicates that the bears are in control. The pair may then resume the downtrend toward the psychological level at $500.
Solana price prediction
Solana (SOL) dipped below the $76 support on Tuesday, but the bears could not maintain the lower levels.

The SOL/USDT pair is attempting a recovery, which is expected to face selling at the 20-day EMA ($87). If the price turns down sharply from the 20-day EMA, the possibility of a break below the $76 level increases. The Solana price may then tumble to the Feb. 6 low of $67.
Instead, if bulls push the price above the 20-day EMA, the relief rally may reach the $95 level. This is a crucial level to watch out for, as a close above $95 suggests that the bulls are back in the game. The pair may then rally toward $117.
Dogecoin price prediction
Dogecoin (DOGE) turned up sharply from the $0.09 level, and the bulls are attempting to drive the price above the 20-day EMA ($0.10).

Sellers are unlikely to give up easily and will strive to defend the 20-day EMA. If the Dogecoin price turns down from the 20-day EMA, it increases the likelihood of a drop to the $0.08 support. Buyers are expected to fiercely defend the $0.08 level, as a close below it may start the next leg of the downtrend to the $0.06 level.
Buyers will have to maintain the price above the 20-day EMA to indicate that the bears are losing their grip. The DOGE/USDT pair may then march toward the breakdown level of $0.12.
Bitcoin Cash price prediction
Bitcoin Cash (BCH) turned down sharply from the 50-day SMA ($564) and fell below the $500 support on Monday.

The 20-day EMA has started to turn down, and the RSI is in the negative territory, indicating an advantage to the bears. That suggests the relief rally to the 20-day EMA is likely to be sold into. If the Bitcoin Cash price turns down from the 20-day EMA, the possibility of a drop to the $443 level increases.
The first sign of strength will be a close above the moving averages. The BCH/USDT pair may then rise to $580 and subsequently to $600.
Related: Bitcoin price climbs 3% as gold divergence signals ‘significant upside’
Hyperliquid price prediction
Hyperliquid (HYPE) fell below the 50-day SMA ($28.10) on Monday, indicating that the bears are attempting to take charge.

Buyers are striving to push the price back above the moving averages but are likely to face stiff resistance from the bears. If the Hyperliquid price turns down from the moving averages, the HYPE/USDT pair may drop to the solid support at $20.82.
Contrarily, if the price closes above the 20-day EMA ($29.31), it suggests buying at lower levels. The pair may then ascend to $32.50 and later to the stiff resistance at $36.77. The next trending move is expected to begin on a close above $36.77 or below $20.82.
Cardano price prediction
The bears failed to pull Cardano (ADA) to the support line of the descending channel pattern, indicating a lack of selling at lower levels.

The buyers are attempting to make a comeback by sustaining the Cardano price above the 20-day EMA ($0.28). If they manage to do that, the ADA/USDT pair might rally to the downtrend line.
If the price turns down sharply from the downtrend line and breaks below the 20-day EMA, it suggests that the pair may remain inside the channel for a while. The bulls will have to secure a close above the downtrend line to gain the upper hand.
Monero price prediction
Monero (XMR) fell below the immediate support at $309 on Monday, but the bears could not sustain the lower levels.

The bulls are attempting a relief rally, which is expected to face selling at the 20-day EMA ($346) and then at the breakdown level of $360. If the Monero price turns down from the overhead resistance, it suggests a range-bound action between $360 and $300 for some time.
The advantage will tilt in favor of the bulls if they push and maintain the XMR/USDT pair above the $360 level. If they do that, the pair may surge toward the 50-day SMA ($435).
This article does not contain investment advice or recommendations. Every investment and trading move involves risk, and readers should conduct their own research when making a decision. While we strive to provide accurate and timely information, Cointelegraph does not guarantee the accuracy, completeness, or reliability of any information in this article. This article may contain forward-looking statements that are subject to risks and uncertainties. Cointelegraph will not be liable for any loss or damage arising from your reliance on this information.


Nicholas Hammer, co-founder and CEO of crypto lender Blockfills, has stepped down from his leadership role, according to a person with direct knowledge of the matter.
The firm’s website now lists Joseph Perry as the interim CEO. A company spokesperson confirmed that Hammer was CEO until July 2025.
The change of leadership comes as the firm has suffered losses of around $75 million and suspended client deposits and withdrawals earlier this month.
Blockfills is also said to have urged some clients to withdraw their crypto assets before the platform halted deposits and withdrawals on Feb. 11, the person said, who spoke on condition of anonymity as the matter is private. Customer deposits remain suspended as of publication time.
CoinDesk reported last week that the Chicago-based firm was seeking a buyer after the losses.
Hammer did not respond to a request for comment by the publication time. His LinkedIn profile, as of 5.58 pm UTC on Feb. 25, still lists him as CEO of Blockfills.
The firm said in the Feb. 11 press release that it was working with investors and clients to reach a swift resolution and restore liquidity to the platform.
“Clients have been able to continue trading with BlockFills for the purpose of opening and closing positions in spot and derivatives trading and select other circumstances,” the company said at the time.
Blockfills’ abrupt halt to withdrawals revives memories of the 2022 crypto winter, when firms including Celsius, BlockFi and Genesis froze customer accounts as markets unraveled.
The market has struggled to regain traction in early 2026, with major tokens well below recent highs amid cautious sentiment. Bitcoin has remained below $70,000 after a sharp pullback from its late-2025 all-time high, while ether (ETH) trades around $2,000 amid weakness across the digital asset market.
The company said it handled more than $60 billion in trading volume in 2025, up 28% from a year earlier, and ranks among the most active institutional crypto lending and borrowing desks. It serves roughly 2,000 institutional clients, including hedge funds, asset managers and mining firms.
Blockfills is backed by investors including Susquehanna Private Equity Investments, CME Ventures, Simplex Ventures, C6E and Nexo. The company raised $37 million in a January 2022 Series A funding round.
Read more: Susquehanna-backed Blockfills up for sale after $75 million lending loss
UPDATE (Feb. 25, 6 pm UTC): Updates story with the company’s comment on the CEO’s departure.
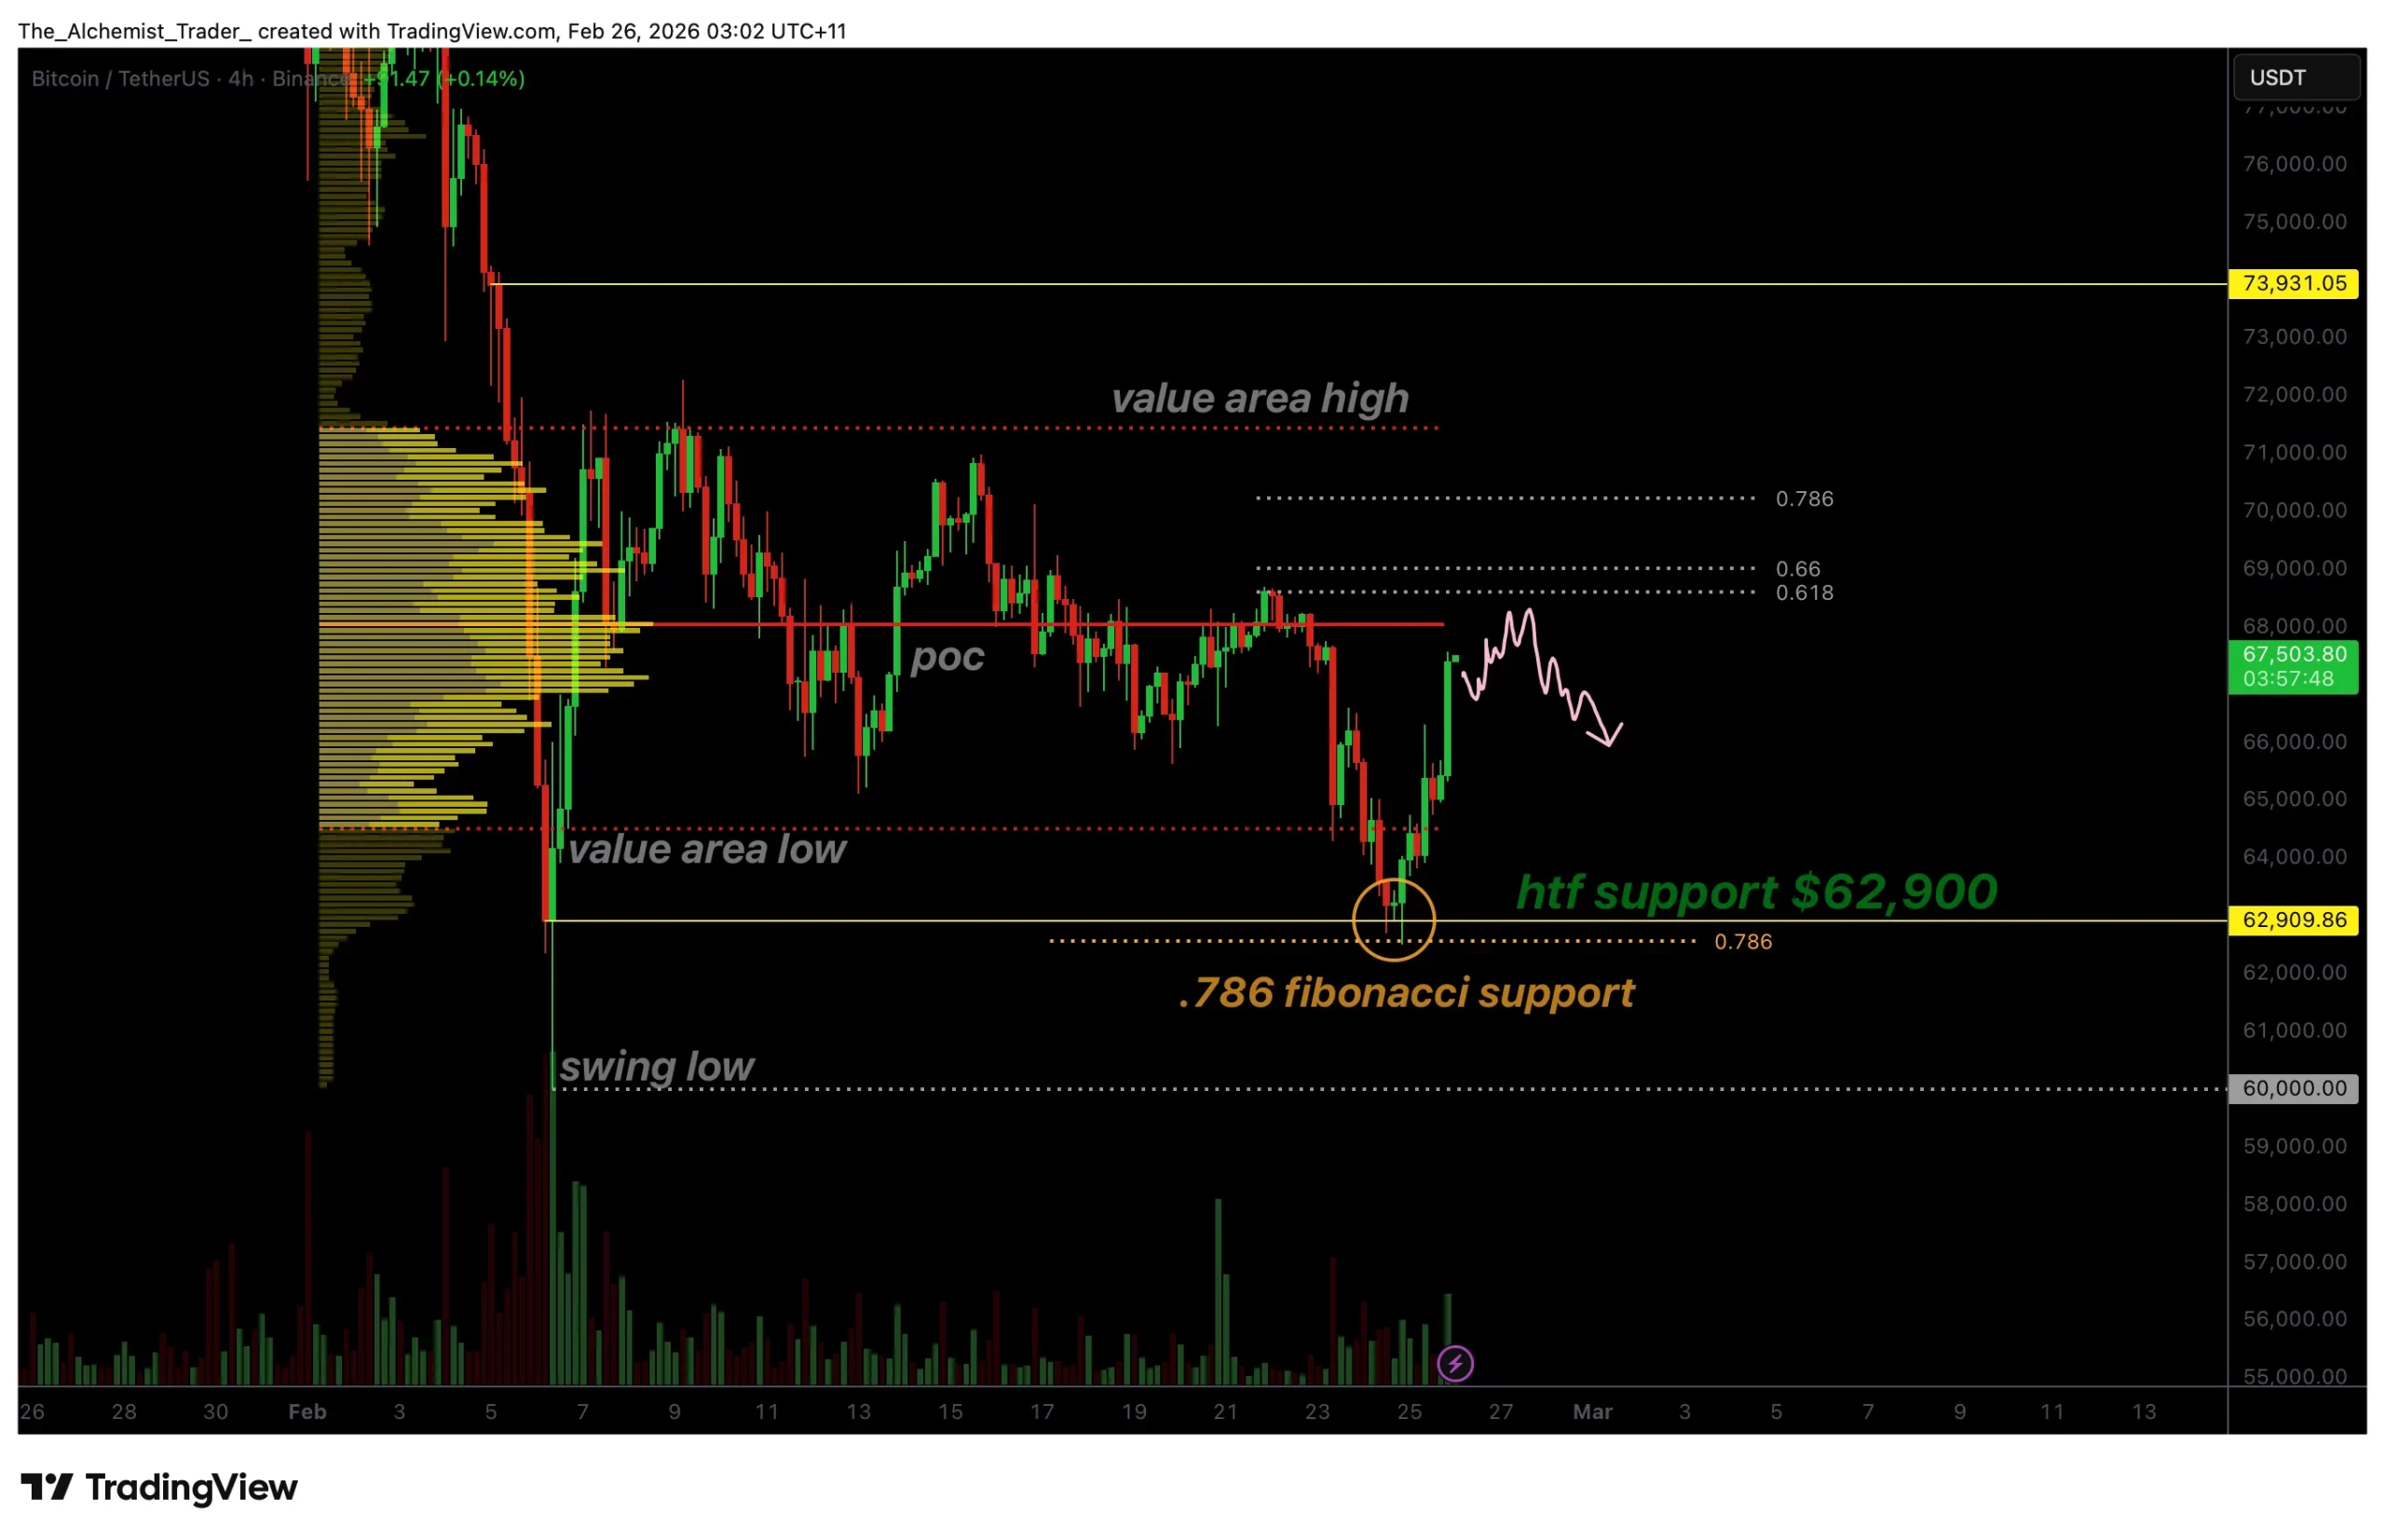
Bitcoin price has rebounded strongly from key Fibonacci support near $62,000 with rising volume, signaling growing demand and raising the possibility of a local bottom formation.
Summary
- Bitcoin bounced from 0.786 Fibonacci support near $62K
- Increasing volume suggests genuine buyer demand
- Reclaim of point of control needed to confirm bullish continuation
Bitcoin (BTC) price action has shifted momentum following an impulsive reaction from a major technical support zone. After testing the 0.786 Fibonacci retracement level, which aligns closely with daily high-timeframe support near $62,000, Bitcoin staged a strong rally that has drawn renewed attention from market participants.
The reaction from this level stands out not only because of the price recovery itself but also due to a noticeable increase in trading volume. In technical analysis, rebounds supported by expanding volume often suggest genuine demand rather than temporary relief rallies. This has led traders to question whether Bitcoin may be forming a local bottom within its broader range structure.
While confirmation remains necessary, the current setup represents one of the more constructive technical developments seen in recent weeks.
Bitcoin price key technical points
- 0.786 Fibonacci support defended: Confluence with $62,000 daily support triggered strong reaction
- Volume expansion confirms demand: Increasing participation supports reversal thesis
- Point of control critical resistance: Reclaim required for continuation toward higher prices
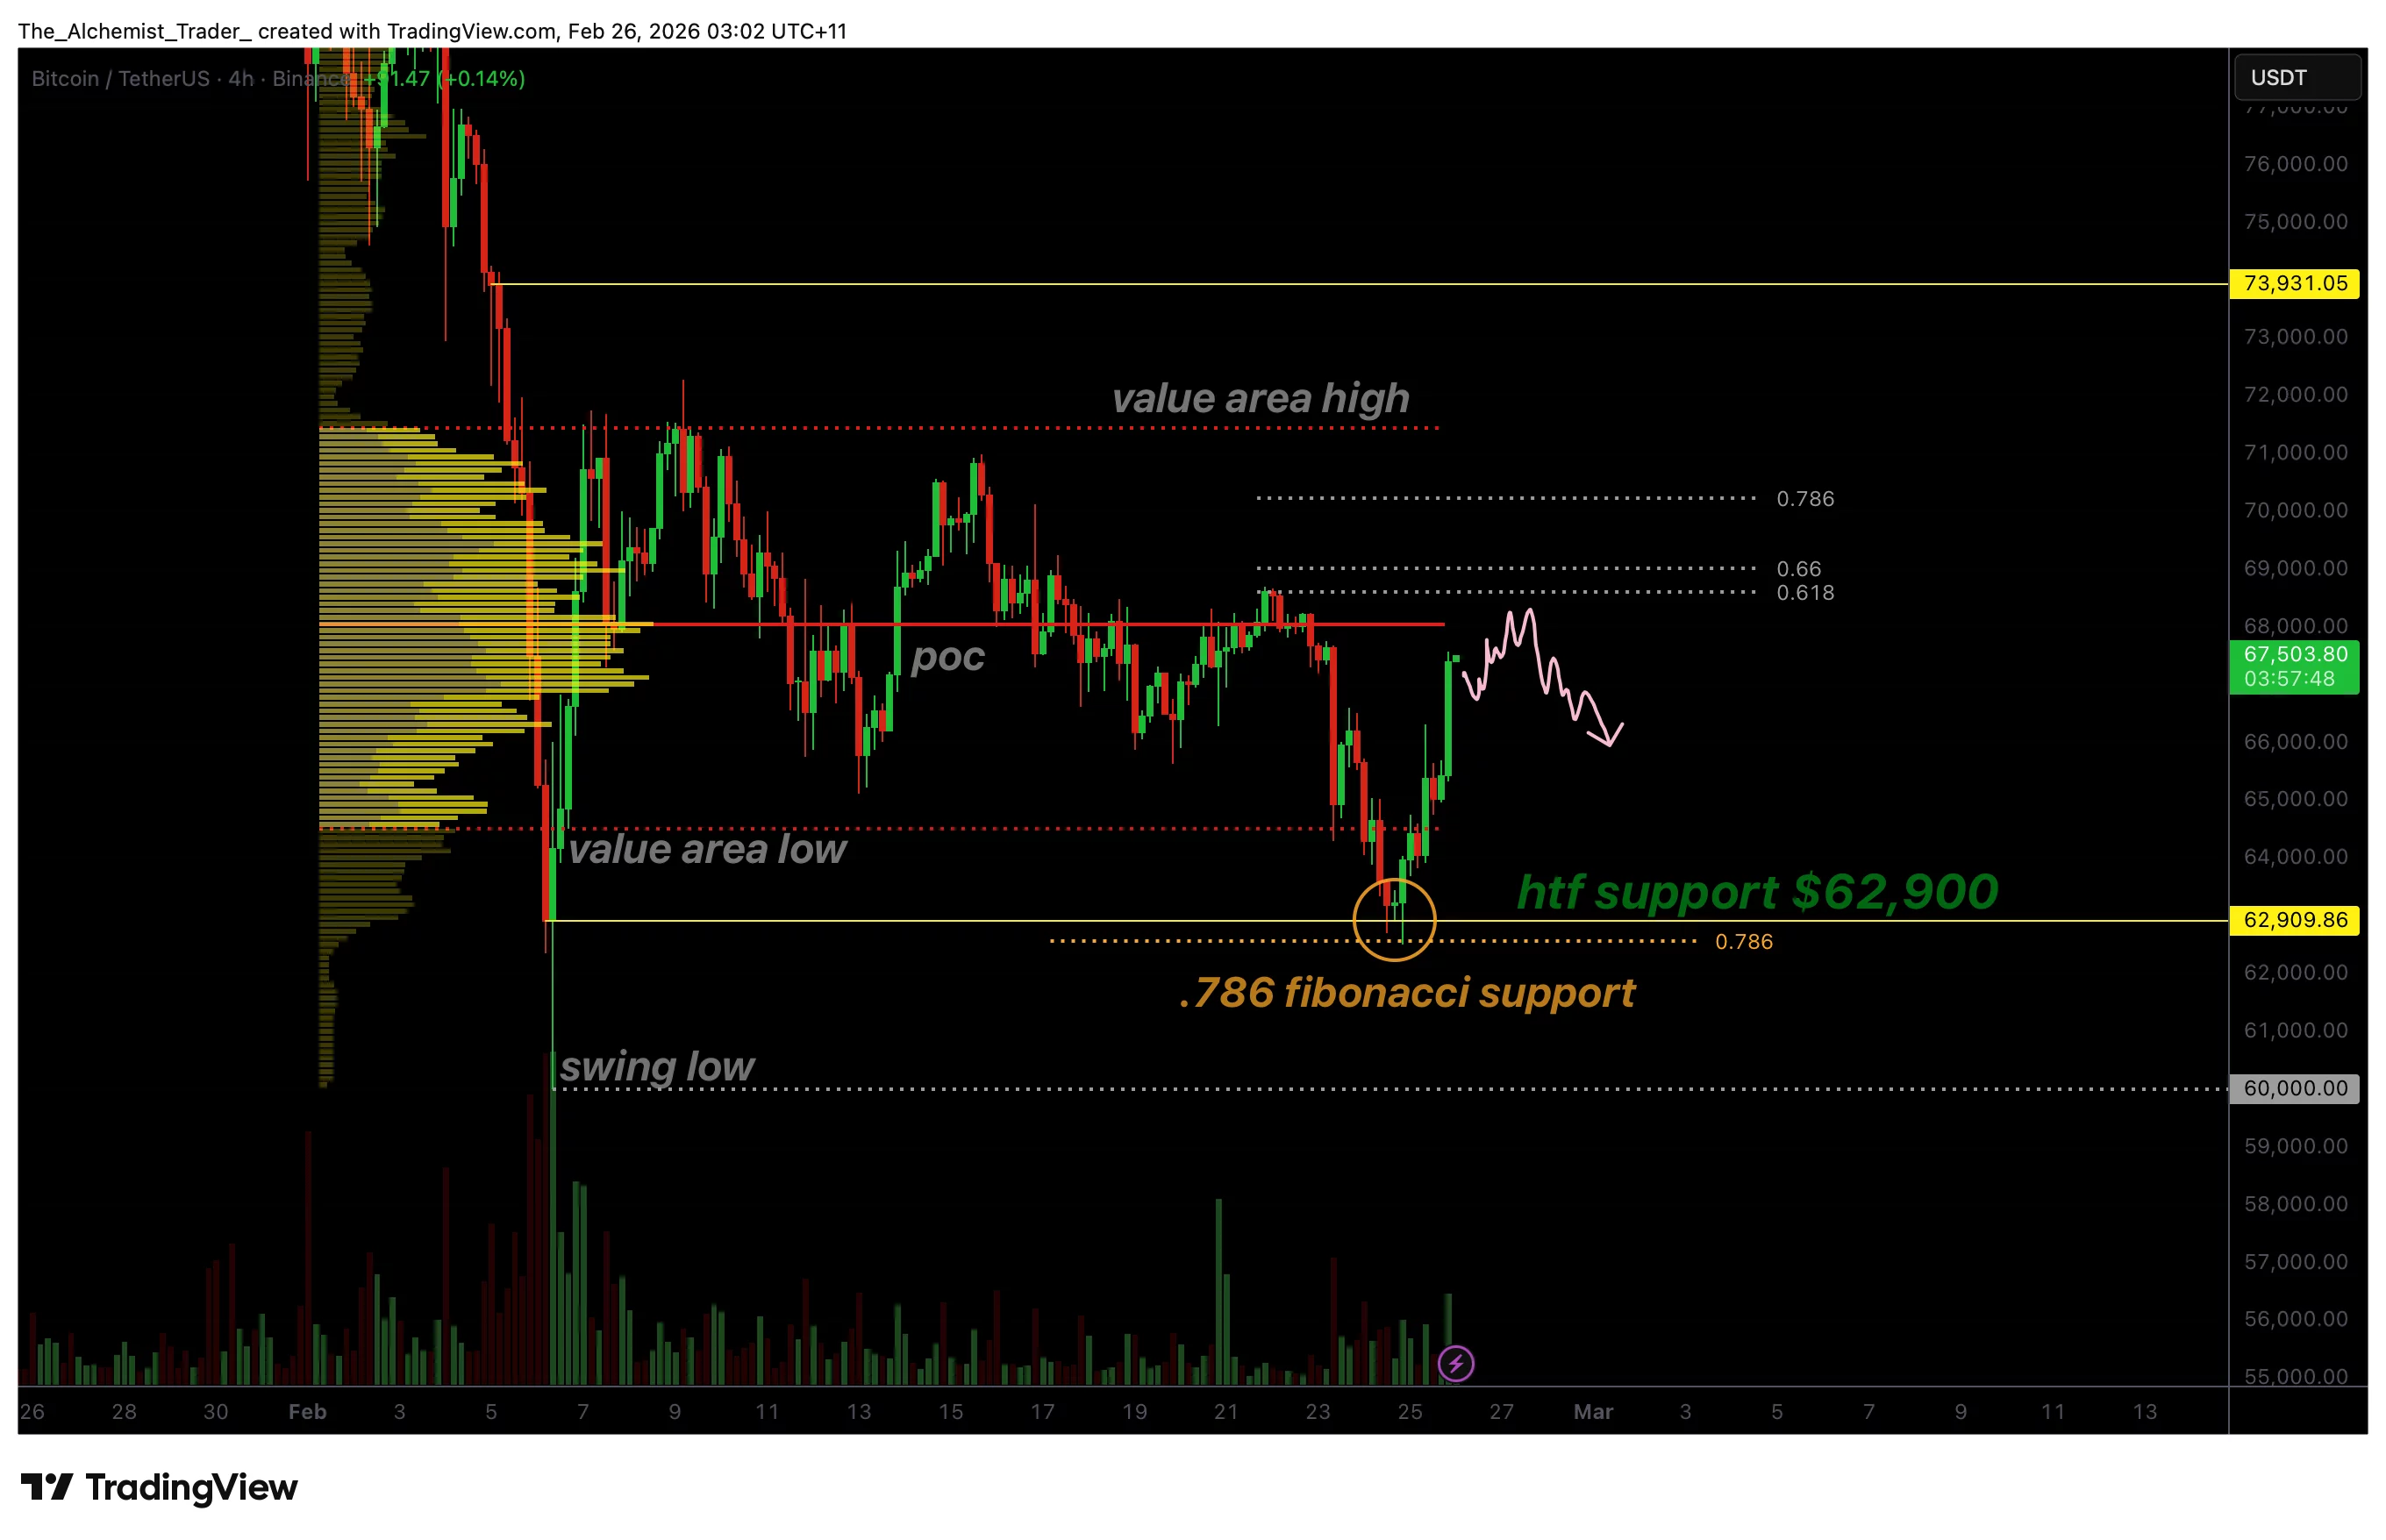
Bitcoin’s recent rally began at the 0.786 Fibonacci retracement, a deep corrective level often associated with trend continuation or major turning points. The significance of this reaction is amplified by its alignment with the daily high-timeframe support near $62,000, creating a powerful zone of technical confluence.
Markets frequently respond strongly when multiple technical levels converge. In this case, Bitcoin’s bounce suggests that buyers viewed the region as an attractive value area. Instead of continued downside expansion, price reversed sharply, indicating that selling pressure was absorbed efficiently.
The impulsive nature of the move reflects a shift in short-term market dynamics. Rather than drifting sideways, Bitcoin advanced rapidly into higher value, signaling renewed confidence among buyers.
Rising volume supports reversal narrative
One of the most important elements supporting the bullish case is the increase in volume accompanying the rally. Strong reversals are typically characterized by expanding participation, demonstrating that market participants are actively entering positions rather than merely closing shorts.
Even as broader adoption narratives continue to develop, such as Arizona lawmakers advancing legislation to create a Digital Assets Strategic Reserve Fund allowing the state to hold and invest seized cryptocurrencies.
The current volume profile shows increasing activity as price moves higher, suggesting that demand is driving the move rather than passive market conditions. This distinguishes the rally from previous bounces that lacked conviction and quickly faded.
When price rises alongside increasing volume, it often signals the early stages of a structural shift. While not definitive proof of a long-term trend reversal, it increases the probability that the recent lows may represent a local bottom.
Point of control becomes the key decision level
Despite the constructive rally, Bitcoin now faces a critical test at the point of control (POC) within the current trading range. The POC represents the price level where the highest volume has historically traded and typically acts as equilibrium between buyers and sellers.
For bullish continuation to develop, Bitcoin must reclaim this level on a daily closing basis. Acceptance above the POC would indicate that value is migrating higher, opening the door for expansion toward upper range resistance levels.
However, failure to reclaim this zone could shift the outlook quickly. Rejection at the point of control would signal that sellers remain active, potentially triggering another rotational move back toward lower support levels within the broader range.
This comes as Nakamoto finalizes a $107.3M all-stock deal with BTC Inc and UTXO to expand its Bitcoin media and treasury platform, highlighting growing institutional positioning despite fragile short-term price action.
What to expect in the coming price action
From a technical, price action, and market structure perspective, Bitcoin’s rally from the 0.786 Fibonacci support near $62,000 is a constructive development supported by increasing volume. A confirmed reclaim of the point of control on a closing basis would strengthen the bullish case and increase the probability of continuation toward higher price targets.
Conversely, rejection at this level may keep Bitcoin trading within its existing range, leading to renewed rotations toward support before a decisive breakout occurs.


US senators have labeled Binance a “repeat offender” as they prepare to launch an inquiry into nearly $2 billion worth of crypto that was sent to Iran, raising doubts over the exchange’s commitment to a plea deal agreement with the Department of Justice.
Democrat Senator Richard Blumenthal, who represents the Subcommittee on Investigations, wrote to Binance CEO Richard Teng on Tuesday, asking him to provide information on the company’s role in sanction-dodging transactions to Iranian and Russian entities.
The letter reads: “Binance appears to have ignored warnings and recommendations to prevent Iranian money laundering schemes on its cryptocurrency exchange, allowing $1.7 billion in transfers to Iran. These transactions have helped prop up Iranian-linked terrorist organizations and illicit Russian oil sales.”
Read more: Binance demands the Wall Street Journal remove ‘damaging’ article
It also claims that Binance is revisiting the crimes of its past, specifically from 2023, when it was found guilty of charges including sanction violations stemming from crypto sent to Iranian entities.
“Binance is a repeat offender: it has long been aware that the Iranian regime and its terrorist proxies use its cryptocurrency platform as a convenient and reliable means to bypass international sanctions, anti-money laundering controls, and other banking restrictions,” it reads.
Blumenthal continues, “Instead of actually preventing illicit use, Binance has sought to evade accountability and influence the White House through lobbying and a financial partnership with World Liberty Financial (WLFI).”
The letter also claims, “The scale of the newly-revealed illicit transfers uncaught until nearly two billion dollars flowed to sanctioned entities and the unexplained firing of internal investigators call into question Binance’s compliance with American sanctions and banking laws, and its 2023 agreement to resolve the previous federal investigation.”
Blumenthal backs up his allegations by noting Binance’s deep connections with the Trump family and WLFI through promotions, and the housing of 85% of WLFi’s stablecoin USD1 in Binance accounts.
All this, he says, led to a successful “influence campaign” that secured Changpeng Zhao’s pardon and the dismissal of a lawsuit against Binance.
Binance reportedly didn’t stick to compliance measures
The Wall Street Journal, Fortune, and The New York Times have all reported on two Binance clients, Hexa Whale and Blessed Trust, acting as intermediaries for Iran’s Revolutionary Corps.
These accounts allowed Iran to launder funds and trade oil outside the traditional banking system and sanctions.
Blessed Trust repeatedly raised internal alerts at the firm. When investigators eventually discovered the extent of funds going to Iran’s government, they flagged it to Binance’s top execs before they were fired weeks later.
Richard Teng has denounced the latest article published by the WSJ as “defamatory” and “damaging,” claiming it ignored the responses given by Binance’s client.
Teng demanded that the WSJ take down its article and make corrections “immediately” or else it might take “further action.”
Read more: Iran’s central bank stacked $507M USDT last year, report
Binance claimed, “While you solicited our client’s position, your failure to reflect our client’s responses is inconsistent with your ethical obligations to ‘remain fair, accurate and impartial,’ and suggests an agenda already set, which does not amount to responsible journalism.”
The crypto exchange refuted how the WSJ framed the firings, noted that it did remove the flagged accounts after they were discovered, and disputed any suggestion that Binance had some sort of access and control over the Blessed account.
Blumenthal wants Binance to cough up documents
Blumenthal’s inquiry has ordered Binance to submit a trove of documents related to the dubious accounts, the internal reports filed by compliance investigators, use of Binance by Iranians, the use of Tether and USD1 in connection to criminals, Binance’s use in illegal oil sales, and details regarding the firing of its investigators.
Got a tip? Send us an email securely via Protos Leaks. For more informed news and investigations, follow us on X, Bluesky, and Google News, or subscribe to our YouTube channel.

As the cryptocurrency market navigates a challenging period, Google Trends data shows a notable shift in crypto-related search behavior during the prolonged bear market.
While price charts reflect a gloomy atmosphere, a new wave of interest is quietly forming. This trend could create a pivotal shift for the market’s next cycle.
Diverging Retail Investor Sentiment Toward the Crypto Market
Google Trends data shows a sharp surge in negative and extreme search keywords. Phrases such as “Bitcoin to zero” and “Bitcoin is dead” are experiencing record growth.
People who question Bitcoin’s existence demonstrate they already have some awareness of the asset. However, they have not experienced the market long enough to understand how Bitcoin has navigated previous bear market cycles.
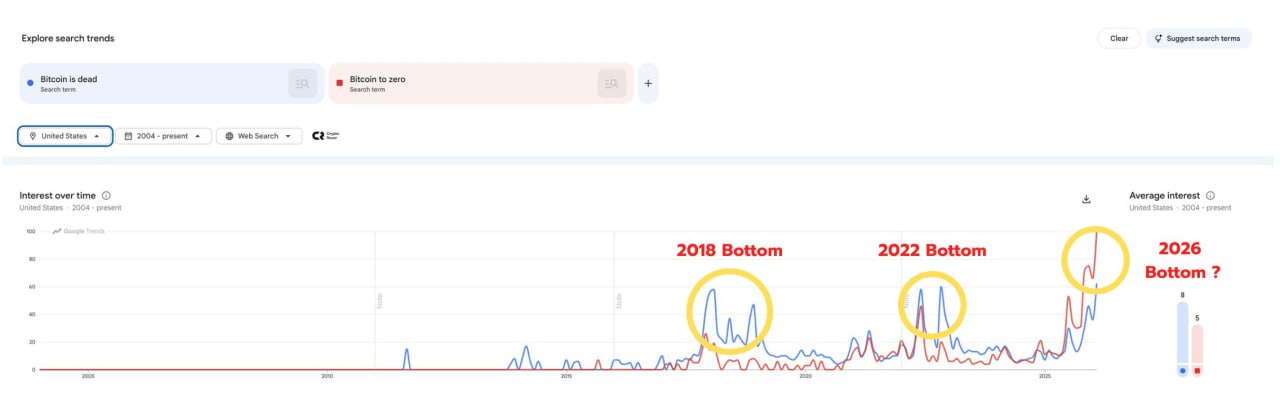
More experienced investors often compare current conditions with historical data. They observe that periods when negative search trends peak at such high levels frequently signal a potential cycle bottom.
Investor NoName notes that these search queries are twice as high as in previous bear markets. They even exceed levels recorded during the COVID period.
“Buy Bitcoin every time ‘Bitcoin Is Dead’ Is Trending! You would have made unbelievably high returns,” investor Robin Seyr states.
The website Bitcoin Deaths tracks how often traditional media channels declare that “Bitcoin is dead.” The data shows at least 467 such occurrences.
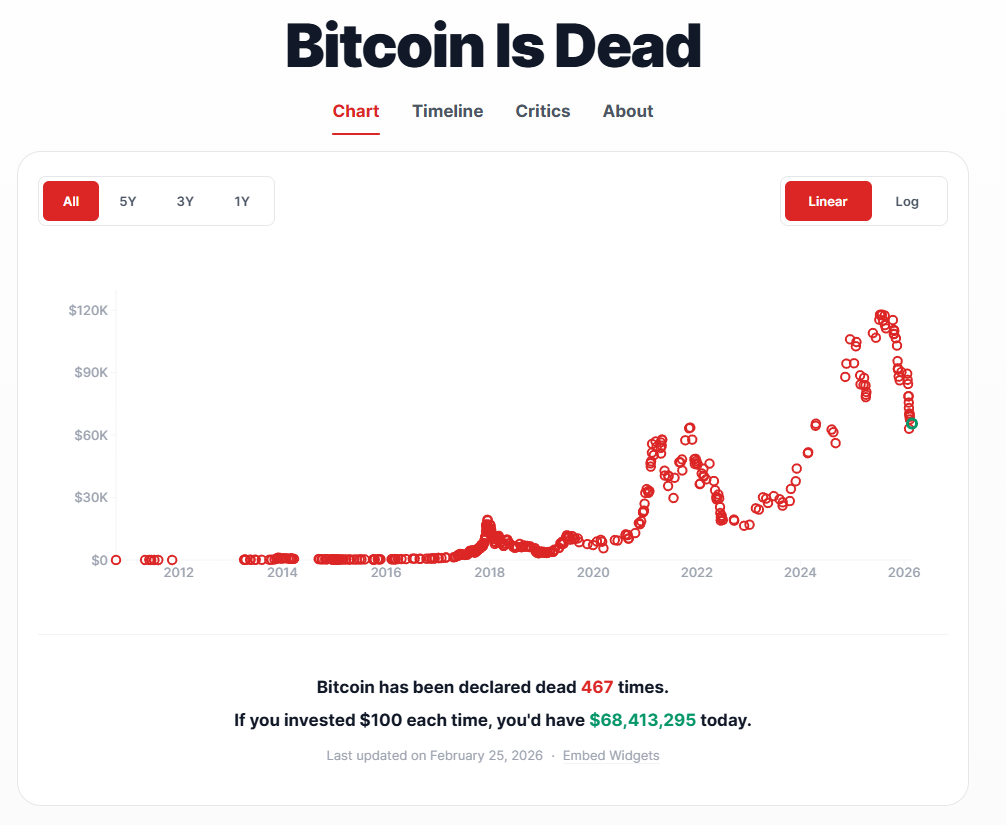
If an investor had purchased $100 worth of Bitcoin each time such a declaration appeared, that investor could now hold assets valued at more than $68 million.
An Unprecedented Surge in “What Is Bitcoin” Searches
Another notable point emerges when comparing negative keywords with the search term “What is Bitcoin.” The data reveals an unprecedented phenomenon in Bitcoin’s history.
Actual data shows that searches for this question have reached an all-time high. The contrast between two search trends—one questioning Bitcoin’s survival and the other seeking basic knowledge—creates a striking picture of divided sentiment in February.
Unlike those who fear that Bitcoin will “go to zero,” individuals seeking this fundamental definition are often complete newcomers. They typically have no prior knowledge or investment experience in the cryptocurrency market.
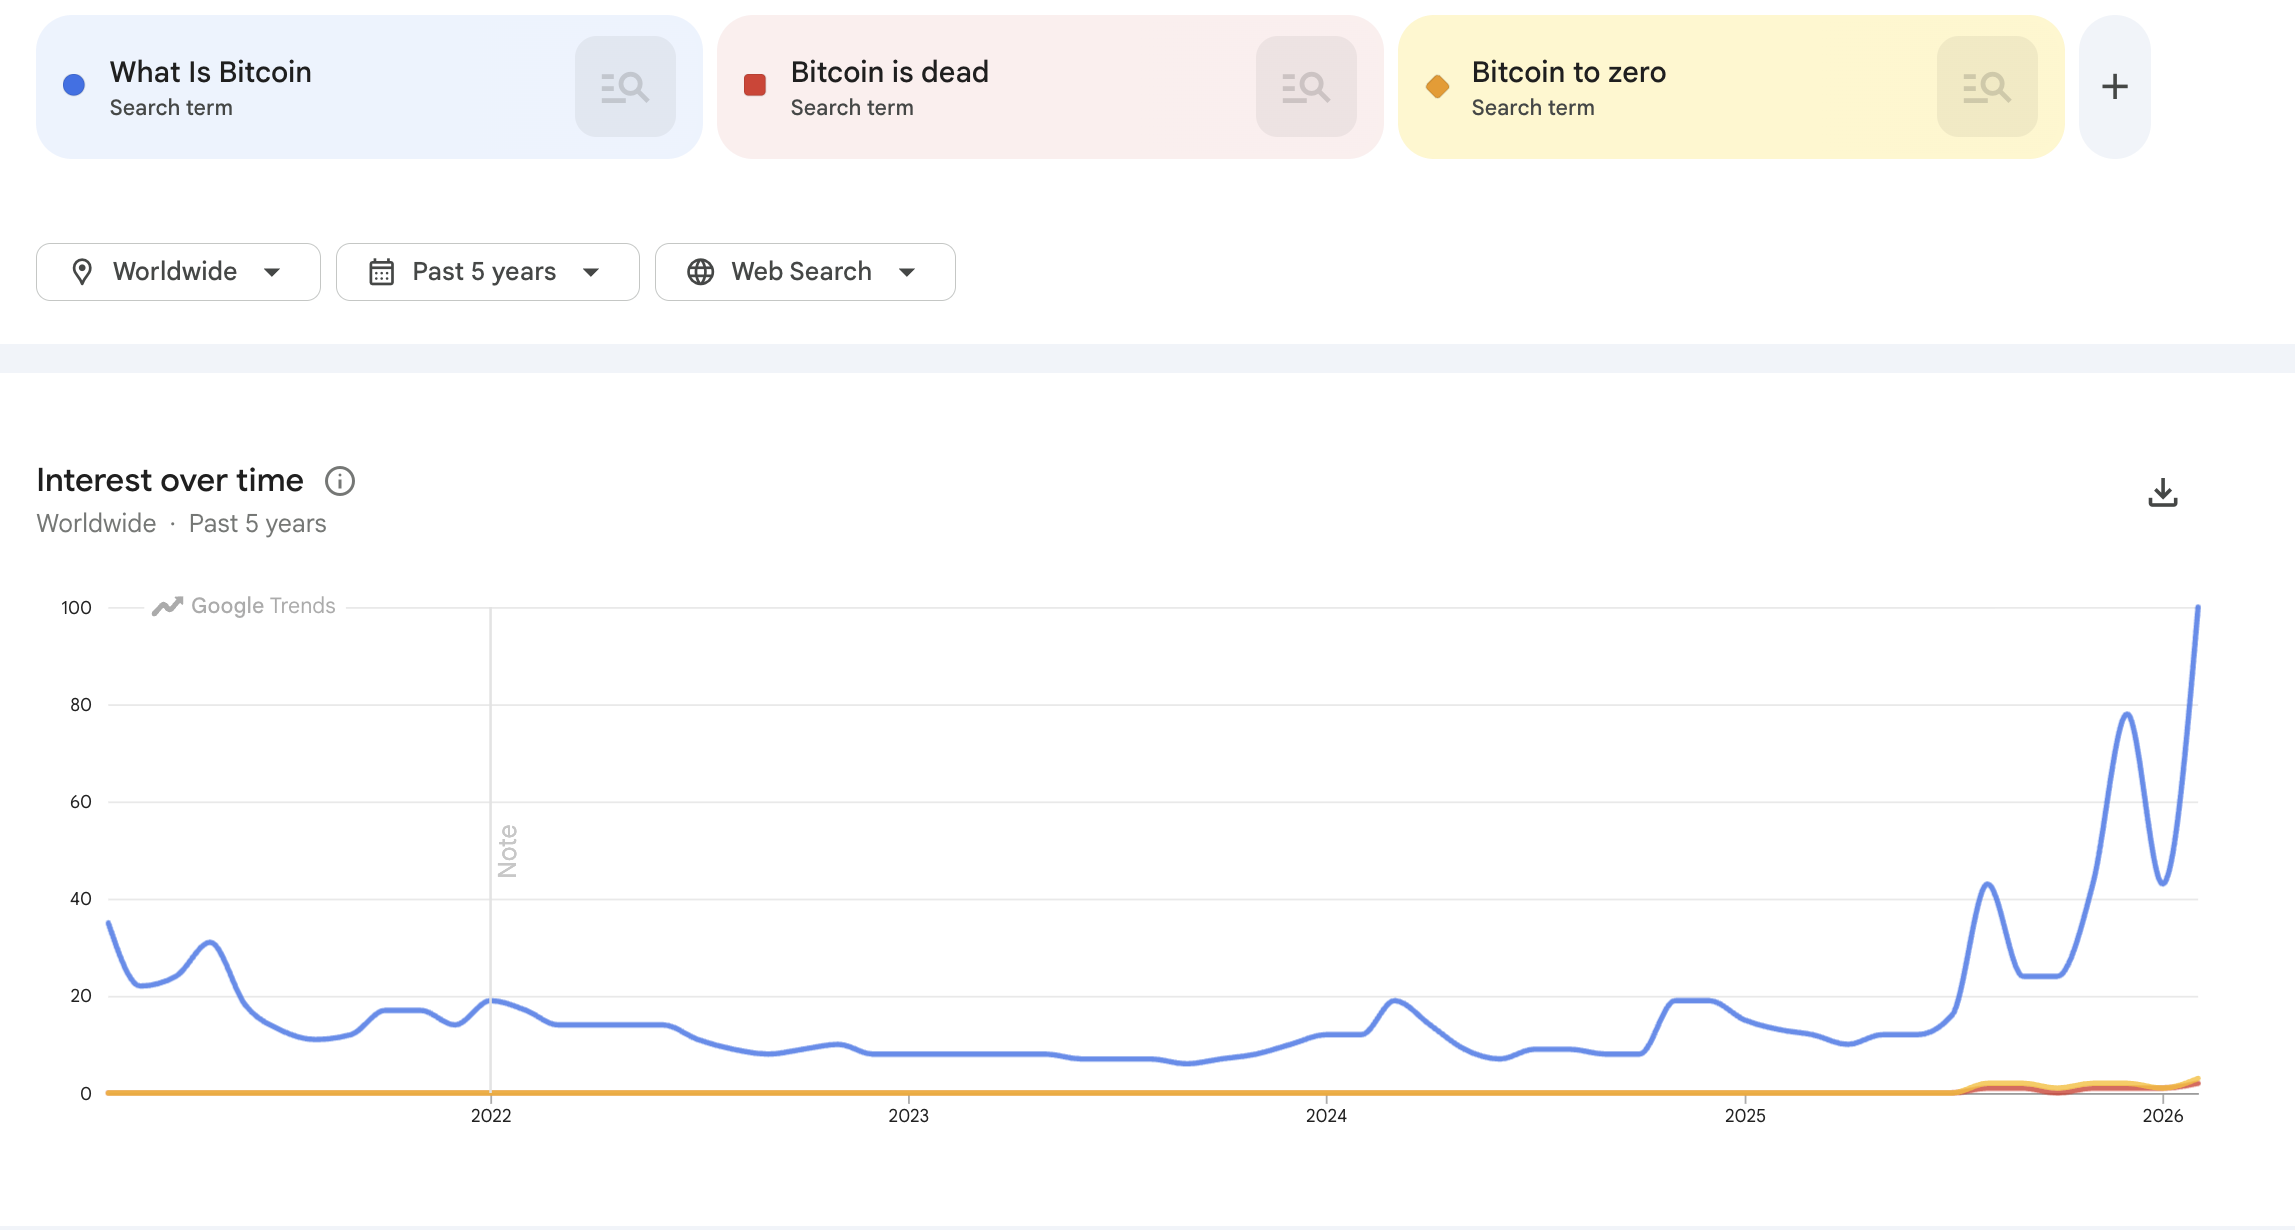
When compared directly with negative keywords, searches for “What is Bitcoin” significantly outperform them.
A large number of users are rushing to explore the most basic concepts during a market downturn. This development deserves careful consideration. It indicates that Bitcoin, despite trading at lower prices, continues to maintain a strong appeal. It is also reaching segments of the population that previously showed no interest in digital finance.
“Somewhere out there, millions are meeting Bitcoin for the first time,” Binance states.
However, search activity does not necessarily translate into capital inflows. The surge in the keyword “What is Bitcoin” may serve as an early indicator of the emergence of an entirely new generation of first-time retail investors.


Kalshi, one of the leading prediction market firms, said it caught and penalized two users for insider-trading activity on its platform, including an editor for the popular social-media star MrBeast.
The company said it has more than a dozen active insider-trading cases among 200 it’s investigated. On Wednesday, Kalshi disclosed the details of two that it resolved, including against Artem Kaptur, who was identified as working for James Donaldson, known for his MrBeast persona that’s tied to its massive social-media presence as well as the reality competition show, “Beast Games.”
Kaptur was said to have entered $4,000 in trades regarding what would occur on the MrBeast show, for which he worked as a visual effects editor. Kalshi suspended him for two years and fined him more than $20,000.
“Beast Industries has no tolerance for this behavior, whether by contestants or our own employees,” the company that employed Kaptur said in a statement. “We have a longstanding policy in place against employees using proprietary company information which safeguards the highest standards and ethics throughout our organization.”
Beast Industries said it has “already initiated an independent investigation” on that matter, though it encouraged Kalshi to “be more open” to communicating its findings in the future.
Insider trading is banned at Kalshi, a regulated exchange licensed as a “designated contract market” with the U.S. Commodity Futures Trading Commission (CFTC), and the company described its actions against Kaptur and another user who took advantage of their unique knowledge in violation of user policy.
In the other case, user Kyle Langford was said to bet $200 on his own candidacy for California governor and posted about it on social media, earning him a 5-year ban and a penalty of 10 times the trade amount.
Langford, now running for Congress, didn’t immediately respond to a request for comment. Nor did the CFTC immediately respond to questions about its role in these matters.
The pair of cases at Kalshi further underline one of the concerns at the U.S. regulator of derivatives, the CFTC. While that agency is now working on rules to govern the prediction markets, its previous chairman under the administration of former President Joe Biden had often lamented that the CFTC isn’t able to police the whole world. Markets that extend to miniscule bets on topics both broad and obscure and in jurisdictions around the world can pose a potential challenge for — at last count — about 114 U.S. enforcement employees.
In a recent CNBC interview, Kalshi CEO Tarek Mansour struggled to draw the line on what constitutes insider trading when questioned on a hypothetical example of people in the stadium before the Super Bowl having knowledge about what performer Bad Bunny would do as his opening song — a matter that drew Kalshi contracts.
Mansour equated it with controls at stock market firms, saying, “we do the same thing on Kalshi. We have the same mechanism for enforcement.” However, he said Kalshi users have to recognize the risks of betting on information under uncertain restraints. “We want to work with policymakers and regulators to get that right,” he said.
Read More: Richest YouTube Star MrBeast’s Firm Files Trademark With Crypto Ambitions
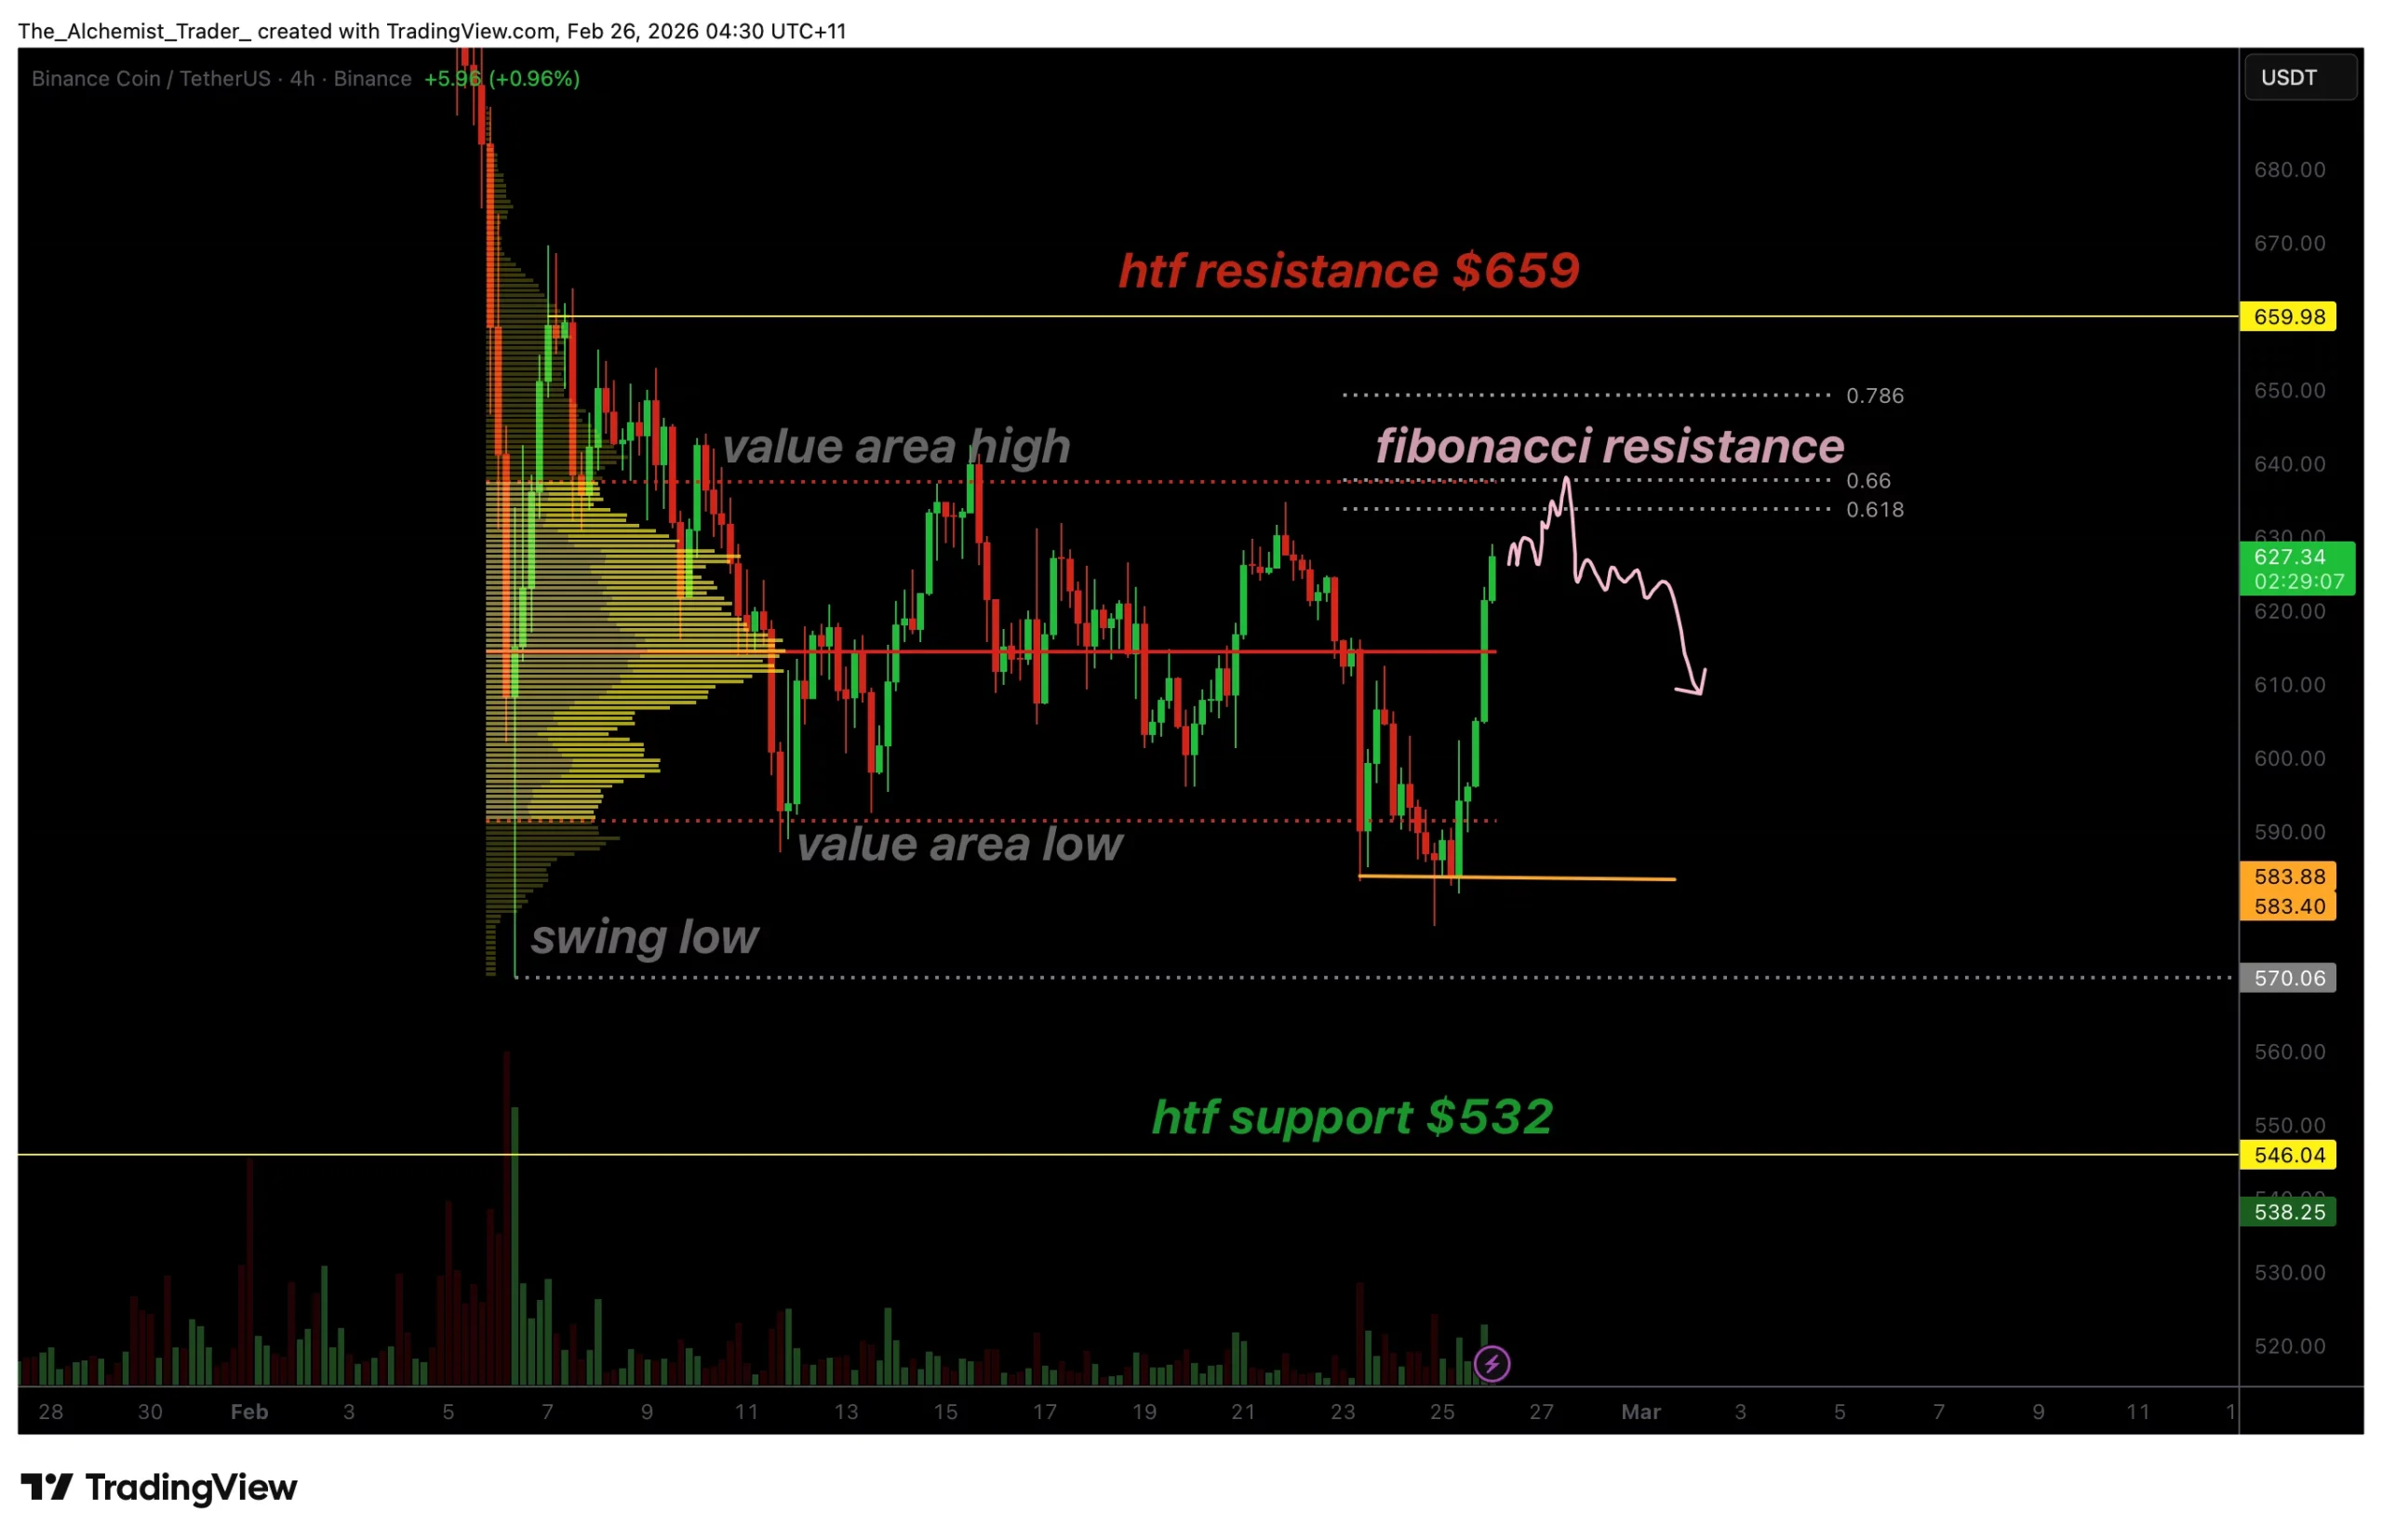
BNB price has staged a strong rebound after confirming a swing failure pattern at recent lows. The rally now approaches a critical resistance cluster near $635 that could determine the next directional move.
Summary
- BNB confirms bullish SFP, triggering strong rebound from lows
- $635 resistance aligns with 0.618 Fibonacci and value area high
- Breakout targets $659; rejection keeps price range-bound between $659 and $532
BNB (BNB) pricehas regained bullish momentum following a successful swing failure pattern (SFP) that invalidated downside liquidity and triggered a sharp recovery from local lows. The move reflects renewed buyer participation after a period of weakness, shifting short-term sentiment toward the upside.
However, price is now approaching a technically significant resistance zone where market structure decisions typically occur. Whether bulls can reclaim this region will likely dictate if BNB transitions into trend continuation or returns to range-bound conditions.
BNB price Key Technical Points
- Key Resistance: $635 aligns with the 0.618 Fibonacci retracement and the value area high.
- Bullish Catalyst: Confirmed SFP triggered liquidity reversal and short squeeze dynamics.
- Upside Target: Break and hold above $635 opens the path toward high timeframe resistance near $659.

Recent price action on BNB highlights the importance of liquidity-driven moves within crypto markets. The formation of a swing failure pattern at the lows effectively trapped late sellers, allowing buyers to step in aggressively. This type of structure typically signals exhaustion in bearish momentum, and the resulting move has validated that thesis. The rally that followed was impulsive, suggesting short covering and fresh long positioning entering the market simultaneously.
As price accelerated higher, BNB quickly rotated back toward a major technical confluence zone around $635. This region represents the 0.618 Fibonacci retracement of the prior decline while also aligning with the value area high from the volume profile. Historically, such zones act as decision points where markets either reclaim bullish structure or face rejection due to overhead supply. A sustained close above this level would signal strength and confirm that buyers have regained control of the higher timeframe trend.
Despite the bullish recovery, traders should remain cautious as impulsive rallies often transition into consolidation before continuation. After strong expansions, markets frequently pause to establish equilibrium, allowing liquidity to rebuild. Lower timeframe consolidation near resistance would be considered healthy price behavior and could form a higher low structure that supports a continuation toward $659 and potentially beyond.
This comes as U.S. Senator Richard Blumenthal launched a formal Senate inquiry into Binance following reports alleging the exchange processed nearly $1.7 billion in transactions linked to sanctioned Iranian entities and Russia’s so-called shadow fleet, adding a layer of regulatory uncertainty to broader market sentiment.
However, failure to reclaim the $635 resistance on a closing basis may shift the outlook quickly. A rejection at this zone would indicate that sellers remain active and defending supply, reinforcing the broader higher timeframe range between approximately $659 resistance and $532 support. In such a scenario, BNB could rotate back toward mid-range liquidity or revisit lower support levels before another attempt at breakout conditions develops.
Volume behavior also supports the current technical narrative. The rally originated from a liquidity sweep rather than sustained trend accumulation, meaning confirmation is still required. A decisive increase in buying volume during a breakout would strengthen bullish continuation odds. Without that confirmation, the market risks transitioning into redistribution at resistance, where both bulls and bears compete for control.
Overall, the recent SFP-driven recovery marks an important structural development for BNB. The market has shifted from downside expansion into a potential re-accumulation phase, but confirmation remains dependent on reclaiming resistance rather than merely testing it.
This comes as Binance defended its compliance framework, stating that recent media coverage inaccurately portrayed its regulatory oversight and control measures, highlighting ongoing regulatory narratives that continue to influence broader crypto market sentiment.
What to expect in the coming price action
BNB’s next move hinges on the $635 resistance level. A confirmed reclaim could trigger continuation toward $659 high timeframe resistance, while rejection may keep price rotating within the broader range.
Consolidation near resistance remains the most probable short-term outcome as the market prepares for its next directional expansion.

- XRP price forms higher lows, signalling growing buying interest.
- XRP ETF inflows show steady institutional accumulation.
- The key levels to watch are the support at $1.13 and the resistance at $1.46–$1.83.
XRP is showing signs of a potential recovery after recent price action indicated that buyers are stepping in at key support levels.
The cryptocurrency recently bounced off the $1.33–$1.35 zone, forming higher lows over the past week. This pattern suggests that sellers are losing strength, while buyers are gaining confidence.
Trading activity has also increased, with a notable surge in spot purchases on major exchanges. Retail investors are showing renewed interest, pushing buy orders above sell orders in several short-term periods.
Institutional flows are adding further support with XRP-linked ETFs attracting consistent inflows, indicating that larger players are accumulating the token.
This combination of retail buying and institutional accumulation creates a favourable environment for a potential upswing.
Technical signals suggest price stabilisation
From a technical standpoint, XRP has established a short-term support around $1.13. This level has held firm despite some volatility, preventing further downside.
If this support continues to hold, it could act as a springboard for higher prices.

On the upside, the $1.5121 level has emerged as a key resistance.
Breaking above this zone could pave the way for moves toward $1.66, with a further resistance level at $1.83.
Historical price behaviour shows that surpassing $1.51 often opens the door for more substantial gains.
Below the short-term support, another historical support exists around $0.8475. This deeper level could act as a safety net if XRP were to face selling pressure.
For now, however, the token remains above its critical floors, suggesting that the market is stabilising.
Volume trends reinforce the positive outlook.
Recent surges in buying activity have been accompanied by elevated trading volume, a strong indicator that the momentum is supported by actual market participation rather than isolated trades.
Higher lows, in particular, signal that buyers are willing to step in at progressively higher prices.
This is a classic indicator of strengthening market sentiment and often precedes more sustained upward movements.
XRP price outlook
Overall, the combination of higher lows, robust ETF inflows, and strong trading volume points to a market that is gradually recovering.
According to analysts, the immediate support sits at $1.13, with $0.8475 as a more distant buffer, while the key resistance levels to monitor include $1.46, $1.66, and $1.83.
A break above $1.46 could trigger further gains toward higher targets, while holding support at $1.13 may confirm that the market has stabilised.
Conversely, a drop below $1.13 could see XRP retest lower support zones, potentially putting short-term momentum at risk.

ETH is flashing mixed signals: is it on the verge of a rally or bracing for another breakdown?
The second-largest cryptocurrency hasn’t been at its best lately, plummeting by double digits over the last 30 days and trading far below its all-time high of almost $5,000 witnessed in the summer of 2025.
However, the past 24 hours brought some hope for the bulls, as ETH rocketed from $1,800 to over $2,000. Some market observers believe a more profound rebound could be on the way, while others think the valuation has yet to reach its bottom.
Rally Soon?
Ethereum (ETH) has soared by over 10% daily, currently trading above the $2,000 psychological zone. However, it remains 30% down on a monthly scale, while its market capitalization has shrunk to approximately $237 billion.
Despite the major correction, many analysts remain optimistic. X user KALEO observed the asset’s recent performance and argued that it might be on the verge of a bounce. They assumed that ETH has formed a “clean double bottom off HTF support” and may be ready to spike above $2K.
“More FUD than I’ve ever seen on the timeline. Send it with haste,” the analyst added.
Merlijn The Trader also chipped in lately. He claimed that ETH is sitting in a five-year demand zone, emphasizing that this area has historically acted as a place where investors accumulate rather than distribute.
“You don’t need the exact bottom. You need exposure before expansion. Big bases don’t drift. They reprice,” he stated.
X user StockTrader_Max shared a similar thesis, arguing that ETH has evolved into “a long-term investment with slower, steadier growth that rewards patience and conviction rather than hype and timing.” The analyst believes the asset should be held in many portfolios, with a time horizon of years rather than months.
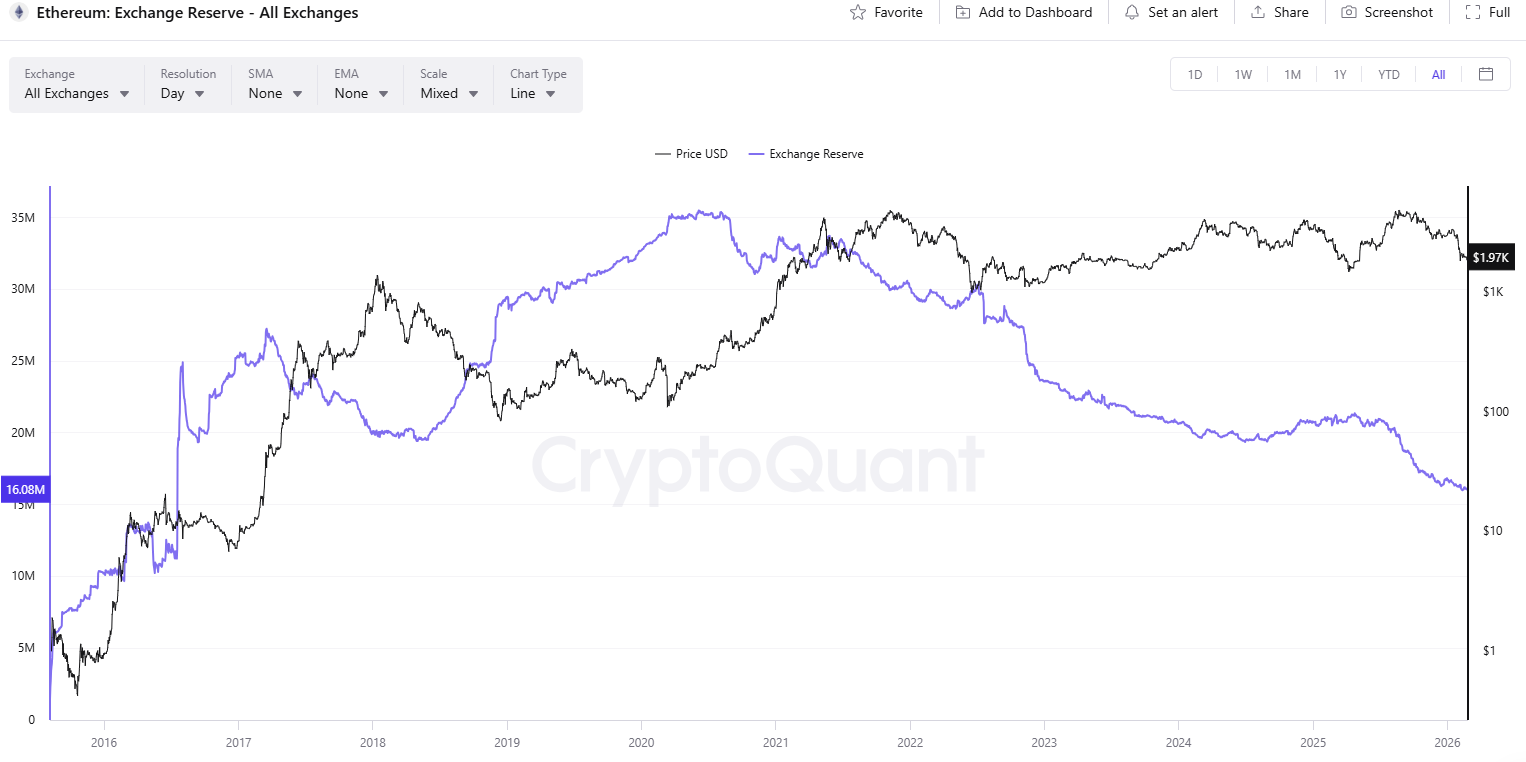
Meanwhile, some industry participants noted that whales have been quite active lately and increased their exposure to ETH. X user Crypto Rover shared a CryptoQuant chart, showing that large investors now own over 24 million tokens, or more than 20% of Ethereum’s circulating supply.
You may also like:
Whales’ activity is closely monitored by smaller players who might mimic their moves and enter the ecosystem with fresh capital. Additionally, it is commonly believed that large investors rarely make irrational purchases and may have inside information about upcoming events that could influence valuation.
Last but not least, ETH’s exchange reserves remain quite close to the nearly 10-year low recorded earlier this month. This trend shows that investors don’t rush to transfer their holdings to centralized platforms: a move often considered a pre-sale step, and which can cause an additional price slump.
Are the Bears Here to Stay?
Many other analysts presented rather pessimistic views on the matter. X user Crypto Tony warned of new lows if the price plunges below $1,820, describing that level as “the last line of defence.” They later argued that if the bulls decisively reclaim $1,940, then “we are back in business.”
Ali Martinez and Lucky also gave their two cents. The former claimed that the next major support levels for ETH, should it break below $1,800, are $1,584, $1,238, and $1.089.
The asset’s Relative Strength Index (RSI) is another bearish factor to watch. Due to the price rebound experienced over the past hours, the tool’s ratio has risen above 70, signaling that ETH is overbought and could be due for a correction. The RSI is an important metric often used by traders, and conversely, anything below 30 is considered a buying opportunity.

Binance Free $600 (CryptoPotato Exclusive): Use this link to register a new account and receive $600 exclusive welcome offer on Binance (full details).
LIMITED OFFER for CryptoPotato readers at Bybit: Use this link to register and open a $500 FREE position on any coin!
Hut 8 (EXCHANGE: HUT) posted a stark transformation in its fourth-quarter results, reflecting the struggle of a hash-rate focused miner navigating volatile digital-asset markets and a pivot toward AI-driven infrastructure. The company reported a quarterly net loss of $279.7 million, a sharp reversal from an income of $152.2 million in the prior-year period, underscoring the hit from asset valuations and impairment charges. Revenue for the quarter ended December 31 stood at $88.5 million, evidence of growth from the year-ago $31.7 million, while compute revenue climbed to $81.9 million from $19.2 million. Yet the quarter’s bottom line was weighed down by a $401.9 million impairment on digital assets, a larger drag than the $308.2 million impairment increase logged a year earlier. In the context of a crypto market that has cooled from earlier-year highs, Hut 8’s numbers crystallize a transition away from pure mining toward a broader data-center and AI infrastructure strategy.
The quarter’s figures come as Hut 8 also highlighted a robust liquidity position. The company ended the year with about $1.4 billion in cash and Bitcoin reserves, along with up to $400 million in revolving credit capacity. That liquidity cushion is notable given the negative earnings impact from asset impairment, and it provides the runway for the company’s expansion plans in high-performance computing and AI hosting. Against a backdrop where Bitcoin’s price has softened from its 2021-2022 peak, Hut 8 appears intent on diversifying revenue streams beyond block rewards into service-based income tied to AI workloads and data-center capacity.
Among the strategic moves shaping Hut 8’s trajectory, a 15-year lease for 245 megawatts of AI data-center capacity at its River Bend campus stands out. Valued at about $7 billion, the deal is financed in part by a substantial Google-backed funding package that covers around $1.8 billion of the lease obligations and includes warrants for roughly 41 million WULF shares, representing about 8% of the company’s equity under the arrangement. This arrangement underscores a broader industry push to pair crypto mining infrastructure with AI and HPC capabilities, leveraging established cloud and AI ecosystems to extract incremental value from spare data-center capacity. The lease is positioned as a cornerstone of Hut 8’s pivot toward AI-hosting services that can ride secular demand for AI training and inference workloads. The full details of the arrangement are covered in prior disclosures and linked references.
In parallel with the River Bend project, Hut 8 completed the sale of a 310 MW natural gas portfolio in February, freeing additional capital for expansion bets. The company also announced the launch of American Bitcoin Corp., a separately listed vehicle focused on Bitcoin accumulation, a move designed to create a dedicated vehicle for holding and potentially monetizing crypto assets as part of its capital-allocation strategy. These steps reflect a broader trend among miners to monetize non-core assets and redeploy capital into platforms that can scale with AI-driven demand.
Hut 8’s Bitcoin holdings remain a point of attention for investors. Data from BitcoinTreasuries.NET shows Hut 8 holds 13,696 BTC, positioning the company among the larger publicly traded Bitcoin holders by ordinary metrics. The market response to the earnings release was tepid, with shares down about 4.5% in early trading on Wednesday, a reflection of the mixed signal from the quarterly results—heightened impairment on assets even as liquidity and strategic leverage appear to expand. Market participants watched how the company’s stock would translate liquidity into tangible AI/data-center revenue over the coming quarters, particularly as the AI lease with Google-backed financing adds a long-horizon revenue stream.
Beyond Hut 8’s numbers, the sector’s narrative has shifted toward AI and HPC infrastructure. Even as Bitcoin traded around $68,150—a retreat from its early-year highs near $87,500 (CoinGecko data)—several of the largest publicly traded Bitcoin miners have posted year-to-date gains. TeraWulf (EXCHANGE: WULF) has rallied more than 50% year-to-date, while Riot Platforms (EXCHANGE: RIOT) and Hut 8 have advanced roughly 30% and 29%, respectively, according to industry data. The performance differential suggests investors are valuing miners not only for their Bitcoin exposure but also for the quality of their energy infrastructure, data center real estate, and strategic diversification into AI and HPC capabilities. The ETF landscape also moves in step with this narrative; the Bitcoin Mining ETF WGMI has posted gains as investors rotate toward AI- and data-center-enabled plays.
The divergence in outcomes across miners highlights a broader market reality: investors are increasingly discounting crypto price alone and pricing in operational leverage tied to energy and compute capacity. In August, for example, TeraWulf signed a 10-year colocation lease with Fluidstack valued at $3.7 billion, with Google backing about $1.8 billion of the lease obligations and warrants issued for a substantial stake in WULF. Industry observers point to these kinds of long-duration commitments as proof that AI-focused infrastructure will serve as a more durable revenue anchor than mining alone, a trend echoed in Starboard Value’s push for Riot Platforms to accelerate its AI/HPC data-center ambitions.
In short, Hut 8’s quarterly report reads as a case study in a sector at a crossroads. The company’s balance sheet remains robust enough to sustain a multi-year capex plan, but the immediate earnings picture is clouded by asset impairments that reflect the price volatility of digital assets and the challenge of timing asset valuations. As Hut 8 leans into AI and HPC, investors and analysts are watching for how much of the River Bend project’s incremental revenue will filter into the bottom line, and how the company manages the horizon of interest payments, revolver usage, and equity-linked incentives tied to the Google-backed warrants. The press materials and related coverage in the period provide a roadmap for investors to evaluate Hut 8’s capacity to monetize AI-ready capacity while managing the traditional crypto mining business.
Why it matters
The Hut 8 story matters because it encapsulates a broader industry transition from pure cryptocurrency mining to diversified data-center and AI infrastructure. The ability to monetize large-scale compute capacity through AI workloads could redefine the economics of publicly traded miners, offering a more predictable revenue stream than mining rewards alone. The River Bend lease, backed by Google’s financing and a long-term obligation framework, demonstrates how strategic partnerships can de-risk capital-intensive expansions while aligning mining operators with the growing demand for AI training and inference power. This shift matters for investors who are weighing balance-sheet strength, capital allocation, and the quality of a miner’s ancillary assets beyond crypto price exposure.
Another implication is the emphasis on liquidity and asset management as a core strategic tool. Hut 8’s move to divest non-core assets, such as the 310 MW natural gas portfolio, and its spin into a dedicated Bitcoin accumulation vehicle signal a willingness to separate asset classes to fund AI infrastructure without diluting core mining operations. For users and builders in the crypto ecosystem, this signals a maturation of the sector where capital is allocated toward resilient, scalable infrastructure that can weather crypto cycle volatility while supporting the broader AI ecosystem.
Finally, the findings reinforce how public markets value the intersection of crypto assets, energy infrastructure, and data center capacity. The market’s appetite for AI-oriented data centers—evidenced by equities’ relative outperformance versus Bitcoin’s price trajectory—suggests investors are factoring both energy efficiency and compute density into growth assumptions. If Hut 8 can translate its River Bend investment into meaningful, recurring revenue, it could set a benchmark for other miners seeking to monetize AI and HPC opportunities without sacrificing their core mining businesses.
What to watch next
- Updates on River Bend AI data-center capacity utilization and revenue contribution (dates pending) and any further updates on Google-backed financing terms.
- Progress of American Bitcoin Corp. as a separate vehicle and its impact on Hut 8’s overall capital structure.
- Bitcoin price trends and miner-specific hedges or debt facilities that influence liquidity and burn rates.
- Additional asset divestitures or acquisitions by Hut 8 or peers that signal a broader industry shift toward AI-ready infrastructure.
Sources & verification
- Hut 8 reports fourth-quarter and full-year 2025 results and related press materials (PR Newswire).
- Details of the River Bend data-center lease, Google backstopping, and warrants linked to WULF.
- BitcoinTreasuries.NET data on Hut 8’s BTC holdings.
- Yahoo Finance price data for Hut 8 and peer miners to contextualize stock performance.
Hut 8’s Q4 results, AI expansion, and investor outlook
Hut 8’s latest earnings picture reflects a deliberate pivot toward AI-enabled infrastructure while balancing the realities of asset impairment that accompany a cyclic industry. The quarter’s numbers show revenue expansion driven by compute services even as the company records a large impairment charge on its digital assets. The liquidity position remains a critical asset for pursuing long-horizon data-center deployments, including the River Bend project, which positions Hut 8 among the few publicly traded miners with substantial exposure to AI and HPC workloads. As the sector navigates macro headwinds and fluctuating crypto prices, Hut 8’s strategy will be tested by the speed at which AI-driven demand scales and the company’s ability to monetize its existing capacity efficiently.
From a market perspective, the sector’s navigation of risk is increasingly about infrastructure resilience and partnerships rather than price exposure alone. The broader mining cohort has seen notable stock performance in 2024–2025, with WULF, RIOT, and WGMI among the names cited by analysts and traders as beneficiaries of a shift toward compute-centric revenue streams. Hut 8’s ongoing initiatives—asset sales, a major long-term data-center lease, and a dedicated Bitcoin accumulation vehicle—signal a structural change in how crypto miners approach growth, funding, and risk management. As always, investors will be watching for further disclosures on cash burn, debt maturities, and the pace at which AI and HPC services translate into earnings in future quarters.
Overall, Hut 8’s quarterly report is less a single-figure story about a loss and more a narrative about retooling a mining company for longer-term value creation in a data-driven AI economy. The path ahead will depend on the company’s ability to extract stable streams of revenue from its AI data-center contracts, to manage impairment risks effectively, and to sustain liquidity that underwrites future expansions. While the near-term bottom line remains under pressure, the strategic bets—particularly the River Bend lease and the American Bitcoin Corp. launch—could redefine Hut 8’s competitive edge if executed with disciplined cost control and a clear path to profitability in AI-enabled services.

British Army embarrassed by looted African relic

US men’s hockey team faces backlash after MAGA hat at White House

Tecno just unveiled a ridiculously thin modular smartphone concept design


-

 Video6 days ago
XRP News: XRP Just Entered a New Phase (Almost Nobody Noticed)
-

 Politics4 days ago
Baftas 2026: Awards Nominations, Presenters And Performers
-

 Fashion5 days ago
Weekend Open Thread: Boden – Corporette.com
-

 Sports2 days ago
Women’s college basketball rankings: Iowa reenters top 10, Auriemma makes history
-

 Politics2 days ago
Nick Reiner Enters Plea In Deaths Of Parents Rob And Michele
-
 Sports7 days ago
Clearing the boundary, crossing into history: J&K end 67-year wait, enter maiden Ranji Trophy final | Cricket News
-

 Crypto World2 days ago
XRP price enters “dead zone” as Binance leverage hits lows
-

 Business3 days ago
Mattel’s American Girl brand turns 40, dolls enter a new era
-

 Business3 days ago
Law enforcement kills armed man seeking to enter Trump’s Mar-a-Lago resort, officials say
-

 Entertainment7 days ago
Dolores Catania Blasts Rob Rausch For Turning On ‘Housewives’ On ‘Traitors’
-
 NewsBeat2 days ago
‘Hourly’ method from gastroenterologist ‘helps reduce air travel bloating’
-

 Tech3 days ago
Anthropic-Backed Group Enters NY-12 AI PAC Fight
-

 NewsBeat3 days ago
Armed man killed after entering secure perimeter of Mar-a-Lago, Secret Service says
-

 Tech1 day ago
Unsurprisingly, Apple's board gets what it wants in 2026 shareholder meeting
-

 Politics3 days ago
Maine has a long track record of electing moderates. Enter Graham Platner.
-
 NewsBeat22 hours ago
Police latest as search for missing woman enters day nine
-

 Crypto World22 hours ago
Entering new markets without increasing payment costs
-
 Sports2 days ago
2026 NFL mock draft: WRs fly off the board in first round entering combine week
-

 Crypto World6 days ago
83% of Altcoins Enter Bear Trend as Liquidity Crunch Tightens Grip on Crypto Market
-

 Business1 day ago
True Citrus debuts functional drink mix collection