

Crypto World
When ETF options start driving bitcoin
Hi readers,
Welcome to our institutional newsletter, Crypto Long & Short. This week:
- Gregory Mall on how ETFs have shifted a growing share of bitcoin volatility into U.S. equity options markets
- Top headlines institutions should pay attention to by Francisco Rodrigues
- Mid-caps show surprising strength in Chart of the Week
Thanks for joining us!
Expert Insights
When ETF options start driving bitcoin
– By Gregory Mall, chief investment officer, Lionsoul Global
The launch of U.S. spot bitcoin ETFs marked a structural turning point. The iShares Bitcoin Trust ETF (IBIT) rapidly became one of the fastest-growing ETFs in history, drawing tens of billions into a regulated vehicle. Less discussed, but equally important, is what followed: the rapid expansion of IBIT options.
Over the past year, open interest in IBIT options has climbed into the multi-billion-dollar range. On selected high-volume sessions, activity has approached levels historically associated with Deribit, the cryptocurrency futures and options exchange. A meaningful share of bitcoin’s convexity now sits inside U.S. equity options markets rather than offshore crypto venues.
That shift matters because it changes how volatility is transmitted.
From offshore leverage to onshore gamma
For most of its history, bitcoin volatility was driven by offshore perpetual futures. Funding imbalances, leverage build-ups and liquidation cascades shaped price action.
ETF options introduce a different mechanism.
When investors buy calls or puts on IBIT, dealers typically sell that optionality and hedge delta exposure. If dealers are short gamma, which is common when investors are net long options, they must buy as price rises and sell as price falls. These hedging flows are inherently procyclical and can amplify underlying moves.
Because IBIT holds physical bitcoin, hedging does not remain confined to the wrapper. Arbitrage and creation and redemption flows transmit ETF positioning into the underlying market. Bitcoin increasingly participates in the same positioning mechanics that influence equity indices.
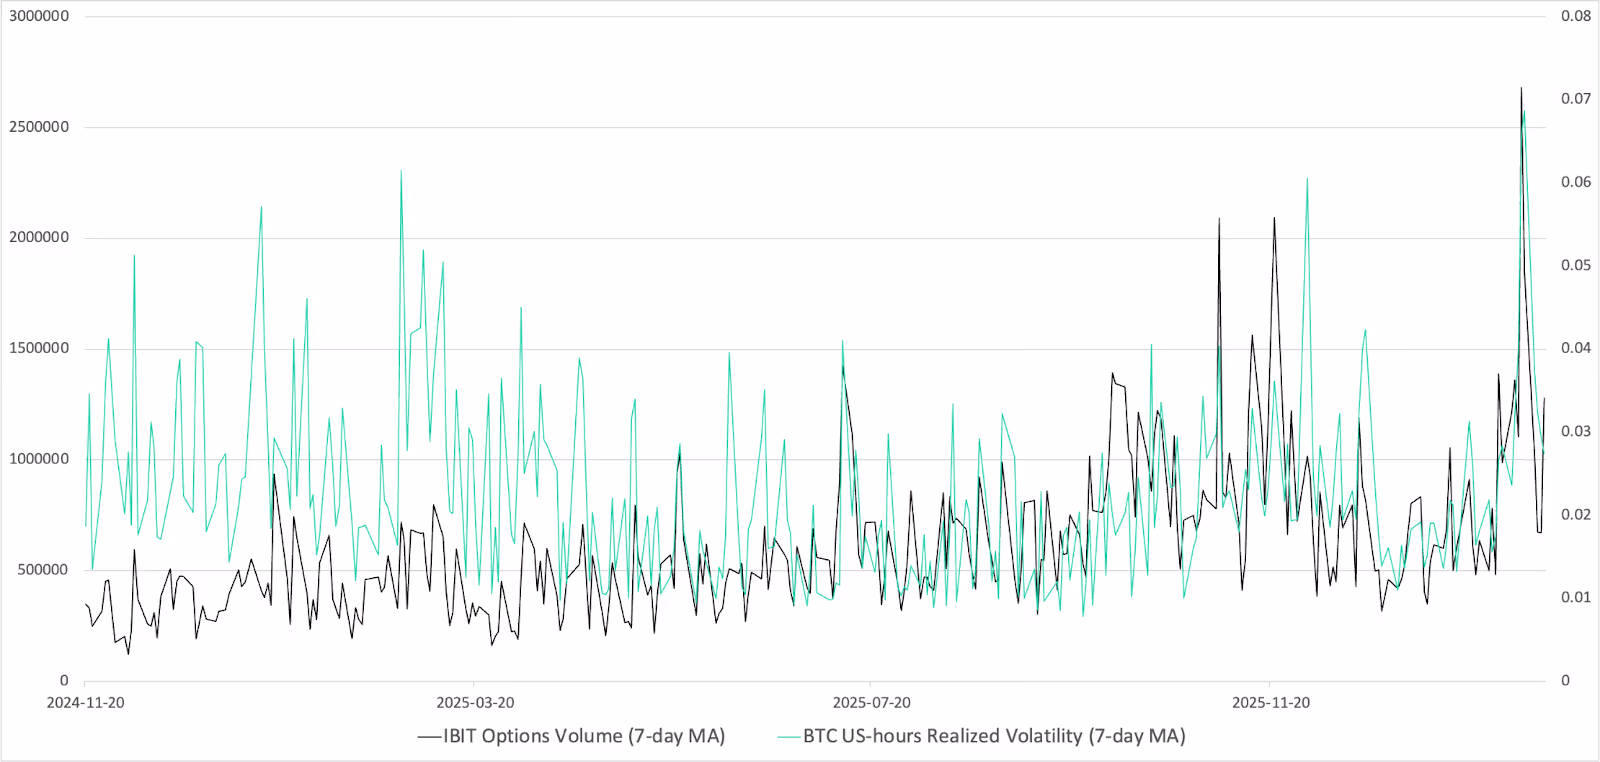
The structure of ETF options markets, where investors are generally net long optionality, suggests dealers are often warehousing short gamma during periods of elevated demand. This dynamic likely intensified during the February episode, when volatility had been subdued and crypto-native participants accumulated downside puts. Sustained option buying in a low-volatility regime leaves market makers short convexity across both ETF and offshore venues. When spot breaks, hedging flows can reinforce the feedback loop. In the graph below we show the movement of IBIT option volume and BTC U.S.-hours realized volatility. We can see that the relationship has strengthened over the past weeks.
Chart 1 illustrates the co-movement between IBIT option volume and BTC U.S.-hours realized volatility, showing that their relationship has strengthened in recent weeks. To formally evaluate this relationship, we regress bitcoin realized volatility on lagged IBIT options volume while controlling for BTC funding rates, equity returns (Nasdaq Composite), implied volatility (CBOE Volatility Index, or VIX), short-term interest rate changes and U.S. dollar movements. The results indicate that IBIT options trading activity is significantly associated with BTC volatility even after accounting for broader macroeconomic conditions.

Chart 1: Movement of IBIT option volume and BTC U.S.-hours realized volatility

Table 1: OLS regression IBIT options volume on BTC volatility

Table 2: BTC volatility distribution pre and post IBIT Options
We split the data into before vs. after IBIT options began trading. For each hour of the day (UTC), we measure how much bitcoin’s price moved in that hour. Then we convert it into a share of the day’s total volatility — so each column adds up to 100%. The highlighted band (14:00-16:00 UTC) lines up with peak U.S. trading activity, especially the U.S. cash equity open. After, IBIT options volatility becomes more concentrated in these U.S. hours — suggesting more price discovery and hedging flow is happening when U.S. markets are most active.
February as illustration
The early February selloff provides a useful example. Bitcoin fell sharply during one of the most extreme cross-asset deleveraging episodes in recent years. Yet IBIT recorded net creations rather than redemptions, which argues against retail panic.
In a thoughtful Substack post, Jeff Park suggested the catalyst was cross-asset positioning amidst some of the big multistrategy funds rather than crypto-specific stress. Correlations between bitcoin and high-beta software equities tightened materially, indicating multi-asset portfolios were being indiscriminately de-risked.
At the same time, the CME bitcoin basis widened dramatically. Near-dated basis moved from roughly three percent to close to nine percent. Such a move is consistent with multi-strategy funds unwinding delta-neutral basis trades by selling spot or ETFs and buying futures under gross exposure constraints.
As prices declined into that environment, existing short-gamma positioning may have amplified the downside through mechanical delta-hedging. Dealers’ short convexity must sell into weakness. The sharp rebound that followed on Friday the 6th is consistent with hedges being rebalanced once acute pressure subsided.
The episode illustrates a broader point. Bitcoin now participates in the same balance sheet and derivatives mechanics that govern equities and other risk assets.
Digital gold, or leveraged Nasdaq?
This evolution complicates the “digital gold” narrative. Bitcoin’s correlation with gold has historically been unstable and often close to zero over shorter horizons. BlackRock’s Head of Digital Assets, Robert Mitchnick, has argued that heavy speculative positioning can cause bitcoin to behave more like a leveraged Nasdaq proxy than a macro hedge. This observation is directionally correct. In Chart 3 we are showing that the BTC-Nasdaq correlation during U.S. trading sessions approximately doubled since inception of IBIT options. Increasingly, however, it is not only speculative longs that matter. Delta-neutral strategies and derivatives positioning inside traditional markets now contribute to volatility feedback loops.

Chart 2: Bitcoin’s correlation with Nasdaq pre- and post IBIT options
Bitcoin began outside the financial system. The success of IBIT and IBIT options shows it is now embedded within it. For long-term allocators, this does not invalidate the structural case for digital scarcity. It does mean that short-term price action is increasingly shaped by positioning, hedging and cross-asset flows.
Bitcoin is no longer trading outside the system. It is trading inside it.
The information contained herein is provided for informational and educational purposes only and should not be construed as investment, legal, or tax advice. Nothing contained in this document constitutes an offer to sell, or a solicitation of an offer to buy, any securities, investment products, or advisory services.
Lionsoul Global Advisors LLC is registered with the Texas State Securities Board (CRD #: 324883). The advisory services provided by Lionsoul Global Advisors are available exclusively to non-U.S. investors who meet applicable eligibility, accreditation, and qualification standards under relevant laws and regulations.
Headlines of the Week
– By Francisco Rodrigues
Trump’s Mar-a-Lago crypto summit would’ve been unthinkable just a few years ago. Now we’re not only getting that, but also a $17 billion trading volume debut of a crypto-linked ETF and more in a single week.
- Goldman Sachs, Franklin Templeton, and Nicki Minaj: Inside Trump’s surreal Mar-a-Lago crypto summit: The World Liberty Financial form at Mar-a-Lago included figures from traditional finance, crypto and real estate in an intimate setting, with panels touching on crypto and the future of tokenized real estate.
- To freeze or not to freeze: Satoshi and the $440 billion in bitcoin threatened by quantum computing: Quantum computing is slowly moving closer to reality, and as it does, nearly 7 million bitcoin could potentially be at risk. That includes Satoshi Nakamoto’s estimated 1 million BTC.
- ProShares’ stablecoin-ready ETF sees $17 billion debut, sparking speculation about Circle: ProShares’ IQMM money market ETF, designed to comply with U.S. stablecoin reserve requirement under the GENIUS Act, saw $17 billion in first-day trading. That sparked speculation that stablecoin issuers could be moving funds.
- Bitcoin balances on Binance hit highest since November 2024 – here’s what it means: Users’ bitcoin holdings in Binance-linked wallets are at their highest level since late 2024, which could have bearish implications on an already depressed market.
- Specialized AI detects 92% of real-world DeFi exploits: Purpose-built AI could detect vulnerabilities in 92% of 90 exploited decentralized finance (DeFi) contracts, accelerating concerns over offensive AI capabilities.
Chart of the Week
Mid-caps show surprising strength as large caps lag bitcoin
While Bitcoin is down 27.7% YTD and large-cap indices like the CD5 and CD20 are underperforming it (down 30% and 32% respectively), the CD80 is showing resilience with a shallower drawdown of only 20.91%. This represents a 7% relative outperformance against Bitcoin, a reversal of the typical “risk-off” dynamic where smaller assets crash harder than the lead. This strength suggests a “seller exhaustion” phase for mid-caps, where the heavy weightings of idiosyncratic performers like Hyperliquid (HYPE) and Canton Coin (CC) are decoupling from the broader institutional sell-off seen in large-caps.

Listen. Read. Watch. Engage.
Looking for more? Receive the latest crypto news from coindesk.com and explore our robust Data & Indices offerings by visiting coindesk.com/institutions.


- Aptos price jumped more than 20% to break above $1 on Wednesday.
- The altcoin’s rally followed a sharp bounce for Bitcoin, which rose to above $69,000.
- Risk assets gained ahead of Nvidia earnings.
Aptos (APT) is trading around $1.02 amid a broader altcoin uptick, with the token posting a notable 20% surge on February 25, 2026.
The uptick puts APT on the cusp of a breakout above the psychological level and aligns with positive signals from major altcoins. Intraday volume jumped 54% to over $105 million as bulls extended gains from the all-time lows of $0.79 reached on February 23, 2026.
Aptos price surges as Bitcoin storms to $69,000
A look at the broader market suggests momentum during US trading hours came amid sharp gains for the bellwether digital asset Bitcoin.
The surge to above $69,400, with BTC up nearly 8% in the past 24 hours, came as stocks rose ahead of Nvidia’s earnings. Cryptocurrencies also rose as markets reacted to US President Donald Trump’s State of the Union address.
As Bitcoin registered its biggest intraday jump since Feb. 6, Ethereum rose 11% to above $2,064. Polkadot, Avalanche, Uniswap and Litecoin posted double-digit gains.
📈 Following @realDonaldTrump‘s State of the Union, crypto markets have SKYROCKETED to their best daily collective jumps of the year. The altcoin charge breakout is being led by notables like $DOT (+23%), $UNI (+19%), $AVAX (+17%), $LINK (+15%), $NEAR (+15%), & $LTC (+14%). pic.twitter.com/NlHMjtHzQu
— Santiment (@santimentfeed) February 25, 2026
Traders remained cautious, though, with analysts at Glassnode noting that the market awaits conviction.
“$BTC is range-bound between key valuation anchors, with $60k–$69k absorbing sell pressure.
Profitability and breadth are fading, spot and ETF flows stay negative, and leverage has reset,” the platform posted on X.
But gains for BTC and ETH seem to have buoyed Aptos, whose price momentum is strengthened by recent ecosystem growth.
Other than an uptick in daily transactions, the blockchain platform is among 30 chains to go live on Bitwise’s staking solution.
Interest in real-world assets (RWA) and stablecoin adoption is also key to Aptos’ growth.
Prices are up amid these factors.
Aptos price analysis
Technical indicators show Aptos price off oversold territory, with RSI near 46 to signal potential for a relief rally toward the $1.20-$1.45 resistance levels.
The MACD indicator also signals upside momentum, and rising volume suggests bulls could sustain a breakout above $1.
However, the token’s position below key moving averages means bearish sentiment remains.
On the daily chart, APT is below 50-day SMA at $1.33 while the 100 SMA offers short-term resistance around $1.62.

A sustained move above $1 would invalidate the seller dominance trend. Buyers will also benefit if BTC extends gains to $70k or higher.
However, if downside pressure resumes, with the top digital asset giving up gains, Aptos could drop to recent lows around $0.80. Likely to come into view could also be October 2025 lows of $0.74.


The world’s largest BNB treasury company has crashed 95% from its high last year and is blaming the family office of Binance founder Changpeng Zhao (CZ) for a “secret side agreement.”
On Tuesday, it issued a press release demanding that CZ’s YZi Labs disclose a confidentiality provision between his family office and 10X Capital Asset Management LLC, the lead party in the company’s July 2025 PIPE transaction that coincided with its 52-week and multi-year high of $82.88 per share.
Shares of CEA Industries, which changed Nasdaq ticker symbols from VAPE to BNC — an attempt to pivot the company’s brand to a BNB Network Company — now trade at $3.88 after losing 95% of their value over the past seven months.
Before becoming a BNB treasury company during the height of the digital asset treasury (DAT) mania in the summer of 2025, CEA Industries was operating Canadian vape retailers.
That business model, as well as several business models and pivots including a previous ticker change from CEAD to VAPE, failed to reverse a multi-year decline in its common stock from a $873 peak in 2018 to under $8 by the time of its acquisition of 33 Canadian vape locations.
By July 2025, the company had yet again began looking for a new trend.
It found a suitor in Cantor Fitzgerald, founded by US Commerce Secretary and Jeffrey Epstein’s former neighbor Howard Lutnick, who acted as the lead financial advisor to 10X Capital and sole placement agent to CEA Industries.
Read more: Binance demands the Wall Street Journal remove ‘damaging’ article
Another Cantor Fitzgerald-advised treasury flop
Cantor Fitzgerald helped raise capital for other DATs like Twenty One, Bitcoin Standard Treasury Company, and Nakamoto.
In fact, the same 10X Capital that led CEA Industries’ $500 million PIPE also served as financial advisor to Nakamoto, which has declined 99% in value from its May 2025 peak. Twenty One is down 89% since May, and Bitcoin Standard Treasury Company is down 37% since July.
Despite its financial devastation, CEA Industries’ 95% decline is somewhat unremarkable among DATs.
10X Capital acted as CEA Industries’ BNB asset manager “with the support of YZi Labs.” According to CEA Industries, that support is potentially problematic, and it wants to force disclosure of how, exactly, CZ’s family office “supported” 10X Capital’s management of BNB.
10X Capital’s Chief Investment Officer (CIO) Russell Read became CIO of CEA Industries shortly after the PIPE closed.
By September, the company had relegated him to a non-executive position and by the end of the year, he’d resigned entirely.
Almost everyone lost in BNB treasury debut
Some of the biggest crypto funds invested in CEA Industries via the PIPE, including Pantera Capital, GSR, Arrington Capital, Borderless, Blockchain.com, Arche Capital, Hypersphere Capital, Kenetic, and the founders of BitFury.
There are two sides to every story.
For its part, YZi Labs has contested CEA Industries’ characterization of the “secret side agreement” as recently as this week.
YZi Labs wants CEA Industries to retract what it calls false claims about that agreement, and it’s requested directors Hans Thomas and David Namdar recuse themselves from asset management discussions.
It also wants to solicit stockholder written consents for board changes.
Amid the infighting, CEA’s common stock has fallen 41% year to date, 67% over the past 12 months, 95% from its 52-week high, and 98% over the past five years.
Got a tip? Send us an email securely via Protos Leaks. For more informed news and investigations, follow us on X, Bluesky, and Google News, or subscribe to our YouTube channel.

NVIDIA dominates the AI chip market. But dominance doesn’t always mean the best risk-reward. With institutional money flow turning cautious, tariff headwinds on Taiwan-made chips, and a valuation demanding 60%+ sustained growth — smart money is looking at other AI stocks.
Here are three AI stocks that could offer a sharper setup, both technical and fundamental, heading into March 2026. And watch out for a high risk, honorary pick, right at the end.
How is Nvidia (NVDA) Looking?
NVIDIA, the largest holding in the Technology sector (XLK) at 15.79% weightage at press time, reports its Q4 FY2026 earnings on February 25, post-market close.
Wall Street expects high numbers, but recent history shows that hasn’t been enough. After Q3’s $57 billion beat, the stock barely moved and has traded sideways since.
Despite being up over 50% year-on-year, NVIDIA’s chart has been trading inside a descending channel since late October. At press time, the price appears to be breaking out of this channel — but the breakout needs confirmation.
A sustained hold above $195, followed by a move through $203 and $212, would flip the structure bullish.
However, if the breakout fails, the $190 and $179 zones have acted as near-term support, with deeper downside risk below that.
The Chaikin Money Flow (CMF) — which tracks whether institutional money is flowing into or out of a stock — remains a concern.
The Chaikin Money Flow (CMF) indicator has remained below the zero line since mid-January, indicating net money continues to leave despite the price recovery.
If CMF fails to flip positive (like mid-January), the price recovery loses its institutional backing, and the descending channel could reassert itself.
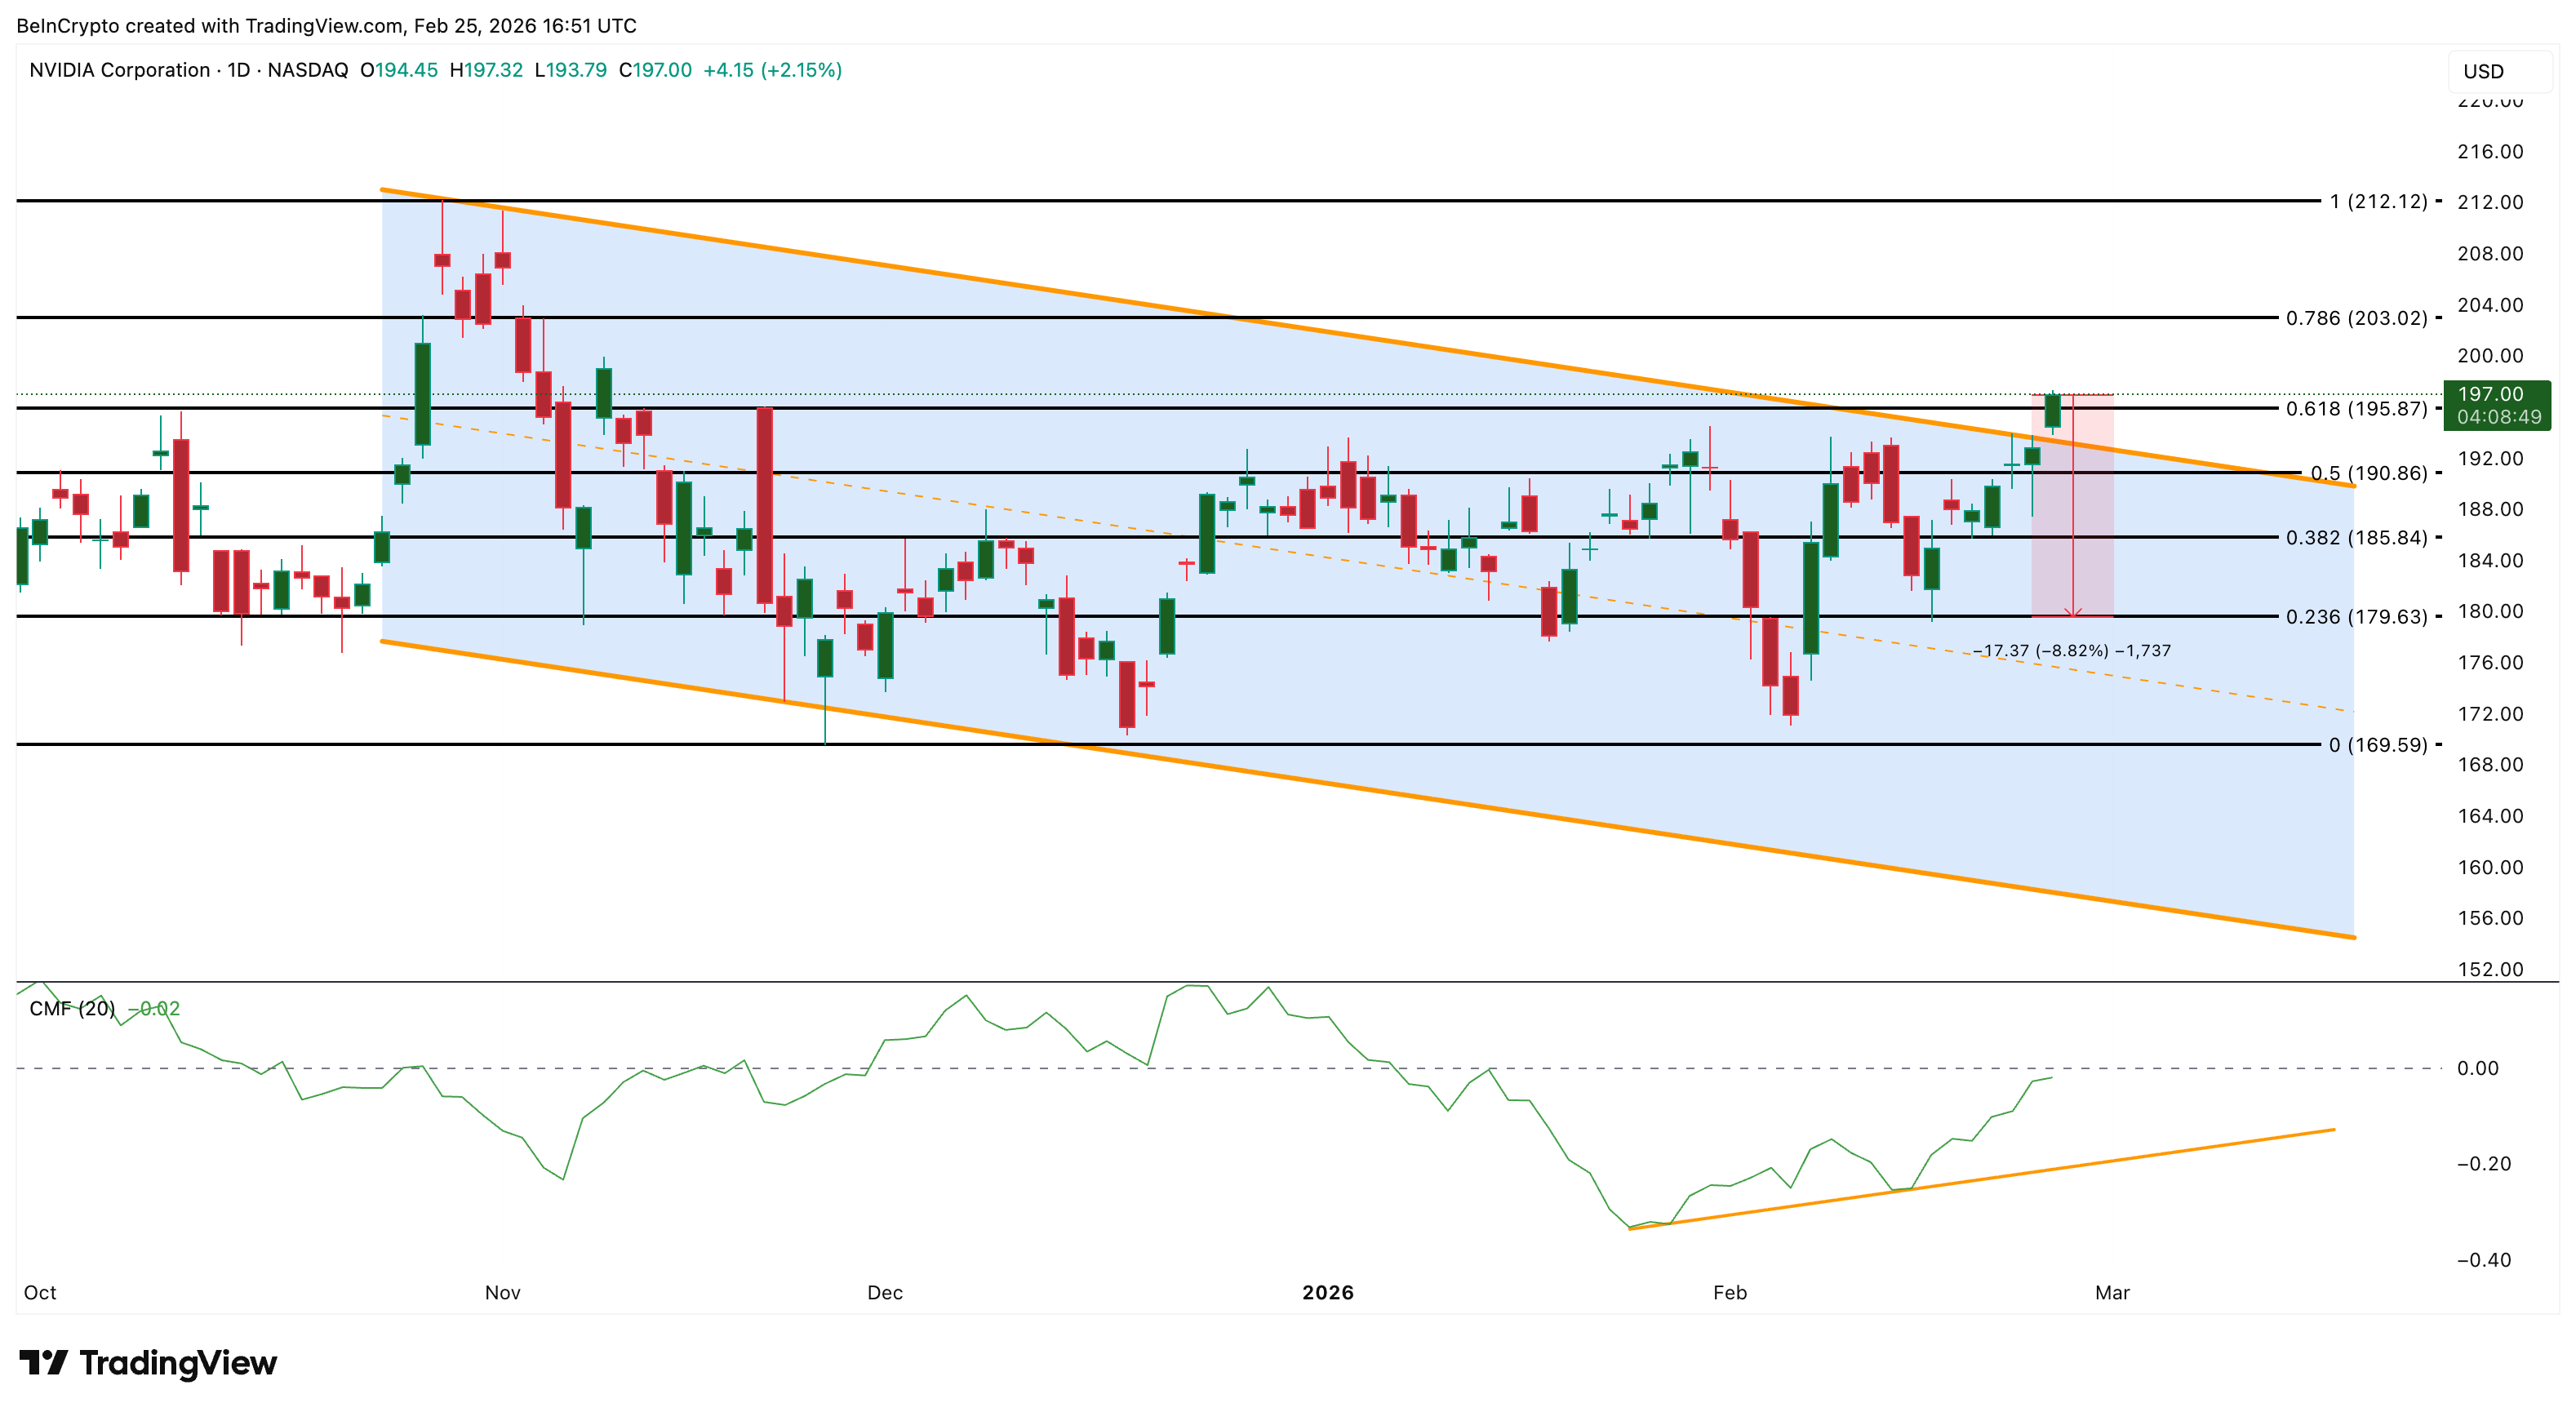
On the fundamental side, NVIDIA manufactures 100% of its GPUs through TSMC in Taiwan. This fully exposes it to Section 232 semiconductor import tariffs, raising chip costs.
China’s revenue has collapsed under US export restrictions, cutting off the world’s second-largest AI market.
And at 35x EV/EBITDA (a measure of how expensive a stock is relative to its earnings power), NVIDIA needs 60%+ sustained growth just to justify its current price. With these risks in play, three other AI stocks may offer a sharper setup into March.
Taiwan Semiconductor (TSM)
TSMC (TSM), the first stock on the list, is up nearly 100% year-on-year. That outpaces even NVIDIA’s 50% gain and the reason is straightforward. TSMC manufactures over 90% of the world’s most advanced chips.
Every NVIDIA GPU, Broadcom ASIC, and AMD processor runs on TSMC fabrication. It doesn’t matter who wins the AI chip race. TSMC builds for all of them.
Here’s what most investors miss. TSMC controls NVIDIA’s cost structure. It raised prices 10-20% on advanced chips recently. Customers paid without hesitation as no alternative exists.
Intel is generations behind, and Samsung has yield problems. When TSMC raises prices, its margins expand. When NVIDIA pays those prices, its margins shrink.
And unlike NVIDIA, TSMC doesn’t pay import tariffs. Tariffs hit the importer, not the exporter. TSMC exports. NVIDIA imports. Plus, TSMC’s new Arizona fabs produce US-made chips — completely tariff-free.
At 18x EV/EBITDA — a measure of price relative to core earnings — TSMC costs nearly half of NVIDIA’s 35x. Last quarter, 1,945 institutions opened new positions, worth $49 billion, one of the highest inflows among AI stocks.
On the chart, TSM trades inside an ascending channel since mid-December. A breakout, which is almost there, could target $470 — over 20% upside, starting in March itself.
CMF reads 0.21, above zero, confirming steady institutional inflow. A push past 0.28 would strengthen the breakout signal.
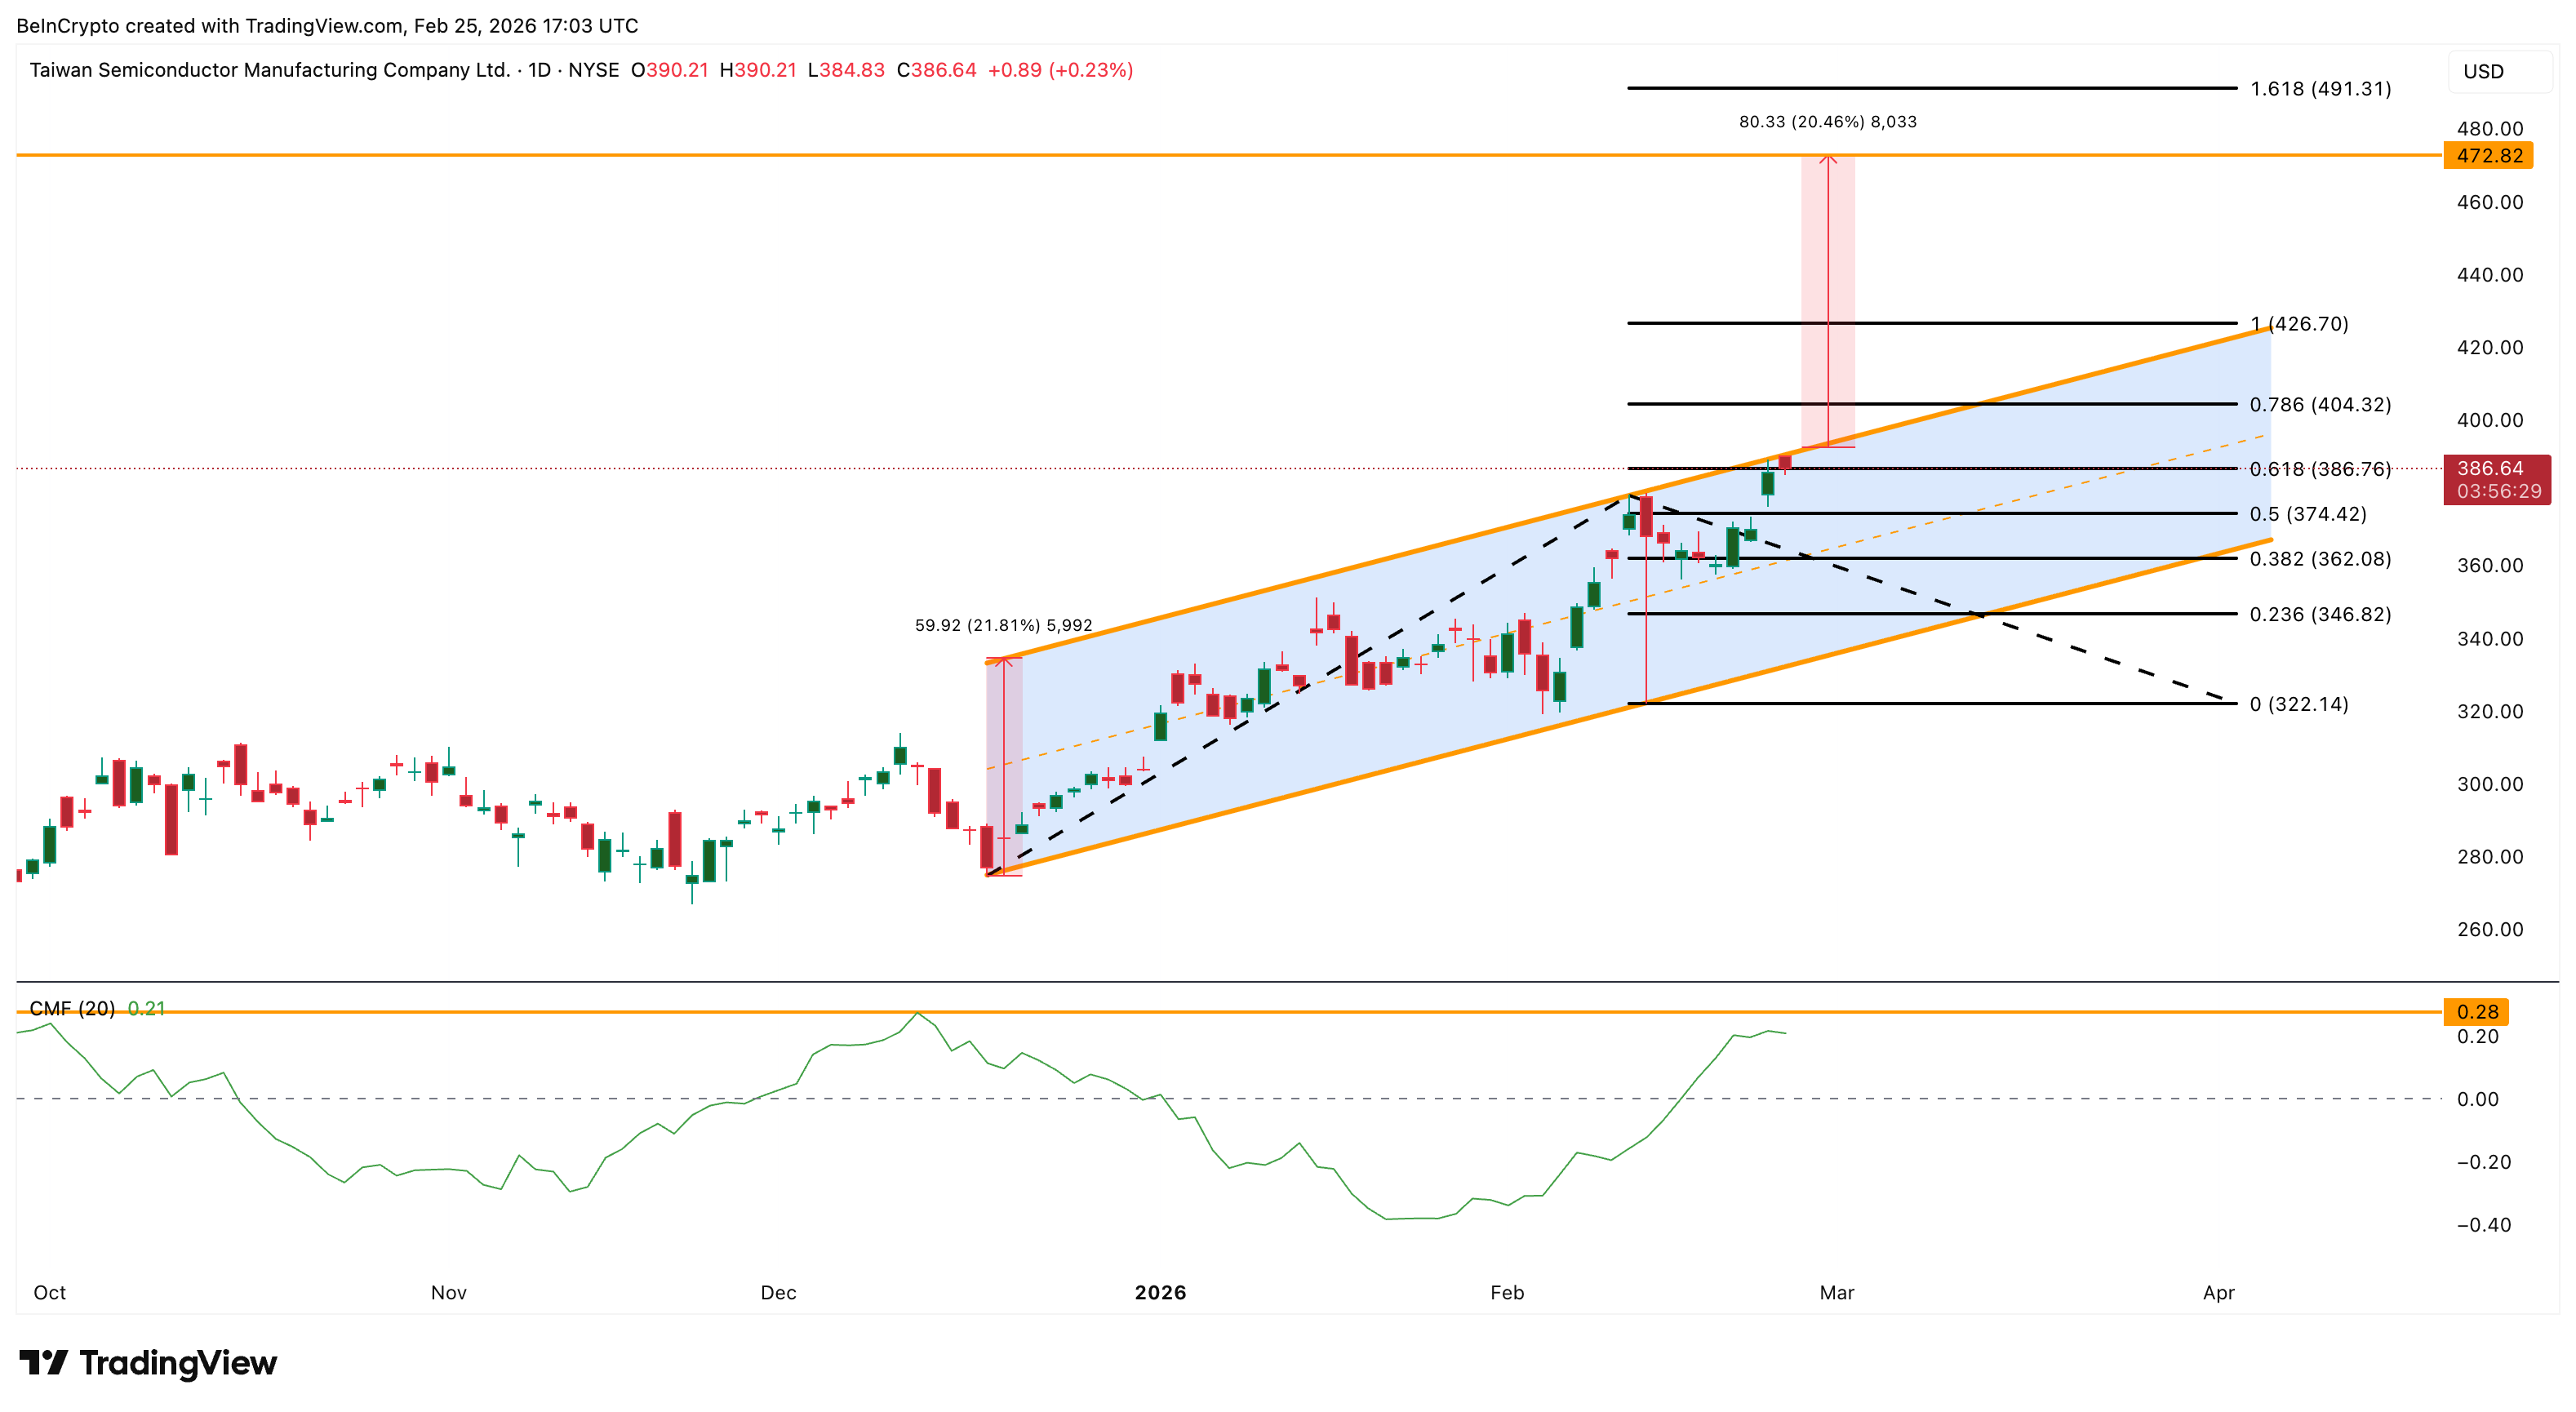
On the downside, $386 is critical support. A correction, likely triggered by the Taiwan-specific geopolitical tensions, could test $362 or $346. Only a sustained break below $346 turns the structure neutral.
Alphabet (GOOGL)
This AI stock might throw a surprise. On the daily chart, Alphabet looks weak. It’s mostly flat year-to-date. Down 7% over the past month. The price is forming a head and shoulders pattern with a downward sloping neckline. But here’s the interesting part.
Since hitting the right shoulder on February 23, the price has tried to rebound. It now sits near the right shoulder level. A break above $319 would weaken the bearish pattern. It turns the structure neutral.
Above $349, the short-term bearish thesis gets completely invalidated.
The CMF tells a different story than the price. While NVIDIA’s CMF remains negative — showing institutional money leaving — Alphabet’s CMF has turned positive at 0.09.
Similar to TSM, money is flowing in despite the weak price action. A sustained move above 0.19 would confirm institutional accumulation is carrying into Q1 2026.
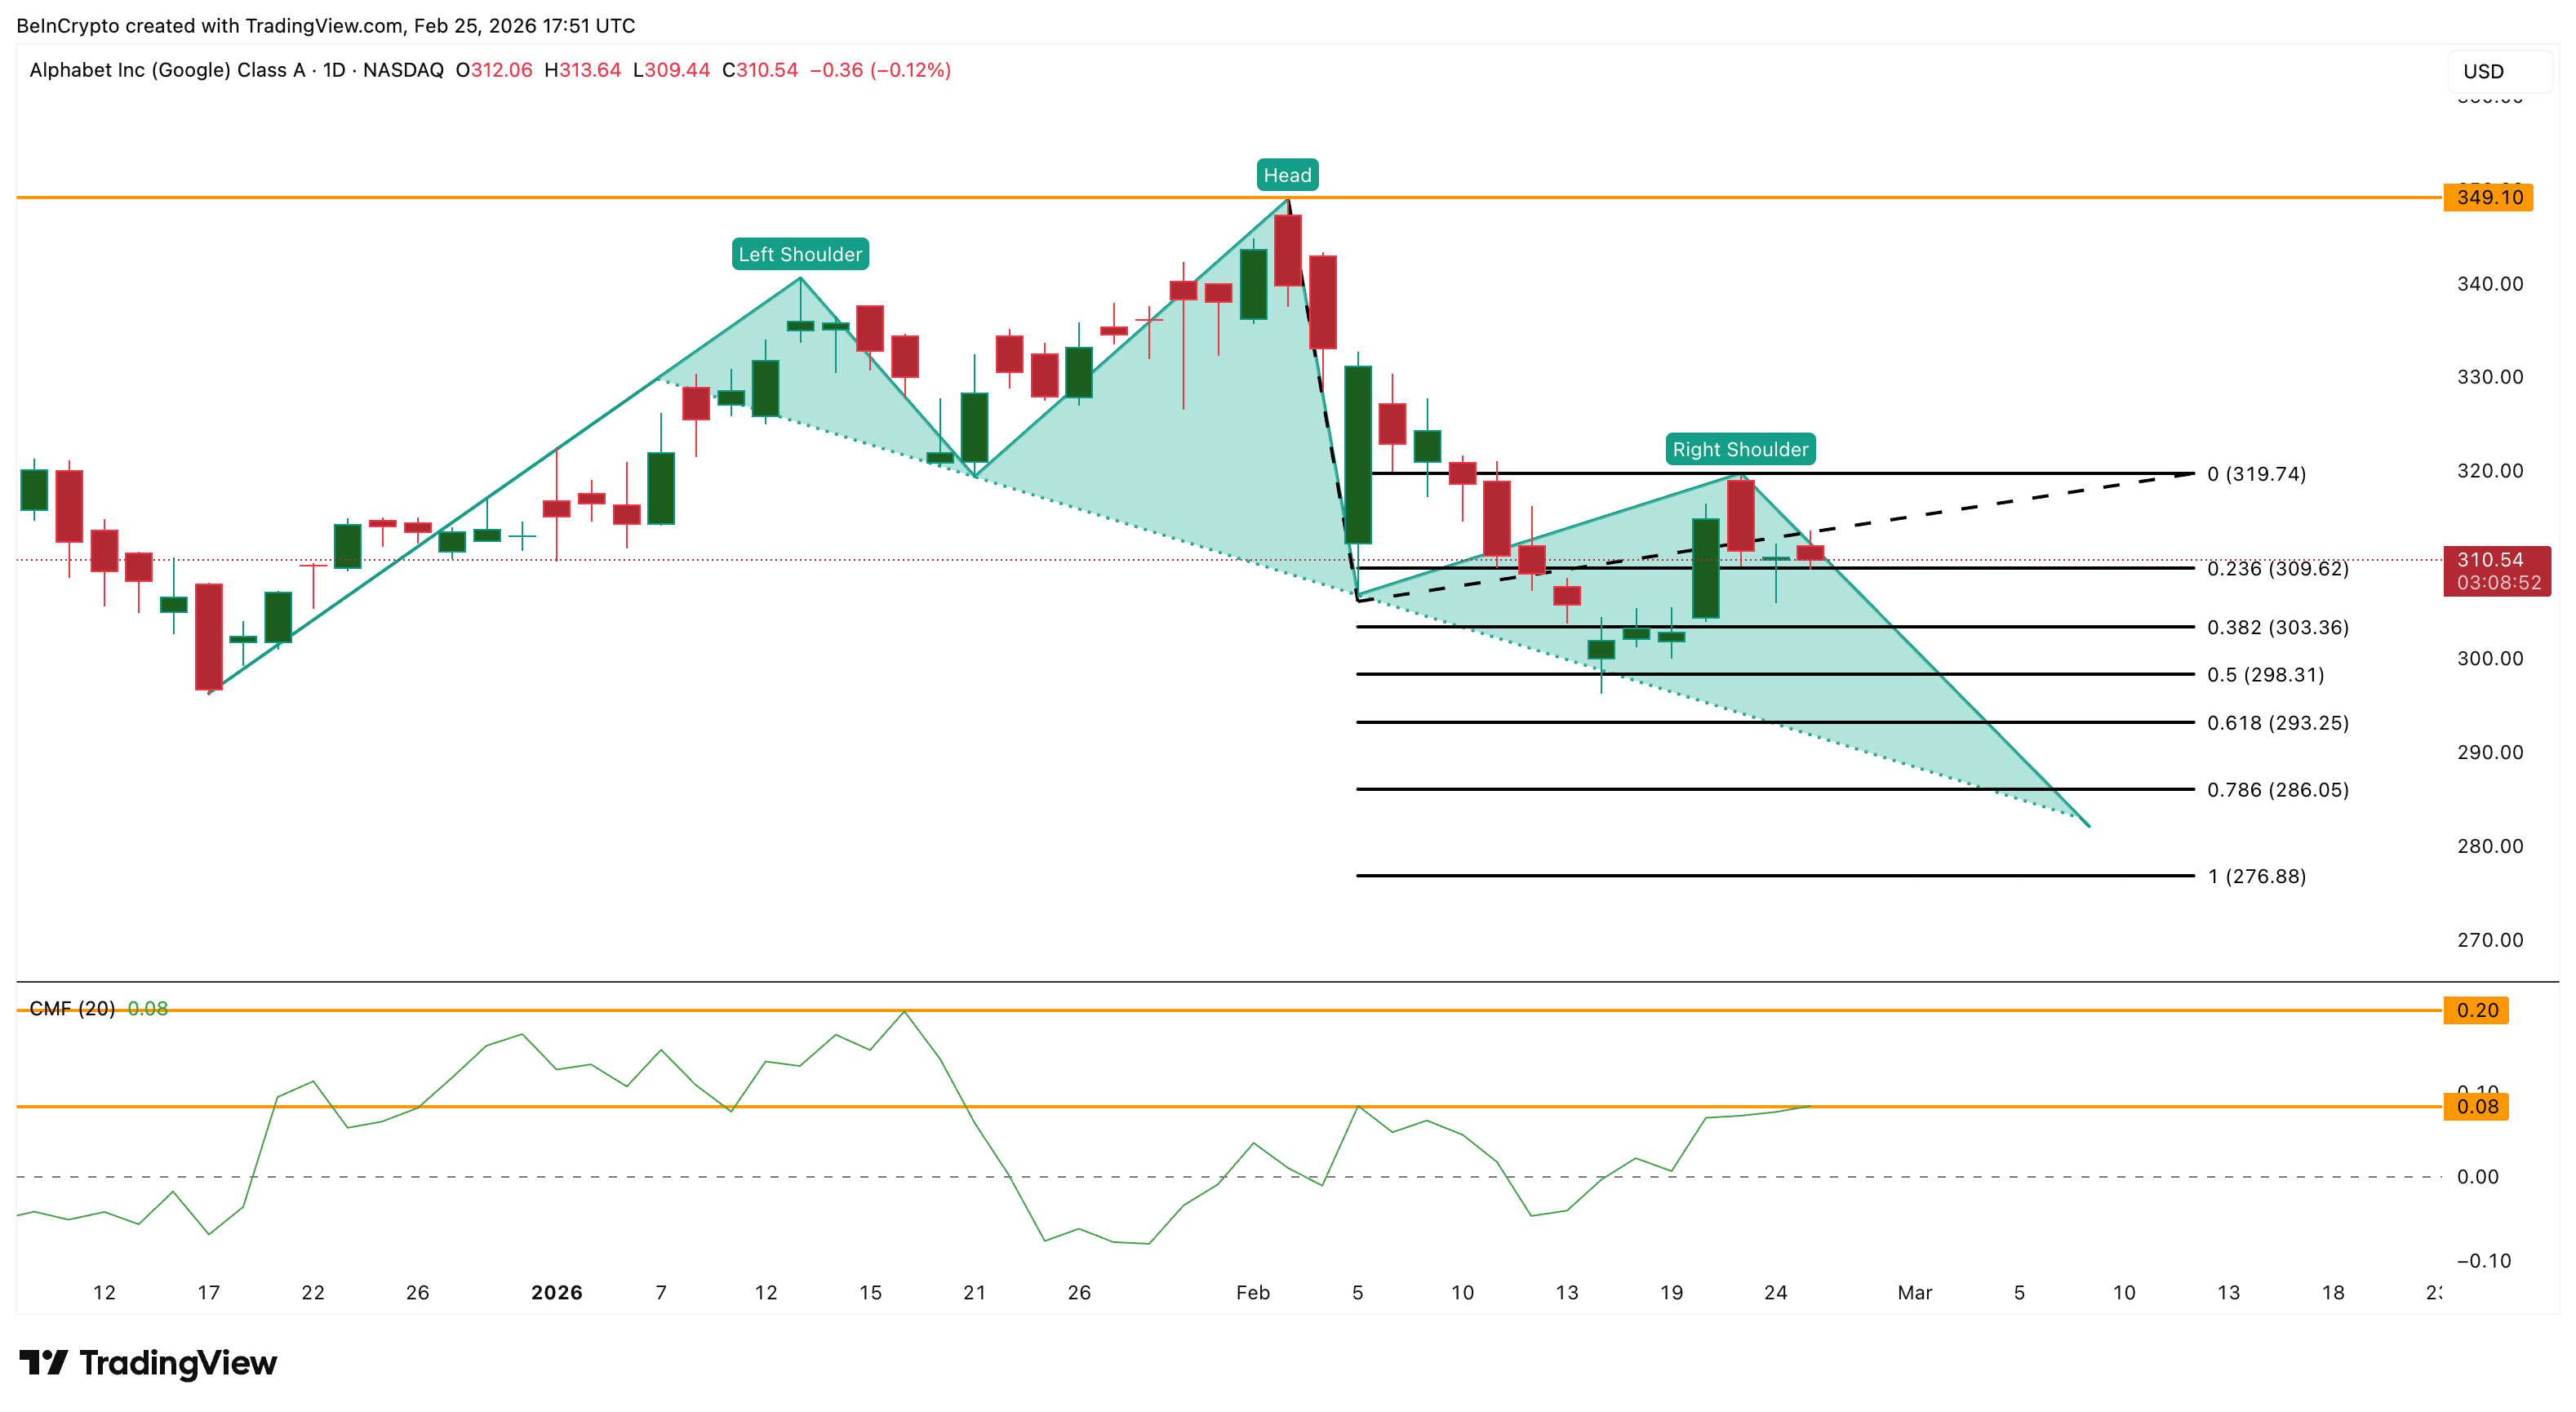
Even in the last quarter, 520 institutions opened new positions averaging $74 million each.
The fundamental edge is unique. Google doesn’t just use AI — it sells cheaper AI infrastructure to NVIDIA’s own customers. Its Ironwood TPUs cost roughly $15,000. NVIDIA’s GPUs cost $30,000-$40,000.
Google Cloud grew 48% last quarter. Operating margin jumped from 17.5% to 30.1% in one year.
And as a software and services company, Alphabet has zero tariff exposure — unlike NVIDIA’s 100%.
If the price breaks below $286, the bearish pattern confirms. That could push prices toward $276 and lower levels — likely triggered by broader tech selling or disappointing Cloud growth guidance.
But the CMF divergence and institutional flows suggest smart money is positioning for a reversal, not a breakdown.
Last on the list but not the least. This AI stock is up 64% year-on-year but flat over the last seven days.
An inverse head and shoulders pattern is forming now. This is a classic reversal structure, which can change the short-term weakness. The AVGO price is now moving toward the neckline at $350.
A breakout above that level opens the path for a near 20% move — potentially pushing AVGO close to $420. That breakout window aligns with early March, right around its Q1 FY2026 earnings on March 4. A beat-and-raise on March 4 could be the trigger that cracks the neckline of the bullish pattern.
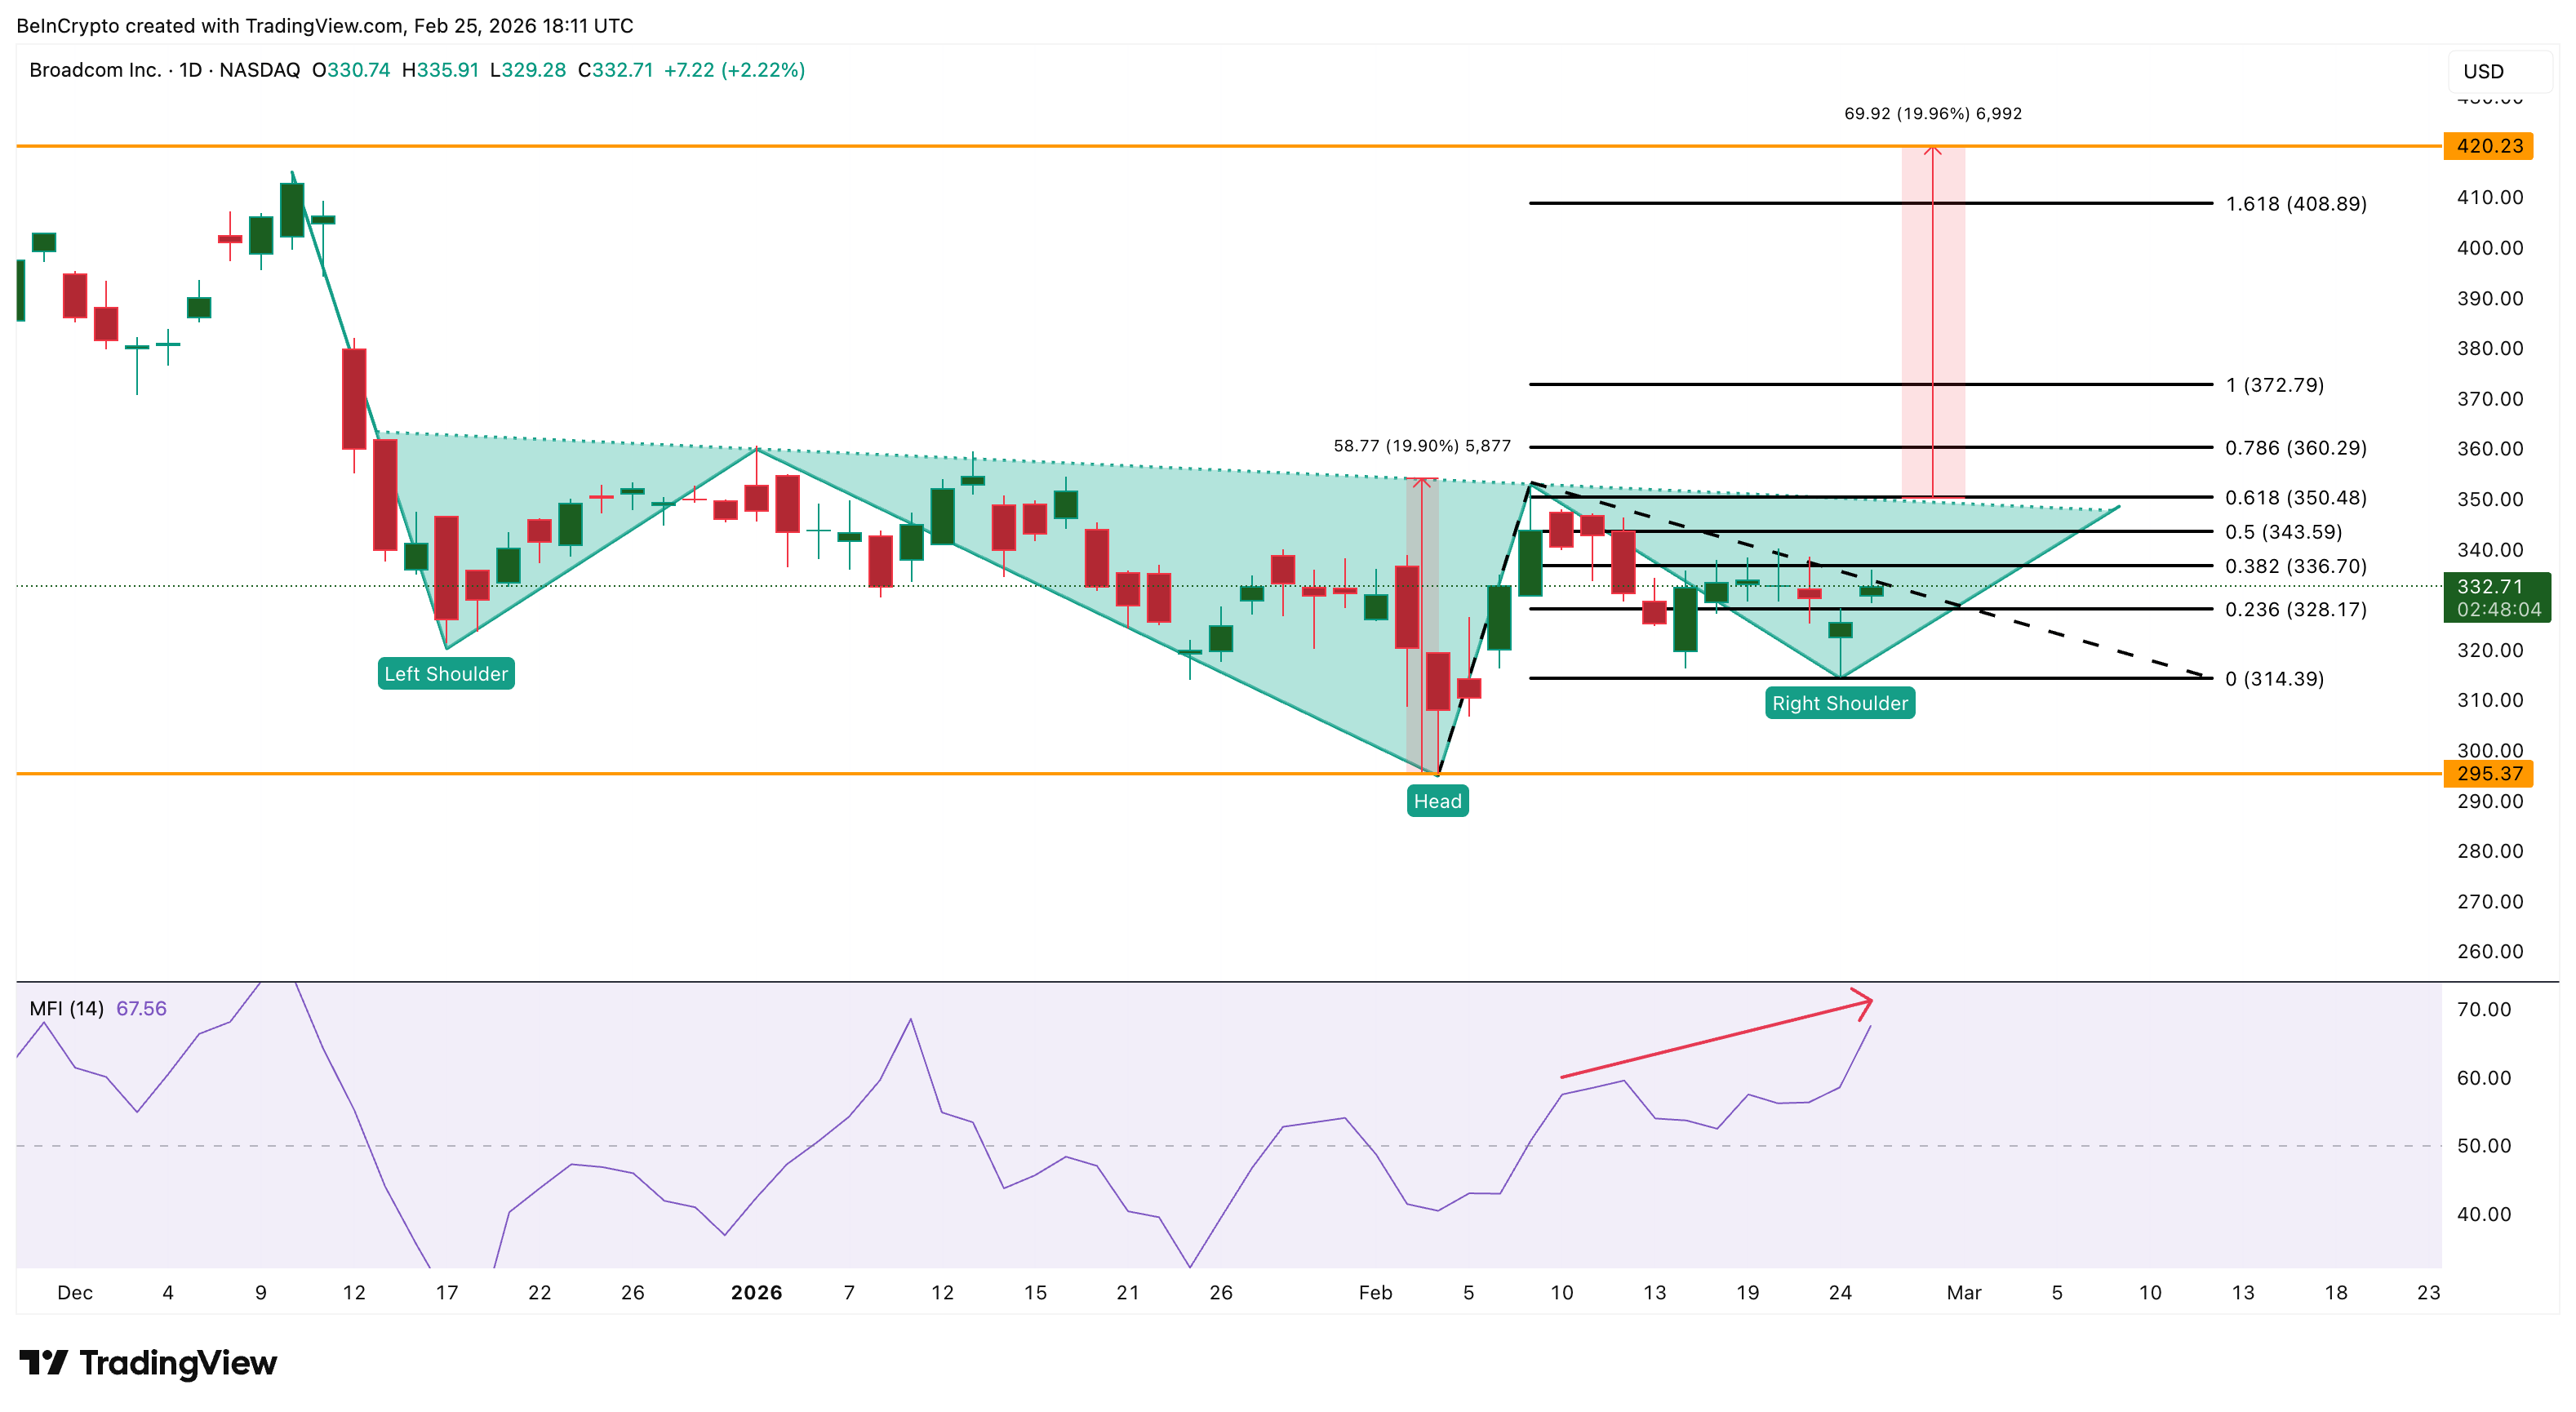
Here’s what makes Broadcom a direct NVIDIA challenger. AI is shifting from the training phase to inference — running models at scale for millions of users. NVIDIA GPUs dominate training. But for inference, custom ASICs are 3-5x more energy-efficient and cost way less.
Broadcom designs these ASICs for Google, Meta, ByteDance, and now OpenAI. As inference scales, Broadcom is positioned for the bigger phase ahead, courtesy of this AI shift.
The Money Flow Index (MFI) — which measures buying and selling pressure using both price and volume — confirms accumulation on dips.
Since February 10, while prices trended lower, MFI has trended higher. And that’s a bullish divergence. MFI currently sits around 67, still below the overheated 80 threshold. Room to run. This means, possibly retail is picking up AVGO shares at a clip.
On the downside, $314 is critical. A break below would weaken the bullish setup. Under $295, the inverse head and shoulders invalidates entirely. A broader AI spending slowdown or weaker-than-expected March 4 guidance could trigger that scenario.
Honorable Mention: Palantir Technologies (PLTR) — The Risky Bet
Palantir didn’t make the main list of AI stocks, courtesy of the high valuation risk.
But the chart is flashing reversal signals worth watching. Between February 5 and 24, the price made a lower low, yet the relative strength index (RSI), a momentum indicator, made a higher low. That’s a classic bullish divergence.
The CMF confirms it. Between February 9 and 25, prices trended down while CMF trended up. Two separate indicators pointing toward bullishness.
If $126 holds as a base, the first target is $143. Beyond that, $170 — a strong resistance from early January — becomes the key level.
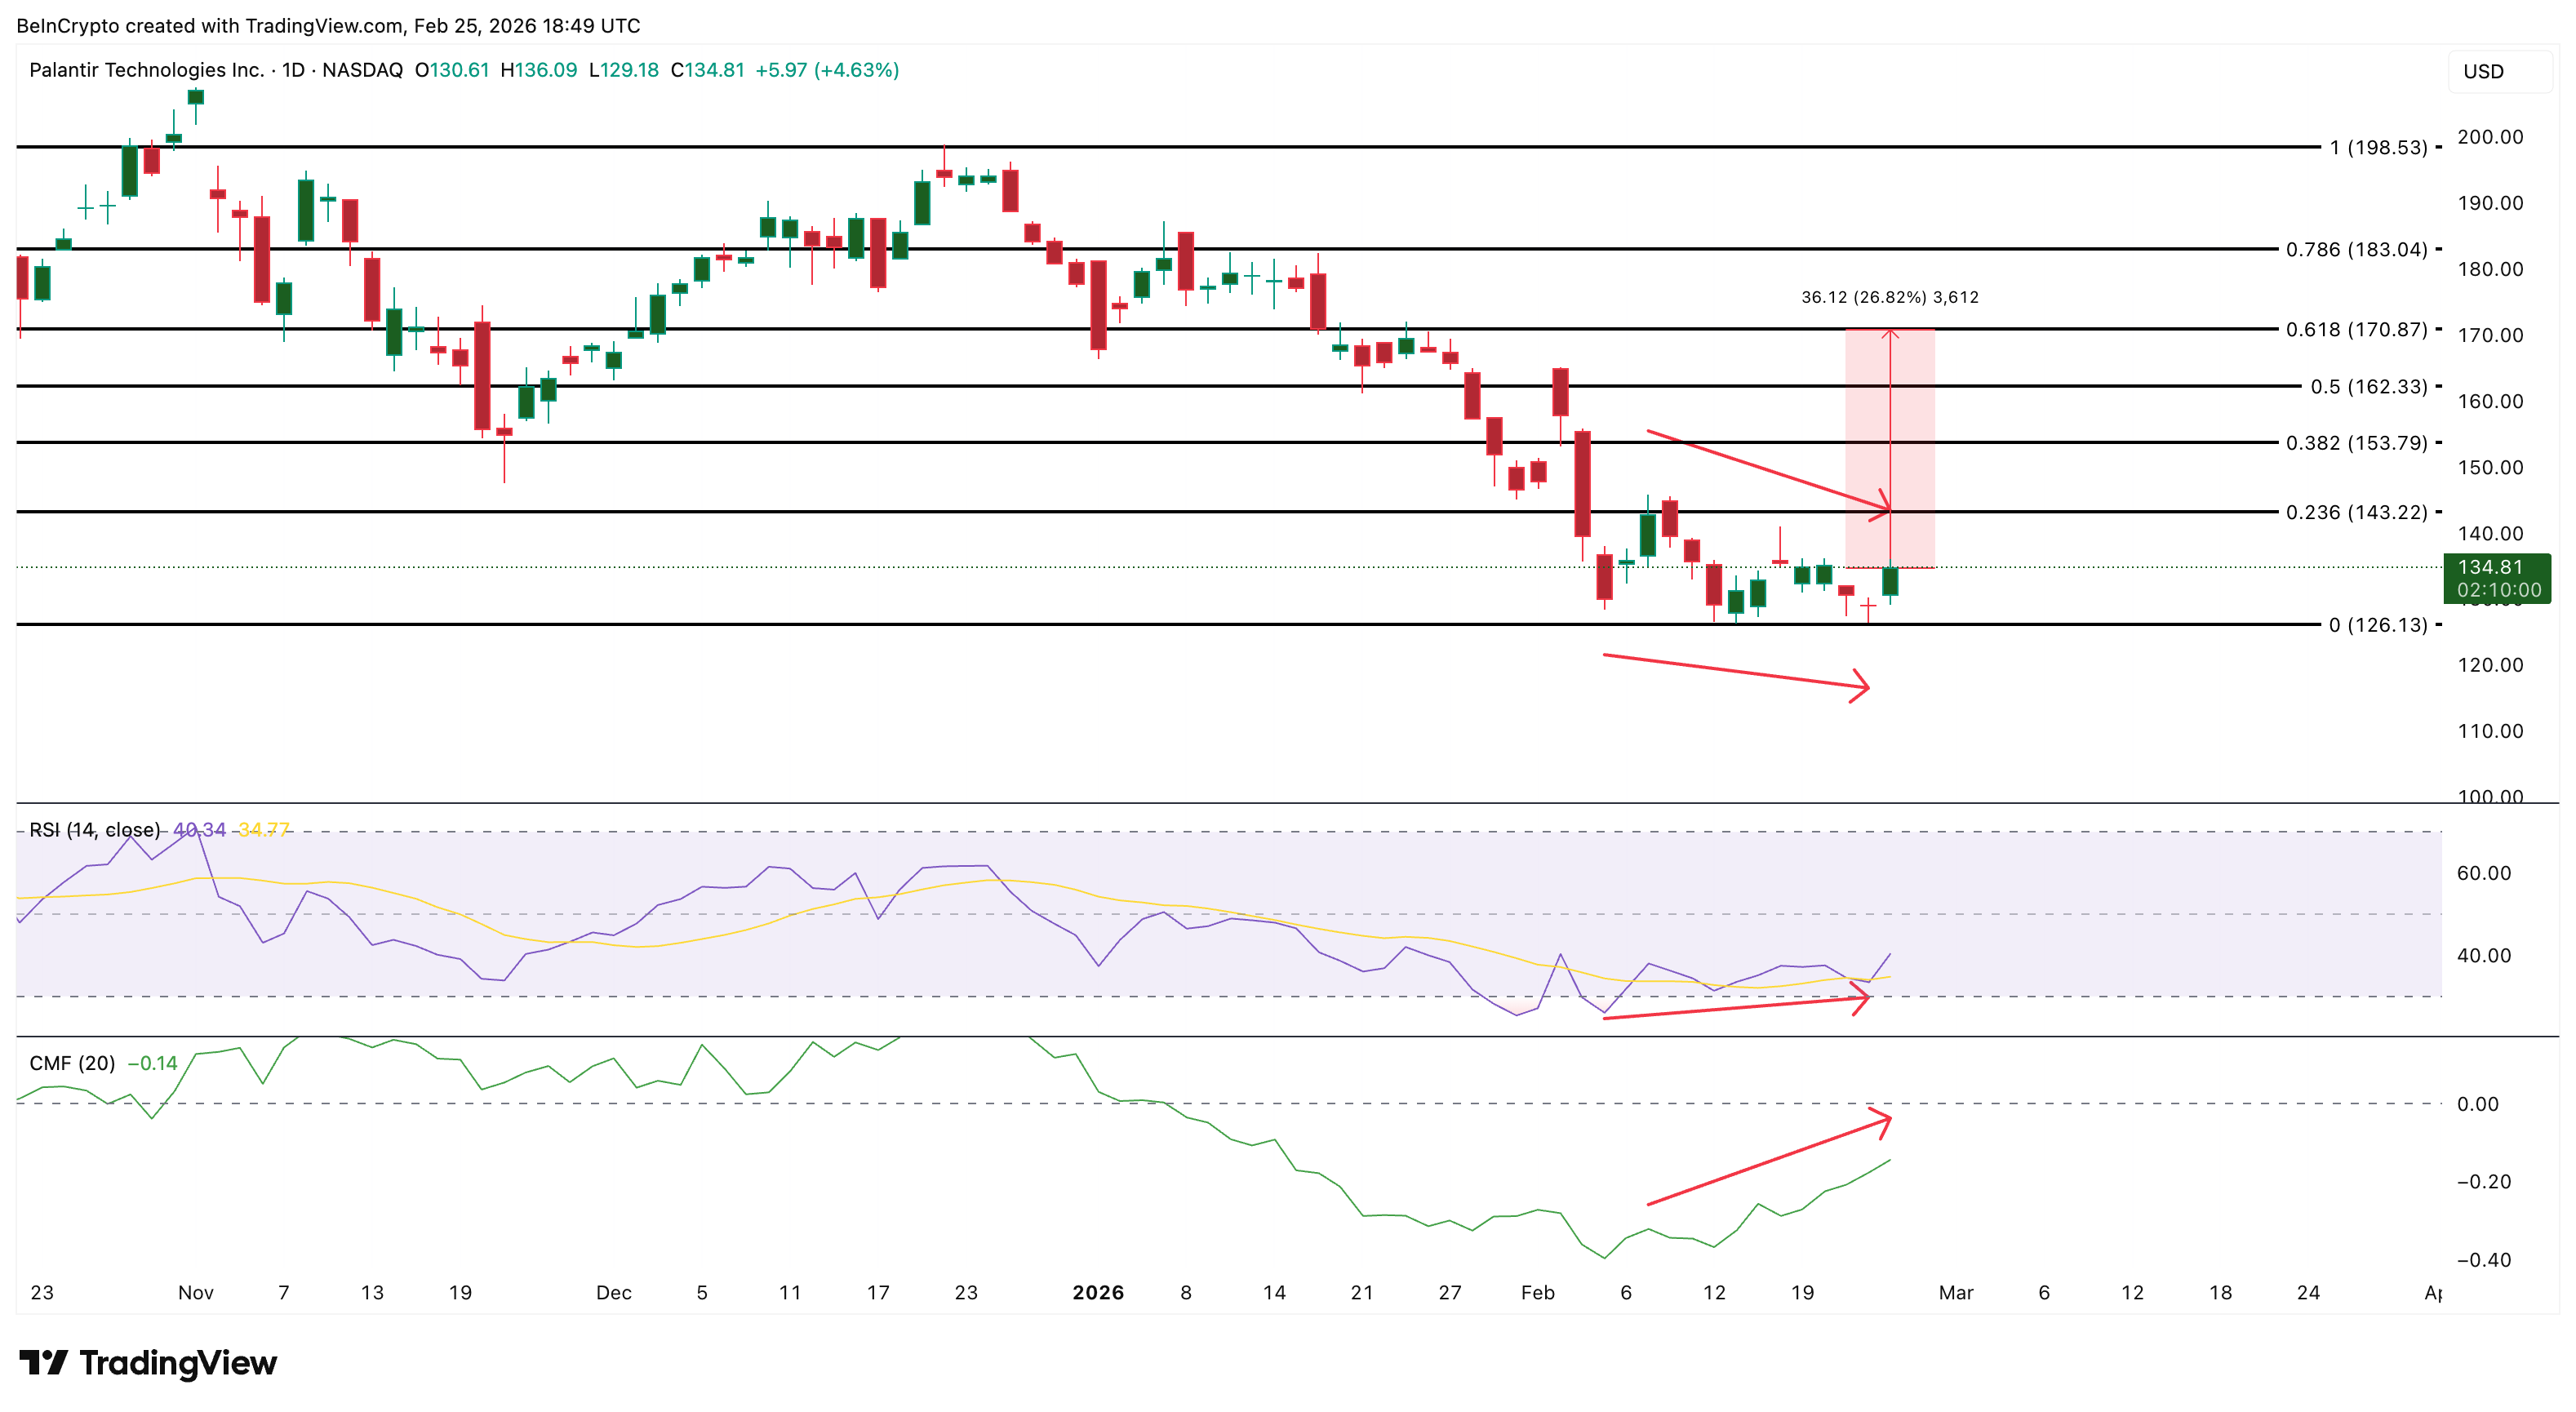
Fundamentally, Palantir is one of the few AI companies turning AI into real revenue. Last quarter delivered $1.41 billion — up 70% year-on-year. It carries zero debt, $4 billion in cash, and like the three main picks, zero tariff exposure. Pure software.
Here’s the catch. PLTR trades at over 200x P/E — meaning investors are paying $200 for every $1 the company earns. That’s a price tag that assumes everything goes perfectly.
Any stumble in growth, and the stock could fall hard. Moreover, losing $126 invalidates the entire setup.
Key points:
-
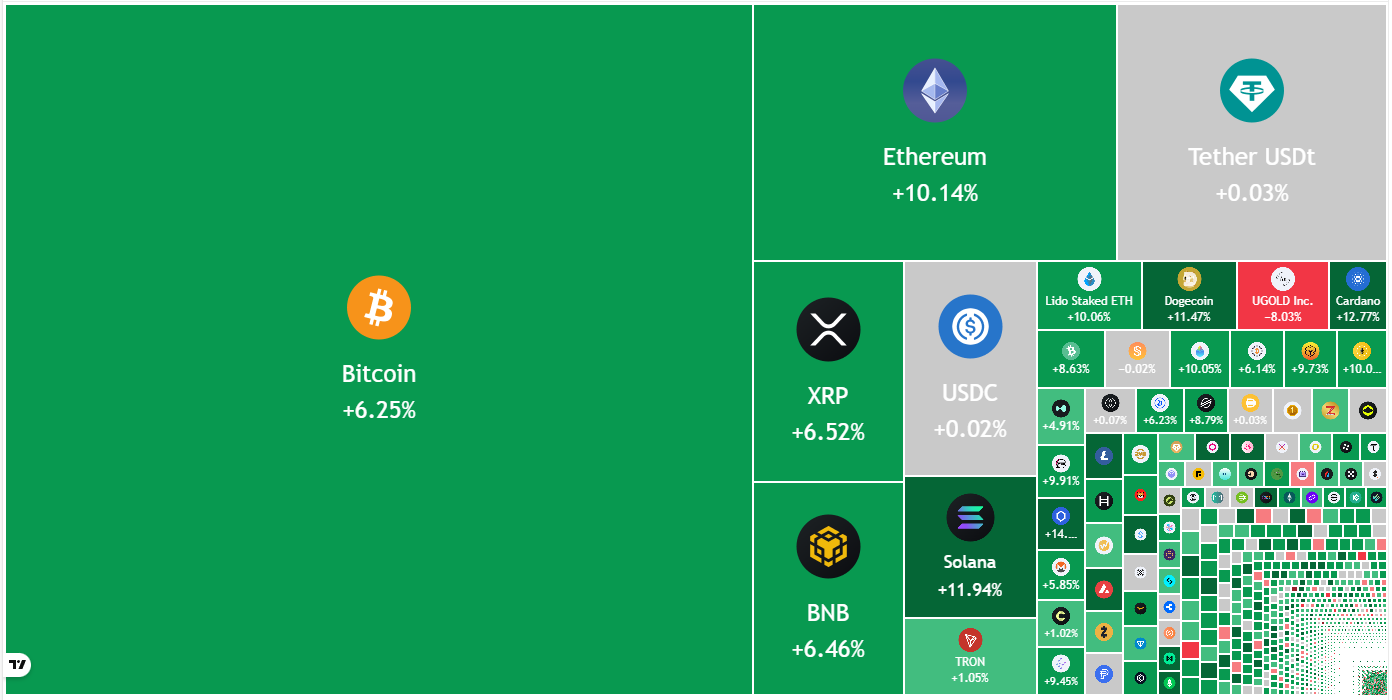
Bitcoin bulls have pushed the price above $69,000, signaling solid dip buying at lower levels.
-
Several major altcoins have turned up sharply, suggesting that selling pressure is reducing.
Bitcoin (BTC) bulls purchased Tuesday’s dip and are attempting to sustain the price above $69,000 on Wednesday. According to SoSoValue data, BTC exchange-traded funds recorded net inflows of $257.7 million on Tuesday, the largest inflows since Feb. 6. That suggests investors are viewing the dips near $60,000 as a buying opportunity.
Santiment said in a post on X that BTC’s correlation with stocks has broken down in the past six months. The S&P 500 rose 7% during the period, while BTC fell 43%. However, the on-chain data provider added that the disconnection is unlikely to stay forever. If BTC follows its historical pattern of tracking equities during economic expansions, then “it may have significant room to catch up.”

Not everyone is bullish on BTC’s prospects in the short term. Glassnode said in a post on X that BTC’s realized profit/loss ratio (90-day moving average) slipped below 1. Historically, breaks below 1 have resulted in at least six months of loss realization before the level was reclaimed.
Could BTC and select major altcoins break above their overhead resistance levels? Let’s analyze the charts of the top 10 cryptocurrencies to find out.
Bitcoin price prediction
BTC has risen sharply from the $62,510 level on Tuesday, indicating that the bulls are vigorously defending the $60,000 level.

Buyers will attempt to thrust the Bitcoin price above the 20-day exponential moving average ($69,375). If they succeed, the BTC/USDT pair may rally to the breakdown level of $74,508, where the bears are again expected to mount a strong defense.
Sellers will have to successfully defend the 20-day EMA if they want to retain the advantage. If the price turns down sharply from the 20-day EMA, the $60,000 support may be at risk of breaking down. If that happens, the pair may plummet to $52,500.
Ether price prediction
Ether (ETH) turned up from the $1,800 level on Tuesday, indicating that the bulls are attempting to retain the price inside the $1,750 to $2,111 range.

The relief rally is expected to face selling at the $2,111 level. If the Ether price turns down sharply from $2,111, the ETH/USDT pair may extend its stay inside the range for a few more days.
Alternatively, if buyers propel the price above the $2,111 level, it suggests that the bears are losing their grip. The pair may then surge to the 50-day SMA ($2,540), where the bears are again expected to step in.
XRP price prediction
XRP (XRP) turned up sharply and has reached the 20-day EMA ($1.46), indicating that the bulls are attempting a comeback.

If the XRP price closes above the 20-day EMA, the XRP/USDT pair may rally to the 50-day SMA ($1.70) and eventually to the downtrend line. Buyers will have to clear the hurdle at the downtrend line to signal a potential trend change.
Sellers are likely to have other plans. They will attempt to defend the moving averages and pull the price below the support line. If they can pull it off, the pair may nosedive to the Feb. 6 low of $1.11 and then $1.
BNB price prediction
BNB (BNB) has risen sharply from $577, indicating that the bulls are aggressively defending the $570 level.

Buyers will have to swiftly drive the price above the 20-day EMA ($641) to strengthen their position. If they manage to do that, the BNB/USDT pair may rise to $669 and eventually to $730.
Contrary to this assumption, if the BNB price turns down and breaks below $570, it indicates that the bears are in control. The pair may then resume the downtrend toward the psychological level at $500.
Solana price prediction
Solana (SOL) dipped below the $76 support on Tuesday, but the bears could not maintain the lower levels.

The SOL/USDT pair is attempting a recovery, which is expected to face selling at the 20-day EMA ($87). If the price turns down sharply from the 20-day EMA, the possibility of a break below the $76 level increases. The Solana price may then tumble to the Feb. 6 low of $67.
Instead, if bulls push the price above the 20-day EMA, the relief rally may reach the $95 level. This is a crucial level to watch out for, as a close above $95 suggests that the bulls are back in the game. The pair may then rally toward $117.
Dogecoin price prediction
Dogecoin (DOGE) turned up sharply from the $0.09 level, and the bulls are attempting to drive the price above the 20-day EMA ($0.10).

Sellers are unlikely to give up easily and will strive to defend the 20-day EMA. If the Dogecoin price turns down from the 20-day EMA, it increases the likelihood of a drop to the $0.08 support. Buyers are expected to fiercely defend the $0.08 level, as a close below it may start the next leg of the downtrend to the $0.06 level.
Buyers will have to maintain the price above the 20-day EMA to indicate that the bears are losing their grip. The DOGE/USDT pair may then march toward the breakdown level of $0.12.
Bitcoin Cash price prediction
Bitcoin Cash (BCH) turned down sharply from the 50-day SMA ($564) and fell below the $500 support on Monday.

The 20-day EMA has started to turn down, and the RSI is in the negative territory, indicating an advantage to the bears. That suggests the relief rally to the 20-day EMA is likely to be sold into. If the Bitcoin Cash price turns down from the 20-day EMA, the possibility of a drop to the $443 level increases.
The first sign of strength will be a close above the moving averages. The BCH/USDT pair may then rise to $580 and subsequently to $600.
Related: Bitcoin price climbs 3% as gold divergence signals ‘significant upside’
Hyperliquid price prediction
Hyperliquid (HYPE) fell below the 50-day SMA ($28.10) on Monday, indicating that the bears are attempting to take charge.

Buyers are striving to push the price back above the moving averages but are likely to face stiff resistance from the bears. If the Hyperliquid price turns down from the moving averages, the HYPE/USDT pair may drop to the solid support at $20.82.
Contrarily, if the price closes above the 20-day EMA ($29.31), it suggests buying at lower levels. The pair may then ascend to $32.50 and later to the stiff resistance at $36.77. The next trending move is expected to begin on a close above $36.77 or below $20.82.
Cardano price prediction
The bears failed to pull Cardano (ADA) to the support line of the descending channel pattern, indicating a lack of selling at lower levels.

The buyers are attempting to make a comeback by sustaining the Cardano price above the 20-day EMA ($0.28). If they manage to do that, the ADA/USDT pair might rally to the downtrend line.
If the price turns down sharply from the downtrend line and breaks below the 20-day EMA, it suggests that the pair may remain inside the channel for a while. The bulls will have to secure a close above the downtrend line to gain the upper hand.
Monero price prediction
Monero (XMR) fell below the immediate support at $309 on Monday, but the bears could not sustain the lower levels.

The bulls are attempting a relief rally, which is expected to face selling at the 20-day EMA ($346) and then at the breakdown level of $360. If the Monero price turns down from the overhead resistance, it suggests a range-bound action between $360 and $300 for some time.
The advantage will tilt in favor of the bulls if they push and maintain the XMR/USDT pair above the $360 level. If they do that, the pair may surge toward the 50-day SMA ($435).
This article does not contain investment advice or recommendations. Every investment and trading move involves risk, and readers should conduct their own research when making a decision. While we strive to provide accurate and timely information, Cointelegraph does not guarantee the accuracy, completeness, or reliability of any information in this article. This article may contain forward-looking statements that are subject to risks and uncertainties. Cointelegraph will not be liable for any loss or damage arising from your reliance on this information.


Nicholas Hammer, co-founder and CEO of crypto lender Blockfills, has stepped down from his leadership role, according to a person with direct knowledge of the matter.
The firm’s website now lists Joseph Perry as the interim CEO. A company spokesperson confirmed that Hammer was CEO until July 2025.
The change of leadership comes as the firm has suffered losses of around $75 million and suspended client deposits and withdrawals earlier this month.
Blockfills is also said to have urged some clients to withdraw their crypto assets before the platform halted deposits and withdrawals on Feb. 11, the person said, who spoke on condition of anonymity as the matter is private. Customer deposits remain suspended as of publication time.
CoinDesk reported last week that the Chicago-based firm was seeking a buyer after the losses.
Hammer did not respond to a request for comment by the publication time. His LinkedIn profile, as of 5.58 pm UTC on Feb. 25, still lists him as CEO of Blockfills.
The firm said in the Feb. 11 press release that it was working with investors and clients to reach a swift resolution and restore liquidity to the platform.
“Clients have been able to continue trading with BlockFills for the purpose of opening and closing positions in spot and derivatives trading and select other circumstances,” the company said at the time.
Blockfills’ abrupt halt to withdrawals revives memories of the 2022 crypto winter, when firms including Celsius, BlockFi and Genesis froze customer accounts as markets unraveled.
The market has struggled to regain traction in early 2026, with major tokens well below recent highs amid cautious sentiment. Bitcoin has remained below $70,000 after a sharp pullback from its late-2025 all-time high, while ether (ETH) trades around $2,000 amid weakness across the digital asset market.
The company said it handled more than $60 billion in trading volume in 2025, up 28% from a year earlier, and ranks among the most active institutional crypto lending and borrowing desks. It serves roughly 2,000 institutional clients, including hedge funds, asset managers and mining firms.
Blockfills is backed by investors including Susquehanna Private Equity Investments, CME Ventures, Simplex Ventures, C6E and Nexo. The company raised $37 million in a January 2022 Series A funding round.
Read more: Susquehanna-backed Blockfills up for sale after $75 million lending loss
UPDATE (Feb. 25, 6 pm UTC): Updates story with the company’s comment on the CEO’s departure.
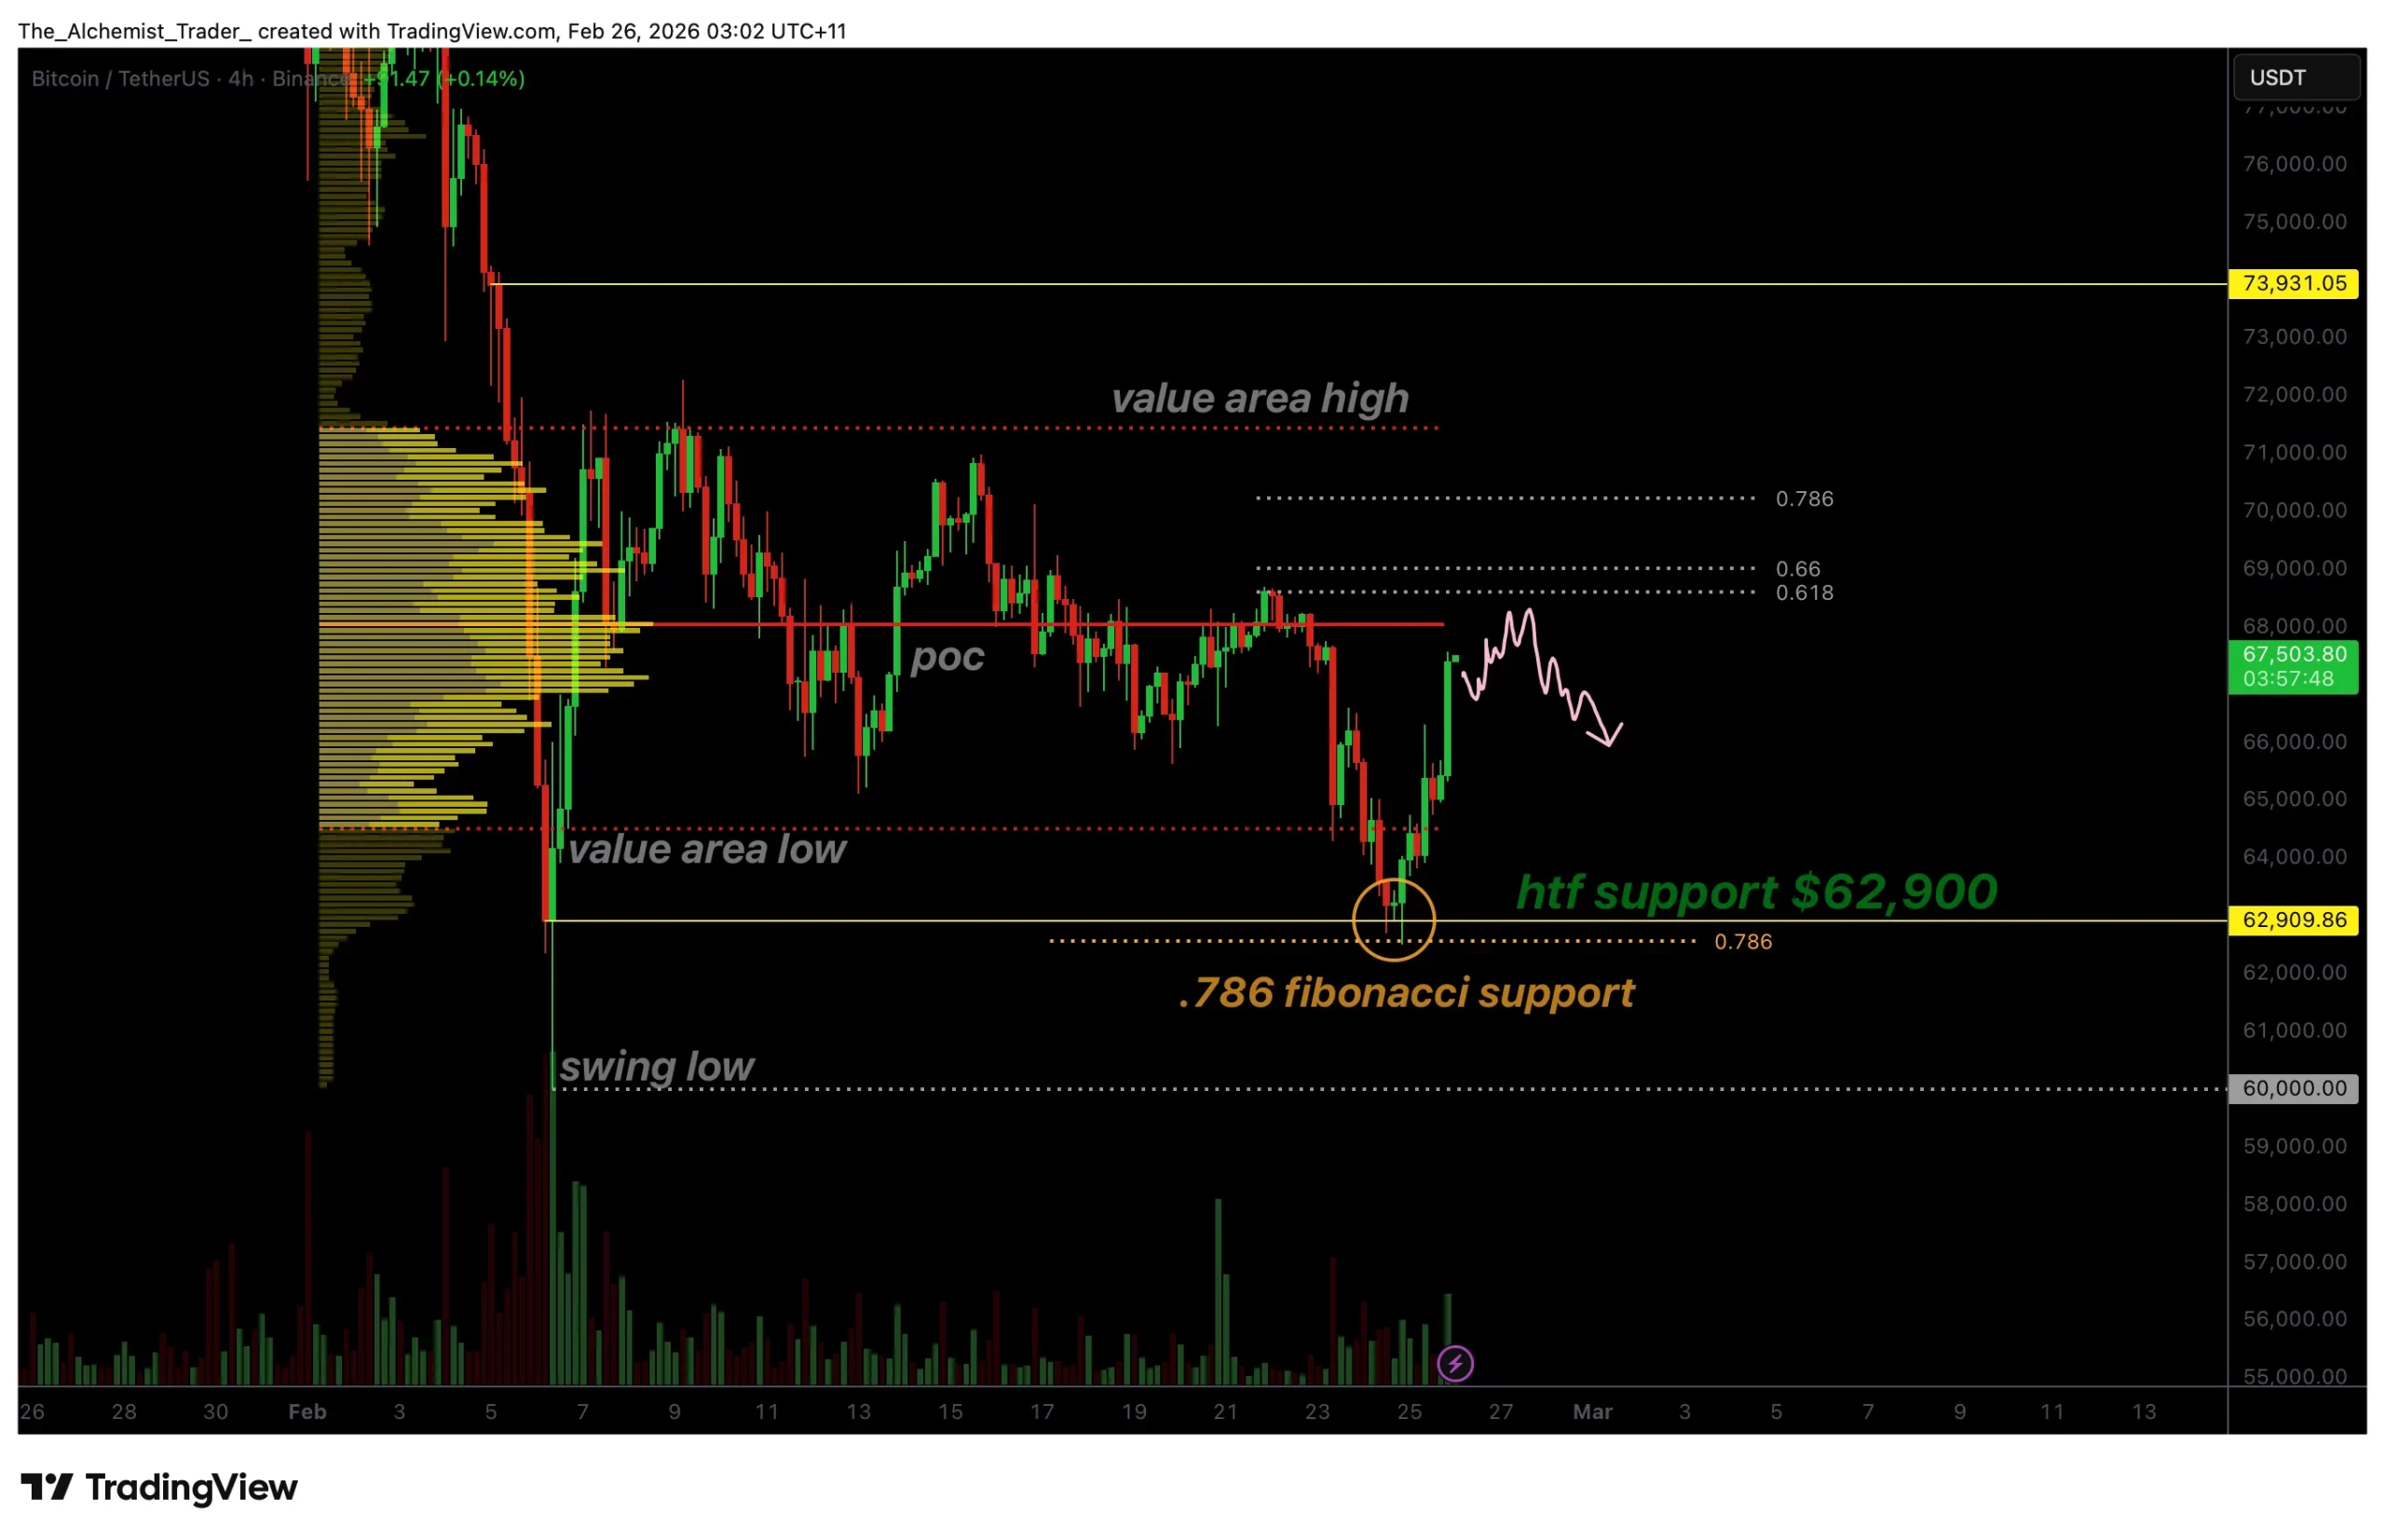
Bitcoin price has rebounded strongly from key Fibonacci support near $62,000 with rising volume, signaling growing demand and raising the possibility of a local bottom formation.
Summary
- Bitcoin bounced from 0.786 Fibonacci support near $62K
- Increasing volume suggests genuine buyer demand
- Reclaim of point of control needed to confirm bullish continuation
Bitcoin (BTC) price action has shifted momentum following an impulsive reaction from a major technical support zone. After testing the 0.786 Fibonacci retracement level, which aligns closely with daily high-timeframe support near $62,000, Bitcoin staged a strong rally that has drawn renewed attention from market participants.
The reaction from this level stands out not only because of the price recovery itself but also due to a noticeable increase in trading volume. In technical analysis, rebounds supported by expanding volume often suggest genuine demand rather than temporary relief rallies. This has led traders to question whether Bitcoin may be forming a local bottom within its broader range structure.
While confirmation remains necessary, the current setup represents one of the more constructive technical developments seen in recent weeks.
Bitcoin price key technical points
- 0.786 Fibonacci support defended: Confluence with $62,000 daily support triggered strong reaction
- Volume expansion confirms demand: Increasing participation supports reversal thesis
- Point of control critical resistance: Reclaim required for continuation toward higher prices
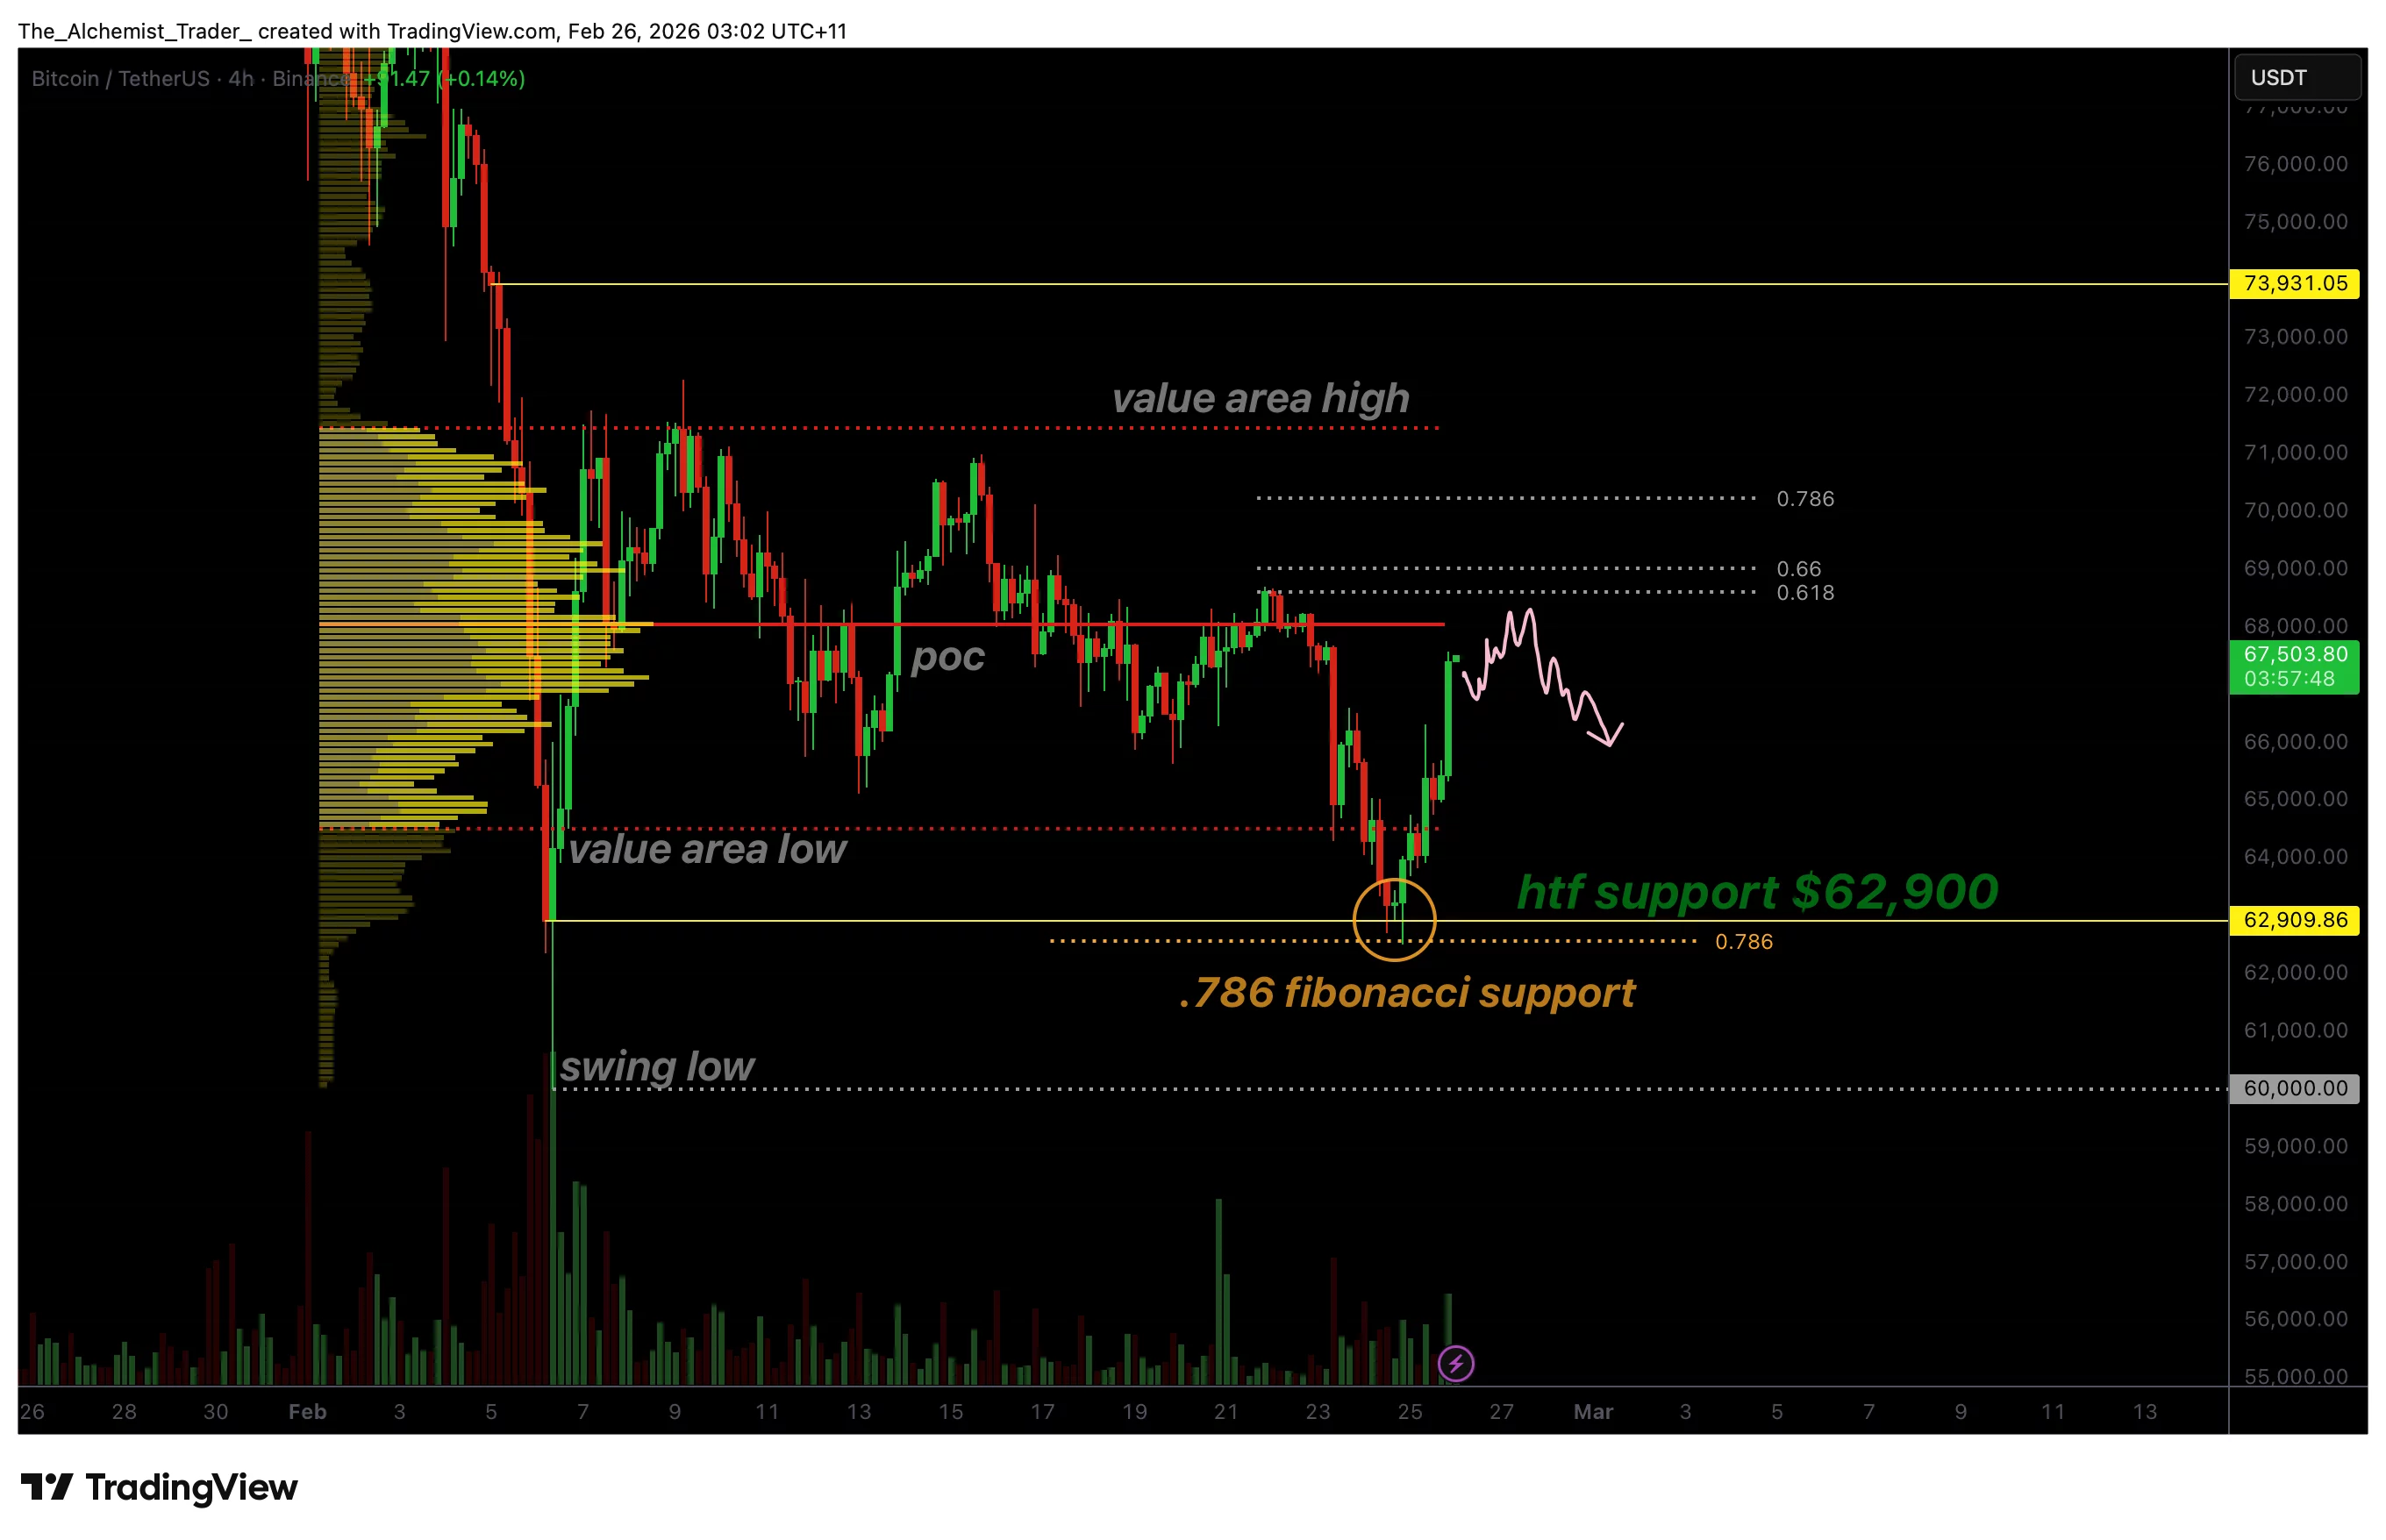
Bitcoin’s recent rally began at the 0.786 Fibonacci retracement, a deep corrective level often associated with trend continuation or major turning points. The significance of this reaction is amplified by its alignment with the daily high-timeframe support near $62,000, creating a powerful zone of technical confluence.
Markets frequently respond strongly when multiple technical levels converge. In this case, Bitcoin’s bounce suggests that buyers viewed the region as an attractive value area. Instead of continued downside expansion, price reversed sharply, indicating that selling pressure was absorbed efficiently.
The impulsive nature of the move reflects a shift in short-term market dynamics. Rather than drifting sideways, Bitcoin advanced rapidly into higher value, signaling renewed confidence among buyers.
Rising volume supports reversal narrative
One of the most important elements supporting the bullish case is the increase in volume accompanying the rally. Strong reversals are typically characterized by expanding participation, demonstrating that market participants are actively entering positions rather than merely closing shorts.
Even as broader adoption narratives continue to develop, such as Arizona lawmakers advancing legislation to create a Digital Assets Strategic Reserve Fund allowing the state to hold and invest seized cryptocurrencies.
The current volume profile shows increasing activity as price moves higher, suggesting that demand is driving the move rather than passive market conditions. This distinguishes the rally from previous bounces that lacked conviction and quickly faded.
When price rises alongside increasing volume, it often signals the early stages of a structural shift. While not definitive proof of a long-term trend reversal, it increases the probability that the recent lows may represent a local bottom.
Point of control becomes the key decision level
Despite the constructive rally, Bitcoin now faces a critical test at the point of control (POC) within the current trading range. The POC represents the price level where the highest volume has historically traded and typically acts as equilibrium between buyers and sellers.
For bullish continuation to develop, Bitcoin must reclaim this level on a daily closing basis. Acceptance above the POC would indicate that value is migrating higher, opening the door for expansion toward upper range resistance levels.
However, failure to reclaim this zone could shift the outlook quickly. Rejection at the point of control would signal that sellers remain active, potentially triggering another rotational move back toward lower support levels within the broader range.
This comes as Nakamoto finalizes a $107.3M all-stock deal with BTC Inc and UTXO to expand its Bitcoin media and treasury platform, highlighting growing institutional positioning despite fragile short-term price action.
What to expect in the coming price action
From a technical, price action, and market structure perspective, Bitcoin’s rally from the 0.786 Fibonacci support near $62,000 is a constructive development supported by increasing volume. A confirmed reclaim of the point of control on a closing basis would strengthen the bullish case and increase the probability of continuation toward higher price targets.
Conversely, rejection at this level may keep Bitcoin trading within its existing range, leading to renewed rotations toward support before a decisive breakout occurs.


US senators have labeled Binance a “repeat offender” as they prepare to launch an inquiry into nearly $2 billion worth of crypto that was sent to Iran, raising doubts over the exchange’s commitment to a plea deal agreement with the Department of Justice.
Democrat Senator Richard Blumenthal, who represents the Subcommittee on Investigations, wrote to Binance CEO Richard Teng on Tuesday, asking him to provide information on the company’s role in sanction-dodging transactions to Iranian and Russian entities.
The letter reads: “Binance appears to have ignored warnings and recommendations to prevent Iranian money laundering schemes on its cryptocurrency exchange, allowing $1.7 billion in transfers to Iran. These transactions have helped prop up Iranian-linked terrorist organizations and illicit Russian oil sales.”
Read more: Binance demands the Wall Street Journal remove ‘damaging’ article
It also claims that Binance is revisiting the crimes of its past, specifically from 2023, when it was found guilty of charges including sanction violations stemming from crypto sent to Iranian entities.
“Binance is a repeat offender: it has long been aware that the Iranian regime and its terrorist proxies use its cryptocurrency platform as a convenient and reliable means to bypass international sanctions, anti-money laundering controls, and other banking restrictions,” it reads.
Blumenthal continues, “Instead of actually preventing illicit use, Binance has sought to evade accountability and influence the White House through lobbying and a financial partnership with World Liberty Financial (WLFI).”
The letter also claims, “The scale of the newly-revealed illicit transfers uncaught until nearly two billion dollars flowed to sanctioned entities and the unexplained firing of internal investigators call into question Binance’s compliance with American sanctions and banking laws, and its 2023 agreement to resolve the previous federal investigation.”
Blumenthal backs up his allegations by noting Binance’s deep connections with the Trump family and WLFI through promotions, and the housing of 85% of WLFi’s stablecoin USD1 in Binance accounts.
All this, he says, led to a successful “influence campaign” that secured Changpeng Zhao’s pardon and the dismissal of a lawsuit against Binance.
Binance reportedly didn’t stick to compliance measures
The Wall Street Journal, Fortune, and The New York Times have all reported on two Binance clients, Hexa Whale and Blessed Trust, acting as intermediaries for Iran’s Revolutionary Corps.
These accounts allowed Iran to launder funds and trade oil outside the traditional banking system and sanctions.
Blessed Trust repeatedly raised internal alerts at the firm. When investigators eventually discovered the extent of funds going to Iran’s government, they flagged it to Binance’s top execs before they were fired weeks later.
Richard Teng has denounced the latest article published by the WSJ as “defamatory” and “damaging,” claiming it ignored the responses given by Binance’s client.
Teng demanded that the WSJ take down its article and make corrections “immediately” or else it might take “further action.”
Read more: Iran’s central bank stacked $507M USDT last year, report
Binance claimed, “While you solicited our client’s position, your failure to reflect our client’s responses is inconsistent with your ethical obligations to ‘remain fair, accurate and impartial,’ and suggests an agenda already set, which does not amount to responsible journalism.”
The crypto exchange refuted how the WSJ framed the firings, noted that it did remove the flagged accounts after they were discovered, and disputed any suggestion that Binance had some sort of access and control over the Blessed account.
Blumenthal wants Binance to cough up documents
Blumenthal’s inquiry has ordered Binance to submit a trove of documents related to the dubious accounts, the internal reports filed by compliance investigators, use of Binance by Iranians, the use of Tether and USD1 in connection to criminals, Binance’s use in illegal oil sales, and details regarding the firing of its investigators.
Got a tip? Send us an email securely via Protos Leaks. For more informed news and investigations, follow us on X, Bluesky, and Google News, or subscribe to our YouTube channel.

As the cryptocurrency market navigates a challenging period, Google Trends data shows a notable shift in crypto-related search behavior during the prolonged bear market.
While price charts reflect a gloomy atmosphere, a new wave of interest is quietly forming. This trend could create a pivotal shift for the market’s next cycle.
Diverging Retail Investor Sentiment Toward the Crypto Market
Google Trends data shows a sharp surge in negative and extreme search keywords. Phrases such as “Bitcoin to zero” and “Bitcoin is dead” are experiencing record growth.
People who question Bitcoin’s existence demonstrate they already have some awareness of the asset. However, they have not experienced the market long enough to understand how Bitcoin has navigated previous bear market cycles.
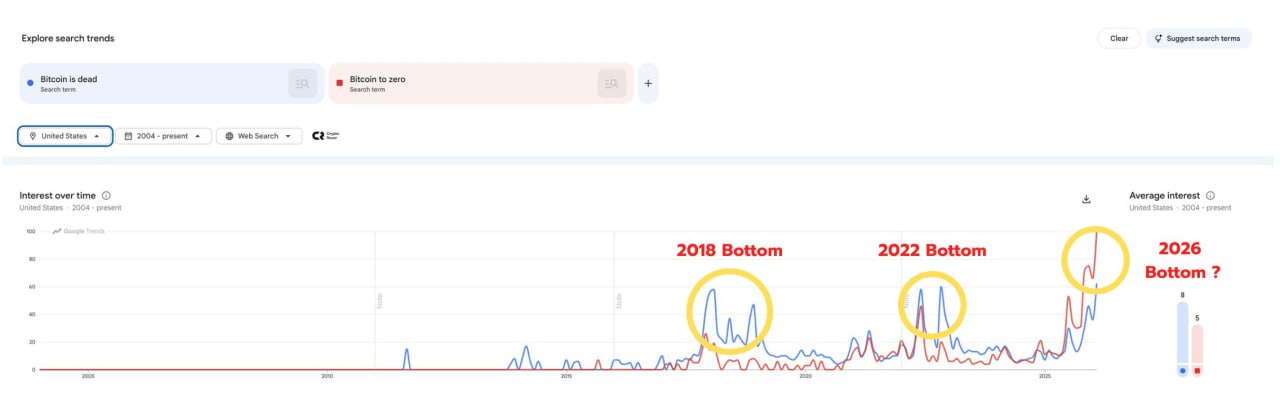
More experienced investors often compare current conditions with historical data. They observe that periods when negative search trends peak at such high levels frequently signal a potential cycle bottom.
Investor NoName notes that these search queries are twice as high as in previous bear markets. They even exceed levels recorded during the COVID period.
“Buy Bitcoin every time ‘Bitcoin Is Dead’ Is Trending! You would have made unbelievably high returns,” investor Robin Seyr states.
The website Bitcoin Deaths tracks how often traditional media channels declare that “Bitcoin is dead.” The data shows at least 467 such occurrences.
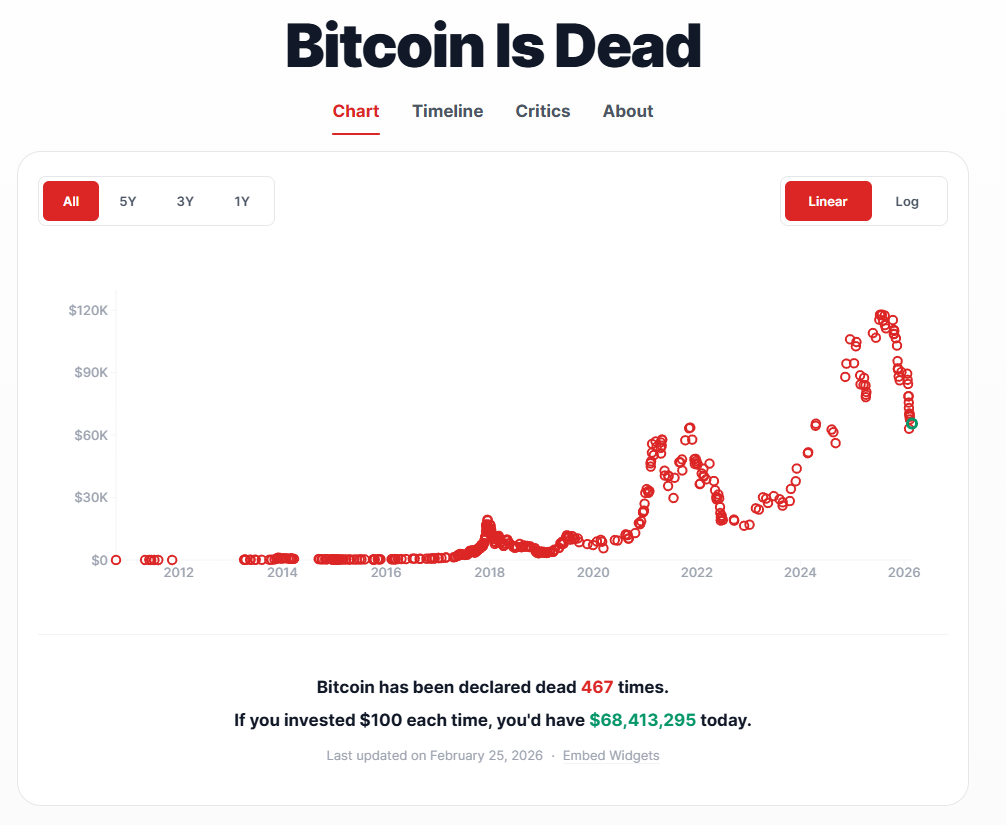
If an investor had purchased $100 worth of Bitcoin each time such a declaration appeared, that investor could now hold assets valued at more than $68 million.
An Unprecedented Surge in “What Is Bitcoin” Searches
Another notable point emerges when comparing negative keywords with the search term “What is Bitcoin.” The data reveals an unprecedented phenomenon in Bitcoin’s history.
Actual data shows that searches for this question have reached an all-time high. The contrast between two search trends—one questioning Bitcoin’s survival and the other seeking basic knowledge—creates a striking picture of divided sentiment in February.
Unlike those who fear that Bitcoin will “go to zero,” individuals seeking this fundamental definition are often complete newcomers. They typically have no prior knowledge or investment experience in the cryptocurrency market.
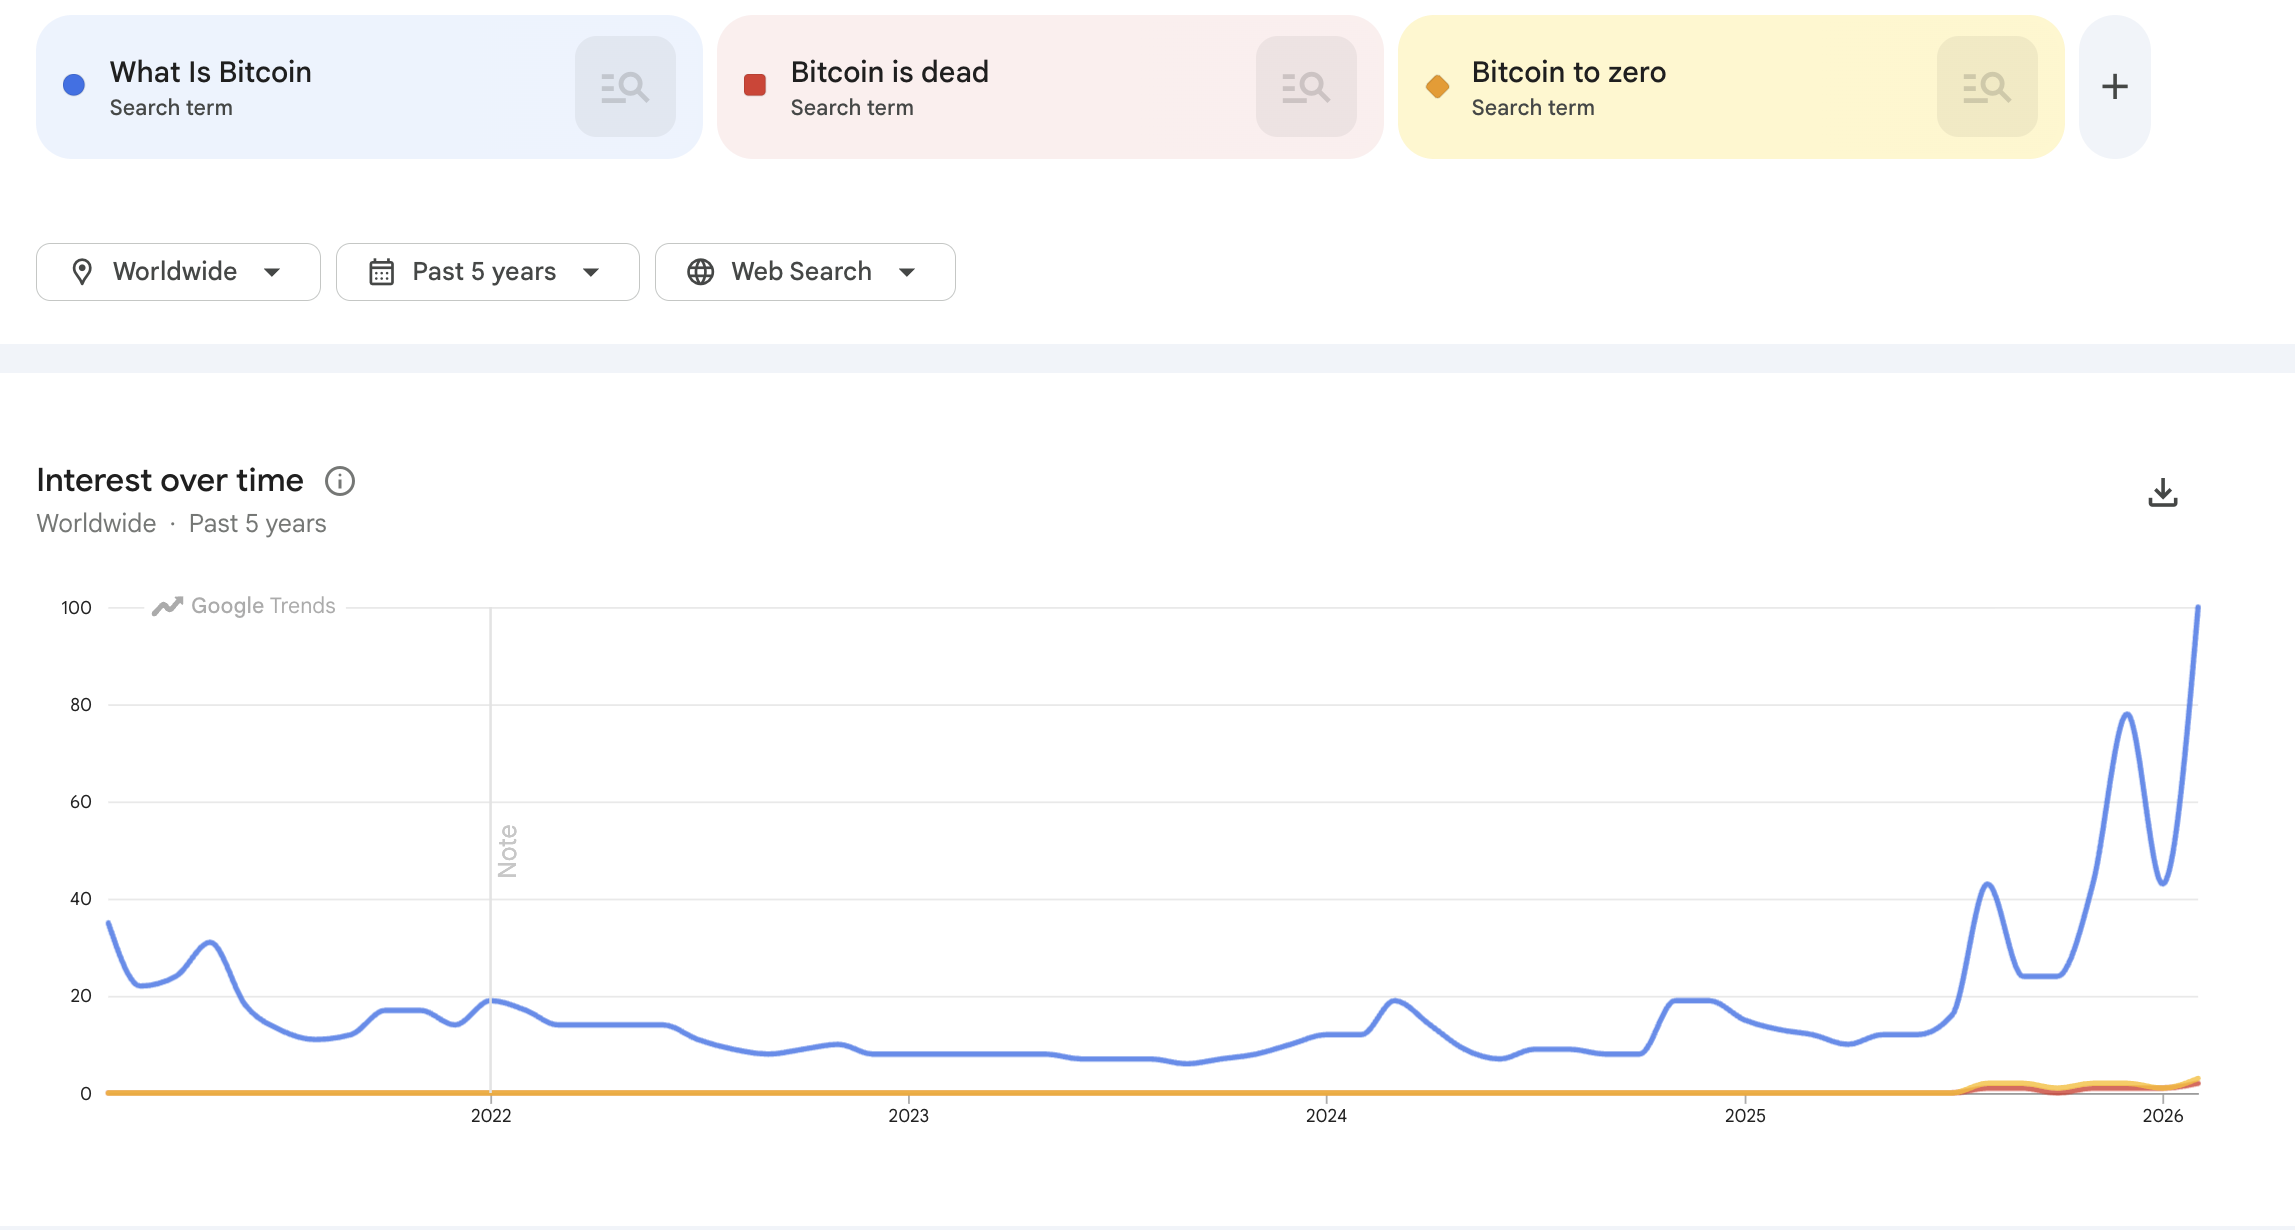
When compared directly with negative keywords, searches for “What is Bitcoin” significantly outperform them.
A large number of users are rushing to explore the most basic concepts during a market downturn. This development deserves careful consideration. It indicates that Bitcoin, despite trading at lower prices, continues to maintain a strong appeal. It is also reaching segments of the population that previously showed no interest in digital finance.
“Somewhere out there, millions are meeting Bitcoin for the first time,” Binance states.
However, search activity does not necessarily translate into capital inflows. The surge in the keyword “What is Bitcoin” may serve as an early indicator of the emergence of an entirely new generation of first-time retail investors.


Kalshi, one of the leading prediction market firms, said it caught and penalized two users for insider-trading activity on its platform, including an editor for the popular social-media star MrBeast.
The company said it has more than a dozen active insider-trading cases among 200 it’s investigated. On Wednesday, Kalshi disclosed the details of two that it resolved, including against Artem Kaptur, who was identified as working for James Donaldson, known for his MrBeast persona that’s tied to its massive social-media presence as well as the reality competition show, “Beast Games.”
Kaptur was said to have entered $4,000 in trades regarding what would occur on the MrBeast show, for which he worked as a visual effects editor. Kalshi suspended him for two years and fined him more than $20,000.
“Beast Industries has no tolerance for this behavior, whether by contestants or our own employees,” the company that employed Kaptur said in a statement. “We have a longstanding policy in place against employees using proprietary company information which safeguards the highest standards and ethics throughout our organization.”
Beast Industries said it has “already initiated an independent investigation” on that matter, though it encouraged Kalshi to “be more open” to communicating its findings in the future.
Insider trading is banned at Kalshi, a regulated exchange licensed as a “designated contract market” with the U.S. Commodity Futures Trading Commission (CFTC), and the company described its actions against Kaptur and another user who took advantage of their unique knowledge in violation of user policy.
In the other case, user Kyle Langford was said to bet $200 on his own candidacy for California governor and posted about it on social media, earning him a 5-year ban and a penalty of 10 times the trade amount.
Langford, now running for Congress, didn’t immediately respond to a request for comment. Nor did the CFTC immediately respond to questions about its role in these matters.
The pair of cases at Kalshi further underline one of the concerns at the U.S. regulator of derivatives, the CFTC. While that agency is now working on rules to govern the prediction markets, its previous chairman under the administration of former President Joe Biden had often lamented that the CFTC isn’t able to police the whole world. Markets that extend to miniscule bets on topics both broad and obscure and in jurisdictions around the world can pose a potential challenge for — at last count — about 114 U.S. enforcement employees.
In a recent CNBC interview, Kalshi CEO Tarek Mansour struggled to draw the line on what constitutes insider trading when questioned on a hypothetical example of people in the stadium before the Super Bowl having knowledge about what performer Bad Bunny would do as his opening song — a matter that drew Kalshi contracts.
Mansour equated it with controls at stock market firms, saying, “we do the same thing on Kalshi. We have the same mechanism for enforcement.” However, he said Kalshi users have to recognize the risks of betting on information under uncertain restraints. “We want to work with policymakers and regulators to get that right,” he said.
Read More: Richest YouTube Star MrBeast’s Firm Files Trademark With Crypto Ambitions
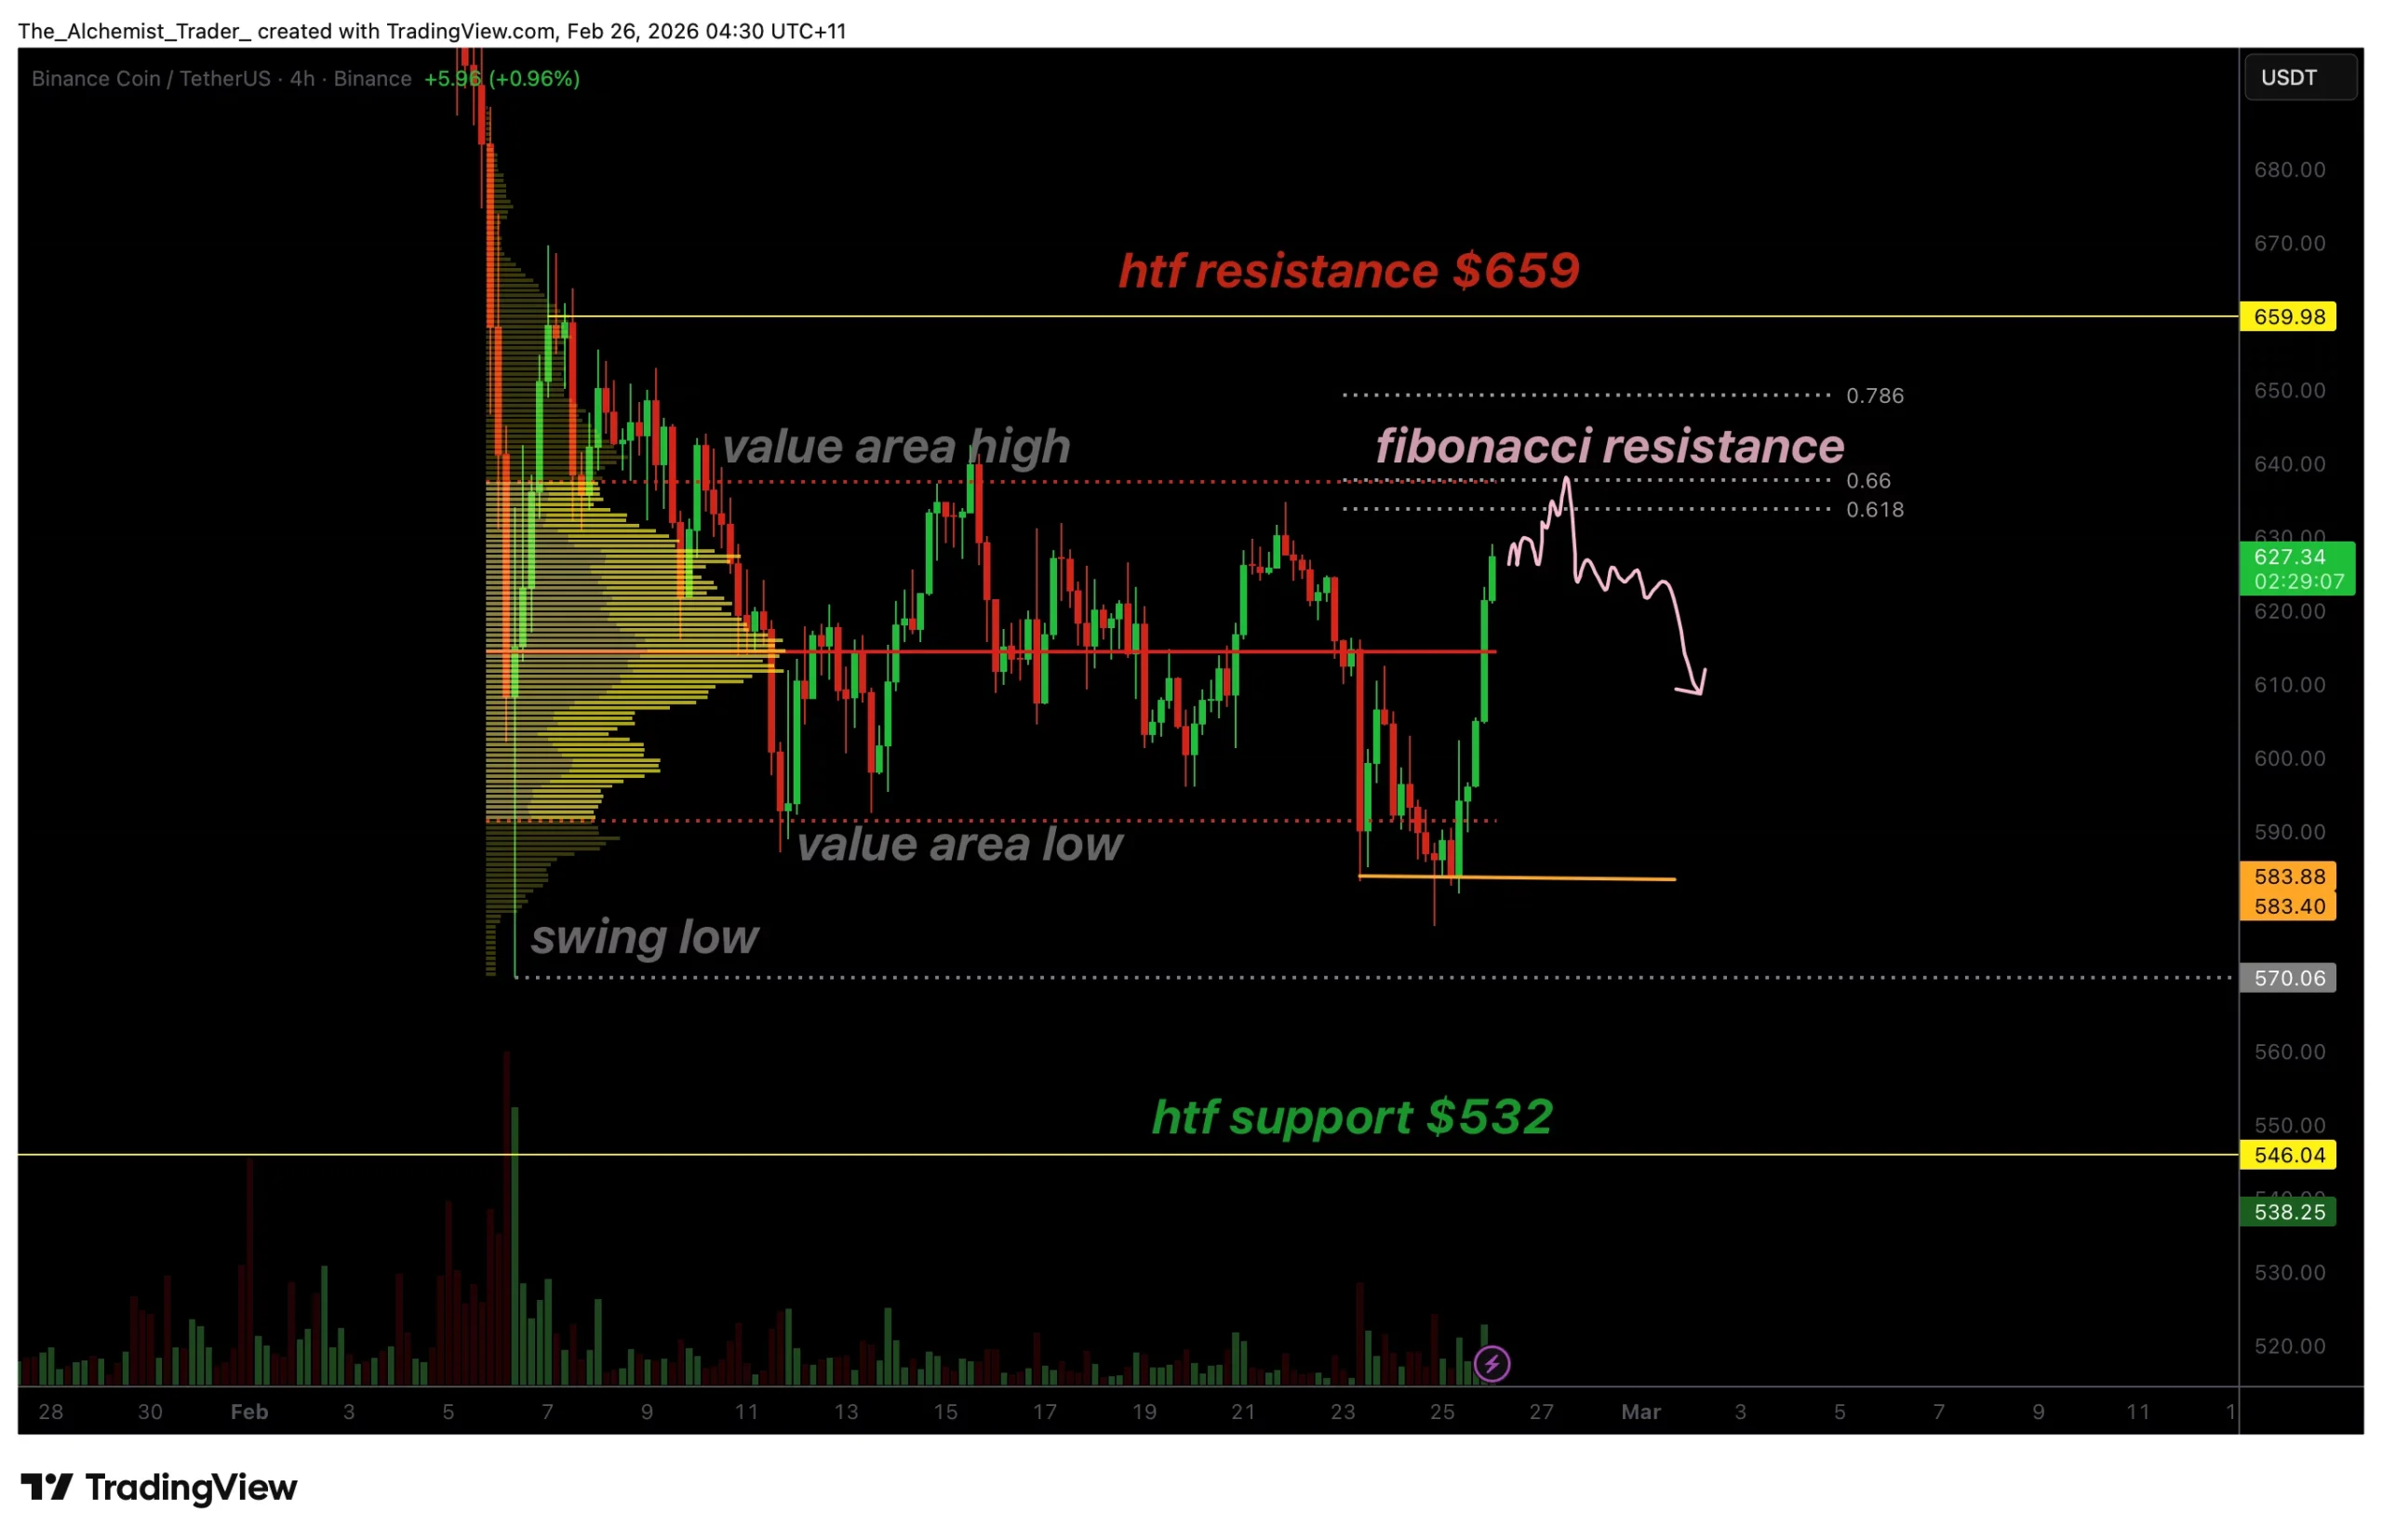
BNB price has staged a strong rebound after confirming a swing failure pattern at recent lows. The rally now approaches a critical resistance cluster near $635 that could determine the next directional move.
Summary
- BNB confirms bullish SFP, triggering strong rebound from lows
- $635 resistance aligns with 0.618 Fibonacci and value area high
- Breakout targets $659; rejection keeps price range-bound between $659 and $532
BNB (BNB) pricehas regained bullish momentum following a successful swing failure pattern (SFP) that invalidated downside liquidity and triggered a sharp recovery from local lows. The move reflects renewed buyer participation after a period of weakness, shifting short-term sentiment toward the upside.
However, price is now approaching a technically significant resistance zone where market structure decisions typically occur. Whether bulls can reclaim this region will likely dictate if BNB transitions into trend continuation or returns to range-bound conditions.
BNB price Key Technical Points
- Key Resistance: $635 aligns with the 0.618 Fibonacci retracement and the value area high.
- Bullish Catalyst: Confirmed SFP triggered liquidity reversal and short squeeze dynamics.
- Upside Target: Break and hold above $635 opens the path toward high timeframe resistance near $659.

Recent price action on BNB highlights the importance of liquidity-driven moves within crypto markets. The formation of a swing failure pattern at the lows effectively trapped late sellers, allowing buyers to step in aggressively. This type of structure typically signals exhaustion in bearish momentum, and the resulting move has validated that thesis. The rally that followed was impulsive, suggesting short covering and fresh long positioning entering the market simultaneously.
As price accelerated higher, BNB quickly rotated back toward a major technical confluence zone around $635. This region represents the 0.618 Fibonacci retracement of the prior decline while also aligning with the value area high from the volume profile. Historically, such zones act as decision points where markets either reclaim bullish structure or face rejection due to overhead supply. A sustained close above this level would signal strength and confirm that buyers have regained control of the higher timeframe trend.
Despite the bullish recovery, traders should remain cautious as impulsive rallies often transition into consolidation before continuation. After strong expansions, markets frequently pause to establish equilibrium, allowing liquidity to rebuild. Lower timeframe consolidation near resistance would be considered healthy price behavior and could form a higher low structure that supports a continuation toward $659 and potentially beyond.
This comes as U.S. Senator Richard Blumenthal launched a formal Senate inquiry into Binance following reports alleging the exchange processed nearly $1.7 billion in transactions linked to sanctioned Iranian entities and Russia’s so-called shadow fleet, adding a layer of regulatory uncertainty to broader market sentiment.
However, failure to reclaim the $635 resistance on a closing basis may shift the outlook quickly. A rejection at this zone would indicate that sellers remain active and defending supply, reinforcing the broader higher timeframe range between approximately $659 resistance and $532 support. In such a scenario, BNB could rotate back toward mid-range liquidity or revisit lower support levels before another attempt at breakout conditions develops.
Volume behavior also supports the current technical narrative. The rally originated from a liquidity sweep rather than sustained trend accumulation, meaning confirmation is still required. A decisive increase in buying volume during a breakout would strengthen bullish continuation odds. Without that confirmation, the market risks transitioning into redistribution at resistance, where both bulls and bears compete for control.
Overall, the recent SFP-driven recovery marks an important structural development for BNB. The market has shifted from downside expansion into a potential re-accumulation phase, but confirmation remains dependent on reclaiming resistance rather than merely testing it.
This comes as Binance defended its compliance framework, stating that recent media coverage inaccurately portrayed its regulatory oversight and control measures, highlighting ongoing regulatory narratives that continue to influence broader crypto market sentiment.
What to expect in the coming price action
BNB’s next move hinges on the $635 resistance level. A confirmed reclaim could trigger continuation toward $659 high timeframe resistance, while rejection may keep price rotating within the broader range.
Consolidation near resistance remains the most probable short-term outcome as the market prepares for its next directional expansion.

James Harden injury: Cavaliers guard suffers thumb fracture, status unclear

Lord Mandelson arrested after claims he shared financial information with Jeffrey Epstein | BBC News
Larry Summers resigns from Harvard after Epstein files revelations


-

 Video6 days ago
XRP News: XRP Just Entered a New Phase (Almost Nobody Noticed)
-

 Politics4 days ago
Baftas 2026: Awards Nominations, Presenters And Performers
-

 Fashion5 days ago
Weekend Open Thread: Boden – Corporette.com
-

 Sports2 days ago
Women’s college basketball rankings: Iowa reenters top 10, Auriemma makes history
-

 Politics2 days ago
Nick Reiner Enters Plea In Deaths Of Parents Rob And Michele
-
 Sports7 days ago
Clearing the boundary, crossing into history: J&K end 67-year wait, enter maiden Ranji Trophy final | Cricket News
-

 Crypto World2 days ago
XRP price enters “dead zone” as Binance leverage hits lows
-

 Business3 days ago
Mattel’s American Girl brand turns 40, dolls enter a new era
-

 Business3 days ago
Law enforcement kills armed man seeking to enter Trump’s Mar-a-Lago resort, officials say
-

 Entertainment7 days ago
Dolores Catania Blasts Rob Rausch For Turning On ‘Housewives’ On ‘Traitors’
-

 Tech1 day ago
Unsurprisingly, Apple's board gets what it wants in 2026 shareholder meeting
-
 NewsBeat2 days ago
‘Hourly’ method from gastroenterologist ‘helps reduce air travel bloating’
-

 Tech3 days ago
Anthropic-Backed Group Enters NY-12 AI PAC Fight
-

 NewsBeat3 days ago
Armed man killed after entering secure perimeter of Mar-a-Lago, Secret Service says
-

 Politics3 days ago
Maine has a long track record of electing moderates. Enter Graham Platner.
-
 NewsBeat22 hours ago
Police latest as search for missing woman enters day nine
-

 Crypto World22 hours ago
Entering new markets without increasing payment costs
-
 Sports2 days ago
2026 NFL mock draft: WRs fly off the board in first round entering combine week
-

 Crypto World6 days ago
83% of Altcoins Enter Bear Trend as Liquidity Crunch Tightens Grip on Crypto Market
-

 Business1 day ago
True Citrus debuts functional drink mix collection