

Crypto World
What Pioneers Must Know Before the March 1 Deadline
The Core Team said they continue with the updates, and the latest is right around the corner.
Despite the ongoing community backlash and questions regarding the migration state, the team behind Pi Network announced a new set of protocol upgrades that are currently in progress, and the deadline is March 1.
In the meantime, the native token has been quite volatile as of late, and we will review its most recent performance.
March 1 Deadline for Nodes
Similar to the updates outlined by the team in mid-February, the new protocol improvements will be rolled out gradually. In this second step, the deadline is set for the upcoming Sunday (March 1).
As with the February batch, all network nodes are required to complete this step before the deadline to “remain connected to the network.”
Protocol upgrades in progress (Step 2 – Deadline: March 1): The Pi Mainnet blockchain protocol continues to undergo a series of upgrades. All Mainnet nodes are required to complete this step before the deadline to remain connected to the network. Details here:…
— Pi Network (@PiCoreTeam) February 25, 2026
The explanatory post actually refers users to the Pi Nodes page on the project’s website. In it, the team reiterates previous statements about the importance of nodes within the Pi Network ecosystem, as they referred to them as the “fourth role.” Once again, they reminded that nodes have to run on laptops and desktops instead of mobile phones.
Pi Nodes, similar to other blockchains, are responsible for validating transactions on the distributed ledger and resolving challenges in maintaining a “distributed currency by having to come to a “consensus” on the order of new transactions that are being recorded.”
You may also like:
In Pi Network’s case, the consensus algorithm is based on SCP, which allows nodes to form trusted groups, referred to as quorum slices, and only agree to transactions that are in complete alignment.
“Unlike most other crypto projects, the Pi Node will continue to follow the philosophy of user-centric design. Instead of requiring deep technical knowledge to set up a node, everyday people will be able to do that by installing a desktop application on their computers,” said the team.
PI Price Update
Pi Network’s native token went through some intense volatility in the past few weeks, which included a sporadic 35% daily surge a few weeks back that pushed it beyond $0.20. However, it was quickly rejected there and driven to under $0.16 during the market-wide crash earlier this week.
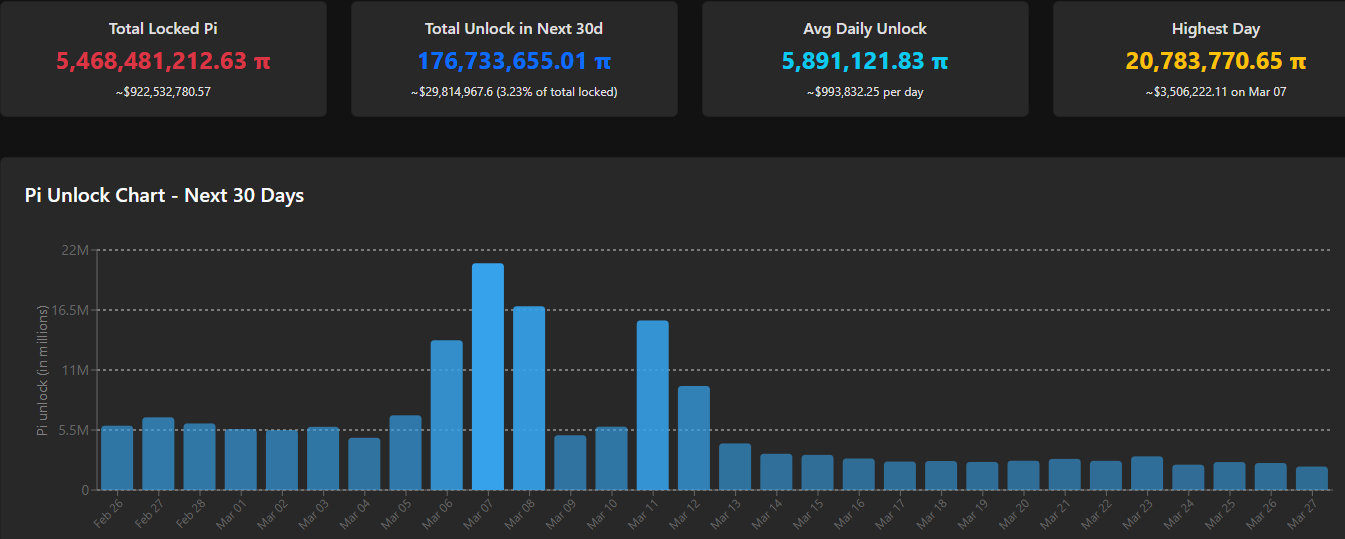
With BTC and the alts rebounding yesterday and today, PI followed suit and now sits inches away from $0.17. The upcoming unlocking schedule has some troubling news for next week, but the following several days should ease the pain, with around 5.5 million tokens to be released daily.
On March 7, though, that amount will skyrocket to almost 22 million, followed by 16.5 million a day later. These large unlocks could increase the immediate selling pressure.

Binance Free $600 (CryptoPotato Exclusive): Use this link to register a new account and receive $600 exclusive welcome offer on Binance (full details).
LIMITED OFFER for CryptoPotato readers at Bybit: Use this link to register and open a $500 FREE position on any coin!
Disclaimer: Information found on CryptoPotato is those of writers quoted. It does not represent the opinions of CryptoPotato on whether to buy, sell, or hold any investments. You are advised to conduct your own research before making any investment decisions. Use provided information at your own risk. See Disclaimer for more information.


- Stellar price rose to near $0.17 on Thursday, February 26.
- XLM bounced higher as cryptocurrencies recorded gains across the board.
- Bulls could target $0.40 if sentiment holds, but bears remain largely in control.
Stellar (XLM) price rose to near $0.17 early Thursday as a broad market bounce lifted cryptocurrencies.
The altcoin’s price mirrored the movement of major alts and Bitcoin, jumping from lows of $0.15 as sentiment drove buy-side pressure.
Bitcoin’s surge to near $70k came ahead of Nvidia earnings.
BTC is holding above $68k, and this could mean a short-term retest of highs above the psychological level.
However, bulls are at risk of giving up all the intraday gains if bearish sentiment continues to dictate momentum, with analysts pointing to the latest uptick as a potential relief bounce that may yet fade quickly.
XLM price today
XLM price hovers at $0.1647 as of writing, up nearly 8% in the past 24 hours.
The gains put Stellar up about 3% in the past week, and extended the altcoin’s recovery from oversold levels near $0.15.
According to data from CoinMarketCap, the price jump has come amid a spike in daily trading volume.
The spot volume stood at $155 million, up 50% as XLM tested intraday highs around $0.169.
Stellar price technical analysis
Despite notable gains, XLM remains pinned below the 50-day and 100-day SMAs.
The moving averages are clustered near $0.18-$0.21, signalling continued downside pressure.
A descending resistance trendline also caps upside, and bulls need a clean break to sustain the advantage.
In terms of technical indicators, the daily RSI has inched up from oversold territory but stays neutral.
Meanwhile, the MACD shows bullish divergence, but a shrinking histogram suggests limited breakout potential without a notable volume surge.

For bulls, near-term recovery hinges on holding $0.16 support.
A push above $0.17 and a retest of highs above the key moving averages will buoy buyers.
Key targets lie in the $0.25-$0.41 area.
Helping Stellar’s bullish outlook is its traction in the payments and tokenization markets.
The blockchain network ranks among the top chains for distributed and represented real-world assets, alongside XRP Ledger and others.
Gains for XRP have often coincided with an uptick for XLM.
On the downside, bears may rely on a bearish tilt supported by negative trends in the derivatives market.
XLM’s futures open interest remains low compared to metrics seen during last year’s peak. Funding rates also reinforce this outlook.
As such, downside risks loom large, and a breakdown below $0.15 could be bad news for XLM bulls.


Gate, one of the world-leading players in crypto space, announced that Gate Technology Ltd, its Malta-based entity, has officially obtained a Payment Institution license under the EU’s Second Payment Services Directive (PSD2) from the Malta Financial Services Authority (MFSA).
This milestone places Gate among one of the crypto-native companies in Europe to secure this level of regulatory approval, reinforcing its long-term strategy to bridge legacy finance and Web3 infrastructure across the continent.
Gate Technology Ltd. CEO, Mr. Giovanni Cunti, commented on the achievement: “We are proud to have secured this Payment Institution license. It positions Gate to build a secure, scalable bridge between traditional finance and Web3, delivering compliant payment solutions to clients across Europe.
This accomplishment is the result of our team’s dedication and marks a critical step in aligning with MiCA’s regulatory framework.” He further emphasized the broader significance of the license, noting that it establishes a strong foundation for future financial services and ensures regulatory certainty for both institutional and retail clients in the dynamic European market.
This announcement builds on Gate’s earlier regulatory achievements in Malta, where Gate previously obtained a full MiCA license to provide exchange and custody services. These milestones are part of Gate’s comprehensive global compliance strategy, which spans multiple jurisdictions, including but not limited to Malta, Cyprus, the Bahamas, Japan, Australia, and Dubai.
Malta, in particular, has emerged as a strategic hub for European operations, offering a transparent and forward-looking regulatory environment that aligns with Gate’s vision for secure, scalable, and innovative digital asset services.
By securing the PSD2 license, Gate is now expanding its payment services across the European Union through passporting rights. The license not only affirms Gate’s commitment to compliance and regulatory excellence, but also enhances its ability to integrate traditional finance mechanisms with Web3 applications, creating a seamless, secure, and efficient ecosystem for users. As Europe’s crypto landscape continues to evolve, Gate is well-positioned to play a leading role in driving innovation, transparency, and trust in digital financial infrastructure.
About Gate
Founded in 2013, Gate is a pioneer in the cryptocurrency industry, with its flagship platform, Gate.com, serving over 49 million users globally and ranking among the top 3 crypto exchanges worldwide by market share.
For more information, please visit: Website | X | Telegram | LinkedIn| Instagram | YouTube
Disclaimer: This content does not constitute an offer, solicitation, or recommendation. You should always seek independent professional advice before making investment decisions. Gate may restrict or prohibit all or part of its services for users from restricted regions. For more information, please read the applicable User Agreement.
Solana price rallied for the second consecutive day, clocking over 17% as the broader crypto maker recovered. It has now confirmed a bullish breakout from a symmetrical triangle pattern, which could lead to more upside over the coming sessions.
Summary
- Solana price shot up to an intraday high of $90 on Thursday.
- SOL price has confirmed a bullish breakout from a symmetrical triangle pattern.
- Solana ETFs drew in over $30 million inflows over the past day.
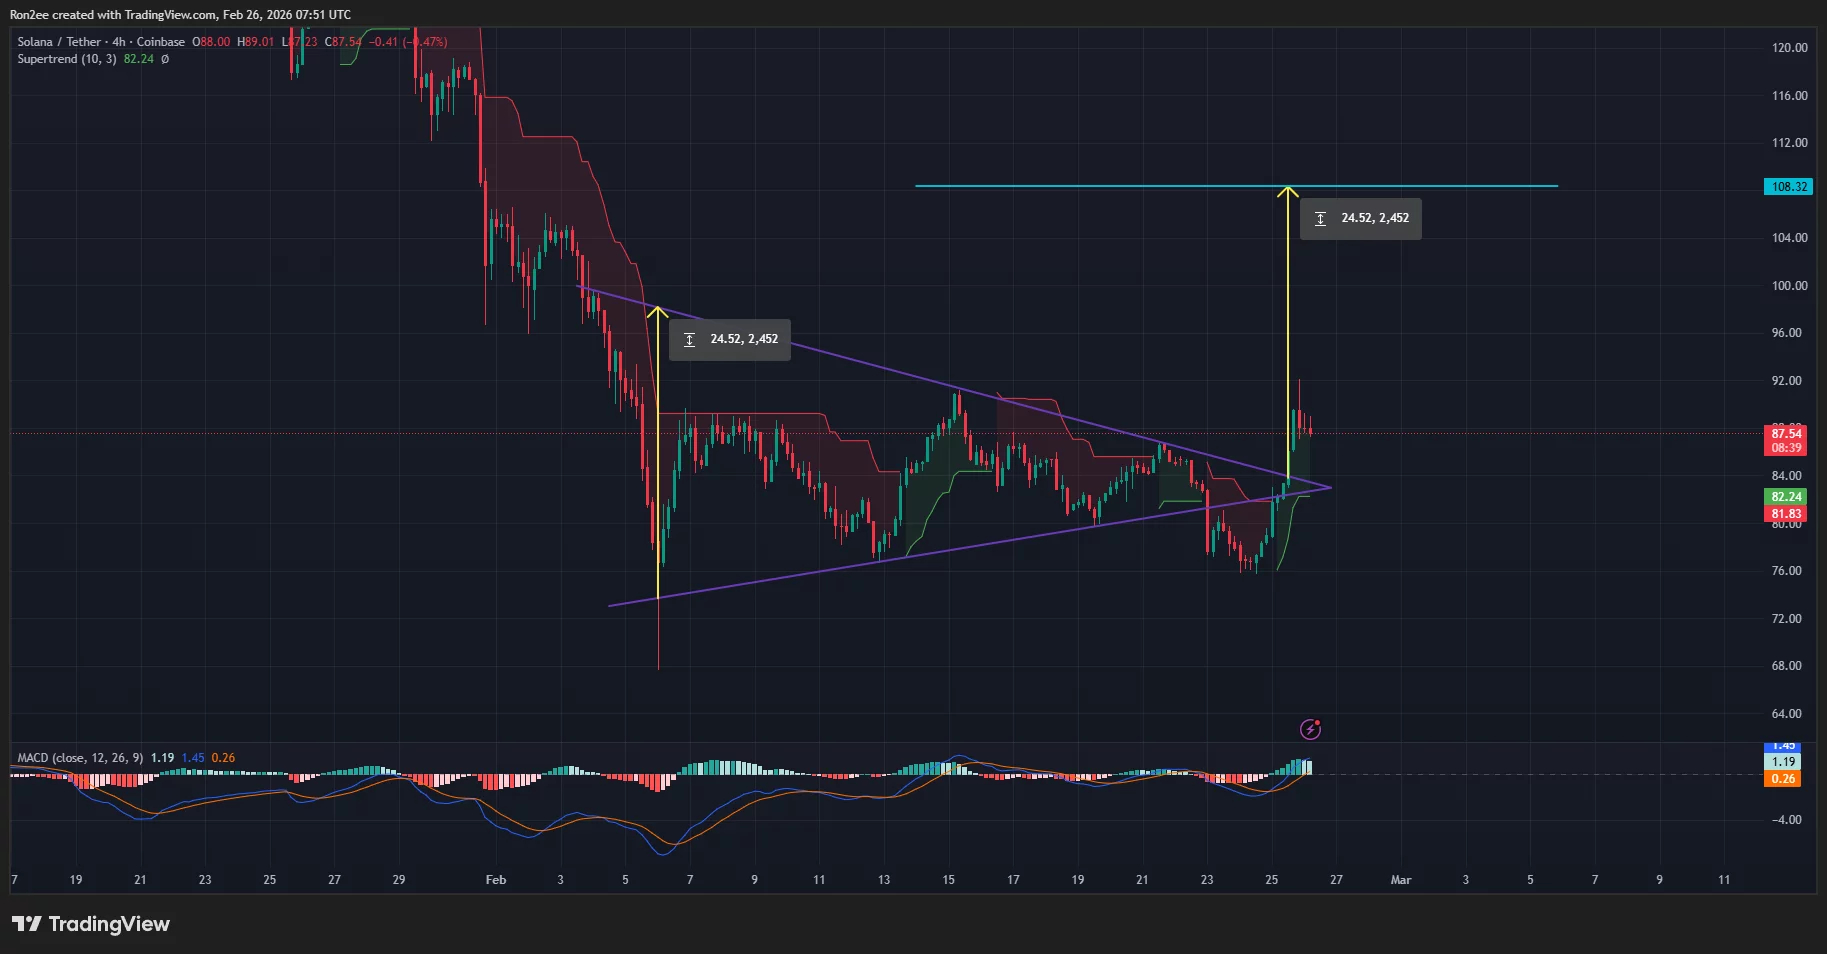
According to data from crypto.news, Solana (SOL) price rebounded 17.5% from its weekly low of $76.56 to an intraday high of nearly $90 on Thursday.
On the 4-hour chart, Solana price has broken out from the upper side of a symmetrical triangle pattern that had been forming since early February. A symmetrical triangle pattern is a structure formed when an asset price forms successive lower highs and higher lows as the asset undergoes a period of consolidation.

When an asset price breaks out from the upper side of such a pattern, it typically tends to continue its upward momentum over the sessions that follow.
In Solana’s case, while the token previously broke the lower trendline of the pattern due to a broader market drop, it was quickly reclaimed as bulls managed to push the token back above the upper trendline of the pattern that had been acting as dynamic resistance.
Based on the bullish breakout, Solana price eyes a rally past the $100 psychological resistance level toward $108, a target calculated by adding the height of the greatest swings within the symmetrical triangle to the point at which SOL price broke out of the pattern.
The bullish forecast is supported by other technical indicators, including the MACD and Supertrend. The MACD lines have pointed upwards with growing green histograms, while the Supertrend has flipped green.
Catalysts supporting Solana recovery
Solana price jumped amid a broader market rebound triggered by Bitcoin’s bounce back to near $70K levels and bullish market sentiment that followed after a stellar Q4 earnings report by AI chip-making titan Nvidia.
As Solana price surged, it led to liquidations of bearish bets on the leveraged markets. Data from CoinGlass shows nearly $27.5 million worth of short positions were liquidated from the SOL futures market in the past 24 hours, significantly outweighing long liquidations.
SOL futures open interest has also surged nearly 5% to $5.3 billion over the past day while the weighted funding rate has turned positive.
Meanwhile, a sudden spike in institutional demand for spot Solana ETFs has also played a part in supporting the Solana surge today. Data from SoSoValue shows the spot Solana ETFs recorded a combined inflow of $30.86 million on Wednesday, nearly an eight-fold jump from the prior day and also marking the highest single-day inflows recorded since mid-December last year.
This renewed demand for SOL amid both derivatives and institutional traders could help it on its way towards the $108 target.
Disclosure: This article does not represent investment advice. The content and materials featured on this page are for educational purposes only.
Crypto World
Was Jane Street behind the bitcoin crash? A deep dive into why that theory may not not hold


Bitcoin has dropped like clockwork every morning after the New York market open since late 2025, and crypto fans on X are accusing Jane Street for causing it.
A theory on X has gotten retail participants pointing to the firm for single-handedly driving the asset from $125,000 to $62,000 in recent months.
However, market data and inner workings of an exchange-traded fund (ETF) authorized participant like Jane Street suggest otherwise, observers have noted.
CoinDesk reached out to Jane Street for comment on BTC allegations and did not receive a reply as of European morning hours.
This is INSANE.
Since Jane Street was sued two days ago, the 10 AM manipulation has stopped.
Bitcoin is up 10%, adding $120 billion to its market cap, and the BTC weekly candle has turned green after 5 consecutive red candles.
The total crypto market has added nearly $200… pic.twitter.com/4dCrFewTE4
— Bull Theory (@BullTheoryio) February 25, 2026
The allegations
The claim, spread across dozens of viral posts, goes something like this: Jane Street, one of the world’s largest trading firms, was systematically selling bitcoin at 10 a.m. ET every day to push prices lower and then snap up ETFs cheaply.
“BTC has been consistently dumping ~2-3% within minutes of the U.S. cash open (10 a.m. ET) almost every trading day since early November. Many traders point to Jane Street’s massive $2.5B+ position in BlackRock’s IBIT as the likely driver: engineered liquidity sweeps to accumulate spot ETFs at a discount,” Whale Factor, a widely-followed X account said in December.
The recent 13/F filings revealed that Jane Street held roughly $790 million in IBIT shares as of the fourth quarter of 2025.
Jan Happel and Yann Allemann, the co-founders of blockchain analytics firm Glassnode, have also documented these patterns through their shared X account Negentropic and said Wednesday: “Jane street Lawsuit gets made public, and miraculously the 10am $btc slam disappears.”
The allegations have exploded this week, after the firm was sued by TerraForm Labs’ bankruptcy operator for insider trading that hastened Terra’s demise in 2022. If that’s not enough, the 10 a.m. volatility has vanished in the wake of the lawsuit. Bitcoin surged by over 6% to nearly $70,000 on Wednesday.
In June last year, India’s SEBI banned Jane Street from local markets and froze $566 million in alleged illegal gains, citing a “morning pump, afternoon dump” scheme manipulating the Bank Nifty index on 18 derivatives expiry days from January 2023 to March 2025. The accusations, therefore, suggest Jane Street’s reputation precedes it.
Market data and logic suggest otherwise
The conspiracy that Jane Street has been secretly driving prices lower to snap up IBIT cheap could be challenged, however, using data tracked by crypto economist Alex Kruger, which doesn’t confirm the 10 a.m. dump.
The IBIT ETF has posted cumulative gains of around 0.9% in the 10:00-10:30 ET window; meanwhile, returns in the first 15 minutes have been -1%, according to Kruger. That’s noisy data, not evidence of systematic dumping, Kruger said on X.
Everyone says bitcoin dumps at 10AM every day.
I pulled the data, and it’s not true.
Since Jan 1, IBIT’s cumulative return in the 10:00–10:30 window is +0.9%, and in the 10:00–10:15 window it’s –1%. Noisy, not a systematic dump.
More interesting: the performance pattern in… pic.twitter.com/jboe0eehG0
— Alex Krüger (@krugermacro) February 26, 2026
More importantly, both windows closely mirror Nasdaq performance, Kruger added, which means the so-called “10 a.m. dump” was a part of broad risk-asset repricing, not Jane Street foul play.
Jane Street, it should be pointed out, isn’t a rogue operator with unfettered power over bitcoin, but a single player — an authorized participant (AP) — in a regulated ecosystem designed to ensure smooth trading of the ETFs.
“No single firm sits at a terminal pressing “dump Bitcoin.” But the structure itself—the ETF architecture, the AP exemptions, the shift to in-kind creation—creates a grey window where price discovery can be muted without anyone breaking rules,” Yale ReiSoleil, chief technology officer of Untrading, an Ethereum-based financial infrastructure firm, said on X.
Spot ETFs are funds that track bitcoin’s spot price while holding actual coins in custody. Their shares trade on the stock exchange and their prices tend to drift away from the underlying asset’s net asset value (NAV) depending on the demand and supply.
APs like Jane Street, JPMorgan and Citadel Securities are tasked with creating new ETF shares with demand spikes and redeem when demand falls to ensure the ETF price remains tethered to the NAV.
In the case of bitcoin ETFs, APs are allowed “in-kind” creation and redemption, where they can swap a basket of actual BTC directly with the issuing company, rather than just cash. These dynamics, which are legal and not manipulation, could have led to 10 a.m. volatility.
Short first, buy later
On a typical day, when BTC rises during the Asian and European hours, demand for ETFs spikes in early U.S. hours. This temporarily pushes the ETF price above its NAV. The APs then respond by increasing the supply of shares — sometimes by shorting shares they don’t have — to meet buyer demand and keep trading smooth.
Normally, shorting requires borrowing shares first, which costs money (like loan interest), but regulators have exempted APs from that rule.
Later, when they create new shares, they don’t rush to buy spot BTC right away and often source it privately through an over-the-counter shop. They then short futures or buy put options to hedge the long exposure from creating new shares.
These things combined can inject temporary downside pressure in the market.
“APs can short IBIT without borrowing costs, thanks to a Reg SHO carve-out. They can hedge that short with futures instead of spot. That means the natural arb that should close the gap between ETF price and NAV never happens, because the AP never buys spot,” ReiSoleil explained.
“Meanwhile, in-kind creation lets them source bitcoin privately, OTC, at their own pace. The spot market never sees the buy pressure. The beginning looks like market-making. The end looks like market-making. The middle is where the integrity of price discovery goes to die,” he added.
Kruger agreed that Jane Street conspiracy theories are typical of the doom-laden sentiment that often emerges after prolonged bitcoin downtrends.
He firmly disagreed with the allegation that the “short first and buy later” mechanics employed by APs temporarily suppress the price.
“Whether the spot is bought by the AP or the basis trader, the net demand on BTC spot is identical,” he said, arguing that the notion that hedging with futures first (and delaying immediate spot buys) somehow compromises the integrity of price discovery is simply incorrect.
Jane Street has not commented publicly, and no onchain data or exchange records have surfaced tying the firm to a coordinated campaign to push bitcoin lower.
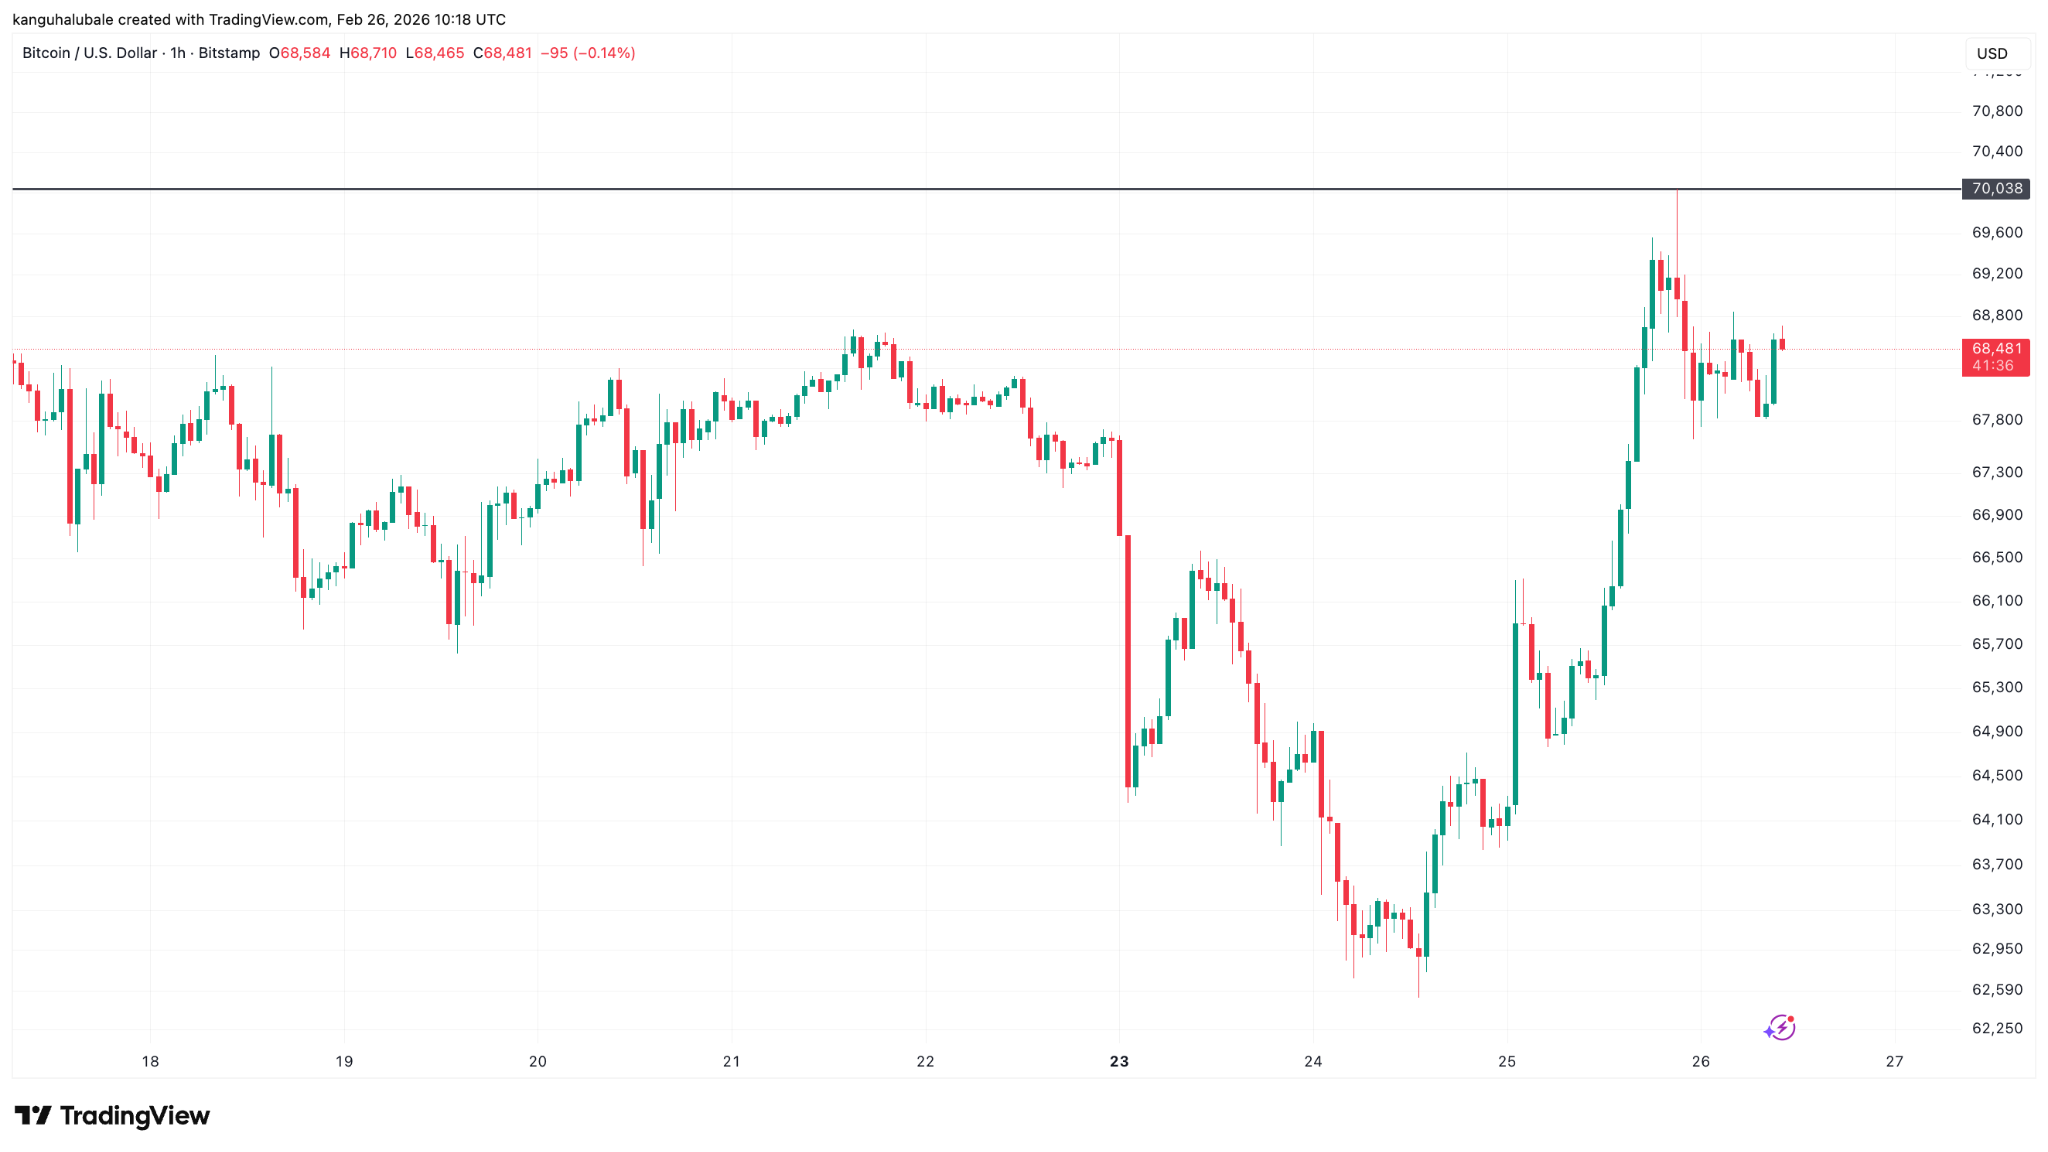
Bitcoin (BTC) tapped $70,000 during Wednesday’s New York session as bulls targeted sell liquidity.
Key takeaways:
-
BTC price support must hold above a key trendline at $68,000 for the rebound to continue.
-
$80,000 is a key level to watch as the next big liquidation cluster above.
-
Spot Bitcoin ETF inflows attracted half a billion dollars in inflows on Wednesday.

Bitcoin must close week above $68,000
Data from TradingView showed the BTC/USD pair at $68,480 on Bitstamp. This is just above the 200-week exponential moving average (EMA), which is currently at $68,338.
Related: Bitcoin tops $69.5K after stocks rebound, strong earnings data boost risk appetite
Analyst Rekt Capital spotted Bitcoin facing resistance from this trendline, saying that the latest recovery could turn into a “post-breakdown retest of the EMA into new resistance” based on historical price action.
“The moment of truth is coming for Bitcoin,” Rekt Capital said, adding:
“Bitcoin will need a Weekly Close back above the EMA and flip it into new support to go against the grain of history.”

Zooming in, fellow analyst Jelle said that the price needs to turn the 50 EMA (at $68,000) on the four-hour chart into support to confirm the recovery.

As Cointelegraph reported, the BTC/USD pair may rally to $74,508, where sellers are likely to step in, if the 20-day EMA, currently at $69,220, is broken by the bulls.
Will liquidations drive BTC price to $80,000?
Several traders are anticipating a possible liquidity grab where a cluster of ask-orders are placed above $72,000.
The latest data from monitoring resource CoinGlass showed BTC price tapping the liquidity around $70,000, with the bulk of interest still clustered above the spot price.
About $2 billion in ask orders are sitting between $72,450 and $75,000.

If the $75,000 level is broken, it could spark a liquidation squeeze, forcing short sellers to close positions and driving prices toward $80,000, the next major liquidity cluster.
“Bitcoin’s liquidity hunt has only just started,” analyst AlphaBTC said in his latest post on X, adding:
“Unless there is a catalyst to drop, I am expecting these higher levels to get run in the next few weeks.”
Spot Bitcoin ETF inflows support BTC’s upside
Institutional demand is showing signs of a comeback, with US-based spot Bitcoin ETFs recording inflows for two consecutive days, according to data from Farside Investors.
Investors poured a total of $765 million into these investment products on Tuesday and Wednesday, with $507 million flowing into the funds Wednesday, the largest since Feb. 2.

“ETF inflows and short liquidations doing the heavy lifting,” X user Raster said in a recent post, adding:
“This isn’t retail FOMO, it’s institutional accumulation with a technical breakout.”
This growing demand-side pressure could push BTC prices higher, particularly if combined with growing adoption and whale accumulation.

This article does not contain investment advice or recommendations. Every investment and trading move involves risk, and readers should conduct their own research when making a decision. While we strive to provide accurate and timely information, Cointelegraph does not guarantee the accuracy, completeness, or reliability of any information in this article. This article may contain forward-looking statements that are subject to risks and uncertainties. Cointelegraph will not be liable for any loss or damage arising from your reliance on this information.


An editor affiliated with YouTube star MrBeast has been fined more than $20,000 and suspended from trading platform Kalshi for two years after the company found he engaged in insider trading tied to event contracts related to the creator’s content.
Summary
- Kalshi fined and suspended a MrBeast-affiliated editor for insider trading in event contracts tied to the YouTube creator’s content, imposing a $20,397.58 penalty and a two-year ban.
- The disciplinary committee found violations of prohibited insider trading and failure to cooperate with an investigation.
- Beast Industries has launched an independent investigation, stating it has zero tolerance for misuse of proprietary information and urging greater transparency from Kalshi.
Kalshi cracks down on ‘MrBeast’ contract trades
In a disciplinary notice effective February 25, 2026, Kalshi said its Disciplinary Committee determined that the individual, identified as Artem Kaptur, violated rules that bar insiders with access to material non-public information from trading on related contracts.
The rule also prohibits employees or affiliates of a “Source Agency” for any contract from entering or attempting to enter trades in those markets.
According to Kalshi’s findings, Kaptur traded in August and September 2025 in event contract markets connected to a YouTube channel while employed by or legally affiliated with “Mr Beast” contracts. The committee concluded he traded using material, non-public information obtained through that employment.
Kalshi also found that Kaptur failed to cooperate fully with its investigation, violating rules that require participants to promptly and fully cooperate with inquiries and proceedings.
As a result, the committee suspended him from direct or indirect access to Kalshi for two years and imposed a financial penalty totaling $20,397.58. That amount includes $5,397.58 in disgorged profits linked to the improper trading and an additional $15,000 civil penalty.
Kalshi further identified another individual, Kyle Langford, a 24-year-old Republican political candidate in California, for insider trading activity connected to the matter.
In response, Beast Industries said it has “no tolerance for this behavior, whether by contestants or our own employees,” citing a longstanding policy prohibiting employees from using proprietary company information.
The company confirmed it has initiated an independent investigation and urged Kalshi to share its findings, adding that integrity and audience trust remain paramount.
Cardano price is under pressure, but its largest holders are buying aggressively into the dip. Whales and sharks have accumulated more than 819 million ADA, signaling strong conviction beneath the surface volatility and hinting at a potential long-term reversal.
Summary
- Whales and sharks added 819.14 million ADA over six months, despite a 71% price decline.
- ADA is trading around $0.29, facing rejection near the $0.30 psychological barrier and upper Bollinger Band.
- While support sits at $0.2520, a slightly negative CMF shows short-term selling pressure persists.
Cardano whales and sharks go on a buying spree
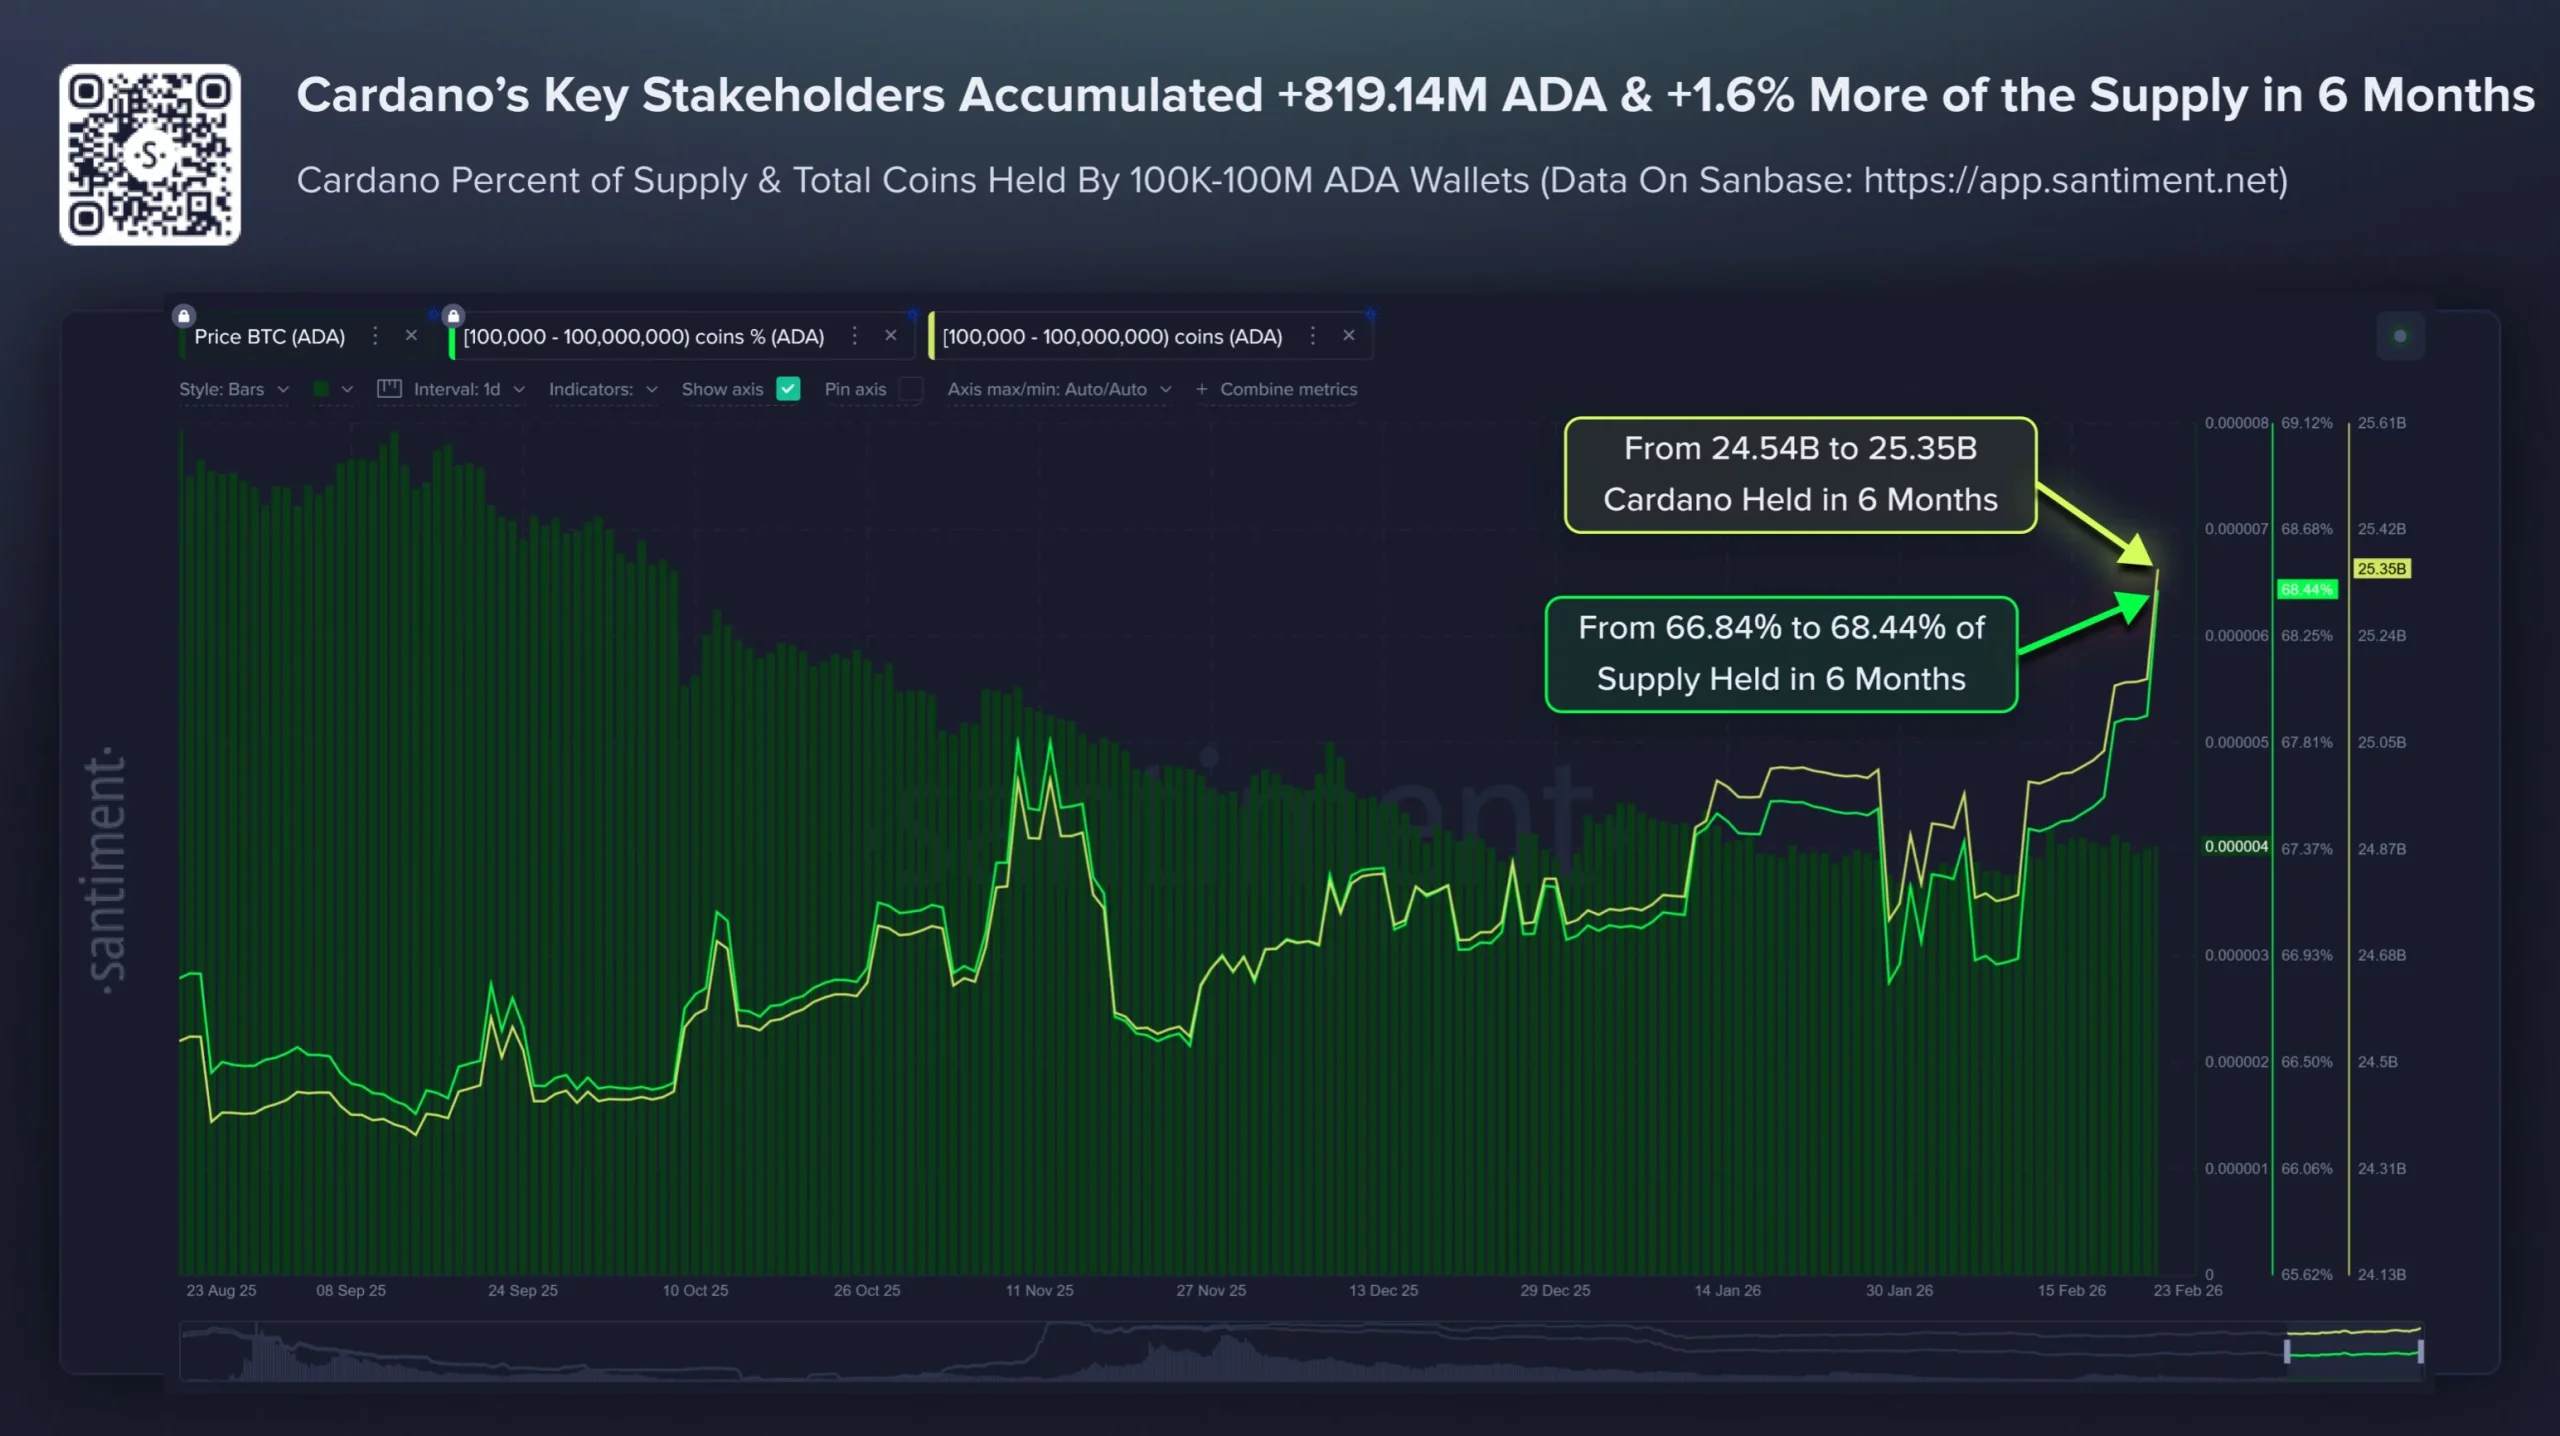
Data from the on-chain analytics platform Santiment reveals a striking trend: wallets holding between 100,000 and 100 million ADA have been consistently stacking the token for the last six months.
This period saw ADA’s price endure a punishing 71% decline, falling from $0.90 to roughly $0.26.
Despite this capital erosion, these key stakeholders added 819.14 million ADA to their portfolios, representing a 1.6% increase in their total share of the circulating supply.
Valued at approximately $213.9 million, this concentrated buying during a steep drawdown is a classic signal of a market bottom, as high-conviction holders absorb the liquidity left behind by panicked sellers.

Cardano price at a crossroads
The ADA/USDT daily chart illustrates a market struggling to translate this whale accumulation into immediate upward momentum.
Currently trading near $0.2935, the price is hovering just above the 20-day Simple Moving Average (SMA) of $0.2753. Recent price action shows a clear rejection at the upper Bollinger Band near $0.2985, identifying it as the immediate ceiling that bulls must shatter.
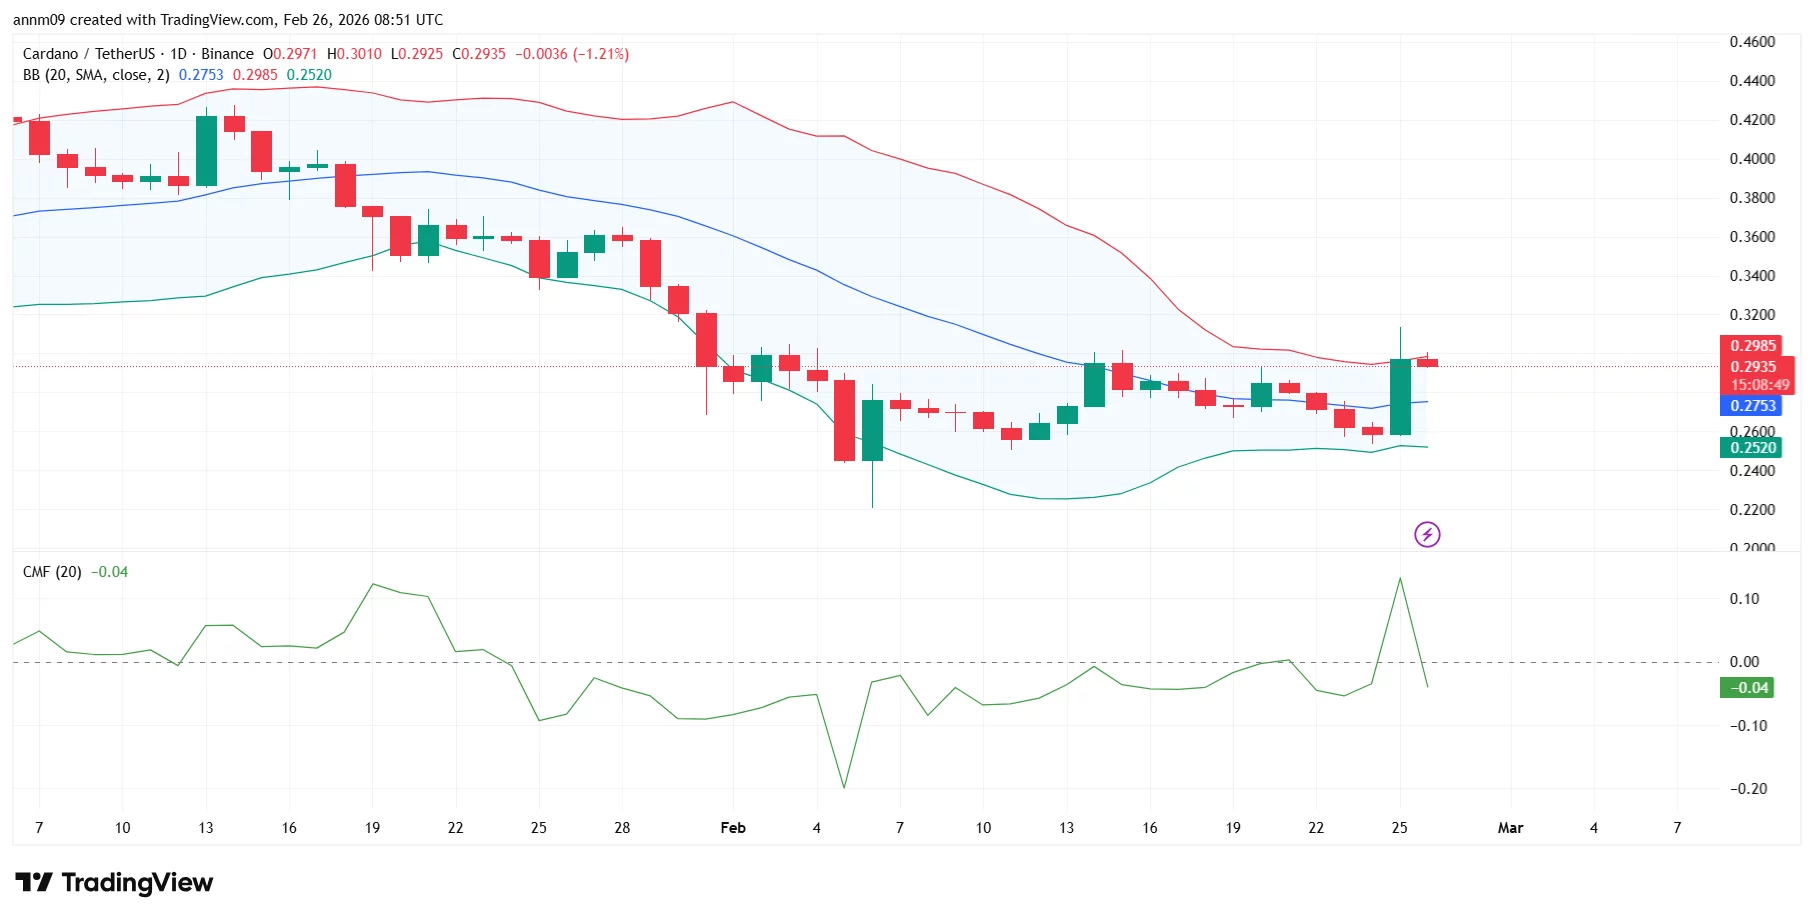
While strong horizontal support has been established at the $0.2520 level, the Chaikin Money Flow (CMF) remains slightly bearish at -0.04. This negative reading suggests that despite the whale activity, there is still enough short-term distribution from smaller participants to keep the price suppressed.
For a definitive bullish flip, ADA needs a sustained daily close above the $0.30 psychological barrier.
If it can maintain its position above the 20-day SMA, a retest of the $0.32 resistance is likely, though a slip below $0.25 would signal that the accumulation phase may need to extend further before a breakout occurs.


Bitcoin cooled off in Asia hours on Thursday, trading at $68,600 after testing $70,000 during a ferocious U.S. session on Wednesday.
As February draws toward a close, the largest cryptocurrency remains in a trading range that has persisted since early in the month, having tested $62,500 on Tuesday and $71,100 to the upside on Feb. 15.
It’s worth noting that bitcoin broke a similar trading range to the upside in January, trapping breakout traders before the price tumbled from $98,000 to $60,000 over the subsequent three weeks, forming a lower high in this recent bearish cycle.
A few tokens outshone the broader altcoin market. HYPE is up 4.3% since midnight UTC as it moves back toward $30, while privacy token decred (DCR) rose to its highest since November after adding 4%.
U.S. stock index futures are little changed, with NVIDIA’s earnings report failing to generate sustained upside amid lingering concerns that AI valuation is overdone.
Derivatives positioning
- Total crypto futures market open interest (OI) has increased by over 6.6% to nearly $100 billion. This is bigger than the increase in the total crypto market cap, indicating there’s been an influx of fresh capital into the market.
- ADA and ETH futures stand out with OI increases of 21% and 15%, respectively. Several other altcoins have seen increases of 9%.
- Bitcoin’s OI growth of over 3% appears largely due to the spot price gain.
- BTC and ETH’s 30-day implied volatility indices, BVIV and EVIV, remain near weekly lows, indicating market calm and supporting continued price gains.
- Annualized perpetual funding rates for most tokens, including bitcoin and ether, have stabilized to slightly above zero, indicating a renewed bias for bullish, long bets.
- On Deribit, bitcoin’s price bounce triggered demand for call options at strikes ranging from $85,000 to $90,000. However, the overall options market continues to show a bias for puts, a sign that downside reservations still linger.
- The $60,000 put option remains the most popular bet, with a notional open interest of over $1.4 billion.
Token talk
- Layer-1 token posted a 21% gain over the past 24 hours. While the move petered out in European hours, investors are showing appetite ahead of the network’s reward halving coming in March.
- Uniswap’s governance token (UNI) also jumped, adding 15%. The move can be attributed to a new governance vote that proposes increasing the protocol’s revenue capture across several layer-2 networks.
- One token that particularly underperformed was , which lost more than 6%, with the selloff continuing into European hours. There is no clear bearish catalyst for the move, which reflects persistent altcoin vulnerability due to a lack of liquidity.
- Crypto majors and ether (ETH) rose by around 8.5% since Wednesday morning. The moves were intriguing because open interest for both assets increased, suggesting they was backed by leverage as opposed to spot buying, according to Coinalyze.

TLDR:
-
- The OCC proposed a regulatory framework for payment stablecoin issuers under the GENIUS Act with a 60-day comment window.
- BSA, AML, and OFAC sanctions rules are excluded from this proposal and will be addressed in a separate Treasury rulemaking.
- Stablecoin transfer volume topped $10 trillion in January 2026, the highest recorded level since April 2022 on-chain activity.
- Over 200 stablecoins across 37 chains now carry a combined market cap exceeding $320 billion, per Dune Analytics data.
Payment stablecoins are now at the center of a major U.S. regulatory push. The Office of the Comptroller of the Currency (OCC) has issued a proposed rulemaking under the GENIUS Act.
The proposal covers regulations for permitted stablecoin issuers within the OCC jurisdiction. It also addresses foreign issuers and custody activities by OCC-supervised entities.
Public comments are open for 60 days after Federal Register publication.
OCC Sets the Scope of Its Proposed Rule
The proposed rule addresses most regulations the OCC must issue under the GENIUS Act. However, it does not cover Bank Secrecy Act or Anti-Money Laundering requirements.
Those areas will be handled in a separate rulemaking with the Department of the Treasury. The OCC confirmed it will coordinate with all relevant agencies throughout the process.
Comptroller Jonathan V. Gould spoke directly about the agency’s approach to the proposal. He stated, “The OCC has given thoughtful consideration to a proposed regulatory framework in which the stablecoin industry can flourish in a safe and sound manner.”
He further added, “We welcome feedback on the proposal to inform a final rule that is effective, practical and reflects broad industry perspective.” Gould also noted the OCC will keep working to provide regulated entities with more ways to serve customers and communities.
The proposed rule applies to both domestic and foreign payment stablecoin issuers equally. It also reaches custody activities conducted by OCC-supervised entities.
This broad coverage shows a clear intent to regulate a wide range of market participants. The OCC wants regulated entities to have more ways to serve their customers and communities.
The agency will continue working to fully implement the GENIUS Act going forward. It will also maintain close coordination with other federal agencies involved in the effort.
The public comment period offers stakeholders a formal channel to share concerns. Those responses will directly inform the structure of the final rule.
Stablecoin Market Growth Adds Urgency to New Rules
The stablecoin market has seen strong growth leading into this regulatory moment. Data from Dune Analytics tracks over 200 stablecoins across 37 different blockchain networks.
Total market capitalization has now exceeded $320 billion. That figure reflects how deeply stablecoins have embedded themselves in digital finance.
In January 2026, stablecoin transfer volume surpassed $10 trillion for the month. That marks the highest transfer activity recorded since April 2022.
Around 56% of that volume came from decentralized exchange liquidity pools. This shows the scale of on-chain stablecoin usage well beyond centralized platforms.
Centralized exchanges hold approximately $80 billion in stablecoins currently. That places them as the largest category among labeled on-chain addresses.
The data points to growing reliance on stablecoins across both retail and institutional segments. It also shows why a clear and workable framework has become a pressing need.
The proposed rule arrives as stablecoin adoption reaches a measurable high point. Market participants now have 60 days to formally submit their comments to the OCC.
Those responses will shape the final regulatory direction for payment stablecoins. The industry and regulators alike are now moving in the same direction.


Yesterday, the world’s most valuable company, Nvidia, released its quarterly earnings, which exceeded expectations:
→ Earnings per share: actual = $1.62 (forecast = $1.53);
→ Revenue: actual = $68.13 billion (forecast = $66.13 billion).
Sentiment was further supported by the chipmaker’s guidance for first-quarter revenue above market estimates, reflecting continued heavy spending by major technology companies on artificial intelligence processors.
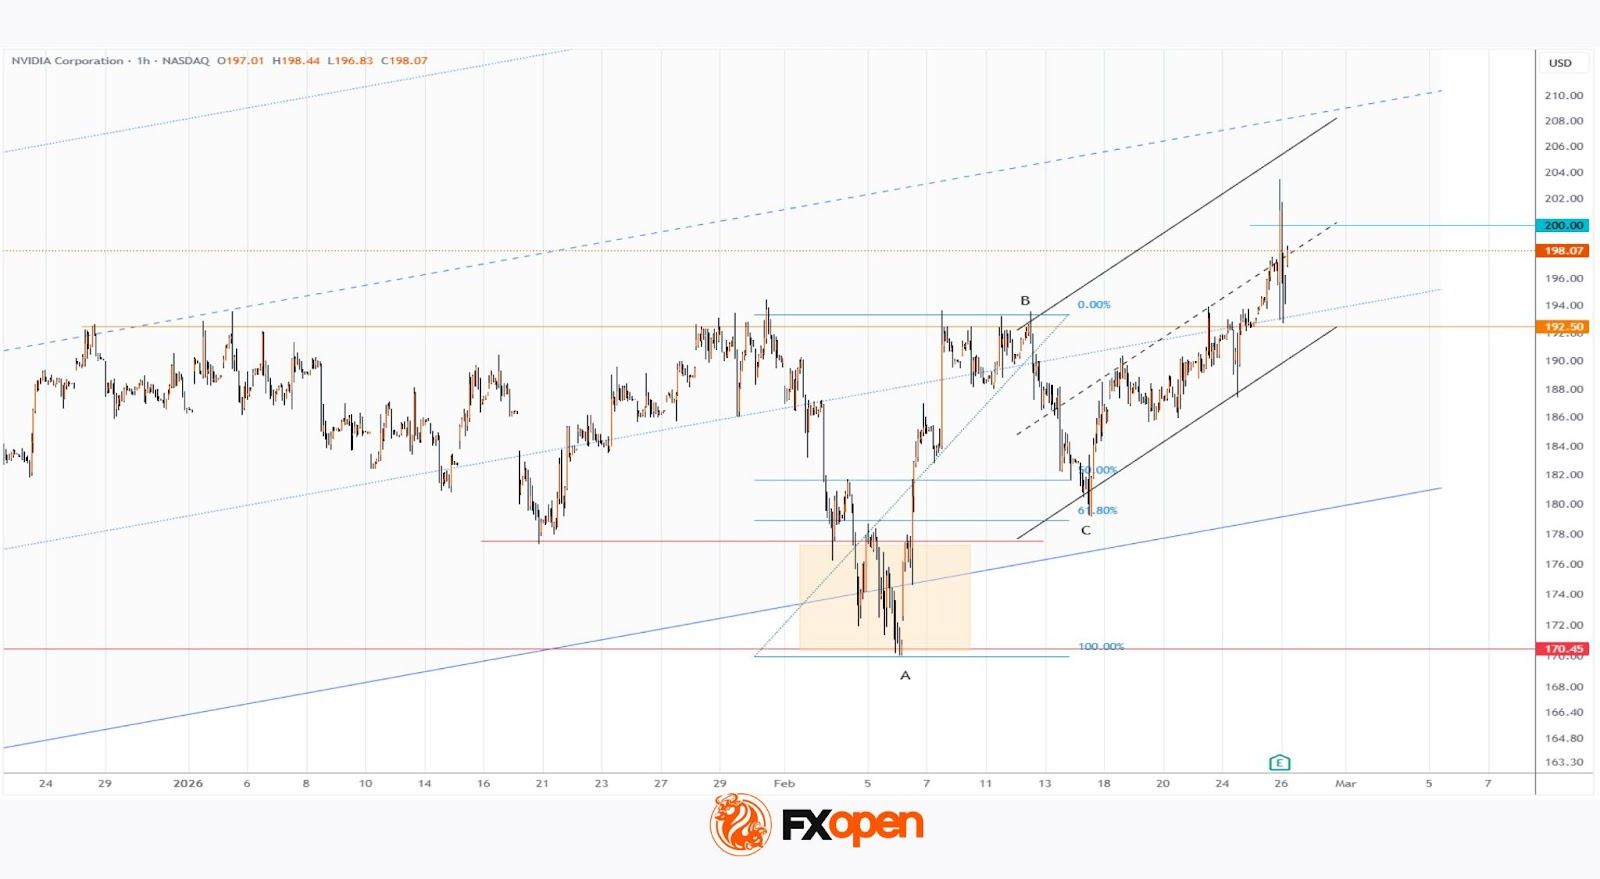
As the Nvidia (NVDA) share price chart shows, the stock rose above the psychological $200 level in after-hours trading, but subsequently pulled back, which may point to excessive optimism and aggressive selling pressure.
Technical Analysis of the Nvidia (NVDA) Chart
On 10 February, when analysing NVDA price movements, we:
→ reaffirmed the validity of the long-term ascending channel (which remains intact) and highlighted the importance of the $192.50 resistance level;
→ suggested that the initiative was on the side of the bulls, who were aiming to resume the long-term uptrend towards the psychological $200 mark.
Since then:
→ NVDA formed a pullback from the указанного resistance level towards the 50–61.8% Fibonacci retracement zone;
→ on 17 February, it resumed its advance, supported by a short-term ascending channel (marked in black), ultimately reaching $200.
Overall, the picture appears constructive, and the next potential target for NVDA may be the median line of the long-term channel. However, it is worth recalling the recent experience of other technology giants whose shares rallied briefly after earnings before turning lower (for example, Meta). The sharp reversal from above the $200 mark lends weight to this scenario.
Therefore, if bulls are to confirm control over NVDA shares, it is important for the price to hold above the $192.50 level.
Buy and sell stocks of the world’s biggest publicly-listed companies with CFDs on FXOpen’s trading platform. Open your FXOpen account now or learn more about trading share CFDs with FXOpen.
This article represents the opinion of the Companies operating under the FXOpen brand only. It is not to be construed as an offer, solicitation, or recommendation with respect to products and services provided by the Companies operating under the FXOpen brand, nor is it to be considered financial advice.
Penn Entertainment beats earnings despite revenue miss, shares rise over 4%

XLM bounces from $0.15 lows, but bears remain in control

Eddie Huang In 'Fresh Off The Boat' 'Memba Him?!


-

 Video6 days ago
XRP News: XRP Just Entered a New Phase (Almost Nobody Noticed)
-

 Politics4 days ago
Baftas 2026: Awards Nominations, Presenters And Performers
-

 Fashion6 days ago
Weekend Open Thread: Boden – Corporette.com
-

 Sports3 days ago
Women’s college basketball rankings: Iowa reenters top 10, Auriemma makes history
-

 Politics3 days ago
Nick Reiner Enters Plea In Deaths Of Parents Rob And Michele
-

 Crypto World2 days ago
XRP price enters “dead zone” as Binance leverage hits lows
-

 Business4 days ago
Mattel’s American Girl brand turns 40, dolls enter a new era
-

 Business2 days ago
True Citrus debuts functional drink mix collection
-

 Business4 days ago
Law enforcement kills armed man seeking to enter Trump’s Mar-a-Lago resort, officials say
-

 Tech2 days ago
Unsurprisingly, Apple's board gets what it wants in 2026 shareholder meeting
-

 NewsBeat11 hours ago
Cuba says its forces have killed four on US-registered speedboat | World News
-
 NewsBeat13 hours ago
Manchester Central Mosque issues statement as it imposes new measures ‘with immediate effect’ after armed men enter
-
 NewsBeat3 days ago
‘Hourly’ method from gastroenterologist ‘helps reduce air travel bloating’
-

 Tech4 days ago
Anthropic-Backed Group Enters NY-12 AI PAC Fight
-

 NewsBeat4 days ago
Armed man killed after entering secure perimeter of Mar-a-Lago, Secret Service says
-

 Politics4 days ago
Maine has a long track record of electing moderates. Enter Graham Platner.
-
 NewsBeat2 days ago
Police latest as search for missing woman enters day nine
-

 Business8 hours ago
Discord Pushes Implementation of Global Age Checks to Second Half of 2026
-

 Crypto World2 days ago
Entering new markets without increasing payment costs
-
 Sports3 days ago
2026 NFL mock draft: WRs fly off the board in first round entering combine week