

Crypto World
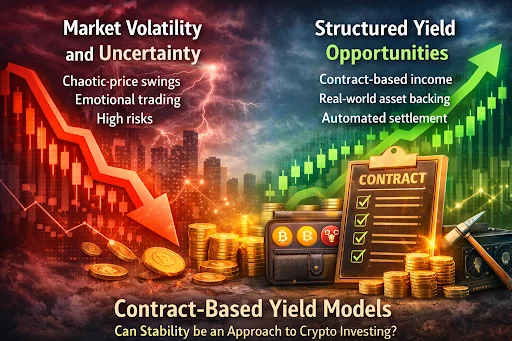
With crypto markets in turmoil, investors are turning to contract-based yield for income
Disclosure: This article does not represent investment advice. The content and materials featured on this page are for educational purposes only.
As XRP struggles, SolStaking positions contract-based staking and real-world asset integration as an alternative to direction-dependent crypto strategies.
Summary
- After a 69% drawdown and one of the largest realized-loss events since 2022, XRP faces both potential bottoming signals and ongoing technical resistance, leaving short-term direction uncertain.
- SolStaking offers structured, contract-based staking and cloud mining models designed to reduce reliance on price timing, supported by audits, custody insurance, and segregated asset management.
- By incorporating Real-World Assets such as bonds, commodities, and infrastructure projects, the platform aims to provide more stable, rule-based settlement mechanisms amid persistent crypto market volatility.

Recent market turbulence has put XRP back in the spotlight. After falling roughly 69% from its recent high, XRP has triggered mixed reactions among analysts. Some point to historical precedents where similar drawdowns were followed by strong recoveries, particularly after periods of heavy capitulation. On-chain data shows one of the largest realized-loss events since 2022, which some interpret as a potential sign of a developing local bottom.
Others, however, remain cautious. From a technical perspective, XRP continues to face meaningful resistance, and failure to reclaim key levels could open the door to further downside. In the near term, price action remains highly sensitive to liquidity shifts and broader market sentiment.
What’s clear is that directional conviction has become increasingly difficult in this environment.
When volatility itself becomes the primary risk
As market volatility intensifies, many participants are realizing that risk does not come solely from being “wrong on direction,” but from overexposure to price fluctuations themselves.
In choppy, range-bound market cycles, strategies built around short-term trading or leverage are often disrupted by abrupt changes in liquidity and sentiment. Even well-timed positions can be undermined by sudden moves that have little to do with fundamentals.
As a result, some investors are beginning to explore participation models with clearer rules, fixed timeframes, and automated settlement, seeking ways to stay involved in the crypto ecosystem without being entirely dependent on short-term price trends.
What is SolStaking?
SolStaking is a platform offering multi-asset staking and cloud mining services. Rather than focusing on market timing or price prediction, SolStaking is structured around contract-based participation models designed to operate across varying market conditions.
At the infrastructure level, the platform emphasizes long-term operational stability and risk control, including:
- A U.S.-registered operating entity: Sol Investments, LLC
- Strict segregation of user staking assets from operating funds
- Periodic independent audits conducted by PwC
- Custody insurance provided by Lloyd’s of London
- Enterprise-grade security, including layered encryption and 24/7 risk monitoring
This framework is not intended for short-term speculation, but for sustained operation in volatile market environments.
The role of real-world assets
Unlike models that are fully exposed to on-chain price movements, SolStaking incorporates Real-World Assets (RWA) as part of its underlying support structure. These assets may include AI data centers, sovereign and investment-grade bonds, physical gold and commodities, industrial metal inventories, logistics and cold-chain infrastructure, as well as agricultural and clean energy projects.
These assets operate off-chain and generate relatively stable revenue streams. After verification and accounting, relevant data is mapped on-chain, where smart contracts execute settlements automatically based on predefined rules. This approach is designed to reduce reliance on any single market’s price volatility.
Contract-based participation (illustrative examples)
SolStaking offers a range of contracts tailored to different capital levels and participation periods. Examples include:
Contract Type
Starting Amount
Duration
Estimated Settlement*
Trial Plan
$100
2 days
approx. $108
TRX Income Plan
$3,000
15 days
approx. $3,585
XRP Flagship Plan
$30,000
30 days
approx. $44,400
BTC Flagship Plan
$300,000
50 days
approx. $630,000
*Figures are model illustrations only. Actual outcomes depend on contract terms and system performance.
Under certain configurations, the model can generate outputs equivalent to several thousand XRP per day, driven primarily by operational design and execution efficiency, rather than short-term market price movements.
Conclusion: From predicting markets to rethinking participation
As Bitcoin and major altcoins continue to test critical support levels, volatility is becoming a constant rather than an exception. For many market participants, the challenge may no longer be improving price forecasts, but adapting how they engage with the market.
SolStaking represents one approach focused on structured participation and operational consistency, offering an alternative for those looking to reduce direct exposure to unpredictable price swings while remaining active in the digital asset space.
To learn more about SolStaking, visit the official website.
Disclosure: This content is provided by a third party. Neither crypto.news nor the author of this article endorses any product mentioned on this page. Users should conduct their own research before taking any action related to the company.


XRP has a liquidity problem that has nothing to do with price: More than 2 billion tokens, or about 3.5% of the circulating supply, aren’t actually circulating.
The tokens, valued around $3 billion, are held in wallets from Xaman, and are largely locked out of decentralized finance (DeFi). To access DeFi means downloading new wallets, bridging assets across chains, managing gas tokens and navigating unfamiliar interfaces. Most holders never bothered.
Now, Xaman said it has reached an agreement with the Flare blockchain that will reduce the process into a single transaction, allowing users to deposit their XRP directly into a curated vault on the Flare blockchain.
The system rests on three components working in the background.
First are FAssets, which create a trust-minimized representation of XRP on Flare — effectively a wrapped version of the token that can interact with smart contracts. Then come Flare Smart Accounts, which abstract away the need for users to manage a second wallet. Instead of juggling private keys across chains, users authorize transactions with their existing XRPL credentials. Finally, Xaman acts as the front-end, embedding the process directly inside the wallet many XRP holders already use.
From the user’s perspective, the process is reduced to a single action. Behind the scenes, the transaction carries detailed instructions. Flare’s Data Connector validates the request, while Smart Account controllers handle the minting of the wrapped asset, allocation into vault strategies and any subsequent yield distribution. What would typically require bridging assets, acquiring gas tokens and interacting with multiple decentralized applications is compressed into one workflow.
“This integration lets our users explore new options directly from the wallet they already know, while keeping full control of their keys and decisions,” said Wietse Wind, founder of Xaman, in a statement to CoinDesk.
The vault strategies themselves are managed by Upshift and curated by Clearstar, which oversee capital deployment and risk management. While specific yield targets were not disclosed, the strategies are built around familiar DeFi primitives such as lending markets, collateralized positions and structured products.
There are early signs that XRP holders are willing to experiment. Flare’s FXRP — its existing wrapped XRP token — has surpassed 100 million in minted supply, with more than 60 million currently deployed across staking programs and structured products. That growth suggests at least some appetite for putting XRP to work, rather than leaving it idle.
The broader backdrop makes the timing notable. XRP rose 6% earlier this week amid a 212% spike in retail buying volume, and exchange-traded fund inflows have remained positive since their November launch. Yet much of that activity reflects directional bets on price.
For XRP’s DeFi ambitions — sometimes dubbed “XRPFi” — the bigger challenge has been usability, not demand. If billions of dollars’ worth of tokens are effectively stranded by friction, lowering that friction may matter more than another rally. Infrastructure that turns passive holdings into productive capital could determine whether XRP’s DeFi narrative evolves beyond branding.
Editor’s note: Nvidia’s latest earnings release highlights a booming AI infrastructure cycle, with the company topping expectations and guiding $78 billion for Q1 FY2027. The data centre segment led growth while margins remained robust as hyperscale customers expand their AI deployments. This preview frames a broader trend: AI-ready data centres are becoming the core engine of digital transformation, and Nvidia sits at the center of that wave.
Key points
- NVIDIA (NASDAQ: NVDA) guides Q1 FY2027 revenue midpoint of US$78 billion, above consensus.
- Q4 revenue reached US$68.13 billion, with data centre revenue at US$62.3 billion.
- Data centre revenue accounts for about 91% of total revenue, with gaming softer due to supply constraints.
- Networking revenue surged 263% YoY to US$11 billion; inventory/capacity commitments total US$95.2 billion.
- Hyper-scaler AI infrastructure spending projected at US$650 billion for 2026, driven by Microsoft, Amazon, Google and Meta.
Why this matters
The results reinforce that the AI infrastructure cycle is accelerating, not slowing. Strong data centre demand, high gross margins at 75.2%, and large-scale capacity commitments suggest durable momentum as AI workloads drive broader data-centre re-architecture. The report notes that China data centre revenue could add upside if export restrictions ease.
What to watch next
- Any changes to export restrictions affecting China data centre revenue and potential upside to guidance.
- Trends in data centre demand and Nvidia’s inventory/capacity commitments amid hyperscaler spending.
- Gaming segment performance and supply constraints ahead of Q1.
- Progress of AI infrastructure investments by Microsoft, Amazon, Google, and Meta.
Disclosure: The content below is a press release provided by the company/PR representative. It is published for informational purposes.
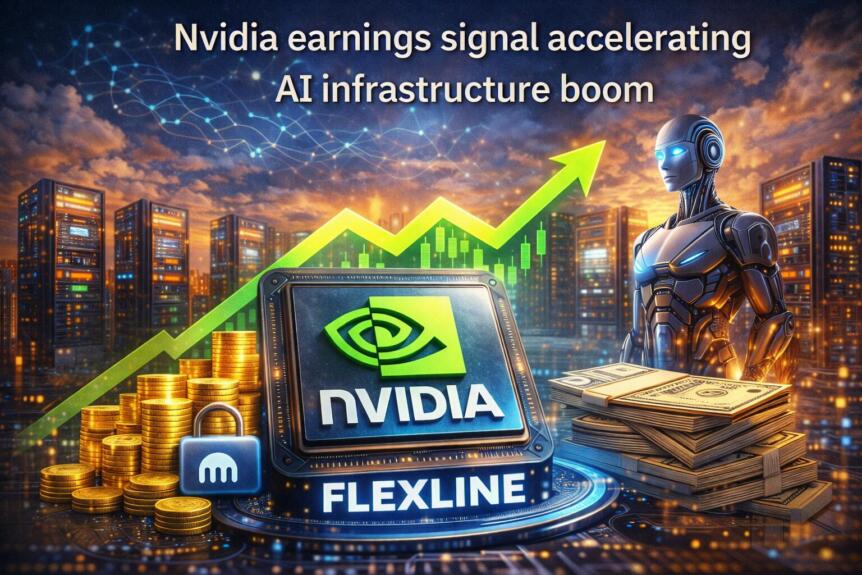
Nvidia earnings underscore accelerating AI infrastructure boom
Abu Dhabi, UAE – February 26, 2026: Nvidia has once again delivered a standout set of earnings, beating expectations across the board and, crucially, surpassing its own forward guidance. The company guided Q1 FY2027 revenue to a midpoint of US$78 billion, comfortably ahead of the US$72.78 billion analysts had forecast. Notably, this guidance assumes zero data centre revenue from China, meaning any easing of export restrictions would represent pure upside not currently priced in.
Quarterly revenue reached US$68.13 billion, ahead of consensus expectations of approximately US$65.9 billion. Data centre revenue surged to a record US$62.3 billion, exceeding the US$60.4 billion forecast, while adjusted earnings per share came in at US$1.62 versus expectations of US$1.53. Profit for the quarter totalled US$43 billion — a figure that exceeds Nvidia’s entire annual revenue as recently as 2023. For a company of this scale to sustain such rapid expansion underscores the structural strength of demand.
Gross margins of 75.2% also came in ahead of forecasts, helping to dispel concerns about profitability as the Blackwell platform continues to ramp up. The results send a clear message that the AI infrastructure buildout is not slowing — it is accelerating. Despite recurring scepticism each quarter, Nvidia continues to demonstrate the durability of this cycle.
Spending commitments from Microsoft, Amazon, Google and Meta — collectively projected at US$650 billion for AI infrastructure in 2026 — highlight the scale of investment driving this trend. Nvidia sits firmly at the centre of that wave. Networking revenue alone surged 263% year-on-year to a record US$11 billion, reflecting that the AI transformation extends beyond chips to the full-scale re-architecture of data centres.
The company has secured US$95.2 billion in inventory and capacity commitments, nearly double the level from a year ago, ensuring it can meet demand from hyperscalers operating at unprecedented scale. Gaming was the only softer segment, with supply constraints expected into Q1, but with data centre revenue now accounting for 91% of total revenue, it is no longer the primary growth driver.
Since the emergence of ChatGPT, Nvidia’s data centre revenue has grown nearly thirteenfold. As the AI race intensifies and big tech spending remains at historic highs, Nvidia continues to position itself as the essential enabler of the AI ecosystem — reinforcing why it is widely regarded as the engine powering this technological shift.
About eToro
eToro is the trading and investing platform that empowers you to invest, share and learn. We were founded in 2007 with the vision of a world where everyone can trade and invest in a simple and transparent way. Today we have 40 million registered users from 75 countries. We believe there is power in shared knowledge and that we can become more successful by investing together. So we’ve created a collaborative investment community designed to provide you with the tools you need to grow your knowledge and wealth. On eToro, you can hold a range of traditional and innovative assets and choose how you invest: trade directly, invest in a portfolio, or copy other investors. You can visit our media centre here for our latest news.
XRP price has struggled to mount a decisive recovery in recent weeks, yet it continues to defend a critical support level. The altcoin has avoided a deeper breakdown despite repeated tests of lower price zones. This resilience suggests underlying accumulation.
Investor sentiment initially leaned cautiously. However, from spot markets to derivatives, traders appear to be preparing for a potential rebound.
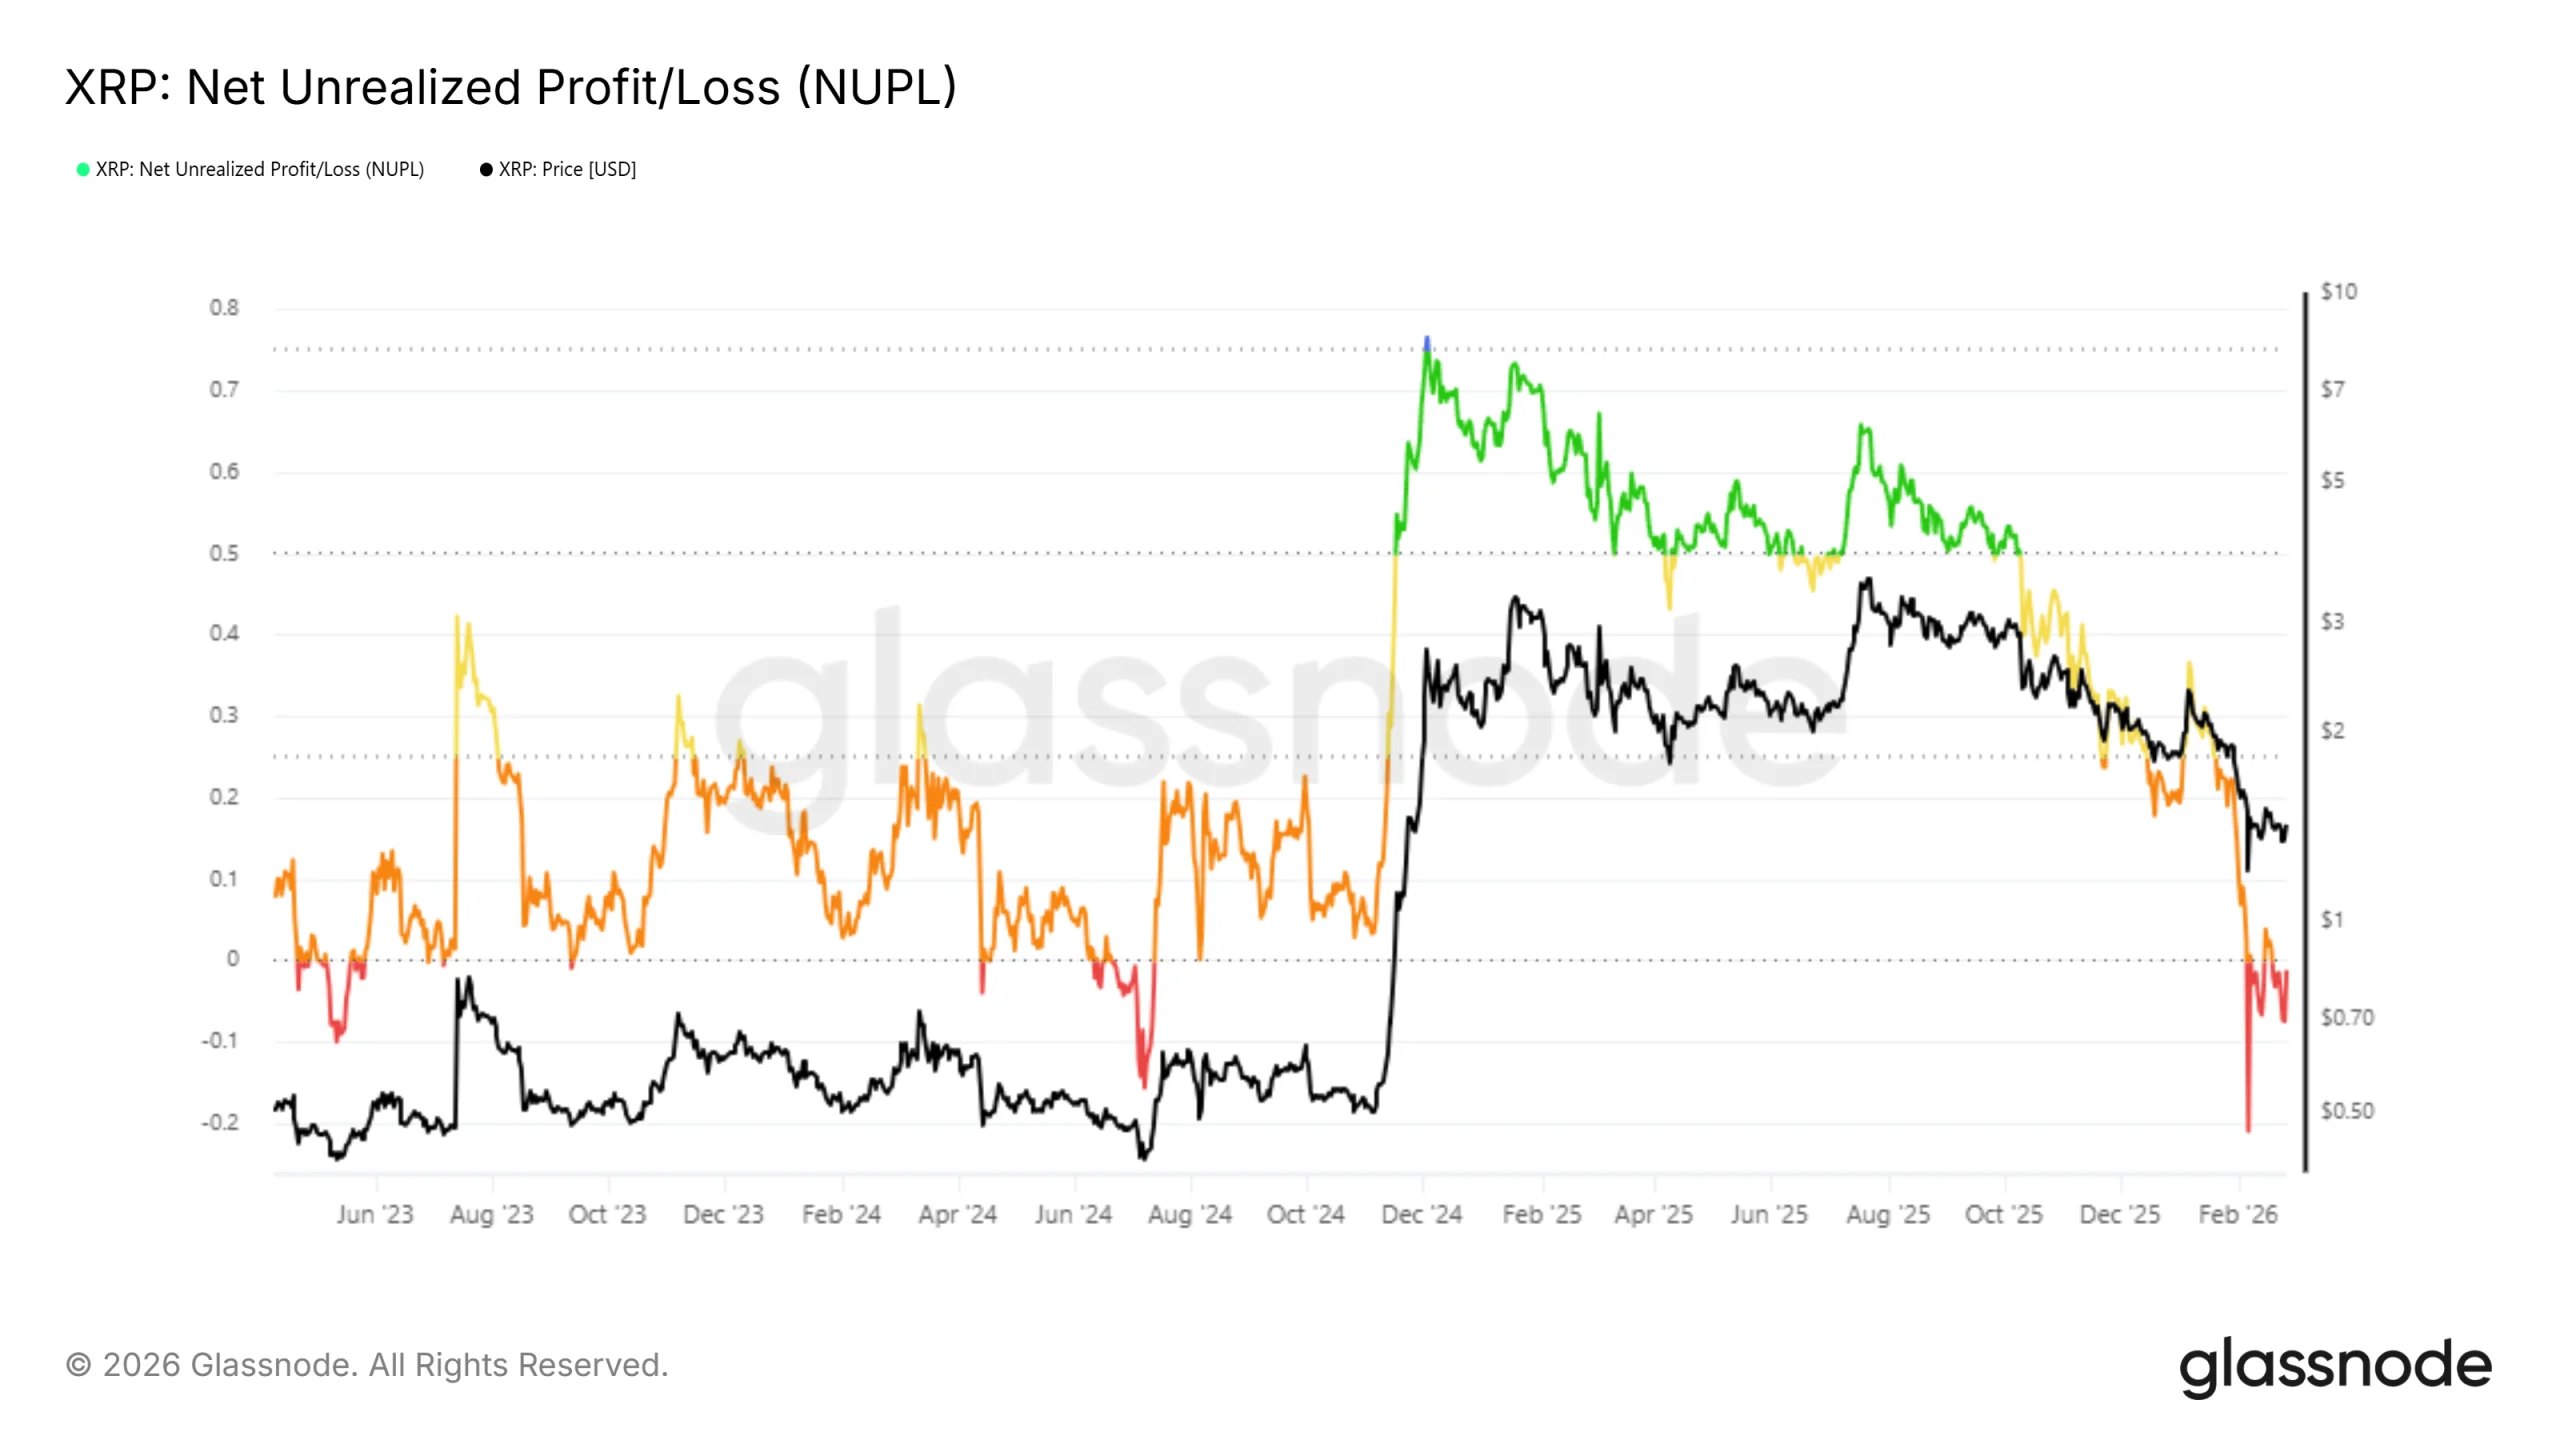
XRP Is Not Too Deep Underwater
Net Unrealized Profit and Loss, or NUPL, indicates XRP is in a capitulation phase but not deeply so. The metric is currently hovering around the zero line. This position reflects that losses among holders are declining, nearing neutral conditions rather than extreme loss realization.
Historically, XRP has remained in the capitulation zone for extended periods, sometimes lasting up to a month. These phases often precede rebounds once selling pressure exhausts. The current stretch is nearing the one-month mark, suggesting a potential inflection point may be approaching.
Want more token insights like this? Sign up for Editor Harsh Notariya’s Daily Crypto Newsletter here.

How Are XRP Traders and Holders Reacting?
Mean Coin Age, or MCA, offers additional insight into holder behavior. Ahead of a potential bounce, XRP long-term holders appear to favor accumulation over distribution. Rising MCA values typically indicate coins are aging in wallets rather than being spent or sold.
Aside from a minor dip, XRP long-term holders have maintained a constructive stance. Continued accumulation reduces circulating supply pressure. Sustained conviction among these investors often supports structural price recovery over time.
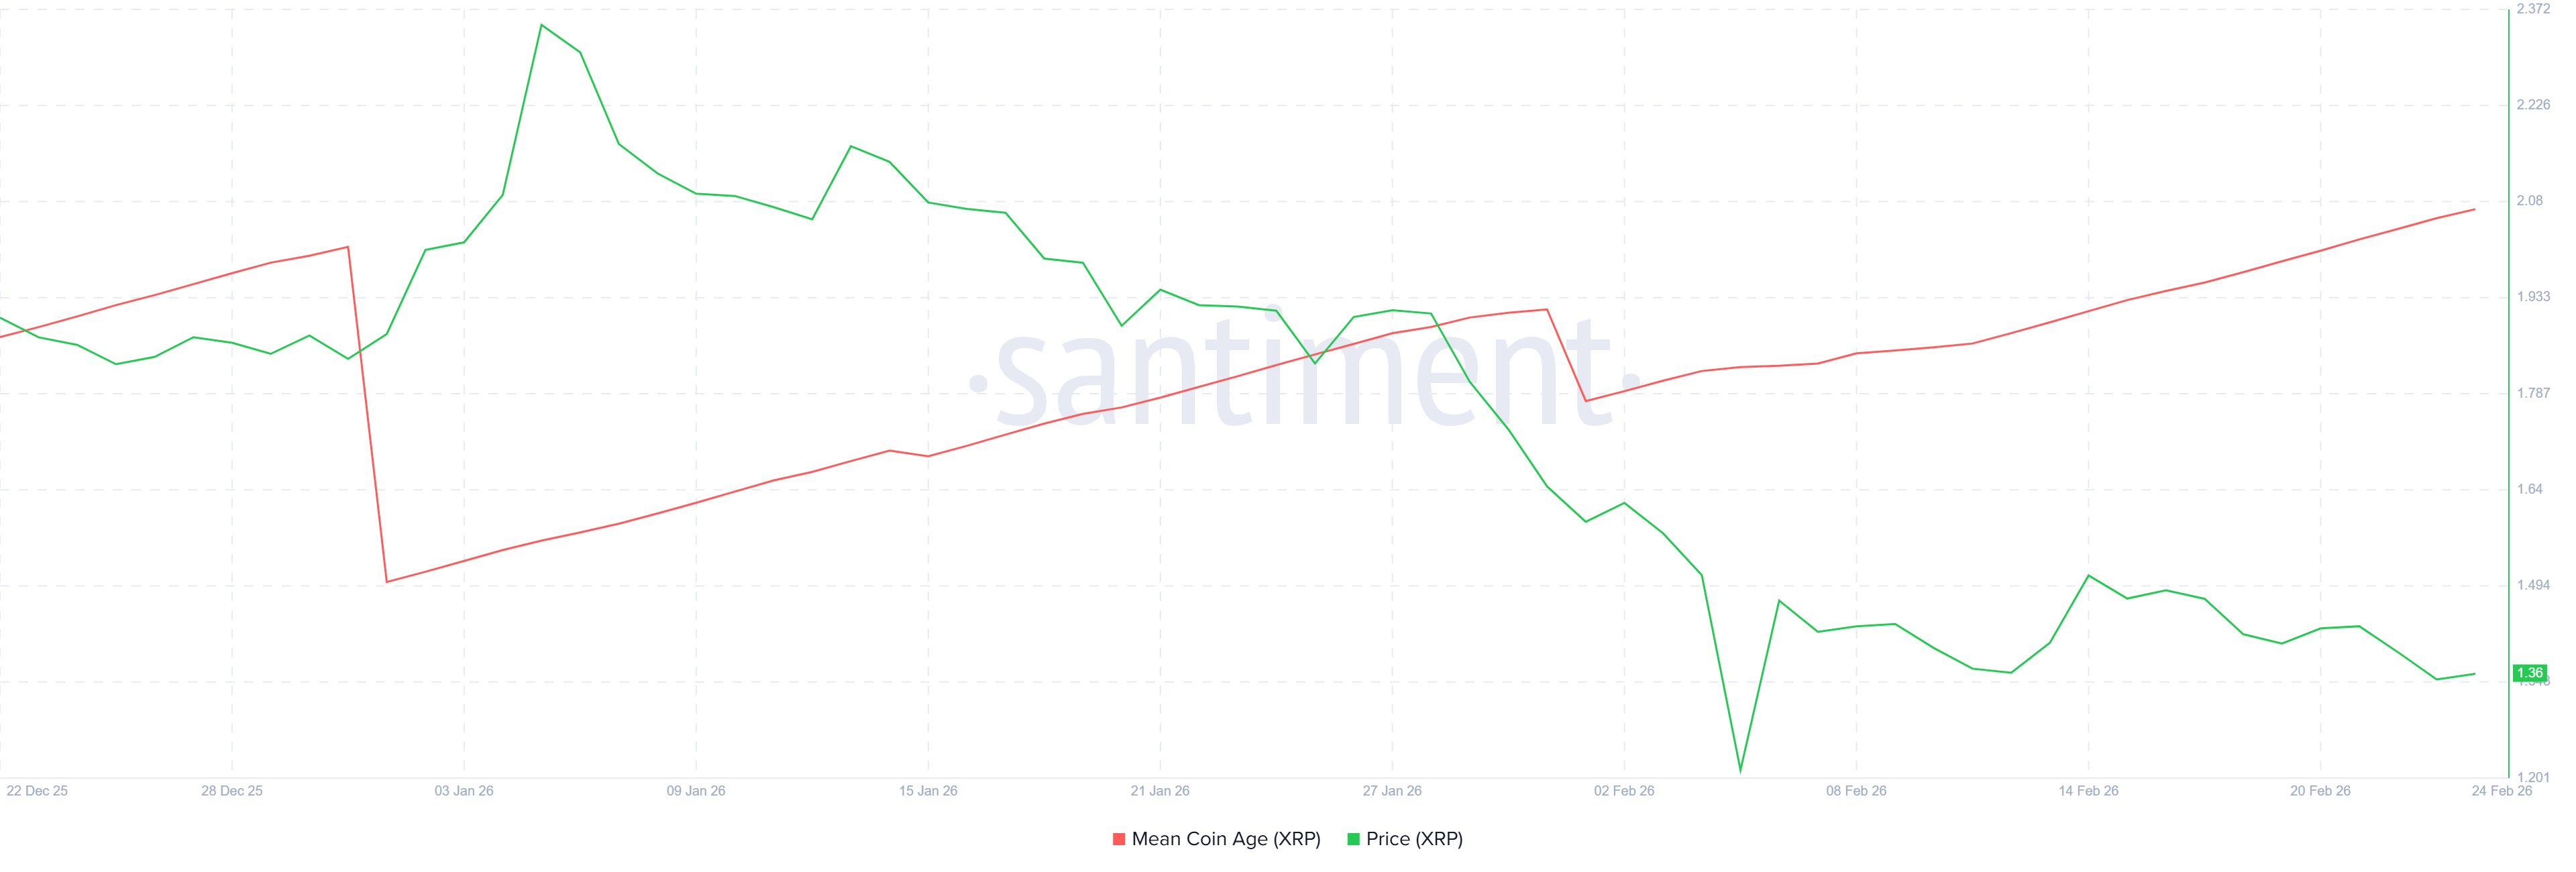
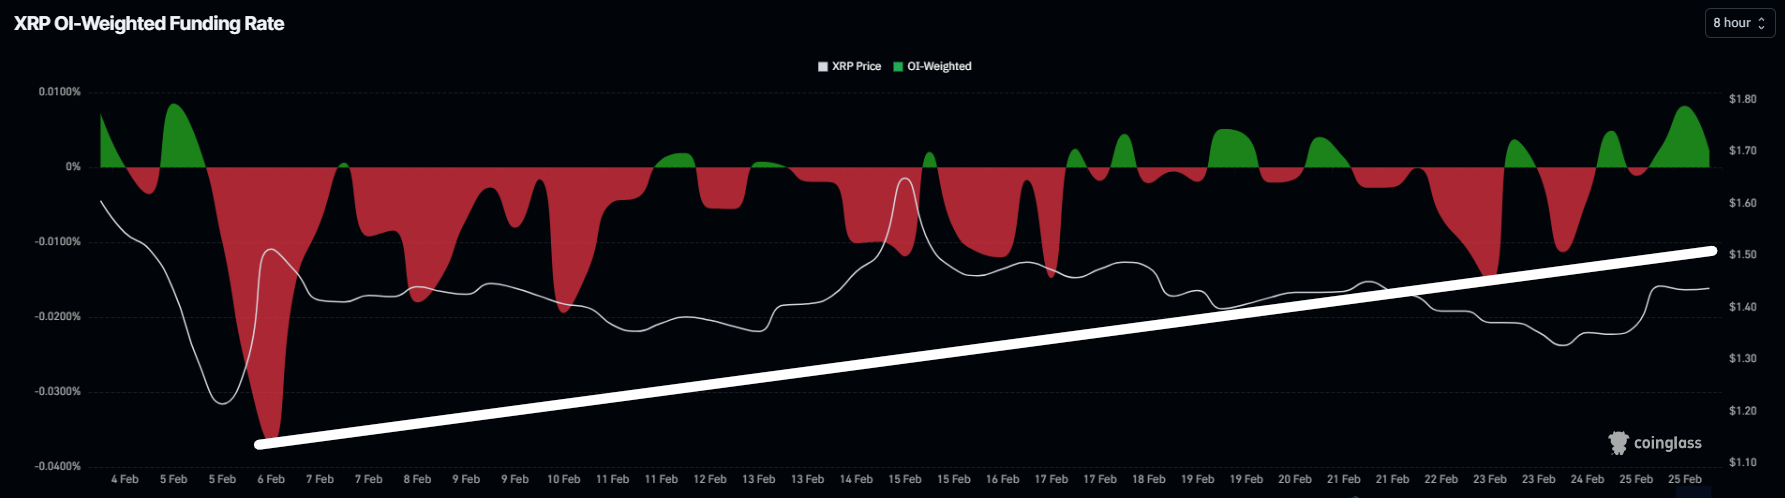
Derivatives market data mirrors developments in spot trading. XRP Funding rates have shifted meaningfully over the past three weeks. Previously deeply negative readings have transitioned to modestly positive territory.
A positive funding rate reflects the dominance of long positions over short positions. This dynamic signals improving trader confidence. Increased long exposure can generate upward pressure as demand strengthens through leveraged positioning.
XRP Price Holds Above Support Floor
XRP is trading at $1.43 at the time of writing, hovering near the 38.2% Fibonacci retracement level. The 23.6% retracement, often viewed as a bear market support floor, remains intact. Sustained trading above this threshold reinforces structural stability.
Holding above the bear market support floor suggests limited immediate bearish pressure. If improving sentiment persists, XRP could challenge the $1.53 resistance level. A successful breakout may push the token toward $1.62. Flipping the 61.8% Fibonacci level into support would confirm a recovery phase.
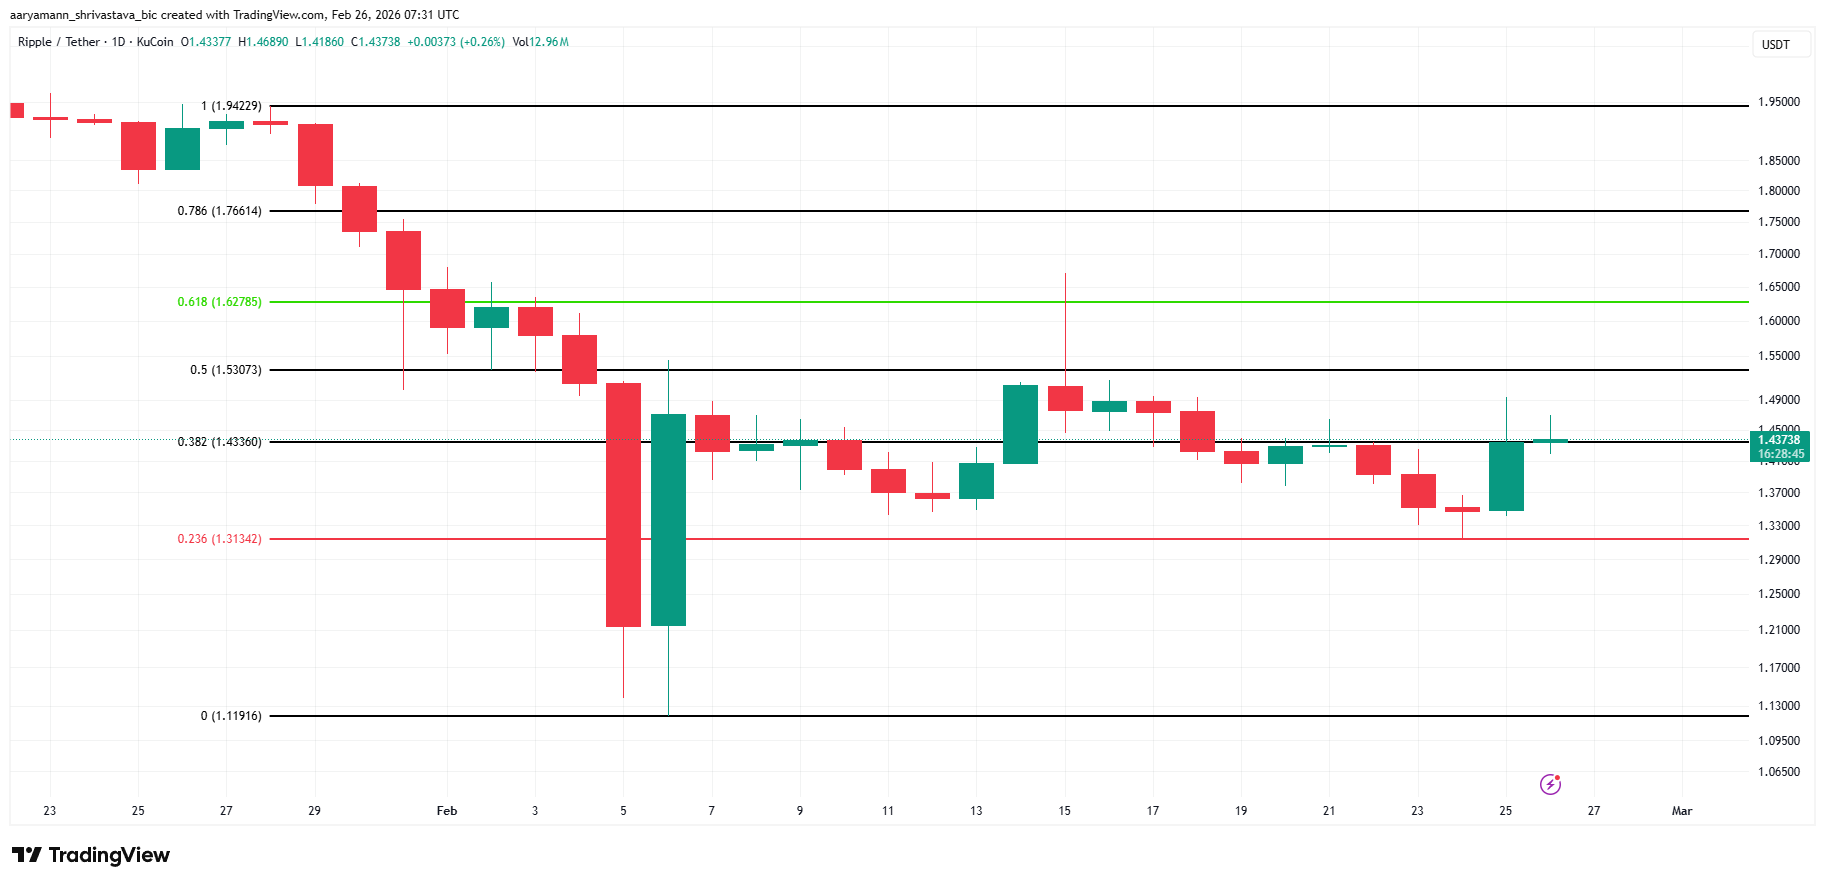
Conversely, weaker macro conditions could delay upside progress. Failure to clear $1.53 may extend consolidation. Continued range-bound trading would invalidate the short-term bullish thesis. Without stronger demand, XRP may remain subdued until broader crypto market momentum improves.

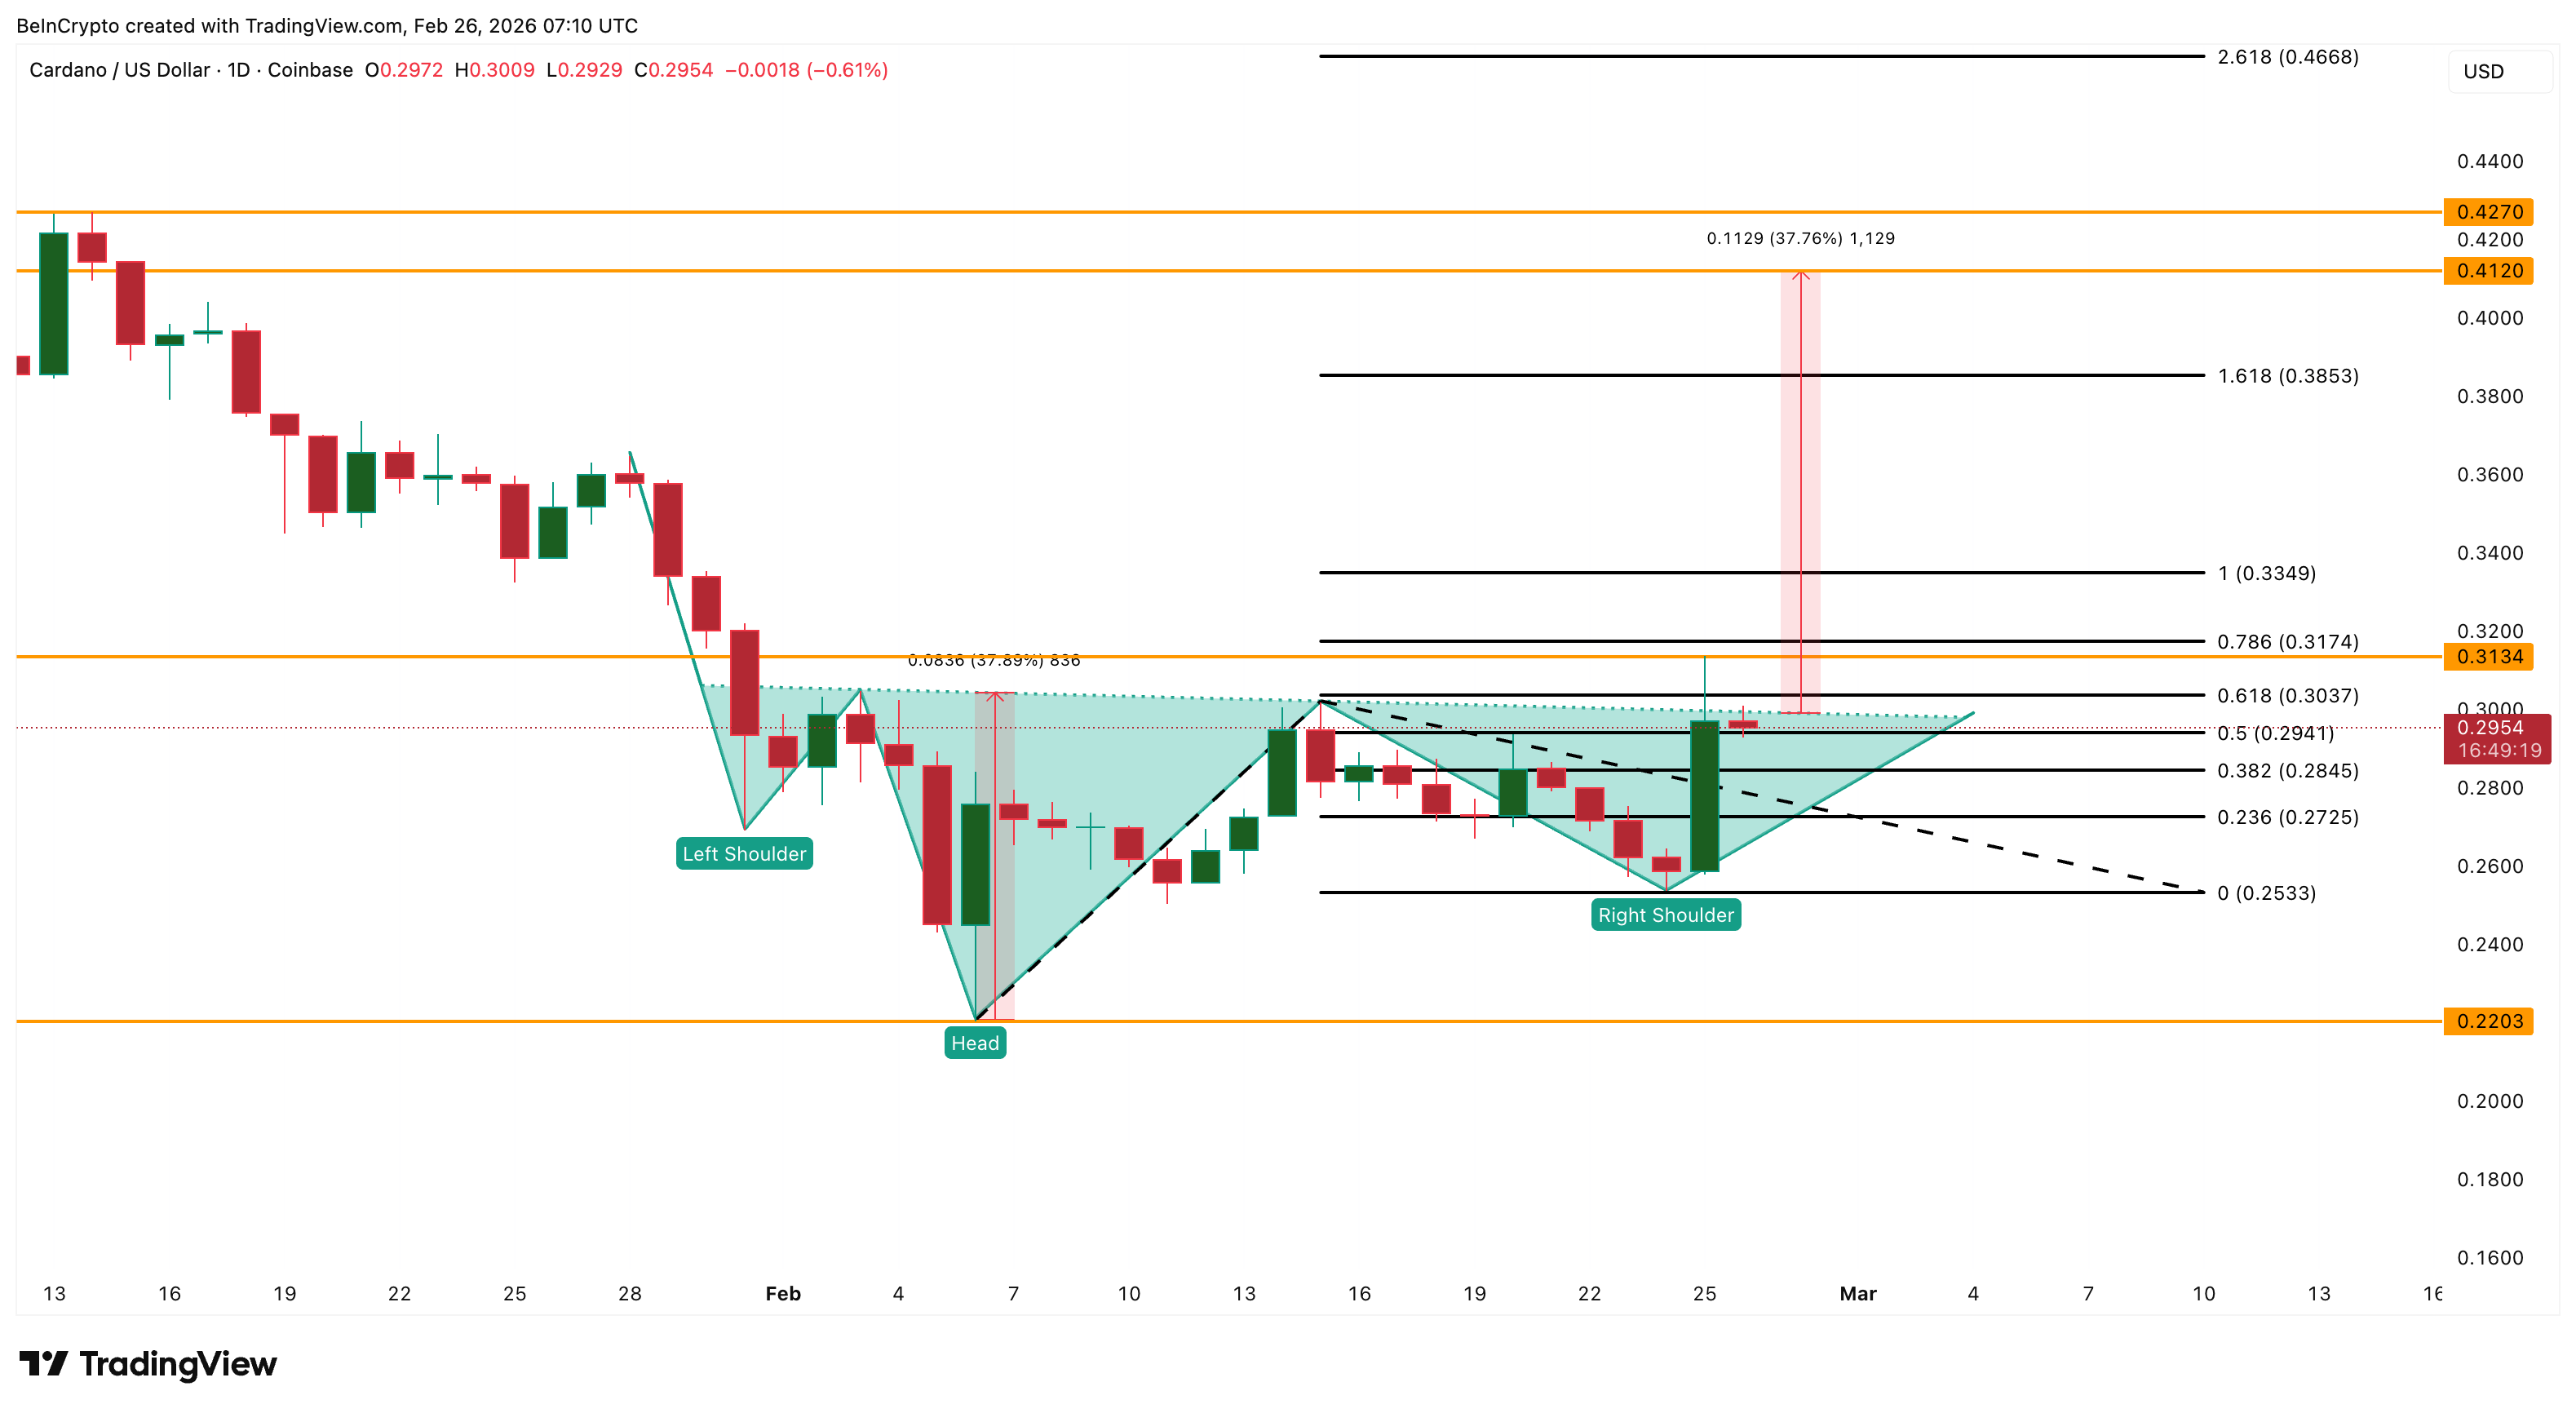
The Cardano price is still up nearly 12% over the past 24 hours, holding near $0.29 after rebounding from its recent lows. On the surface, this looks like the start of a larger recovery. The price even attempted a breakout that projected a roughly 38% rally toward $0.41. But that breakout has failed so far.
The rejection was not sudden. It happened despite massive whale buying worth about $340 million. The real story is deeper. Multiple hidden forces, including conflicting whale activity and liquidation risk, quietly blocked the rally.
Bullish Divergence And Breakout Setup Initially Pointed To A 38% Rally
The recovery setup began forming weeks earlier. Between January 31 and February 24, the Cardano price formed a lower low. This means the price dropped to a new bottom compared to the previous swing. Normally, that signals weakness. But at the same time, the Relative Strength Index (RSI) formed a higher low.
RSI is a momentum indicator that measures buying and selling strength. When RSI rises while price falls, it creates a bullish divergence, a reversal cue. This usually signals that selling pressure is weakening, even as the price continues to decline.
This exact pattern appeared within an inverse head-and-shoulders structure, a classic bullish reversal pattern. When Cardano approached the neckline level on February 25, it appeared ready to break out. The projected upside from this pattern was about 38%.
Want more token insights like this? Sign up for Editor Harsh Notariya’s Daily Crypto Newsletter here.
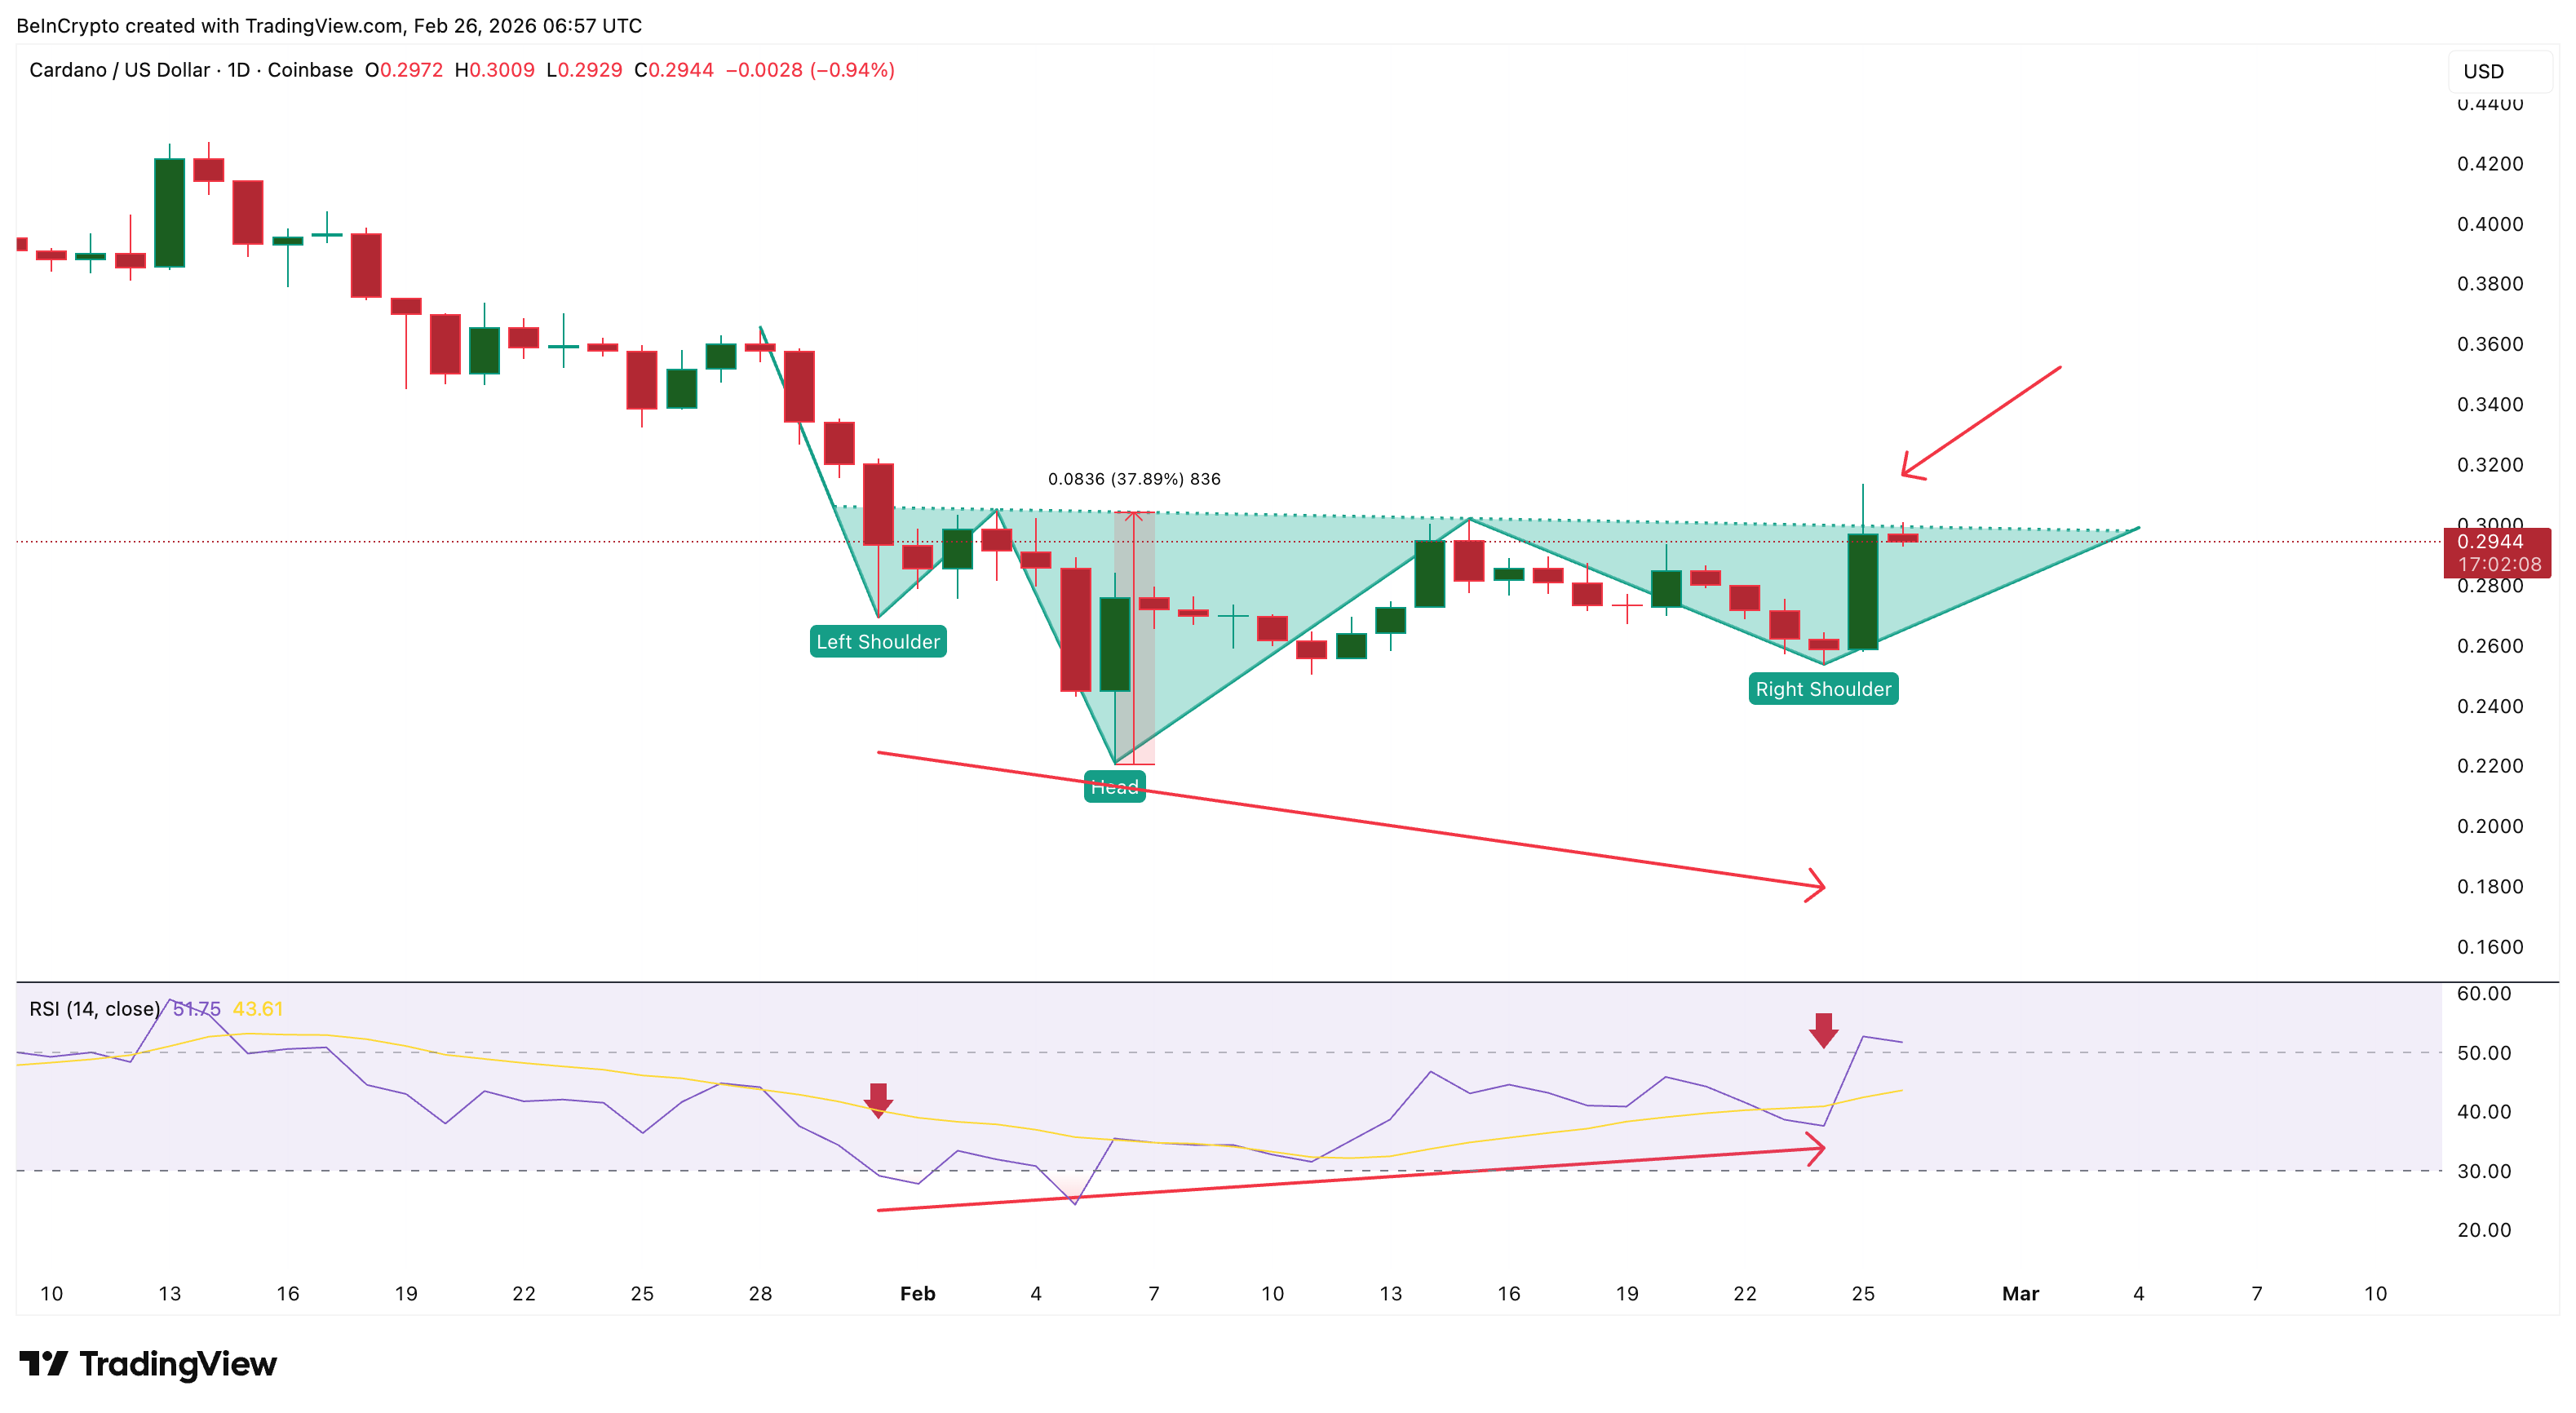
But instead of breaking cleanly, Cardano formed a long upper wick and fell back. This long wick shows sellers entered aggressively and absorbed the buying pressure before the breakout could be confirmed. At this point, the breakout failed.
The failed breakout did not happen without warning. Right after the rejection on February 25, another dangerous signal appeared on the chart — a hidden bearish divergence.
Between January 21 and February 25, the Cardano price formed a lower high. This means the recent peak was still weaker than the previous rally peak. But during the same period, the Relative Strength Index (RSI) formed a much higher high.
This is called a hidden bearish divergence. It happens when momentum rises faster than price, but price still fails to break key resistance. This usually signals that the rally is running out of strength and that sellers are preparing to regain control.
The timing makes this signal even more important. The divergence as Cardano printed the long upper wick on February 25 and failed to break above $0.31.
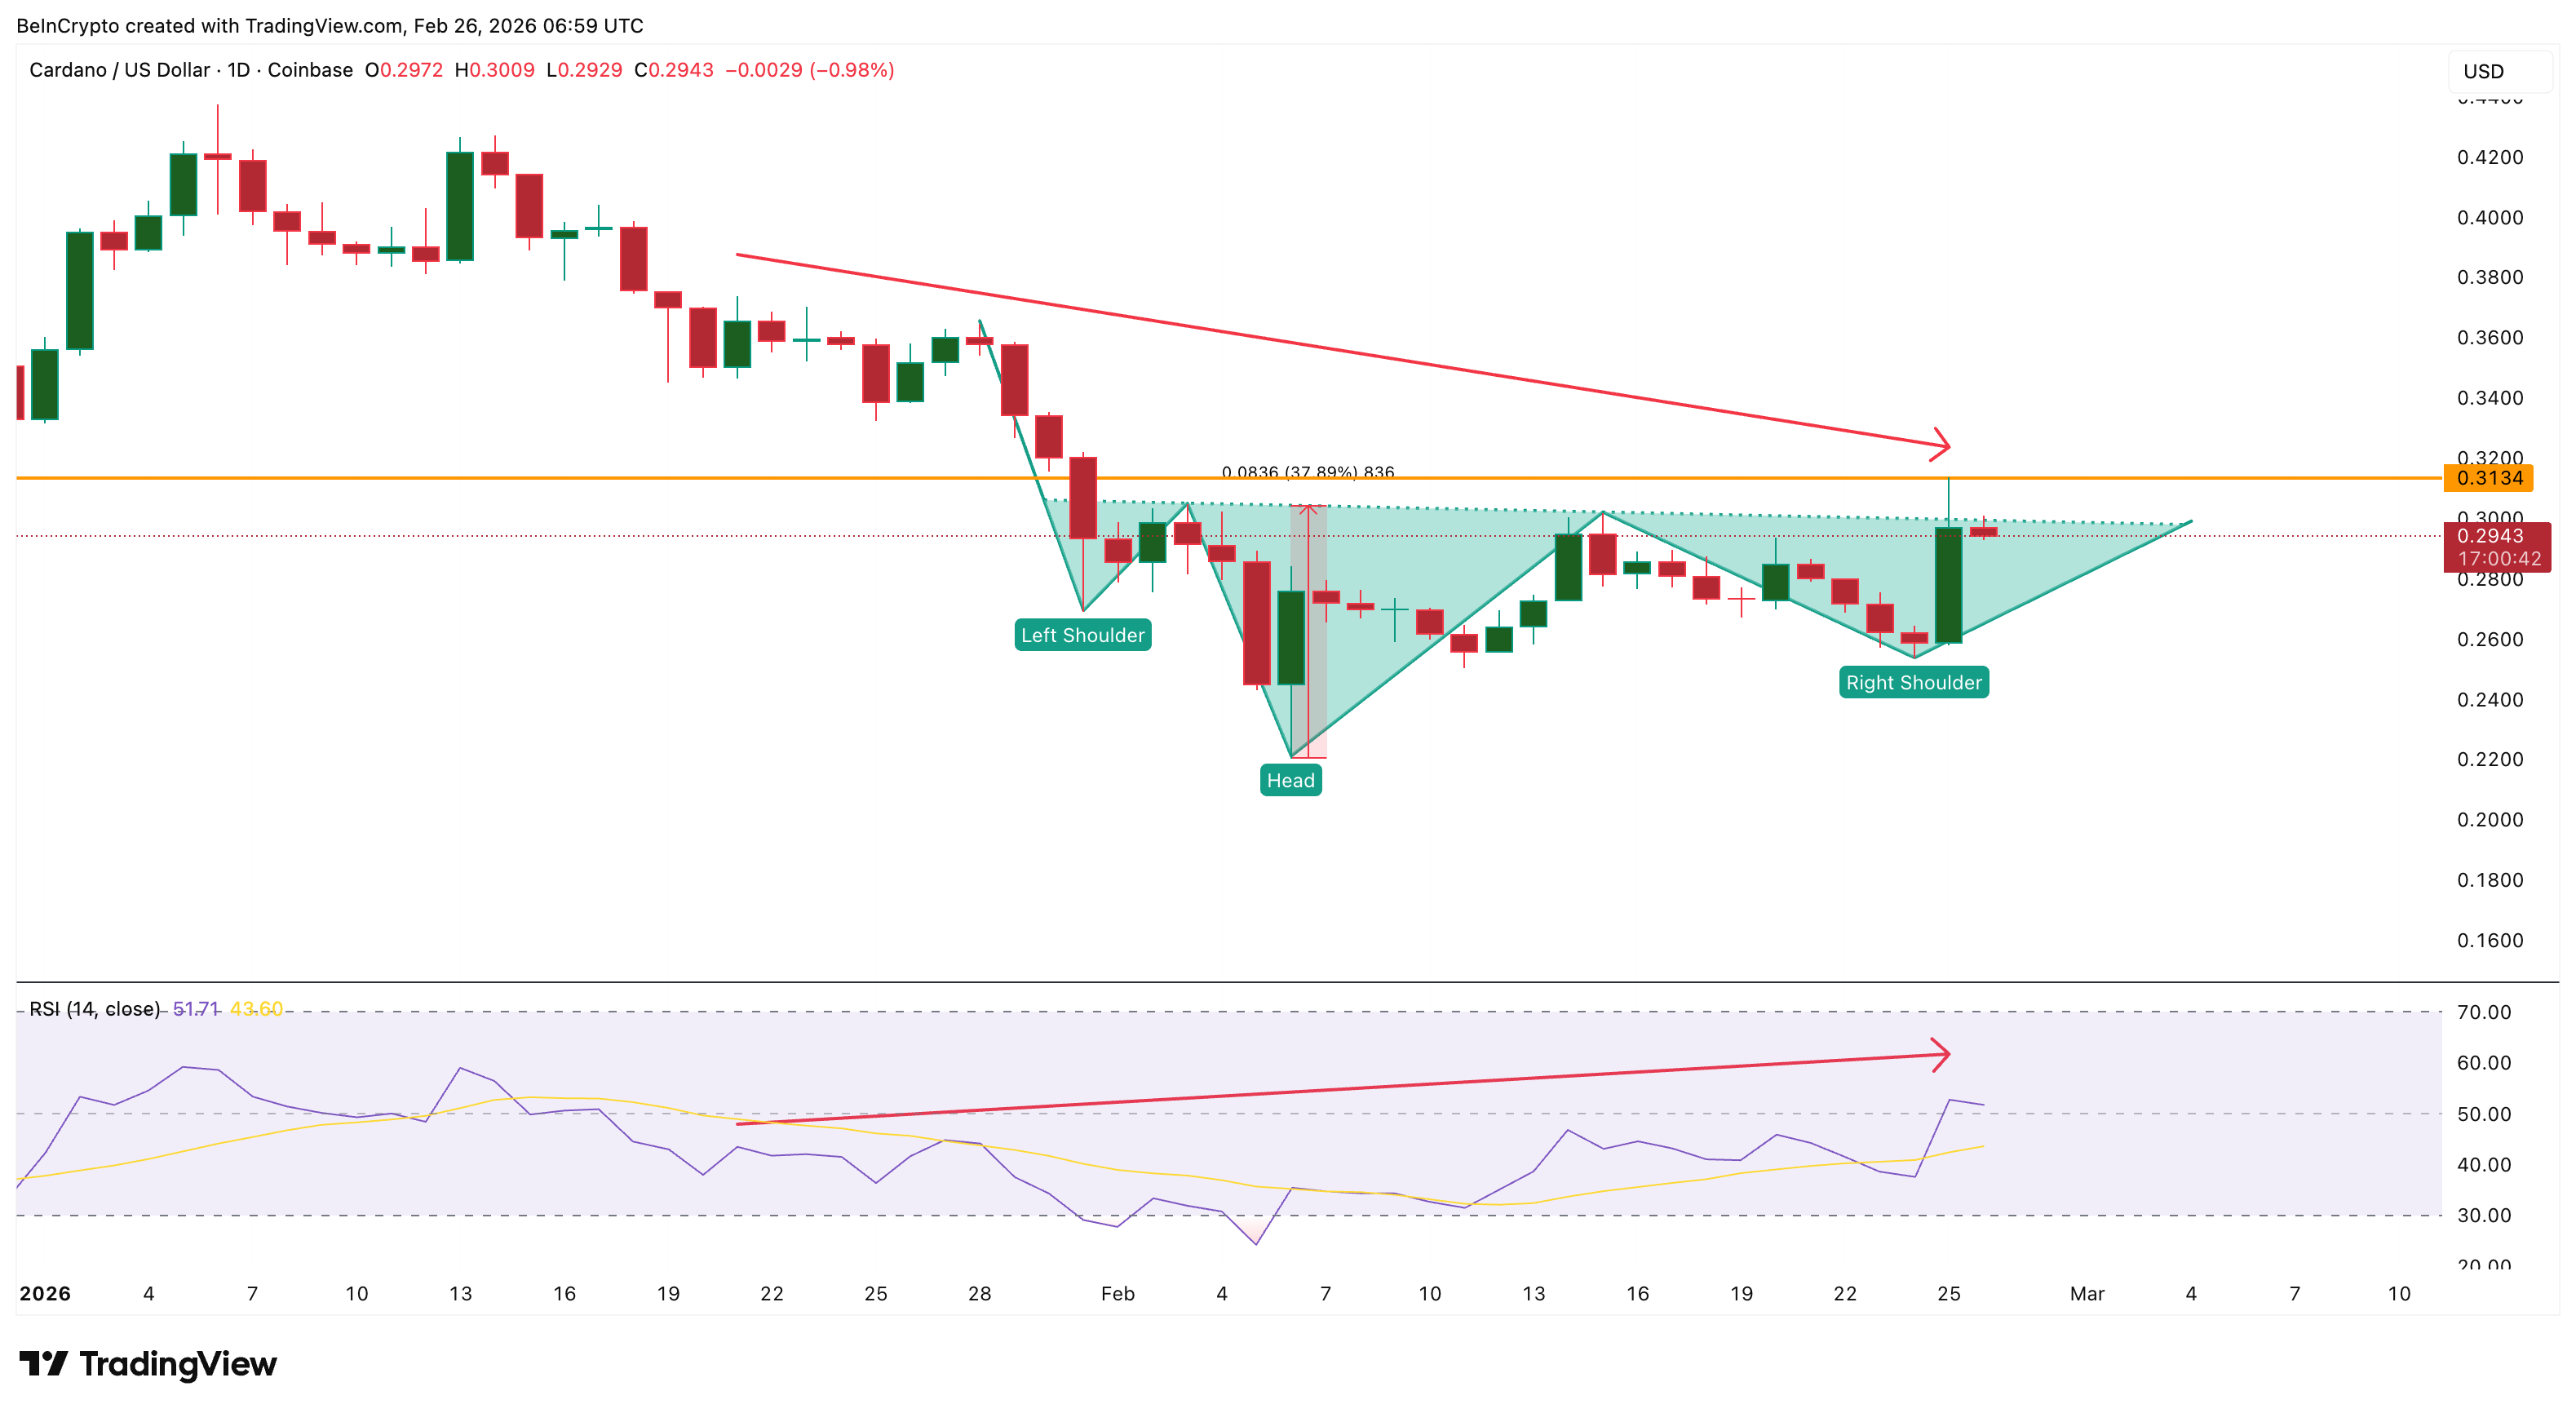
This confirms that the breakout rejection was not just random profit-taking. It was a structural rejection backed by weakening price strength beneath rising momentum. Hidden bearish divergences often lead to pullbacks. That pullback now appears to have already started, with Cardano slipping back below its breakout level.
This creates a risky situation. The bullish breakout structure is still technically alive, but only if the pullback remains limited. A deeper decline would confirm that sellers have fully regained control.
$340 Million Whale Buying Happened — But Larger Whales Quietly Sold Much More
At first glance, whale data looked extremely bullish. Wallets holding between 100 million and 1 billion ADA increased their holdings from 2.33 billion ADA to 3.47 billion ADA. This means they bought 1.14 billion ADA, worth about $340 million. This is the buying activity most traders possibly saw.
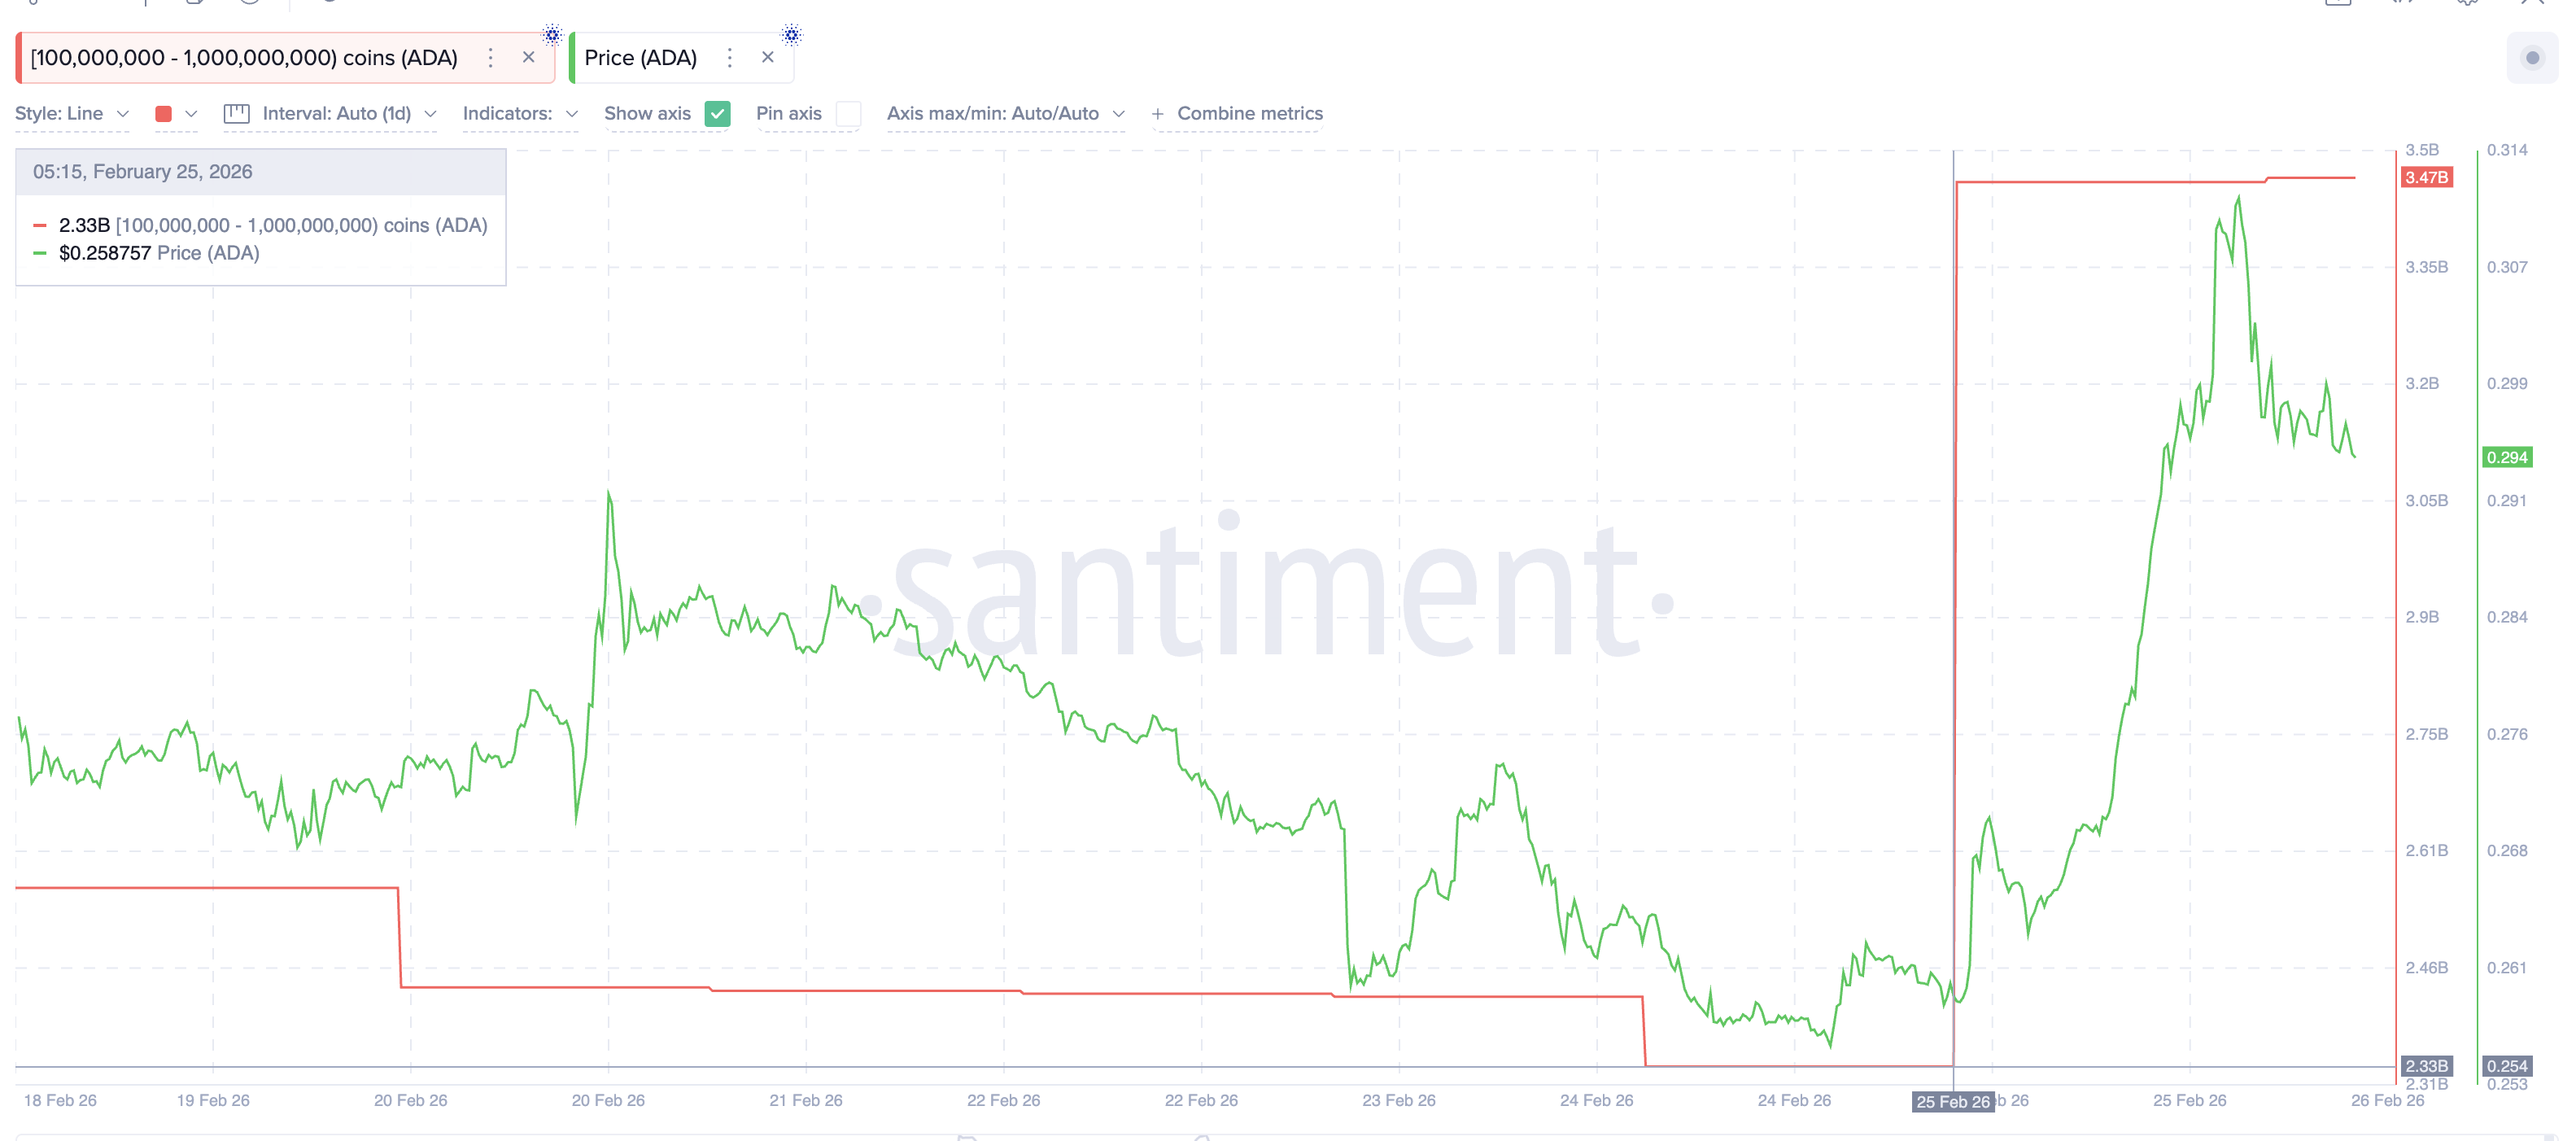
But this was only part of the picture. Other whale groups were selling heavily at the same time. The largest whales, holding over 1 billion ADA, reduced their holdings from 2.89 billion to 1.88 billion ADA. This equals 1.01 billion ADA sold, worth about $297 million.
Mid-size whales holding 10 million to 100 million ADA sold 70 million ADA, worth about $21 million. Smaller whales holding 1 million to 10 million ADA sold 3.41 billion ADA, worth about $1.0 billion.
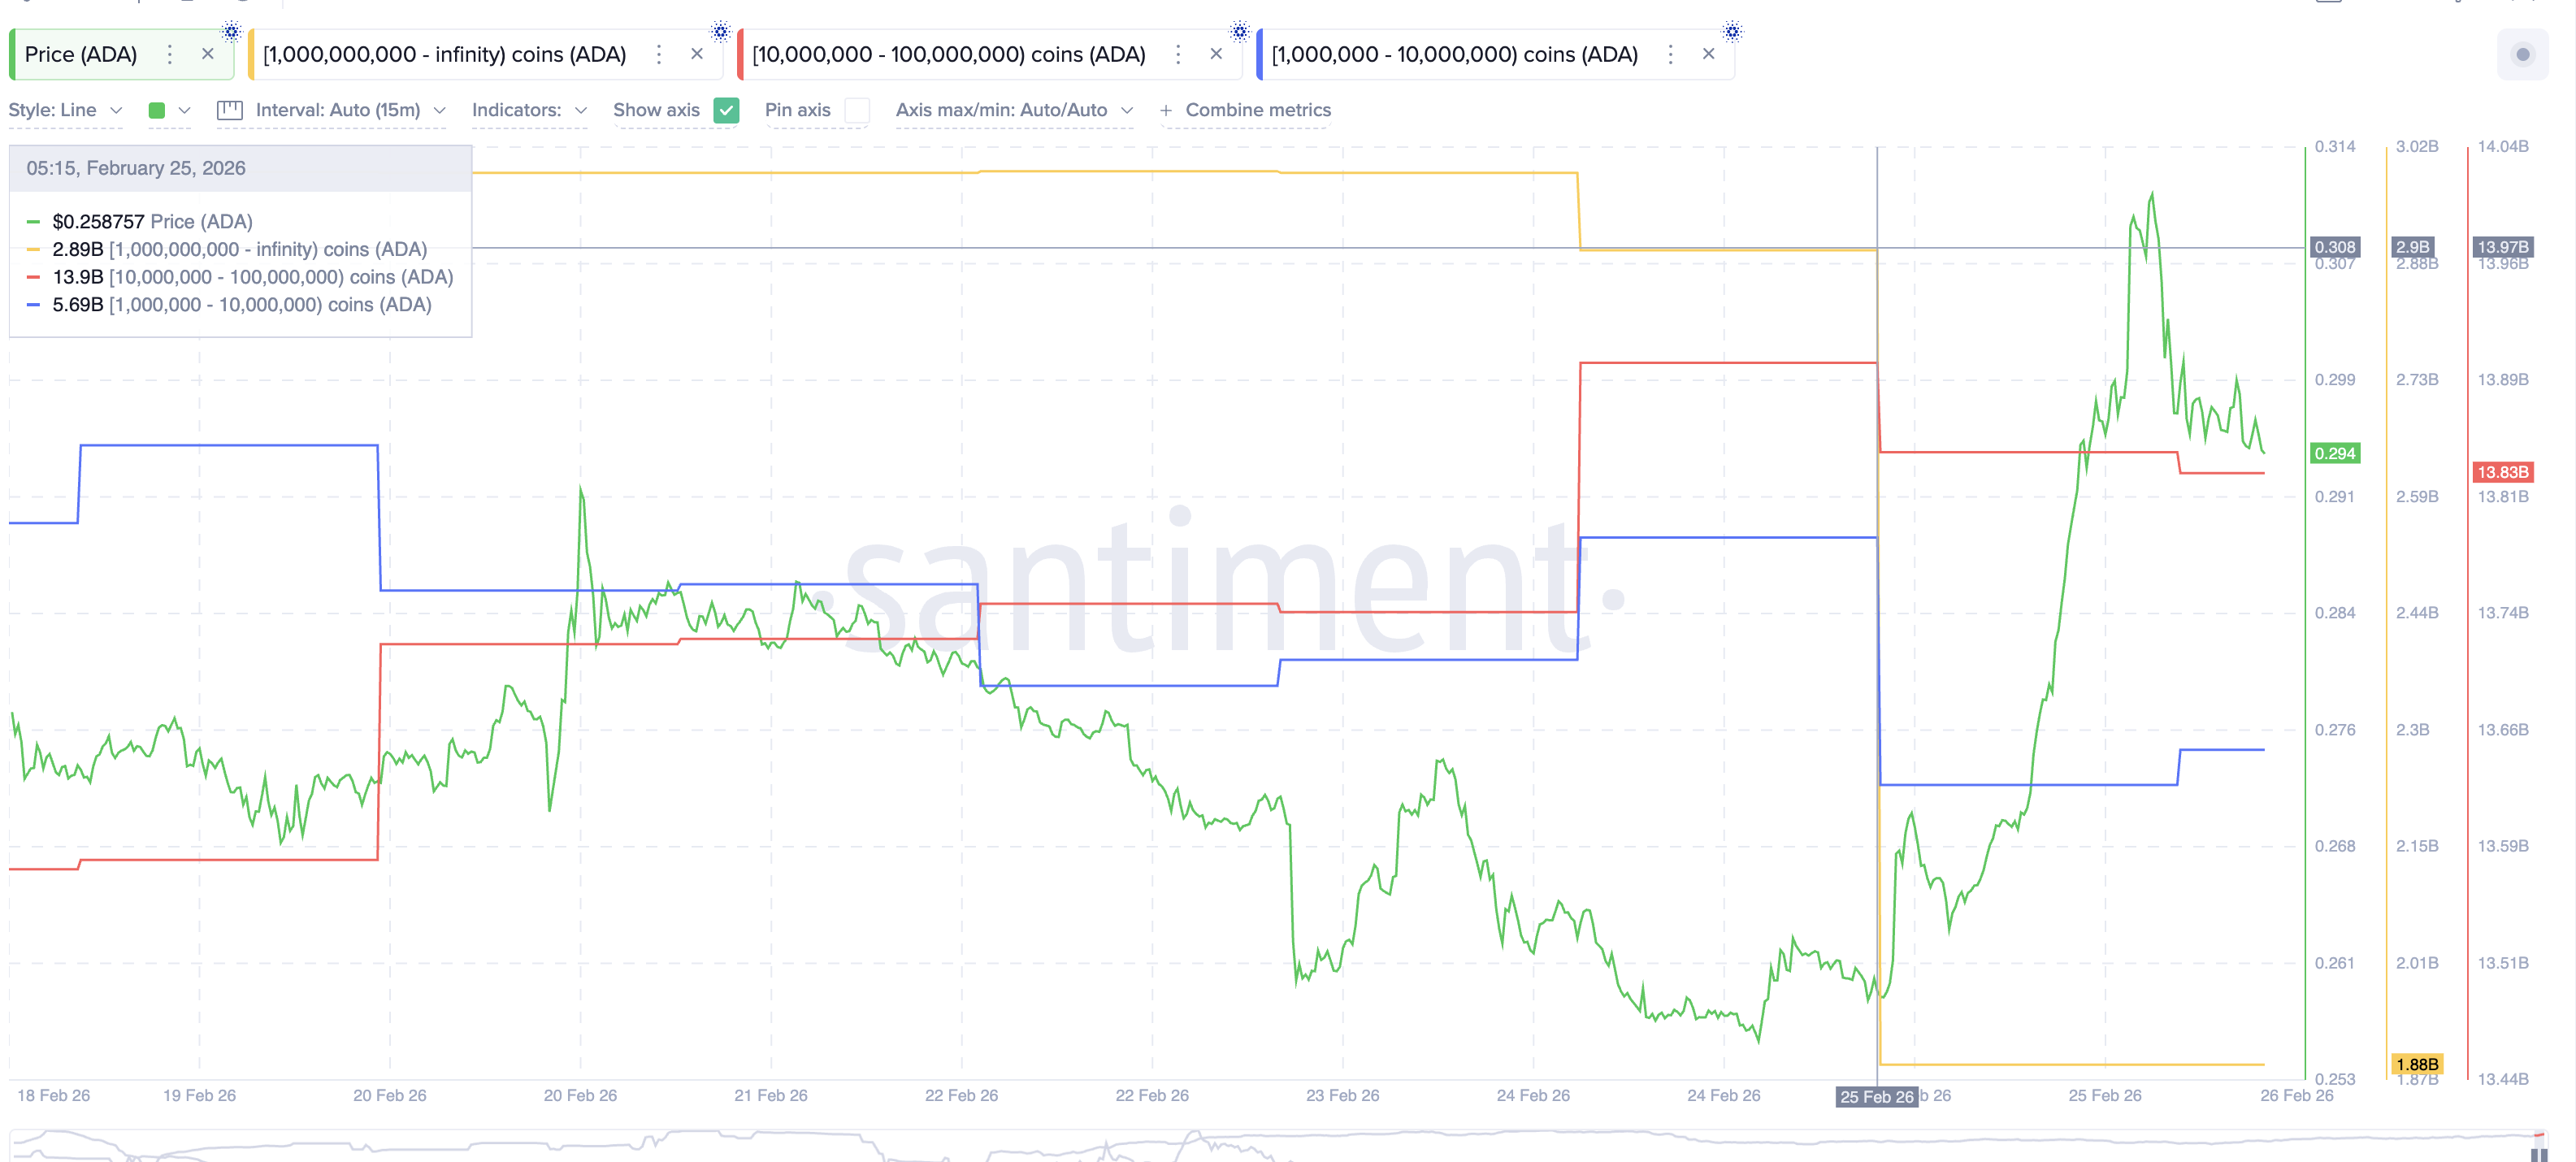
In total, selling reached about $1.32 billion. Compare this to the $340 million bought. That creates a net whale selling imbalance of roughly $980 million.
This explains the failure, including the long upper wick. The visible whale buying created optimism, but the larger, hidden whale selling completely overwhelmed it. This silent distribution blocked the breakout.
Derivatives Traders Took The Bait — Now Liquidation Risk Is Rising
Derivatives traders reacted exactly as expected. They saw a breakout forming, so they opened long positions expecting the rally to continue.
Liquidation data, on Binance alone, shows $11.40 million in long liquidations sitting below current price levels, while short liquidations are only $5.67 million. This means bullish traders are far more exposed to downside risk.
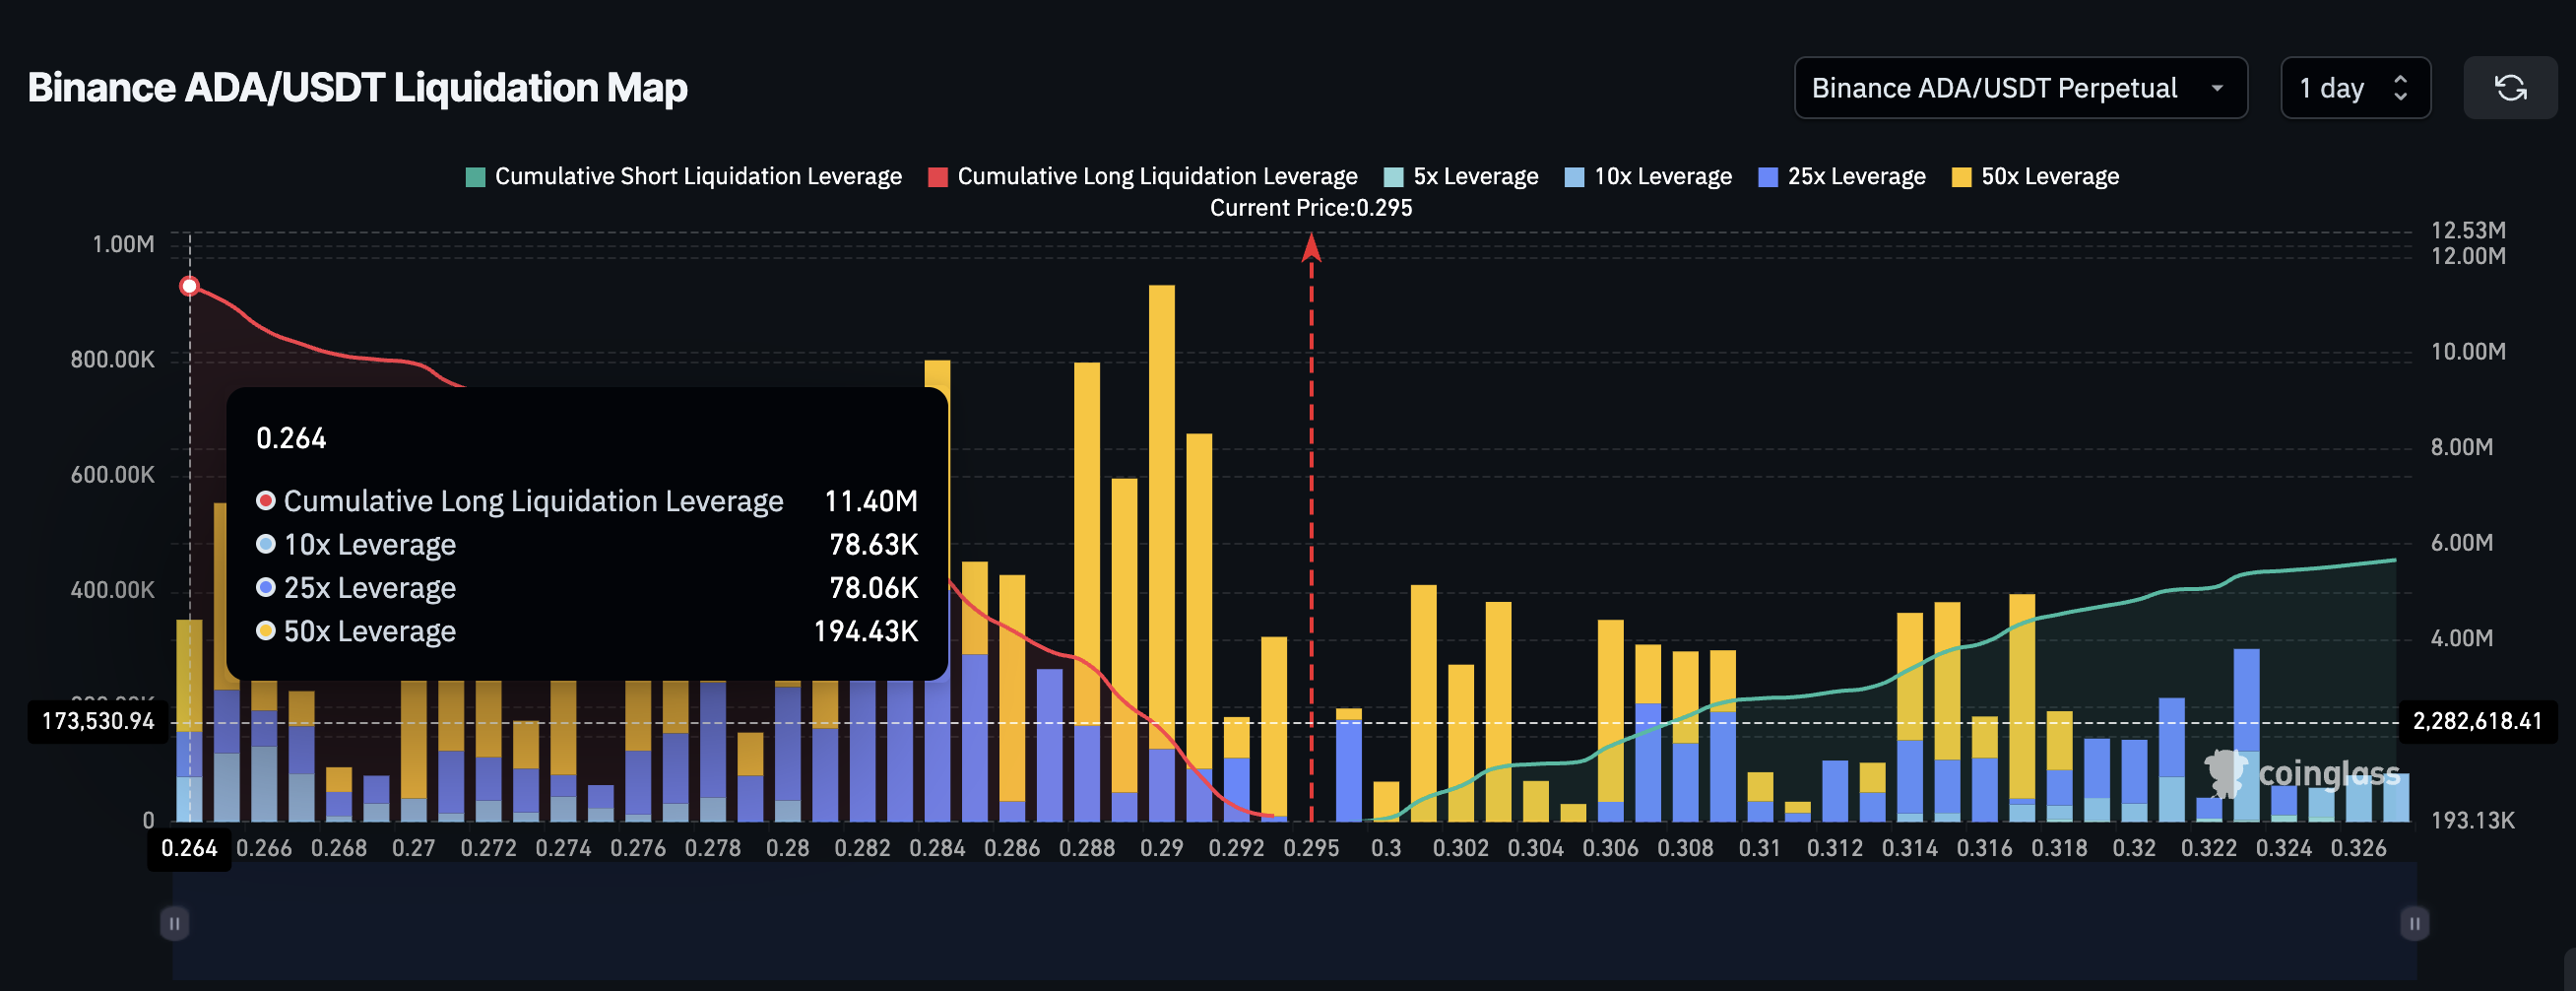
If the Cardano price falls, long positions will be forced to close. This creates a long squeeze. A long squeeze happens when falling prices force bullish traders to exit, and their forced selling pushes the price even lower. This is how failed breakouts often accelerate into deeper corrections.
Cardano Price Now Faces A Critical Breakdown Risk Toward $0.22
The ADA price structure now sits at a critical point. For the bullish breakout to remain valid, Cardano must reclaim and hold above $0.30. This would restart the path toward the $0.41 target.
But downside risks are growing. If Cardano falls below $0.27, the pullback strengthens. If it falls below $0.25, the bullish structure becomes invalid. This level is especially dangerous because it aligns with heavy, long liquidation exposure.
A break below $0.25 could trigger cascading liquidations, which could likely push the price toward $0.22, the full pattern breakdown possibility.
Right now, Cardano’s failed breakout (at press time) is not just a technical rejection. It is the result of nearly $1 billion in hidden whale selling. This imbalance is quietly turning into a high-probability breakout into a trap, and until buying fully outweighs selling, the recovery remains wishful.

Crypto Professionals Under Attack: How Fake Meeting Links Are Targeting the Digital Asset Industry
The cryptocurrency and Web3 ecosystem has always attracted innovation, opportunity and unfortunately increasingly sophisticated scams.
In recent months, a growing number of professionals working in digital assets, trading, venture capital and blockchain development have reported highly convincing social engineering attempts designed to compromise their devices and gain access to sensitive accounts.
Unlike traditional phishing emails filled with obvious mistakes, these new attacks are carefully constructed, patient and highly personalized.
They don’t look like scams.
They look like business opportunities.
The New Entry Point: Professional Meetings
One of the most concerning trends involves fake investor meetings arranged through legitimate platforms such as LinkedIn, Telegram or email introductions.
The approach often begins professionally:
-
a private investor or founder requests a meeting;
-
conversations appear structured and credible;
-
investment topics sound realistic;
-
scheduling tools such as Calendly are used to reinforce legitimacy.
Everything feels normal.
Until the meeting link arrives.
Instead of a standard Zoom or Google Meet invitation, victims receive a link disguised as a meeting room but hosted on a non-official domain designed to imitate legitimate services.
At first glance, the link may appear authentic.
In reality, it can lead to a fake login page or a malicious download designed to compromise the user’s device.
Why Crypto Professionals Are Being Targeted
Digital asset professionals represent an attractive target for attackers.
Many founders, traders and advisors operate:
Gaining access to a single compromised browser session can expose far more than a traditional account breach.
Attackers are not necessarily looking for passwords.
They are looking for active sessions.
Once malware is executed, certain tools can extract stored browser cookies, authentication tokens and locally saved data.
This allows attackers to bypass passwords entirely.
In some reported cases, compromised devices enabled access to email accounts, messaging apps and crypto wallets without victims realizing what happened until assets had already been moved.
Social Engineering Over Technical Hacking
The most dangerous aspect of these attacks is psychological rather than technical.
Scammers often invest significant time building trust.
They may:
-
speak fluent English;
-
present realistic professional backgrounds;
-
introduce additional “consultants” into meetings;
-
discuss portfolio management or partnership opportunities.
The goal is simple.
Lower defenses.
When security concerns are raised, a common warning sign appears.
Instead of accommodating reasonable requests such as using an official meeting platform or a different link, attackers may insist on joining through their specific invitation.
Pressure replaces flexibility.
That is often the moment professionals realize something is wrong.
The Fake Software Trap
Some fraudulent meeting links redirect users toward downloading software disguised as:
In reality, these downloads may contain infostealer malware or remote access tools.
Even experienced professionals have fallen victim to this method because everything leading up to the moment appeared legitimate.
Once executed, malicious software may search for:
The consequences can be immediate.
The Second Scam: “Recovery Experts”
Unfortunately, the risks do not end after an incident.
A second wave of scammers often targets victims who publicly report losses online.
These individuals claim they can recover stolen funds or trace blockchain transactions for a fee.
In most cases, they are simply another scam.
Blockchain transactions are generally irreversible.
Promises of guaranteed recovery should always be treated with extreme skepticism.
How to Protect Yourself
Simple habits dramatically reduce risk.
Professionals should consider the following precautions:
Only join meetings through official domains.
Platforms such as Zoom or Google Meet use verified domains. If a link looks unusual, verify before joining.
Avoid downloading software to attend a meeting.
Legitimate conferencing platforms rarely require additional downloads beyond official applications.
Use your own meeting rooms when possible.
If uncertainty exists, offer to host the meeting yourself.
Separate crypto activity from daily browsing.
Dedicated devices or browser profiles for wallet access can reduce exposure.
Enable strong account protection.
Two-factor authentication and hardware security keys significantly improve account safety.
Awareness Is the Strongest Defense
Social engineering attacks continue to evolve alongside the growth of the digital asset industry.
Many professionals assume technical expertise alone protects them.
In reality, most successful compromises begin with trust rather than code.
Recently, our editorial team encountered a similar attempt involving a professional meeting setup that appeared entirely legitimate until a suspicious meeting link was introduced at the last moment.
Fortunately, the situation was identified before any interaction occurred.
Others may not be as lucky.
As conferences, partnerships and investment conversations increase across the Web3 ecosystem, remaining cautious without becoming paranoid is essential.
Opportunities exist everywhere in crypto.
So do traps.
Taking a few extra seconds to verify a meeting invitation may ultimately protect far more than a calendar slot.

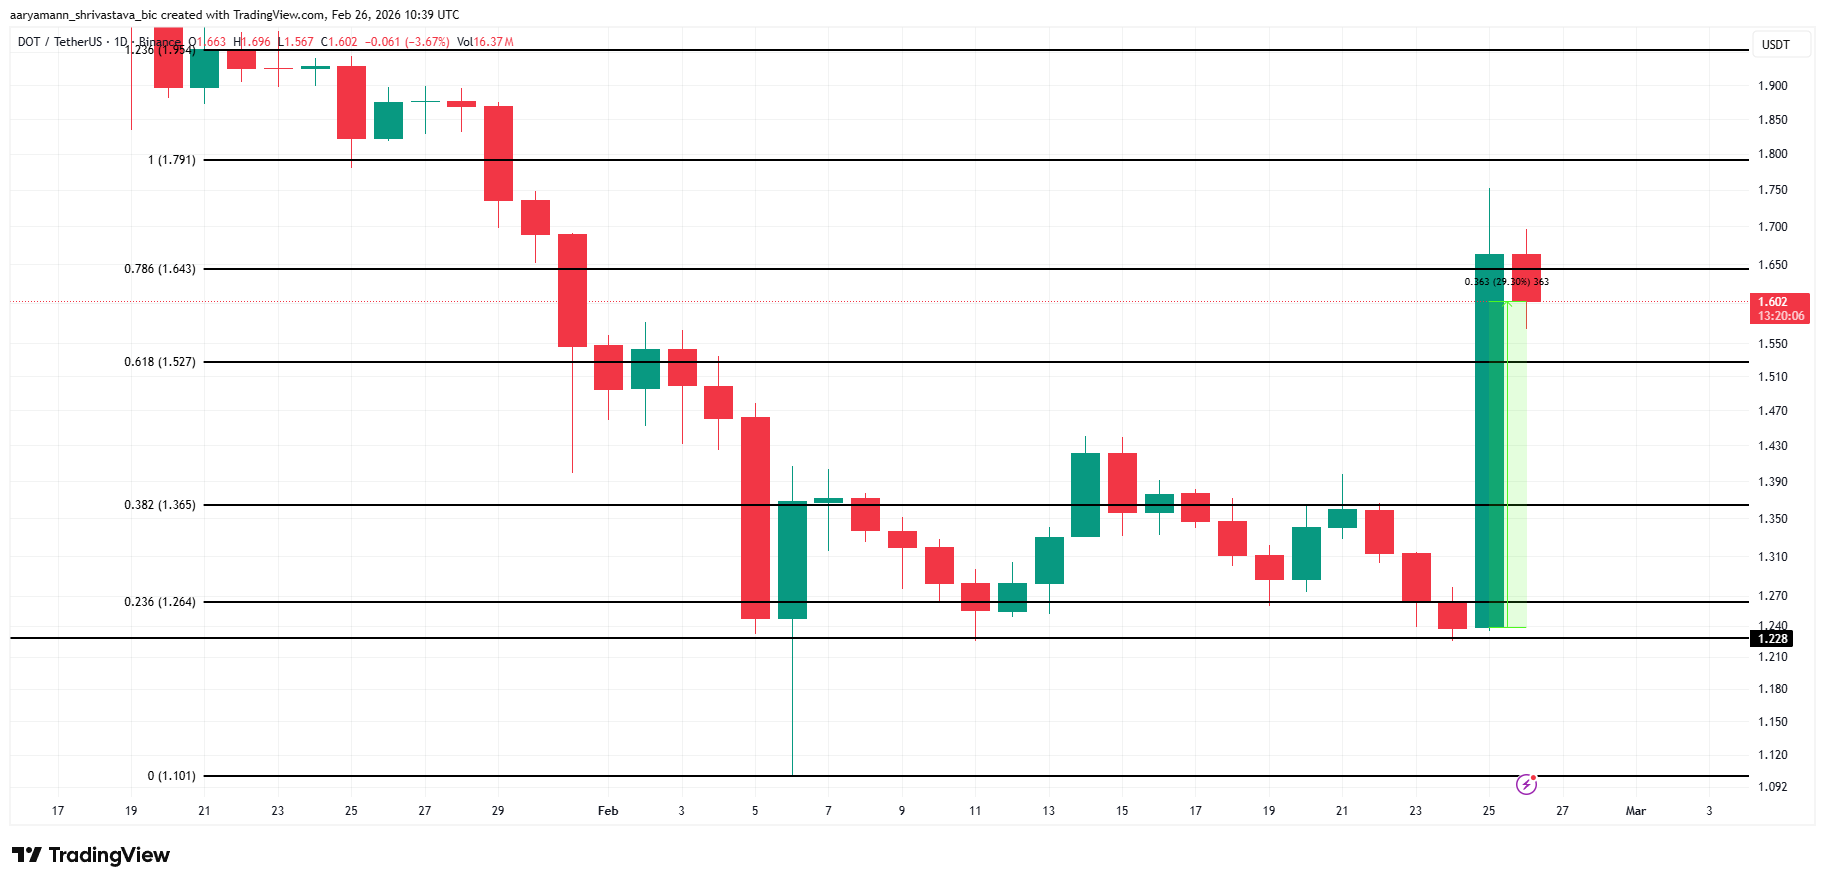
Polkadot price surged nearly 30% in the past 24 hours, erasing almost a month of losses. The sharp rally surprised traders who expected Bitcoin to lead the move.
However, this time the crypto king played a limited role in DOT’s breakout. While Bitcoin remains a benchmark asset, Polkadot appears to be decoupling from its direct influence.
Polkadot Finds Investors’ Support
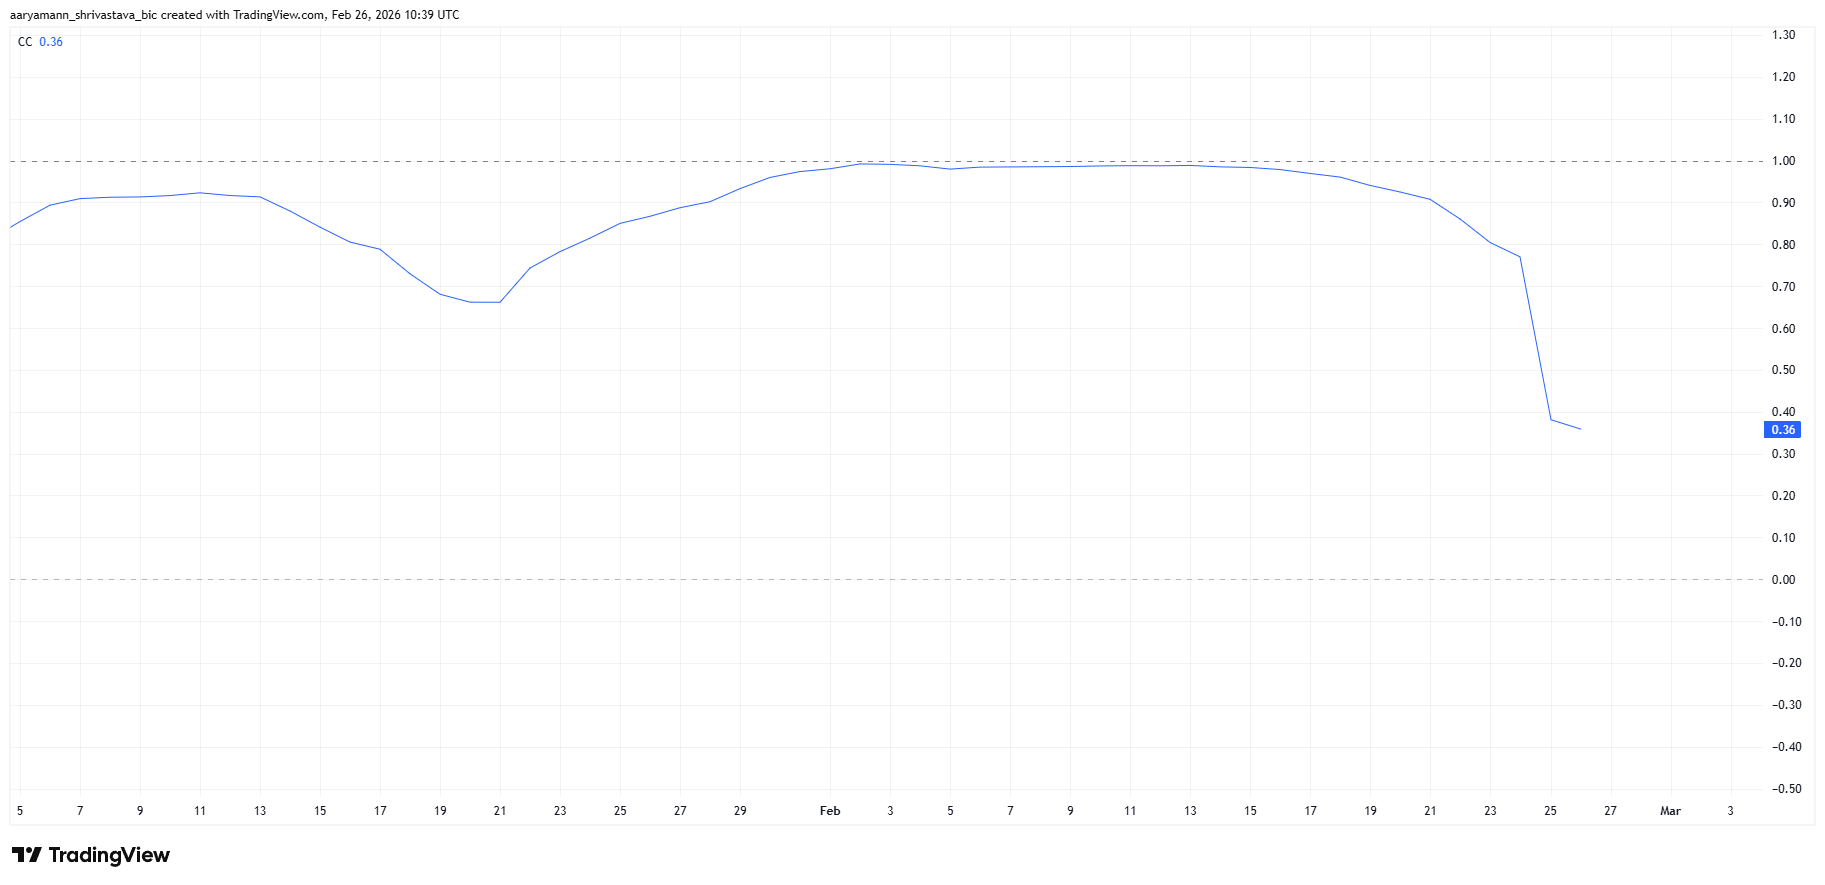
Polkadot’s correlation with Bitcoin has declined in recent weeks. The metric currently stands at 0.36, signaling a weaker relationship between the two assets. Lower correlation suggests DOT is increasingly driven by internal factors rather than broader BTC price swings.
Decoupling can benefit altcoins during periods of Bitcoin consolidation. Reduced dependence allows Polkadot to respond to its own liquidity and demand trends. This structural shift indicates that DOT may be charting an independent recovery path.
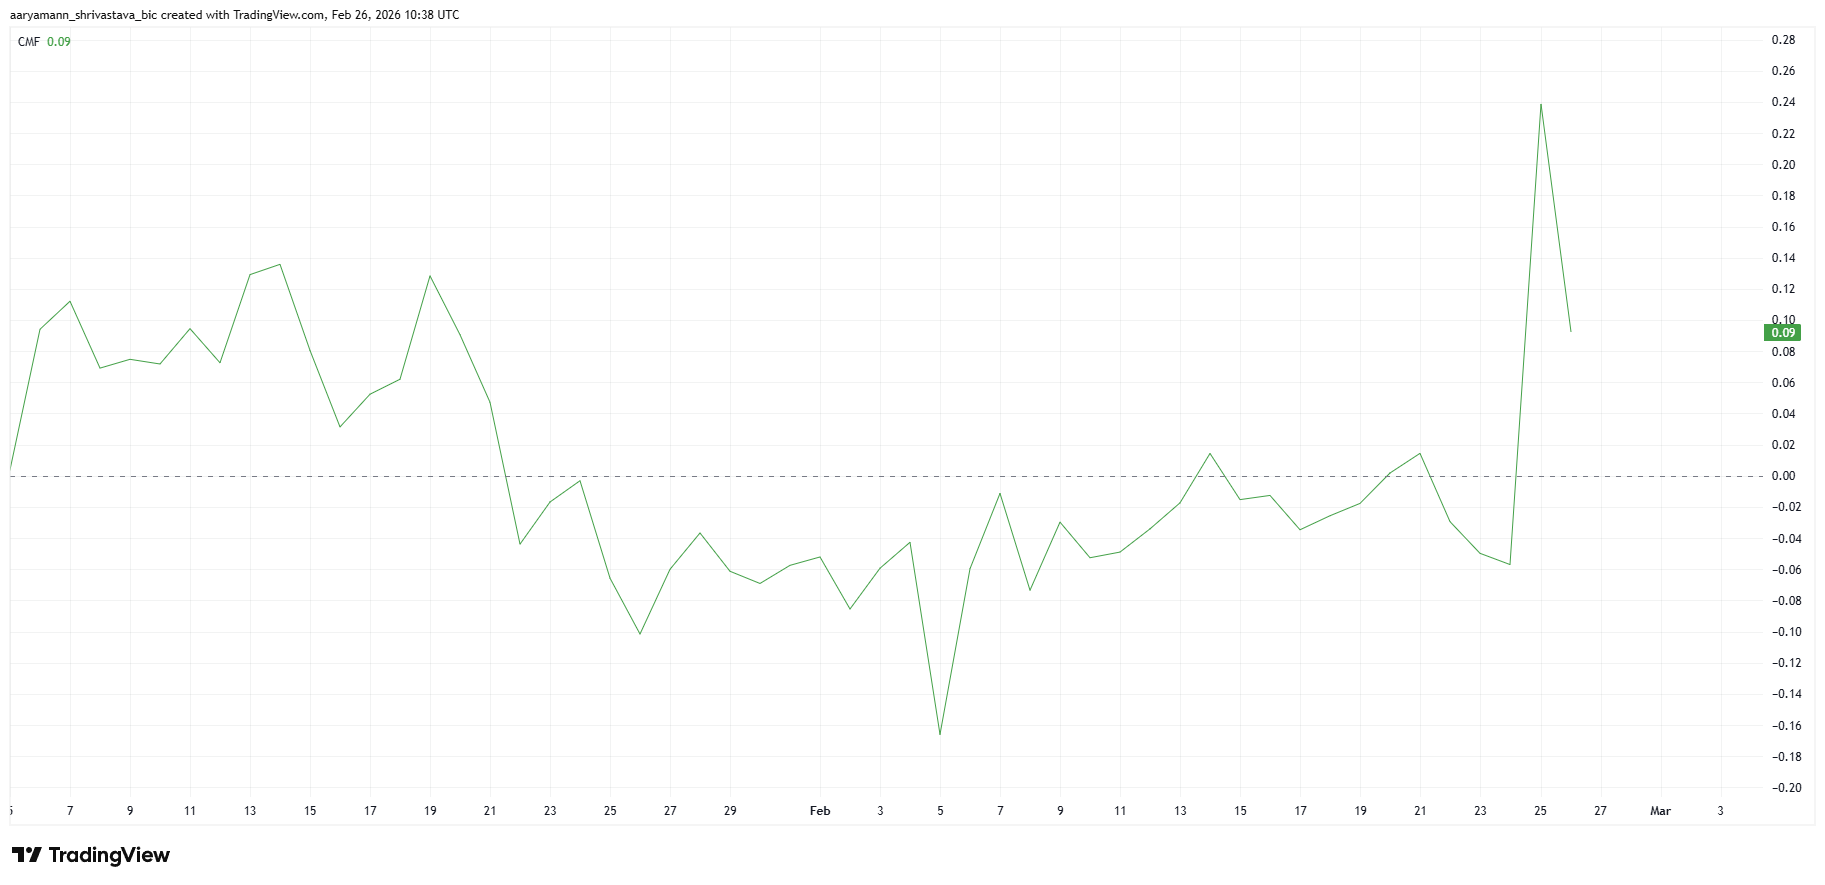
The Chaikin Money Flow indicator supports this interpretation. CMF recorded a sharp uptick during the rally, confirming strong capital inflows into Polkadot. Rising CMF values typically reflect increased buying pressure from larger market participants.
Strong inflows suggest that large holders may have contributed to the price spike. CMF often captures institutional or whale-driven accumulation patterns. Sustained positive readings would reinforce the case for continued upside momentum in DOT price action.
DOT Price Has a Ceiling For Now
Polkadot price is trading at $1.60 at the time of writing after a near 30% rally. The altcoin briefly tested the $1.70 level but failed to secure $1.64 as confirmed support. This hesitation highlights emerging resistance near current highs.
The liquidation heatmap reveals a significant cluster of short positions near $1.70. Approximately $1.30 million in short liquidations are concentrated at this level. A decisive breakout could trigger total short liquidations worth $3.04 million. Such forced buying may accelerate price gains.
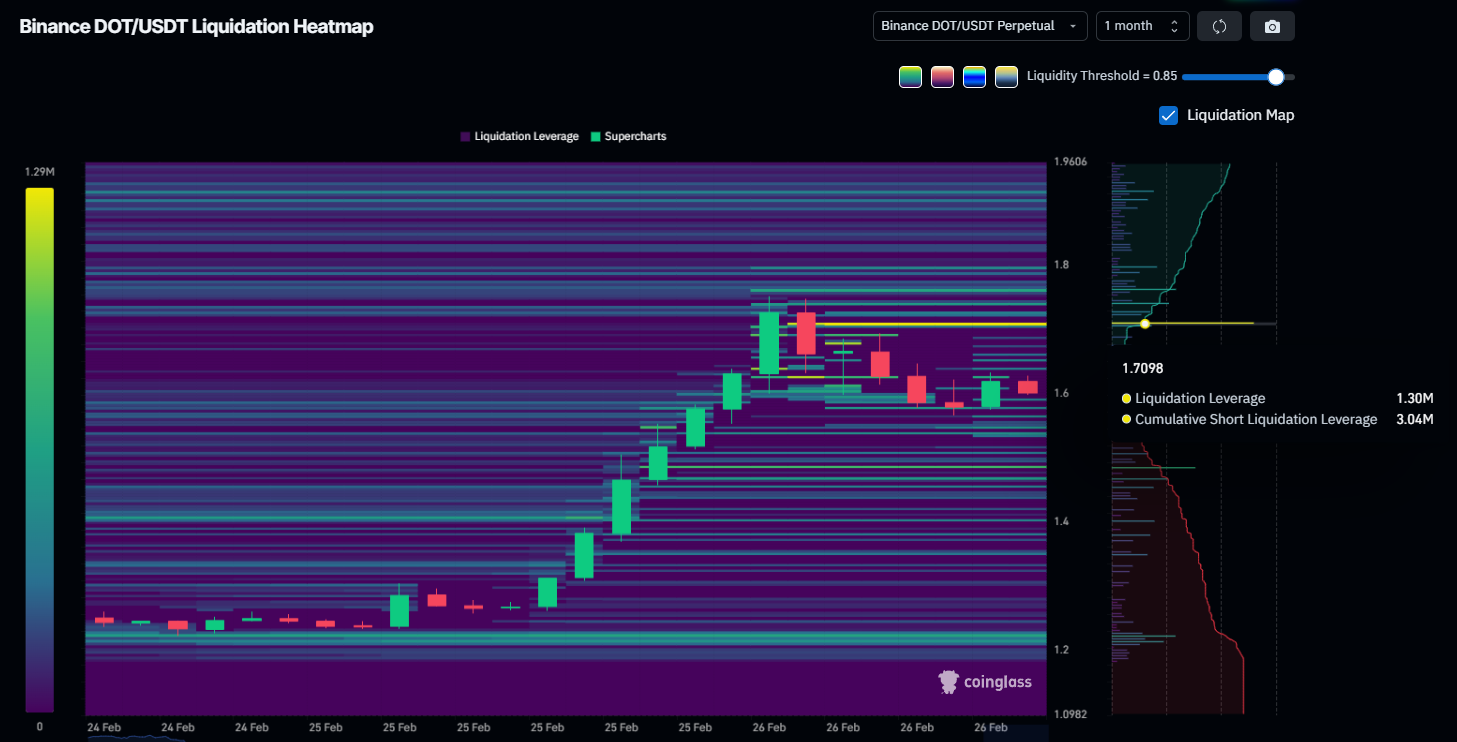
If bullish momentum persists, DOT could extend toward $1.79 in the near term. However, upside depends on sustained capital inflows. Should buying pressure fade, DOT may retest the $1.52 support, aligned with the 61.8% Fibonacci level. Losing that bull market support floor would invalidate the short-term bullish thesis.

Ethereum price is trying to steady itself after a rough February, but the bigger question is whether this bounce has enough strength to push through the $2,500 ceiling.
Summary
- Ethereum has bounced above $2,000 after a sharp February drop but remains in a broader downtrend and well below the key $2,500 resistance.
- Funding rates on Binance have turned positive, easing short-term downside pressure, though high volatility suggests a bigger move is coming.
- To reclaim $2,500, ETH must hold $2,000 support and break above $2,200 with strong momentum
At press time, ETH was trading near $2,050, up about 3% over the past 24 hours. The move extends a week-long rebound of roughly 9%. Even so, the token is still down 30% over the past month and sits nearly 58% below its August 2025 peak of $4,946.
February started with Ethereum (ETH) trading between $2,200 and $2,400 before sellers took control mid-month. The slide accelerated around Feb. 24–25, when the price dipped toward $1,800. Since then, buyers have stepped back in, lifting the price back above the $2,000 mark.
Volatility spikes to highest level since March 2025
Derivative data shows a notable shift in positioning. According to a Feb. 26 analysis by CryptoQuant analyst PelinayPA, funding rates had remained positive for an extended period earlier this year, indicating that long traders were paying shorts.
Despite that optimism, the price failed to build a consistent rally. More recently, when short positions grew and the price faced pressure, funding went sharply negative.
Binance, which has the biggest share of global derivatives liquidity, often sets the tone during liquidation waves. The short- to mid-term trajectory of Ethereum is often affected by changes in Binance funding.
Funding has now flipped back to positive. This indicates that there is less immediate downside pressure now that many short positions have been cleared. Positive funding, however, does not prove a long-term recovery. The market could experience a long squeeze if it rises too quickly.
In a separate report, analyst Arab Chain revealed that Ethereum’s 30-day realized volatility on Binance has climbed to roughly 0.97, its highest level since March 2025.
Such high volatility often precedes a significant directional move, but if buying and selling pressure is evenly distributed, it can also occur during a prolonged period of sideways trading.
Ethereum price technical analysis
From a chart perspective, ETH is still in a clear daily downtrend, marked by lower highs and lower lows. Price recently bounced after touching the lower Bollinger Band near the $1,850–$1,900 zone. It now trades around $2,050, below key resistance areas.
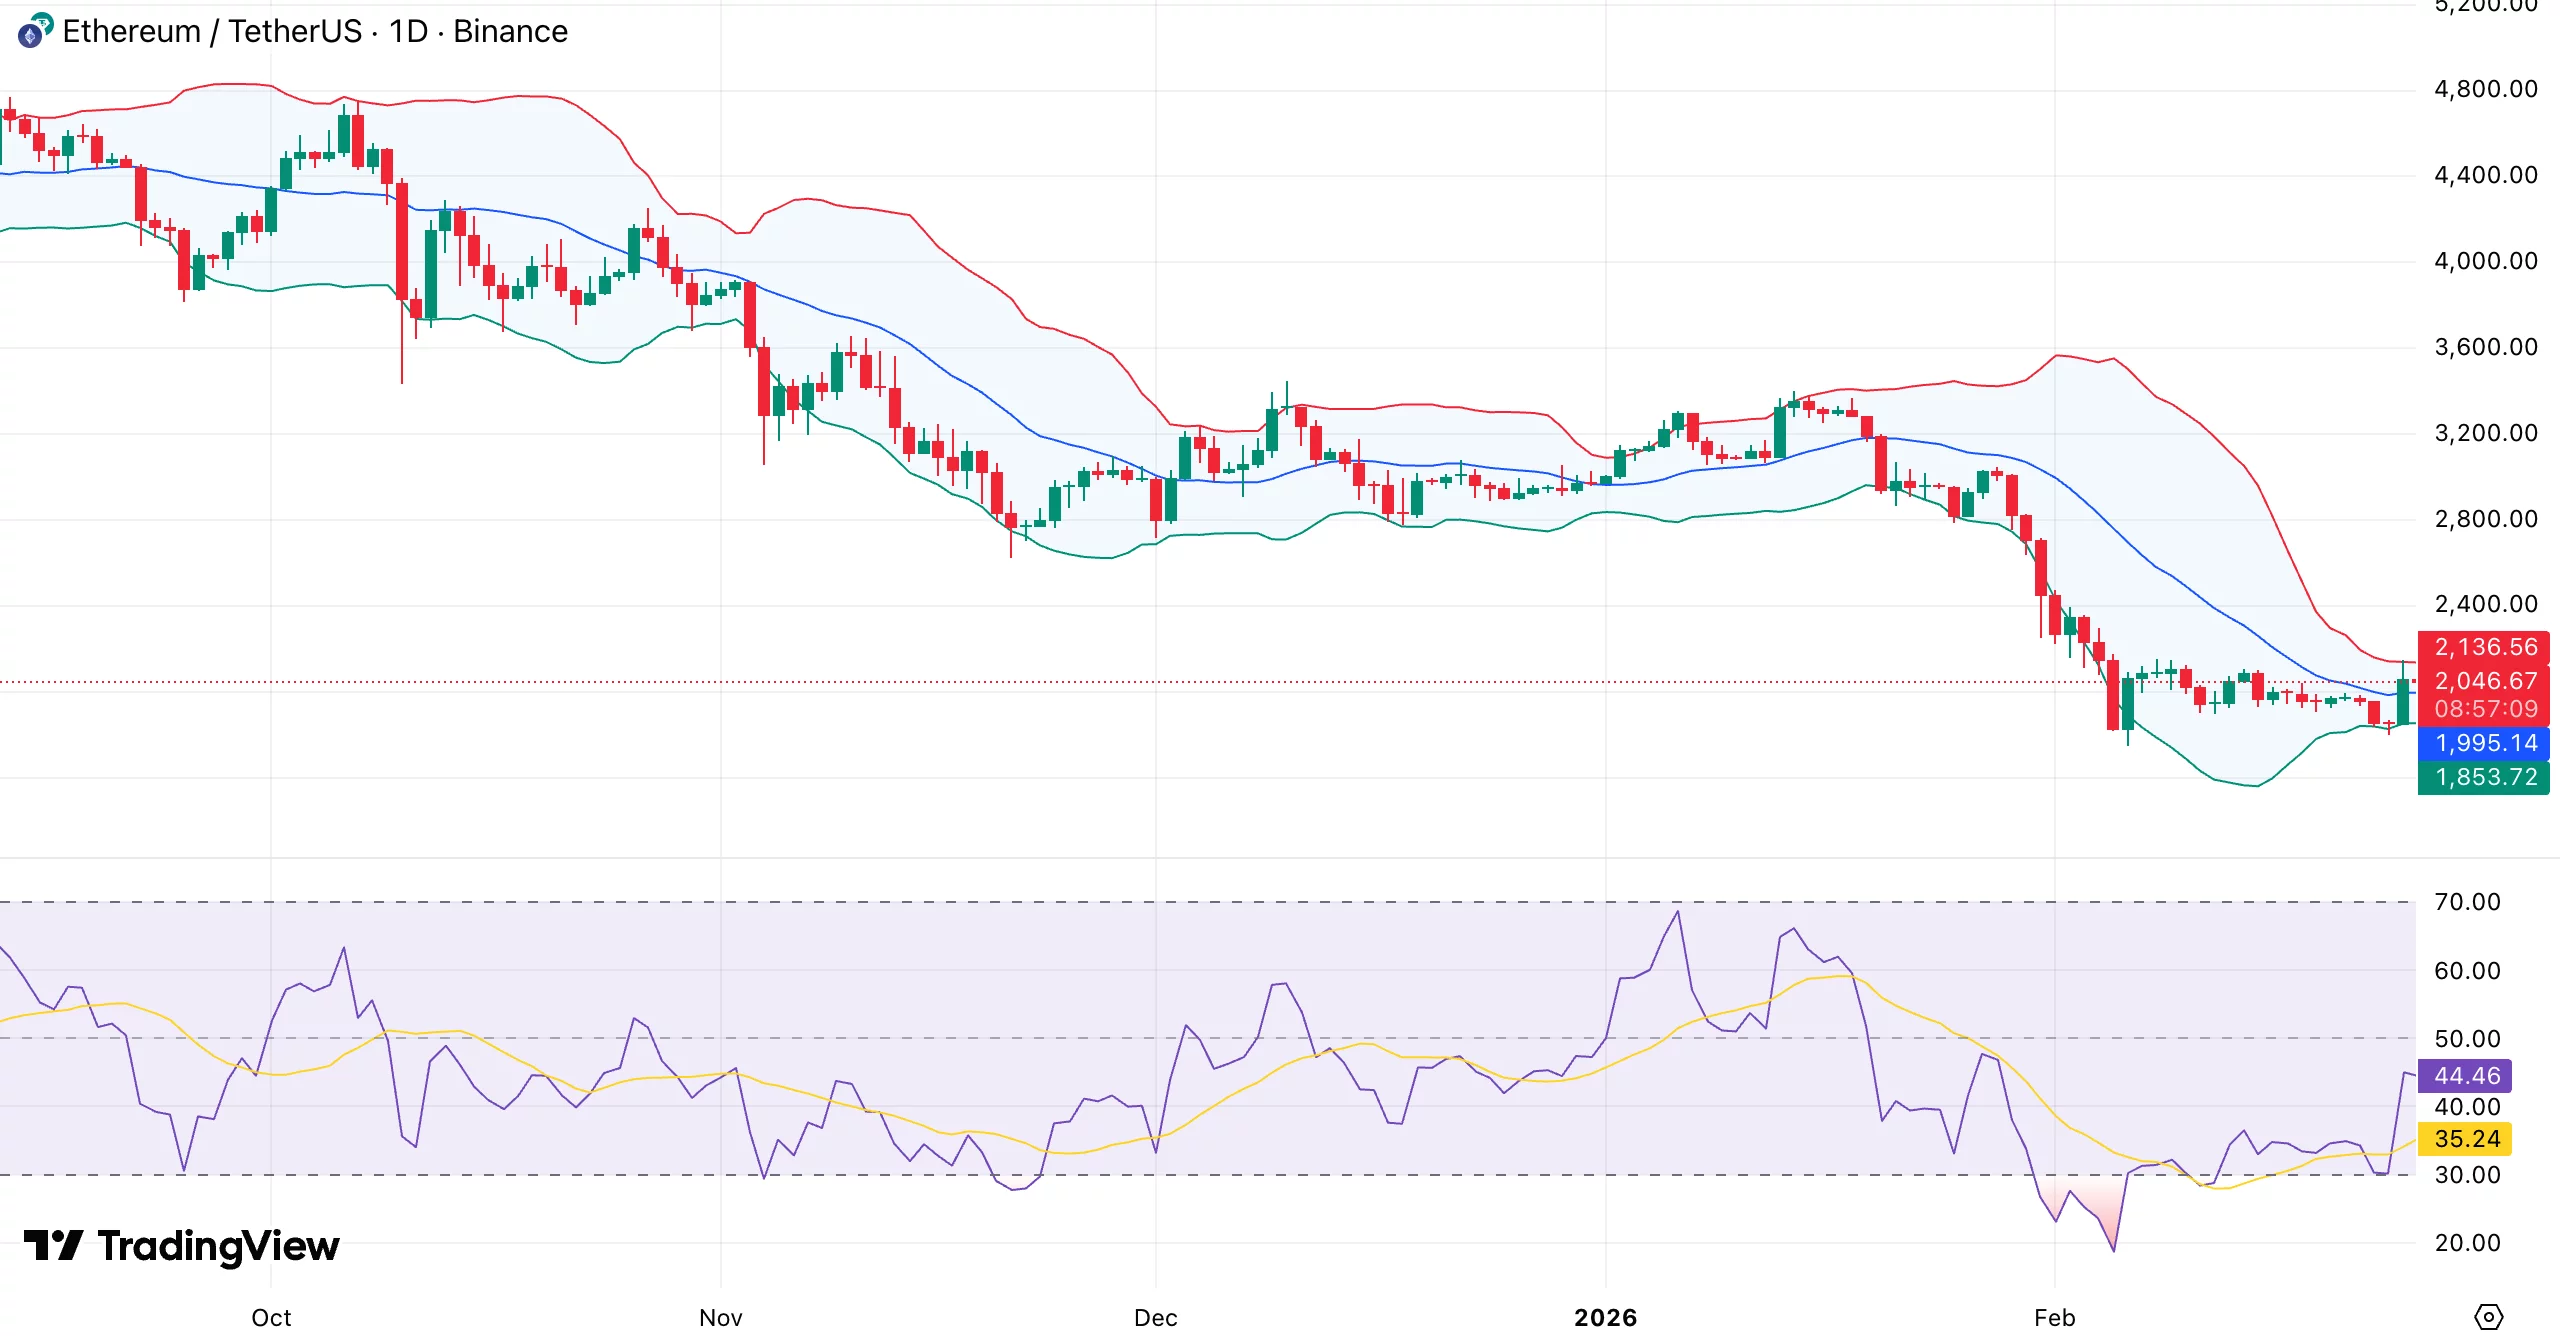
Immediate support sits near $2,000, followed by the recent low between $1,850 and $1,900. On the upside, supply is clustered around $2,130–$2,150, then $2,300–$2,350.
Because it corresponds with a previous breakdown area and has psychological weight, the $2,500 level continues to be the primary structural barrier.
Momentum is improving but not yet decisive. Following a recovery from oversold conditions, the relative strength index is close to 44.
A sustained move above 50 would strengthen the case for a shift in momentum. Bollinger Bands are starting to narrow after widening during the selloff, suggesting a possible attempt at a breakout.
For Ethereum to recover $2,500, it must clear the $2,200 area with substantial volume and maintain above $2,000 to form a higher low. The current move might turn out to be a relief bounce inside a bigger downward structure if there is no follow-through.

- Dogecoin price hovers near $0.10 amid fresh rejection above this level.
- Open interest has dropped below $1 billion.
- DOGE could drop to $0.08 if weakness intensifies.
Dogecoin’s latest price rally has hit a snag, with the meme coin slipping back under the key $0.10 threshold amid fading momentum in the meme coin sector.
On Thursday, February 26, 2026, DOGE hovered around $0.1004, clinging to modest daily gains after a volatile week that saw it dip as low as $0.0914 the previous day.
This retreat highlights persistent challenges for the meme-themed cryptocurrencies, once buoyed by celebrity endorsements but now grappling with broader market headwinds and technical barriers.
DOGE price retested highs above $0.10
Dogecoin briefly surged past $0.10 on Wednesday, fueled by a sharp rebound for Bitcoin and top altcoins.
Traders eyed momentum above the psychological level as a potential springboard for renewed interest, especially after DOGE touched $0.11 on February 25 before retreating.
However, the uptick proved short-lived, with selling pressure mounting as the token failed to sustain gains, retreating amid thinner trading volumes and scepticism over long-term catalysts.
A unique angle here is the role of retail investor fatigue.
On-chain metrics show smaller holders distributing positions after the spike, wary of the slide seen following Dogecoin price rallying to its peak in 2025.
CoinGlass data shows that open interest in Dogecoin futures has dropped to under $1 billion.
The dip has been progressive since the peak of over $5 billion in September 2025.
This shift highlights how community-driven hype, Dogecoin’s hallmark, is waning as macro factors overshadow viral buzz.
Dogecoin price analysis
Dogecoin is trading near $0.098 as of writing on Thursday, preserving about 4% of the advance from the prior session.
The slight dip from intraday highs aligns with the rejection at the upper boundary of a falling channel.
Dogecoin has also traded lower amid falling 50-day and 100-day SMAs.
Bulls, therefore, face the $0.10 and the SMA barriers as immediate resistance levels.

The daily MACD has climbed following a signal line rebound earlier in the week, pointing to budding bullish energy.
Buyers are also unwavering as RSI lingers near the 50 mark, hinting at neutral sentiment.
This means fresh gains could follow if buyers retake control.
Yet, a close below $0.10 could revive selling, targeting the February lows of $0.08 and exposing deeper corrections.
From a distinctive perspective, Dogecoin’s stall mirrors a “meme exhaustion pattern” seen in past cycles.
After quick pops, prices have often quickly pared gains.
With year-to-date declines persisting and Bitcoin’s surge also stalling, DOGE bulls need a decisive breakout to shift momentum.


The era of speculative mania is transitioning into the era of the automated on-chain economy, according to Animoca Brands co-founder Yat Siu.
In an interview with Korea Times, Siu declared this week that AI agents and blockchain will work in tandem behind the scenes while we get on with our lives, positing fascinating and ubiquitous use cases for blockchain that few talk about.
Siu argued that the convergence of artificial intelligence and blockchain infrastructure has reached a tipping point. The friction of gas fees, private keys, and complex bridging is about to disappear behind a layer of autonomous software.
The implication is that we will soon all be using AI and blockchain without knowing it.
Key Takeaways
- AI as the New Power User: Yat Siu posits that AI agents will replace humans as the primary on-chain executors, managing transactions and wallet security autonomously.
- The End of Complexity: By abstracting away seed phrases and gas fees, AI Agents remove the technical barriers currently preventing mainstream adoption.
- 2026 Inflection Point: Animoca forecasts a ‘Year of Utility’ where valuation models shift from speculation to functional usage within the Open Metaverse.
Yat Siu Believes This Year is Vital
Siu’s thesis is blunt: the speculative cycle is losing steam in favor of infrastructure that actually works.
While the market has fixated on price action, builders have been quietly integrating AI to handle the heavy lifting. Siu suggests that cryptocurrency/blockchain is a “natural foundation” for AI agents, as these autonomous digital entities require a permissionless, borderless medium of exchange.
Ultimately, Siu’s argument is that legacy banking is too slow and gated for AI; blockchain is the only rail fast enough for machine commerce.
“Tokenize or die” has been a rallying cry for Animoca, and the firm believes that businesses failing to adopt these Web3 standards will face the same obsolescence as pre-internet retailers.
Discover: The next crypto to explode
Agents Are Solving the UX Nightmare: Yat Siu
For years, blockchain usability has been the industry’s Achilles’ heel. Users are expected to manage alphanumeric strings, approve complex smart contracts, and understand gas topology. Siu argues that human users should never have to touch these layers.
In his vision, AI Agents act as the intermediaries. A user expresses an intent (“buy this asset” or “enter this game”), and the agent executes the necessary chain of transactions.
There are massive risks ahead, however. Recently, an AI crypto agent made a six-figure error that the market ironically rewarded, demonstrating that while the tech is nascent, the autonomy is real and needs careful guardrails.
In spite of the risks, AI integration with blockchain is critical for maintaining a scalable and useful abstraction layer. If digital property rights are to scale to billions of users, the management of those rights must be automated.
Animoca’s portfolio, which spans over 600 Web3 investments, including its own property, the metaverse game The Sandbox, is positioning itself for this automated future where digital assets are the cogs actively turning the wheels of the financial infrastructure.
Why is 2026 Pivotal to Onboarding The Next Billion Users?
Why is 2026 the specific target for this breakout? The timeline correlates with maturing infrastructure and potential regulatory clarity.
Siu has pointed to the potential progression of legislation like the U.S. CLARITY Act as a trigger for mass corporate tokenization. Institutional capital requires legal certainty, and autonomous agents require robust, finality-focused blockchains.
This infrastructure is visibly growing on chain. Ethereum developers are currently locking in upgrades like FOCIL to secure the consensus layer for higher throughput. These technical improvements are the bedrock required to support millions of AI agents transacting simultaneously without clogging the network.
If the regulatory landscape in the U.S. and Asia, particularly with Japan’s crypto master plan and Hong Kong’s Web3 push, aligns with this technical maturity, 2026 becomes a plausible window for mass utility.
Animoca’s potential plans for a public listing in Hong Kong or the Middle East further underscore their confidence in this timeline.
The question is no longer whether AI agents can navigate the blockchain. The technology exists. The question is whether the regulatory and liquidity layers can stabilize fast enough to support them by 2026.
Discover: The best meme coins on Solana
The post Animoca’s Yat Siu Says AI Agents Will Make 2026 the ‘Year of Utility’ appeared first on Cryptonews.
Uniswap price targets $4.55 prior breakdown level as traders position ahead of a governance vote that could expand fee burns and boost protocol revenue.
Summary
- UNI is holding $3.80 support after an 18% weekly rebound.
- A governance proposal could raise annual revenue to $61M through expanded fee burns.
- A breakout above $4.20 could open room toward the $4.55–$4.60 zone.
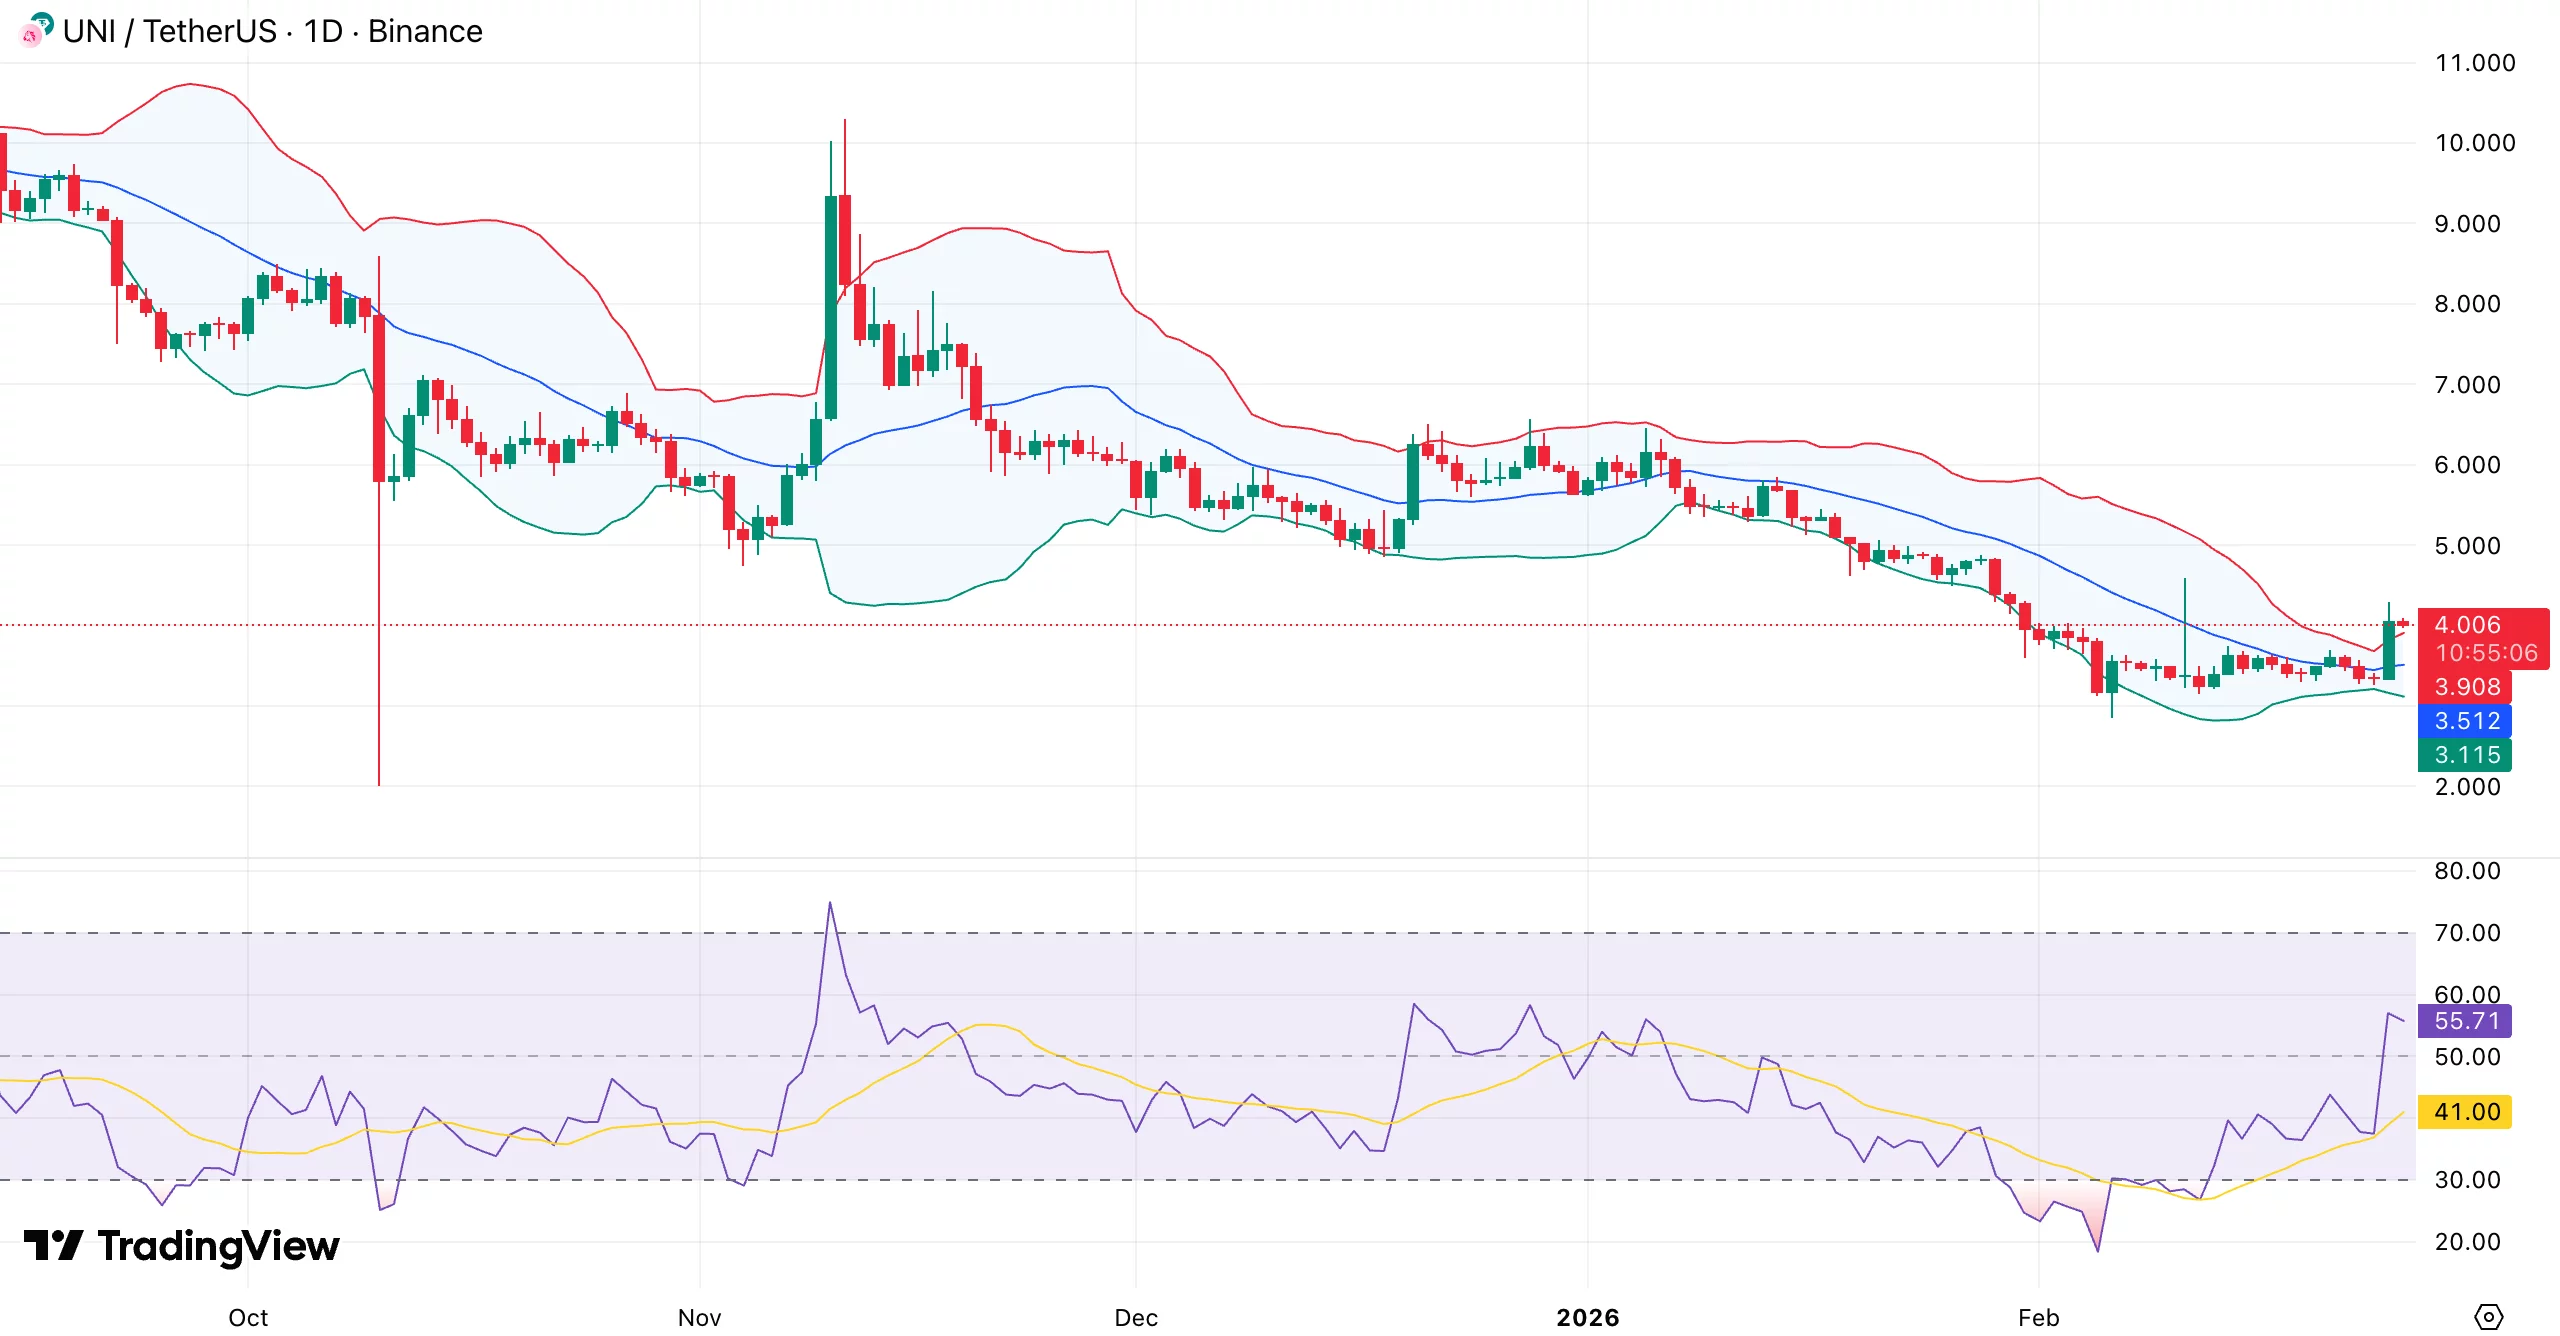
Uniswap (UNI) traded at $4.02 at press time, up about 10% in the past 24 hours. The token is trading near the top of its weekly range between $3.29 and $4.12.
UNI has gained 18% over the past week, showing a firm bounce from recent lows, though it is still 15% lower over the past month.
Spot trading volume jumped to $554 million, up 119% in one day. CoinGlass data shows futures volume climbing nearly 80% to $640.5 million, while open interest rose 15.2% to $285.6 million.
When both volume and open interest rise together, it usually means new positions are being opened rather than just shorts closing.
Fee switch expansion adds direct value to UNI
Uniswap governance is advancing a proposal to widen its fee switch system. It follows the 2025 UNIfication rollout, which began charging protocol fees on Ethereum and introduced UNI token burns.
Under the new proposal, protocol fees would also be applied across eight additional Layer 2 networks, including Arbitrum, Base, and Optimism. The plan would automate fee collection and send the proceeds back to Ethereum mainnet, where they would be used to buy and burn UNI tokens.
If approved, the expansion could lift annualized protocol revenue to about $61 million, up from $34 million. Part of swap fees would shift from liquidity providers to the treasury, directly linking trading activity to token supply reduction.
That dynamic tends to attract long-term holders because it means usage will translate into measurable value capture. Voting is split into two phases, with the first already live and the second scheduled between Feb. 27 and March 1.
Technical outlook: $4.60 in play if breakout holds
UNI has built a clear base around $3.70–$3.80. Price has held that zone multiple times, and recent candles show buyers stepping in on dips. With Bollinger Bands tightening, the market may be gearing up for a sharp move.

Momentum has improved, with relative strength index pushing back above the midline. Price is also testing a descending trendline from December highs and pressing against short-term moving averages.
Volatility had tightened during consolidation, and the recent expansion in volume suggests the market is preparing for a larger move. A 20% advance from the $3.80 floor projects a target near $4.55–$4.60, an area that lines up with prior breakdown levels and moving average resistance.
A firm break above $4.20 would strengthen the case for that move. If the price slips below $3.70, the recovery attempt would weaken, opening the door to a return toward $3.30.

Ripple-linked token sitting idle in wallets now gets easier DeFi access
Jenna Lewis-Dougherty says she was done in by “Survivor 50” pregame alliances
Apart From Nvidia, Stocks to Watch Thursday: Zoom, Trade Desk, Warner, Paramount


-

 Video7 days ago
XRP News: XRP Just Entered a New Phase (Almost Nobody Noticed)
-

 Politics4 days ago
Baftas 2026: Awards Nominations, Presenters And Performers
-

 Fashion6 days ago
Weekend Open Thread: Boden – Corporette.com
-

 Sports3 days ago
Women’s college basketball rankings: Iowa reenters top 10, Auriemma makes history
-

 Politics3 days ago
Nick Reiner Enters Plea In Deaths Of Parents Rob And Michele
-

 Business2 days ago
True Citrus debuts functional drink mix collection
-

 Crypto World2 days ago
XRP price enters “dead zone” as Binance leverage hits lows
-

 Business4 days ago
Mattel’s American Girl brand turns 40, dolls enter a new era
-

 Business4 days ago
Law enforcement kills armed man seeking to enter Trump’s Mar-a-Lago resort, officials say
-

 Tech2 days ago
Unsurprisingly, Apple's board gets what it wants in 2026 shareholder meeting
-

 NewsBeat16 hours ago
Cuba says its forces have killed four on US-registered speedboat | World News
-
 NewsBeat18 hours ago
Manchester Central Mosque issues statement as it imposes new measures ‘with immediate effect’ after armed men enter
-
 NewsBeat3 days ago
‘Hourly’ method from gastroenterologist ‘helps reduce air travel bloating’
-

 Tech4 days ago
Anthropic-Backed Group Enters NY-12 AI PAC Fight
-

 NewsBeat4 days ago
Armed man killed after entering secure perimeter of Mar-a-Lago, Secret Service says
-

 Politics4 days ago
Maine has a long track record of electing moderates. Enter Graham Platner.
-
 NewsBeat2 days ago
Police latest as search for missing woman enters day nine
-

 Business13 hours ago
Discord Pushes Implementation of Global Age Checks to Second Half of 2026
-

 Crypto World2 days ago
Entering new markets without increasing payment costs
-
 Sports3 days ago
2026 NFL mock draft: WRs fly off the board in first round entering combine week