

Crypto World
Decibel goes live on Aptos with fully onchain perpetuals exchange


Decibel, a fully onchain perpetuals exchange incubated by Aptos Labs, is now live on the Aptos mainnet, the Decibel Foundation said Wednesday.
The debut follows a public testnet that drew more than 700,000 unique accounts and 132,000 daily active users, according to the foundation. Users executed over 1 million trades per day during testing, and more than $58 million was committed through a pre-deposit campaign ahead of mainnet activation.
Decibel’s debut comes during an intensifying race among onchain perpetuals exchanges. The past year has seen a surge of competition, led by Hyperliquid, which remains the category’s dominant venue by volume.
Other contenders, including Aster and Lighter, briefly gained traction before fading from the spotlight. Decibel now enters that increasingly crowded field with plans to gain market share from a sector that racked up $920 billion in trading volume over the past 30 days, according to DeFiLlama.
Decibel operates a central limit order book where order placement, matching, settlement and risk management occur entirely onchain. The model replaces the offchain risk engines and discretionary controls common in traditional and crypto exchanges with predefined smart contract rules visible to users.
The protocol will become the first perpetual exchange built on Aptos, a layer-1 blockchain with sub-50 millisecond block times and sub-500 millisecond finality. Decibel’s matching engine, margin requirements and liquidation logic execute onchain.
Users can fund accounts from Aptos, Ethereum, Solana or centralized exchanges. Roughly 40% of pre-deposit capital originated from Ethereum and Solana, the foundation said. The platform uses a dollar-denominated stablecoin, usDCBL, issued by Bridge, a Stripe company, as default collateral.
The Decibel Foundation said it plans to add spot markets, multi-collateral accounts and tokenized real-world assets, with the aim of expanding beyond crypto derivatives over time.

Circle (CRCL), issuer of the USDC stablecoin, continues to surge, now 45% higher in less than two sessions following its Wednesday fourth quarter earnings report.
The move snapped what had been a brutal 80% drawdown from record highs hit last year.
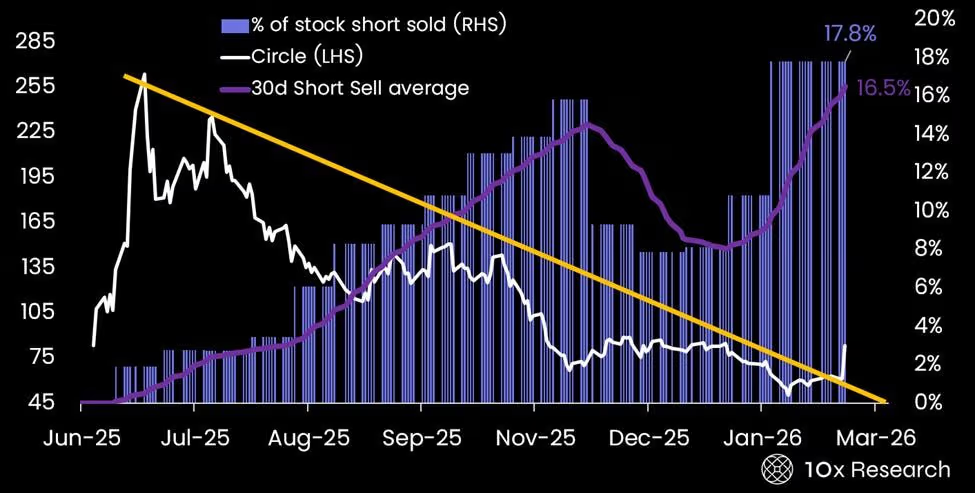
While the company delivered strong growth in USDC supply, the stock’s outsized reaction was driven more by crowded short bets heading into the print than by strong financials, analysts suggested.
“The magnitude of the move was not driven purely by the headline numbers. The real catalyst was positioning,” said Markus Thielen, founder of 10x Research.
Hedge funds had built sizable bearish exposure into the report, according to his data. That setup pointed to a “high-probability short squeeze rather than a fundamental re-rating,” Thielen added.

He estimated that hedge funds had lost roughly $500 million in a single day on shorts as shares squeezed higher.
Tough business
While Circle’s report produced positive headline numbers, digging deeper into the data shows that the profitability of the business slipped despite growing stablecoin demand.
On the fundamentals, Circle’s flagship USDC stablecoin grew to $75.3 billion in circulation, up 72% year over year and outpacing rival Tether’s USDT growth, Harvey Li, founder of Tokenization Insight, noted in a report.
Revenue from reserve income — primarily U.S. government debt backing USDC — rose 58% to $2.64 billion as benchmark interest rates compressed over the past year. But distribution costs climbed even faster, up 66% to $1.66 billion, underscoring the expense of incentivizing partners and platforms to expand adoption.
Despite surging circulation, Circle swung from a $156 million net profit in 2024 to a $70 million loss, Li pointed out.
“Stablecoin may be scaling; stablecoin issuance is a tough business,” Li said.
Beating expectations
Still, Circle topped analyst forecasts.
Japanese investment bank Mizuho raised its price target on Circle to $90 from $77 after the stronger-than-expected fourth quarter, citing a boost from prediction markets and growing optimism around “agentic commerce,” in which autonomous AI agents transact using Circle’s USDC stablecoin.
The firm reiterated its neutral rating on the stock, warning that lower interest rates could still weigh on reserve income.
Analysts Dan Dolev and Alexander Jenkins said Circle’s results topped expectations on both revenue and profit, easing investor concerns after a period of pessimism. Management highlighted prediction and betting platforms, particularly Polymarket, as meaningful drivers of recent USDC growth, pointing to their high-frequency transaction flows and near-term utility.
The analysts noted that company executives also underscored USDC’s emerging role in agentic commerce, describing the stablecoin as a potential default currency for AI agents transacting across digital marketplaces. A growing number of products are being built on USDC and connected to Circle’s network, with trading and prediction platforms serving as prominent examples of high-velocity use cases.
The bank now forecasts average USDC in circulation of roughly 123 million in 2027, modeling reserve income of about $3.7 billion and EBITDA of $916 million that year, assuming rate cuts in line with consensus expectations. Applying a 24x EBITDA multiple, a premium to peers such as Visa (V), Mastercard (MA), Coinbase (COIN) and Robinhood (HOOD), the analysts arrived at their new $90 price target.
With just days left in February, crypto whales are quietly repositioning. The broader market remains uncertain, but on-chain data tells a different story. Large holders are selectively adding exposure across three tokens — one seeking direction, one seeking a breakout, and one targeting greater upside.
As March approaches, the big holders appear to be making their move early.
Uniswap (UNI)
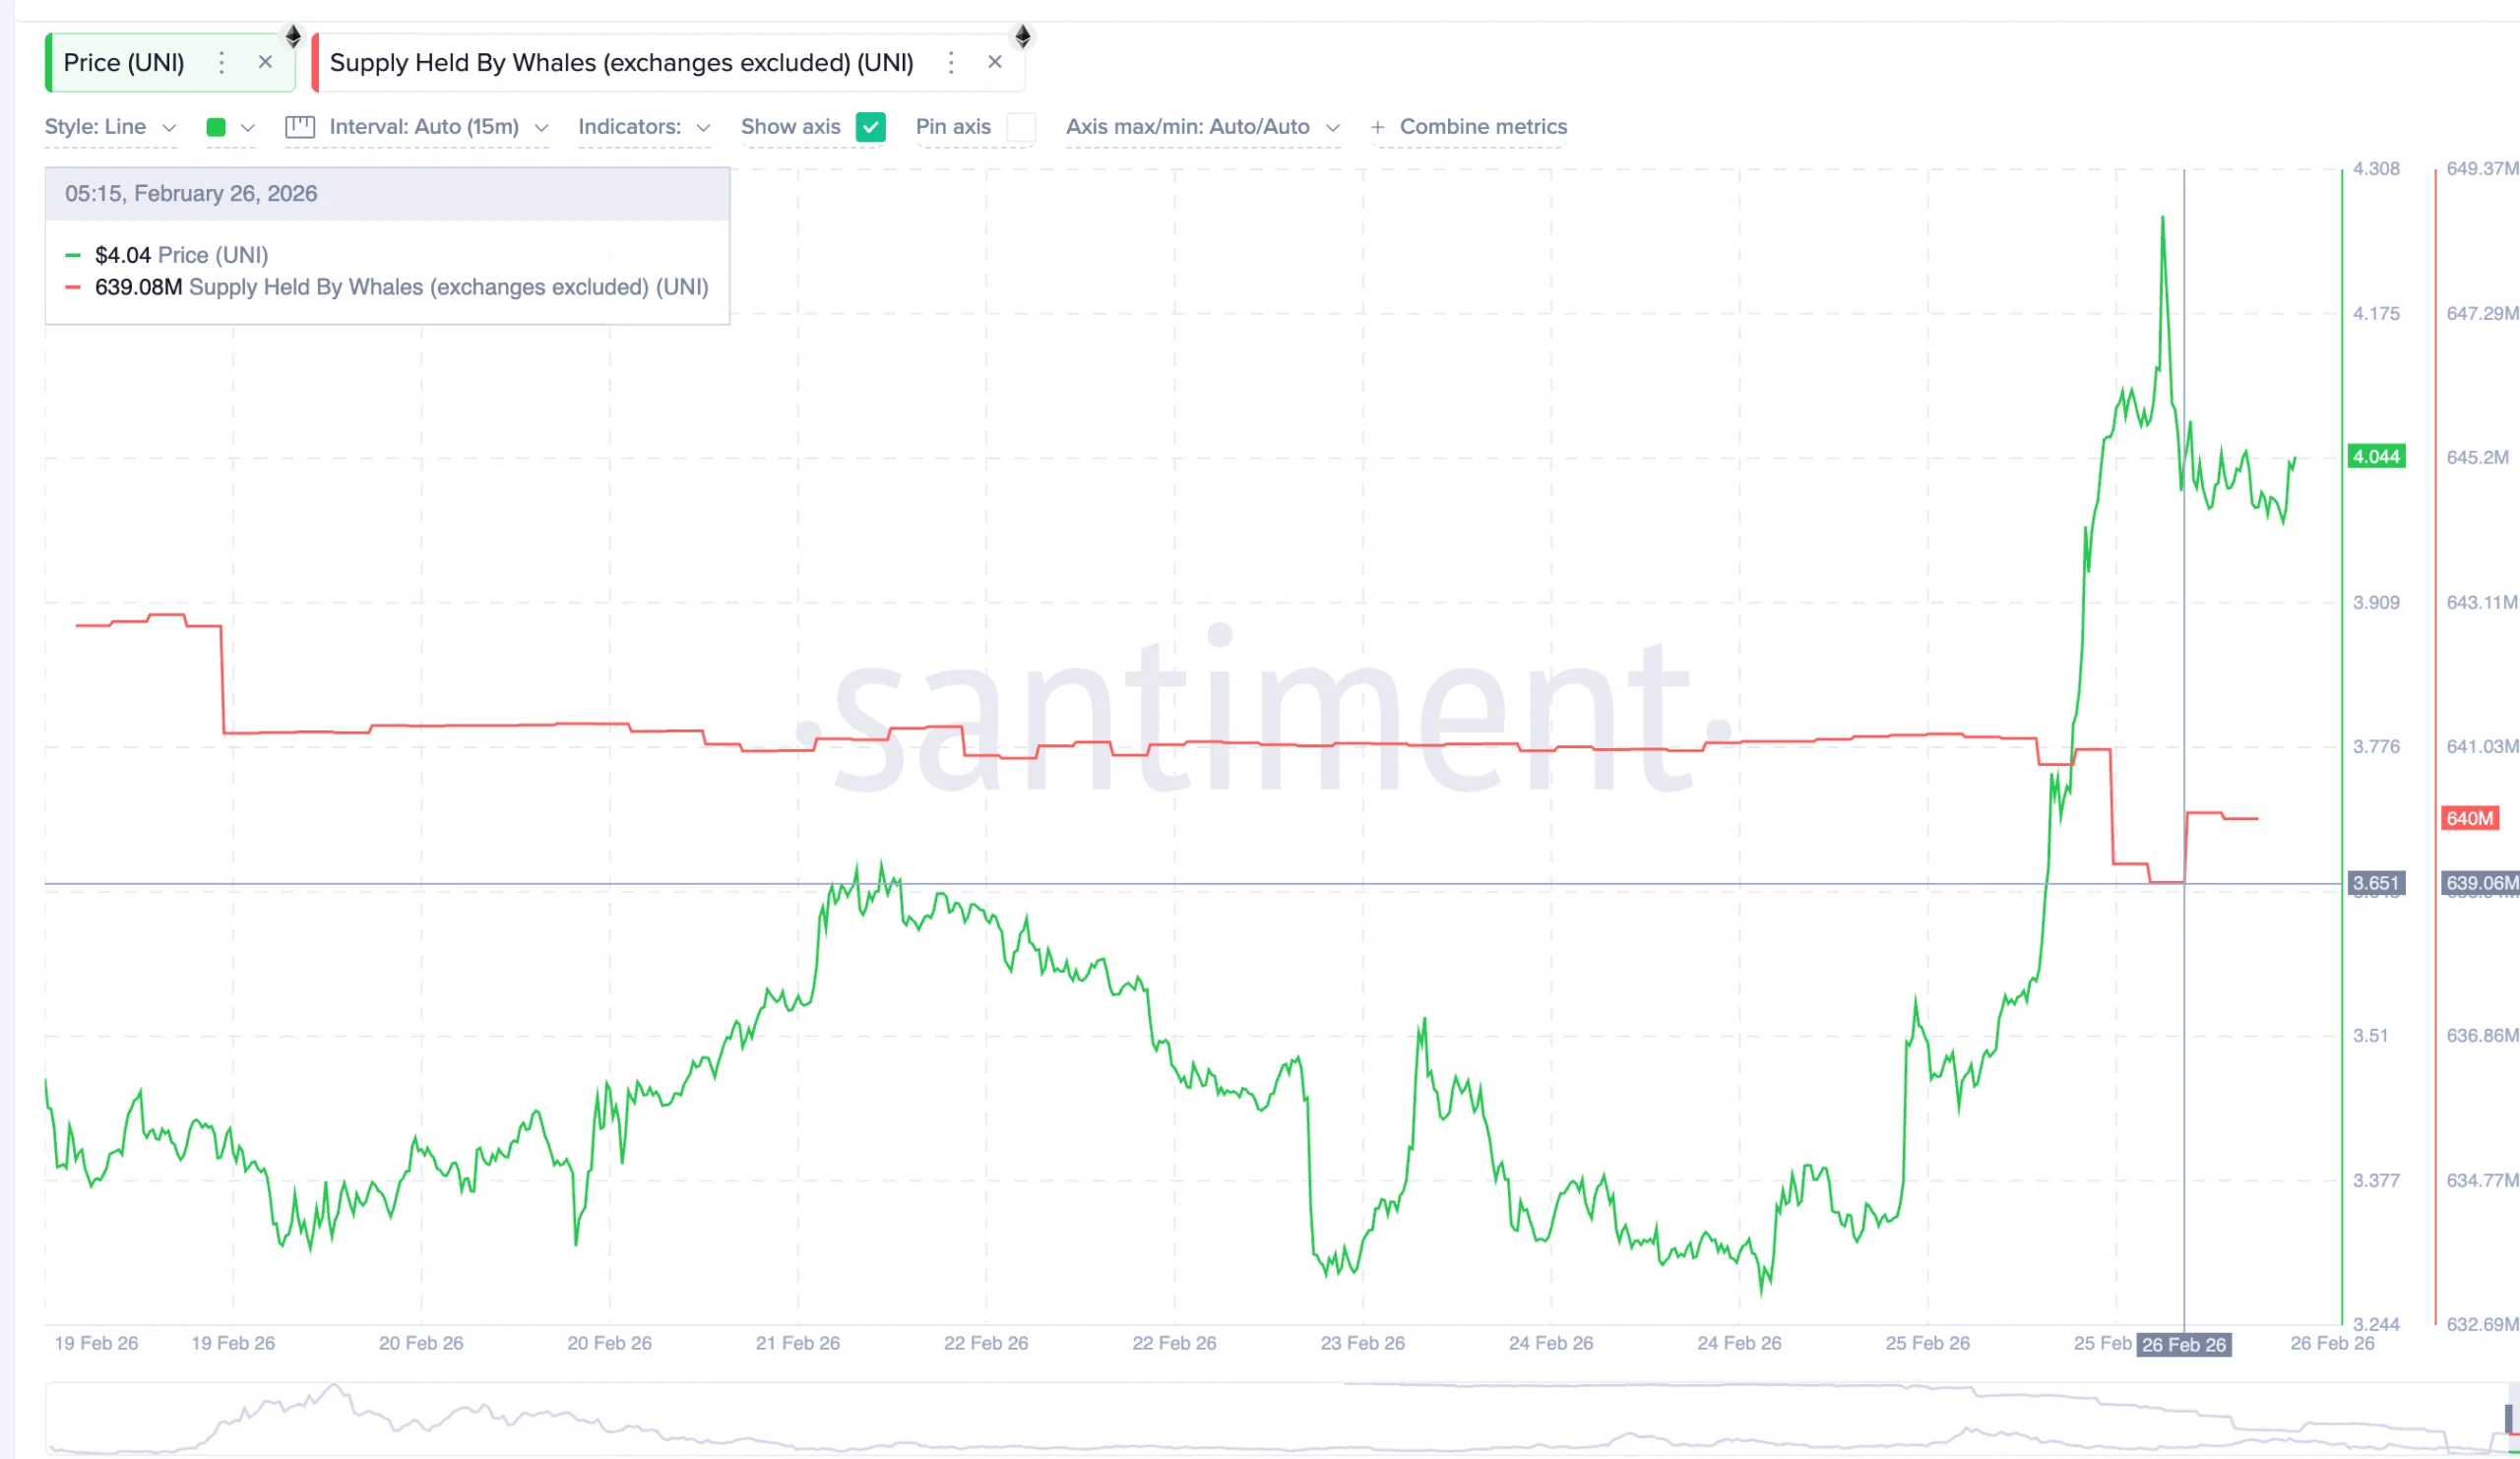
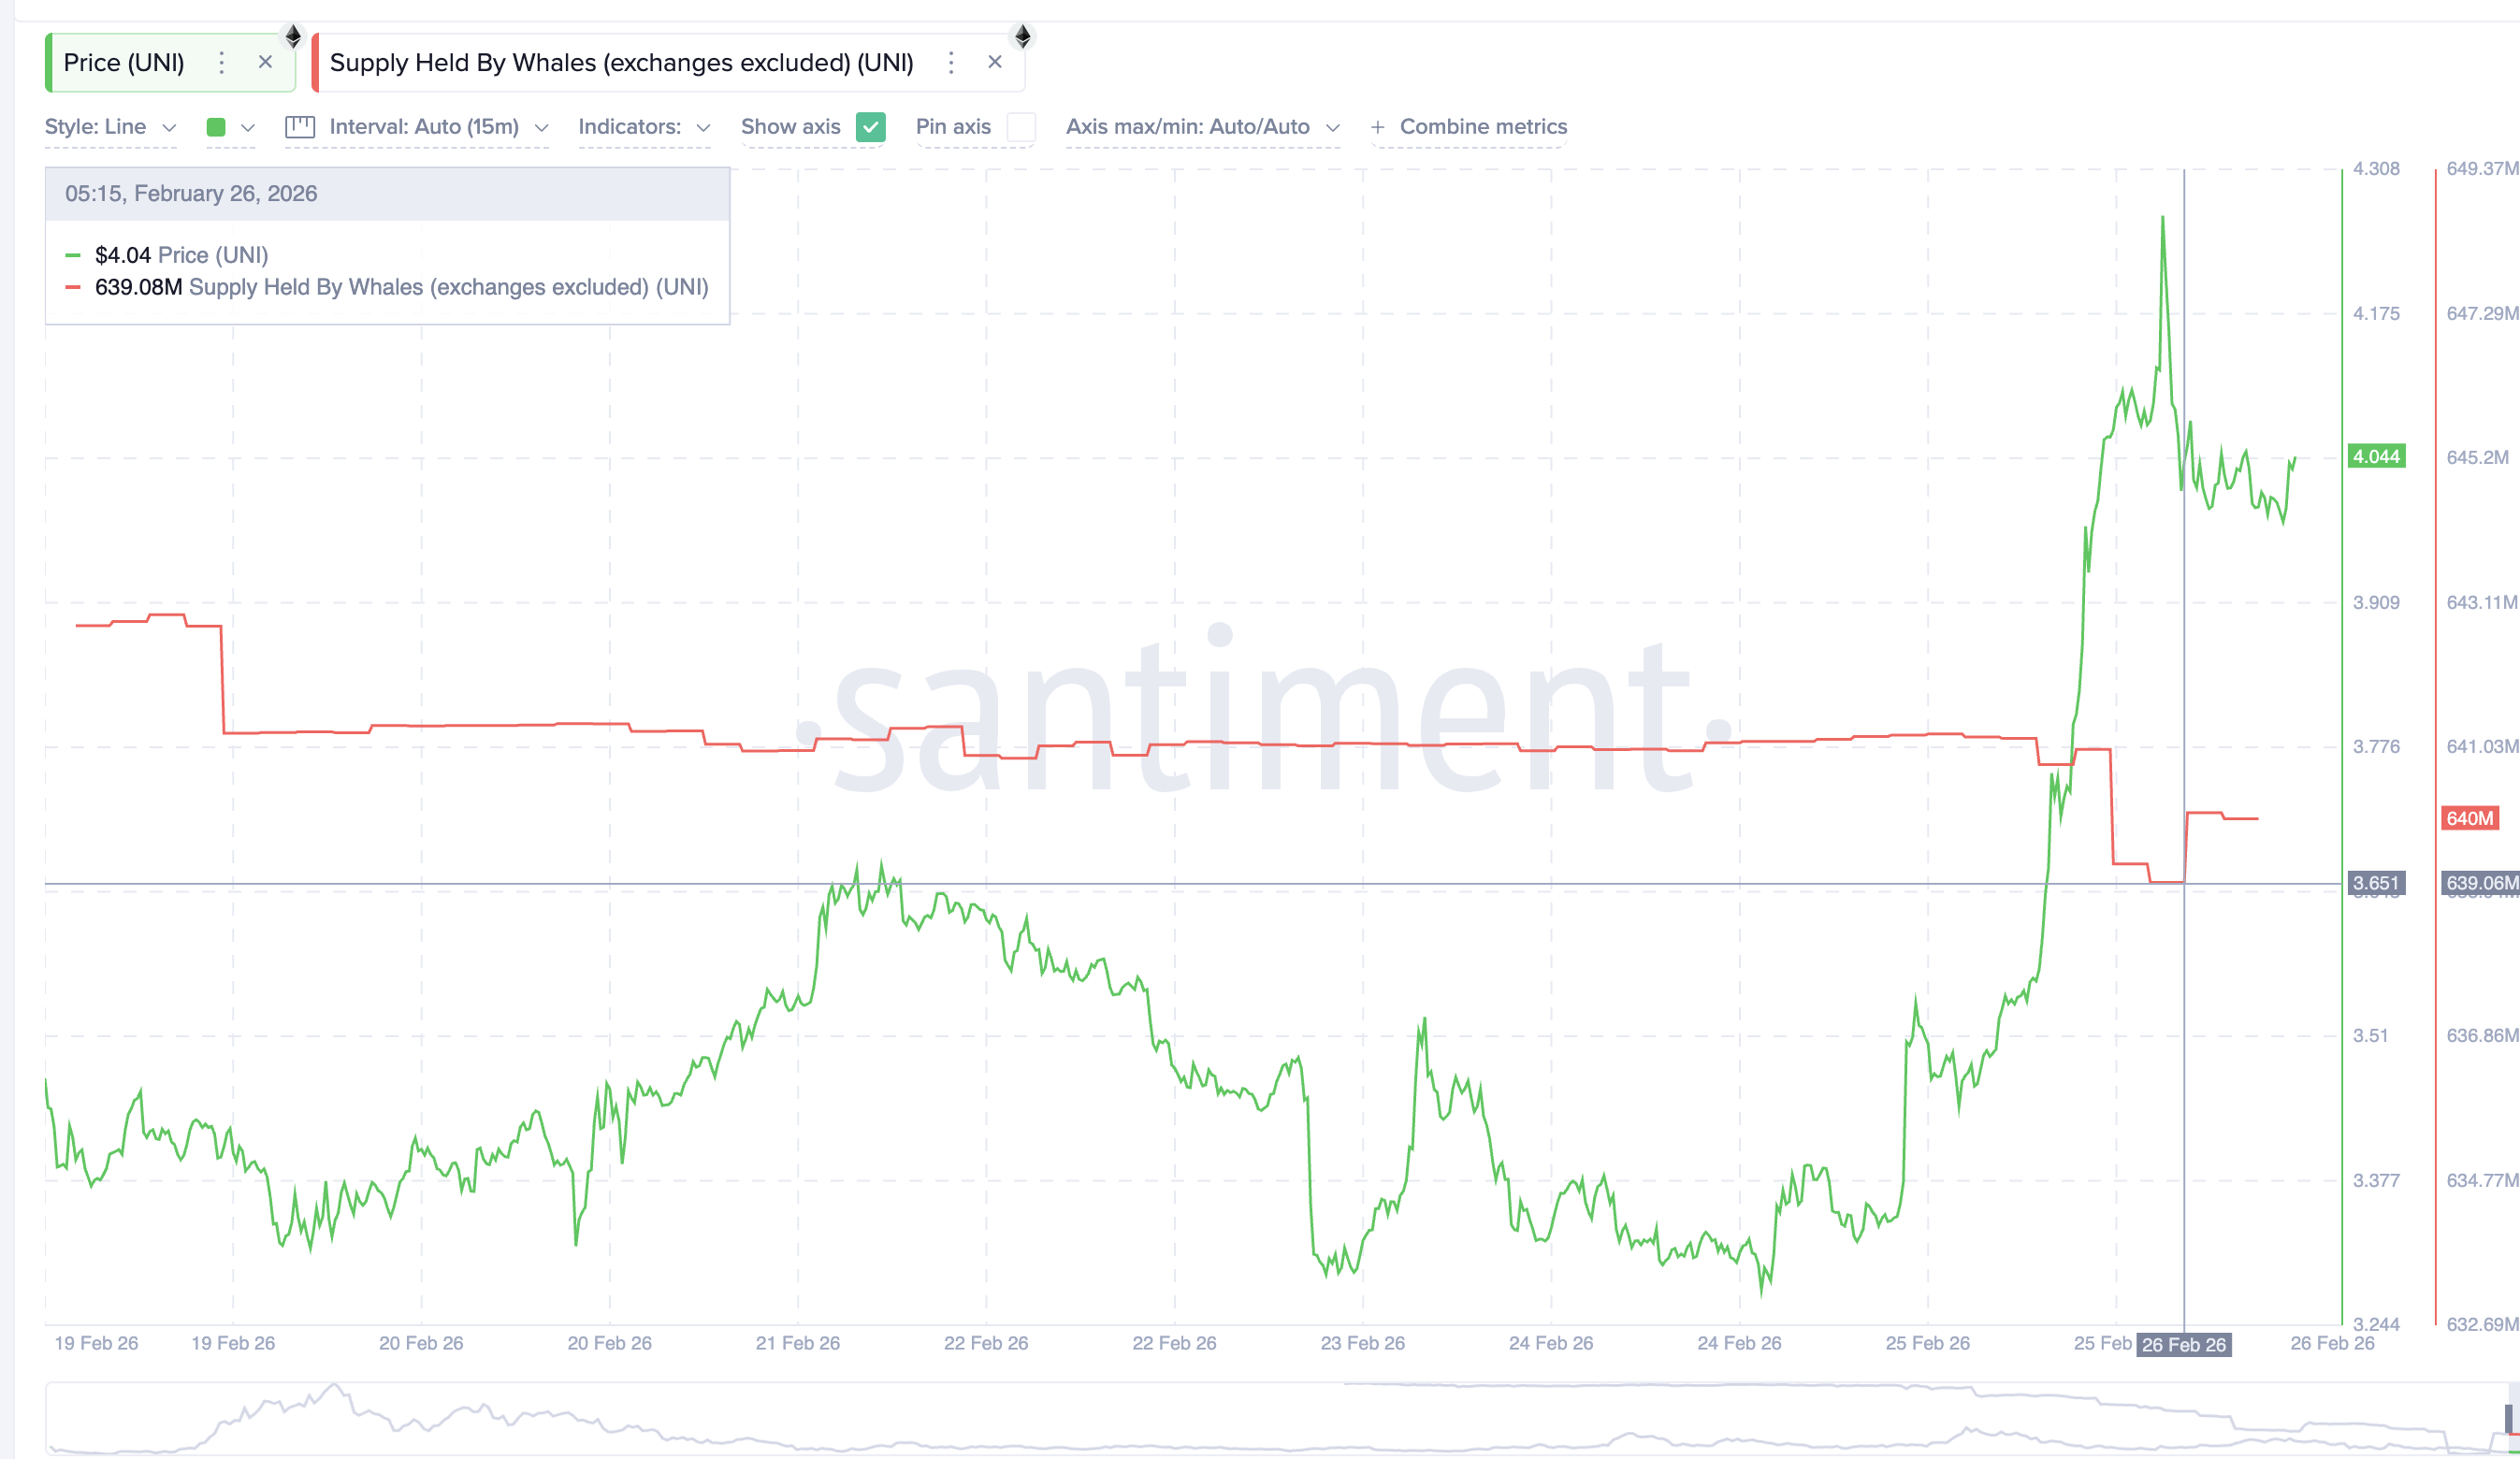
Uniswap is among the more interesting names showing crypto whale activity heading into March. Despite a broader market pullback, UNI is up nearly 15.5% over the past 24 hours, briefly spiking to $4.29 before pulling back sharply.
Yet crypto whales are not flinching. On-chain data shows large holders increased their UNI holdings from 639.06 million to 640 million tokens. And they did all of that on February 26 alone. At the current price, that sudden accumulation is worth roughly $1 million over a few hours, reflecting quiet conviction even as the price corrected from its intraday high.
The chart context explains why. UNI has been consolidating inside a developing symmetrical triangle, with lower highs being met by higher lows as both trendlines converge. The past two attempts to break above the upper resistance were rejected hard, with sellers stepping in precisely at the triangle boundary. The large wick from today’s session is a direct reflection of that dynamic — momentum pushing up, supply pushing back.
However, smart money positioning remains aggressive, as the Smart Money Index is still way above the signal line. This keeps the possibility of a breakout alive if broader market conditions improve. A confirmed 12-hour close above $4.21 would validate the breakout and give UNI a possible bullish direction. That would open upside toward $4.88 and potentially $5.95 if DeFi rotation picks up meaningfully through March.
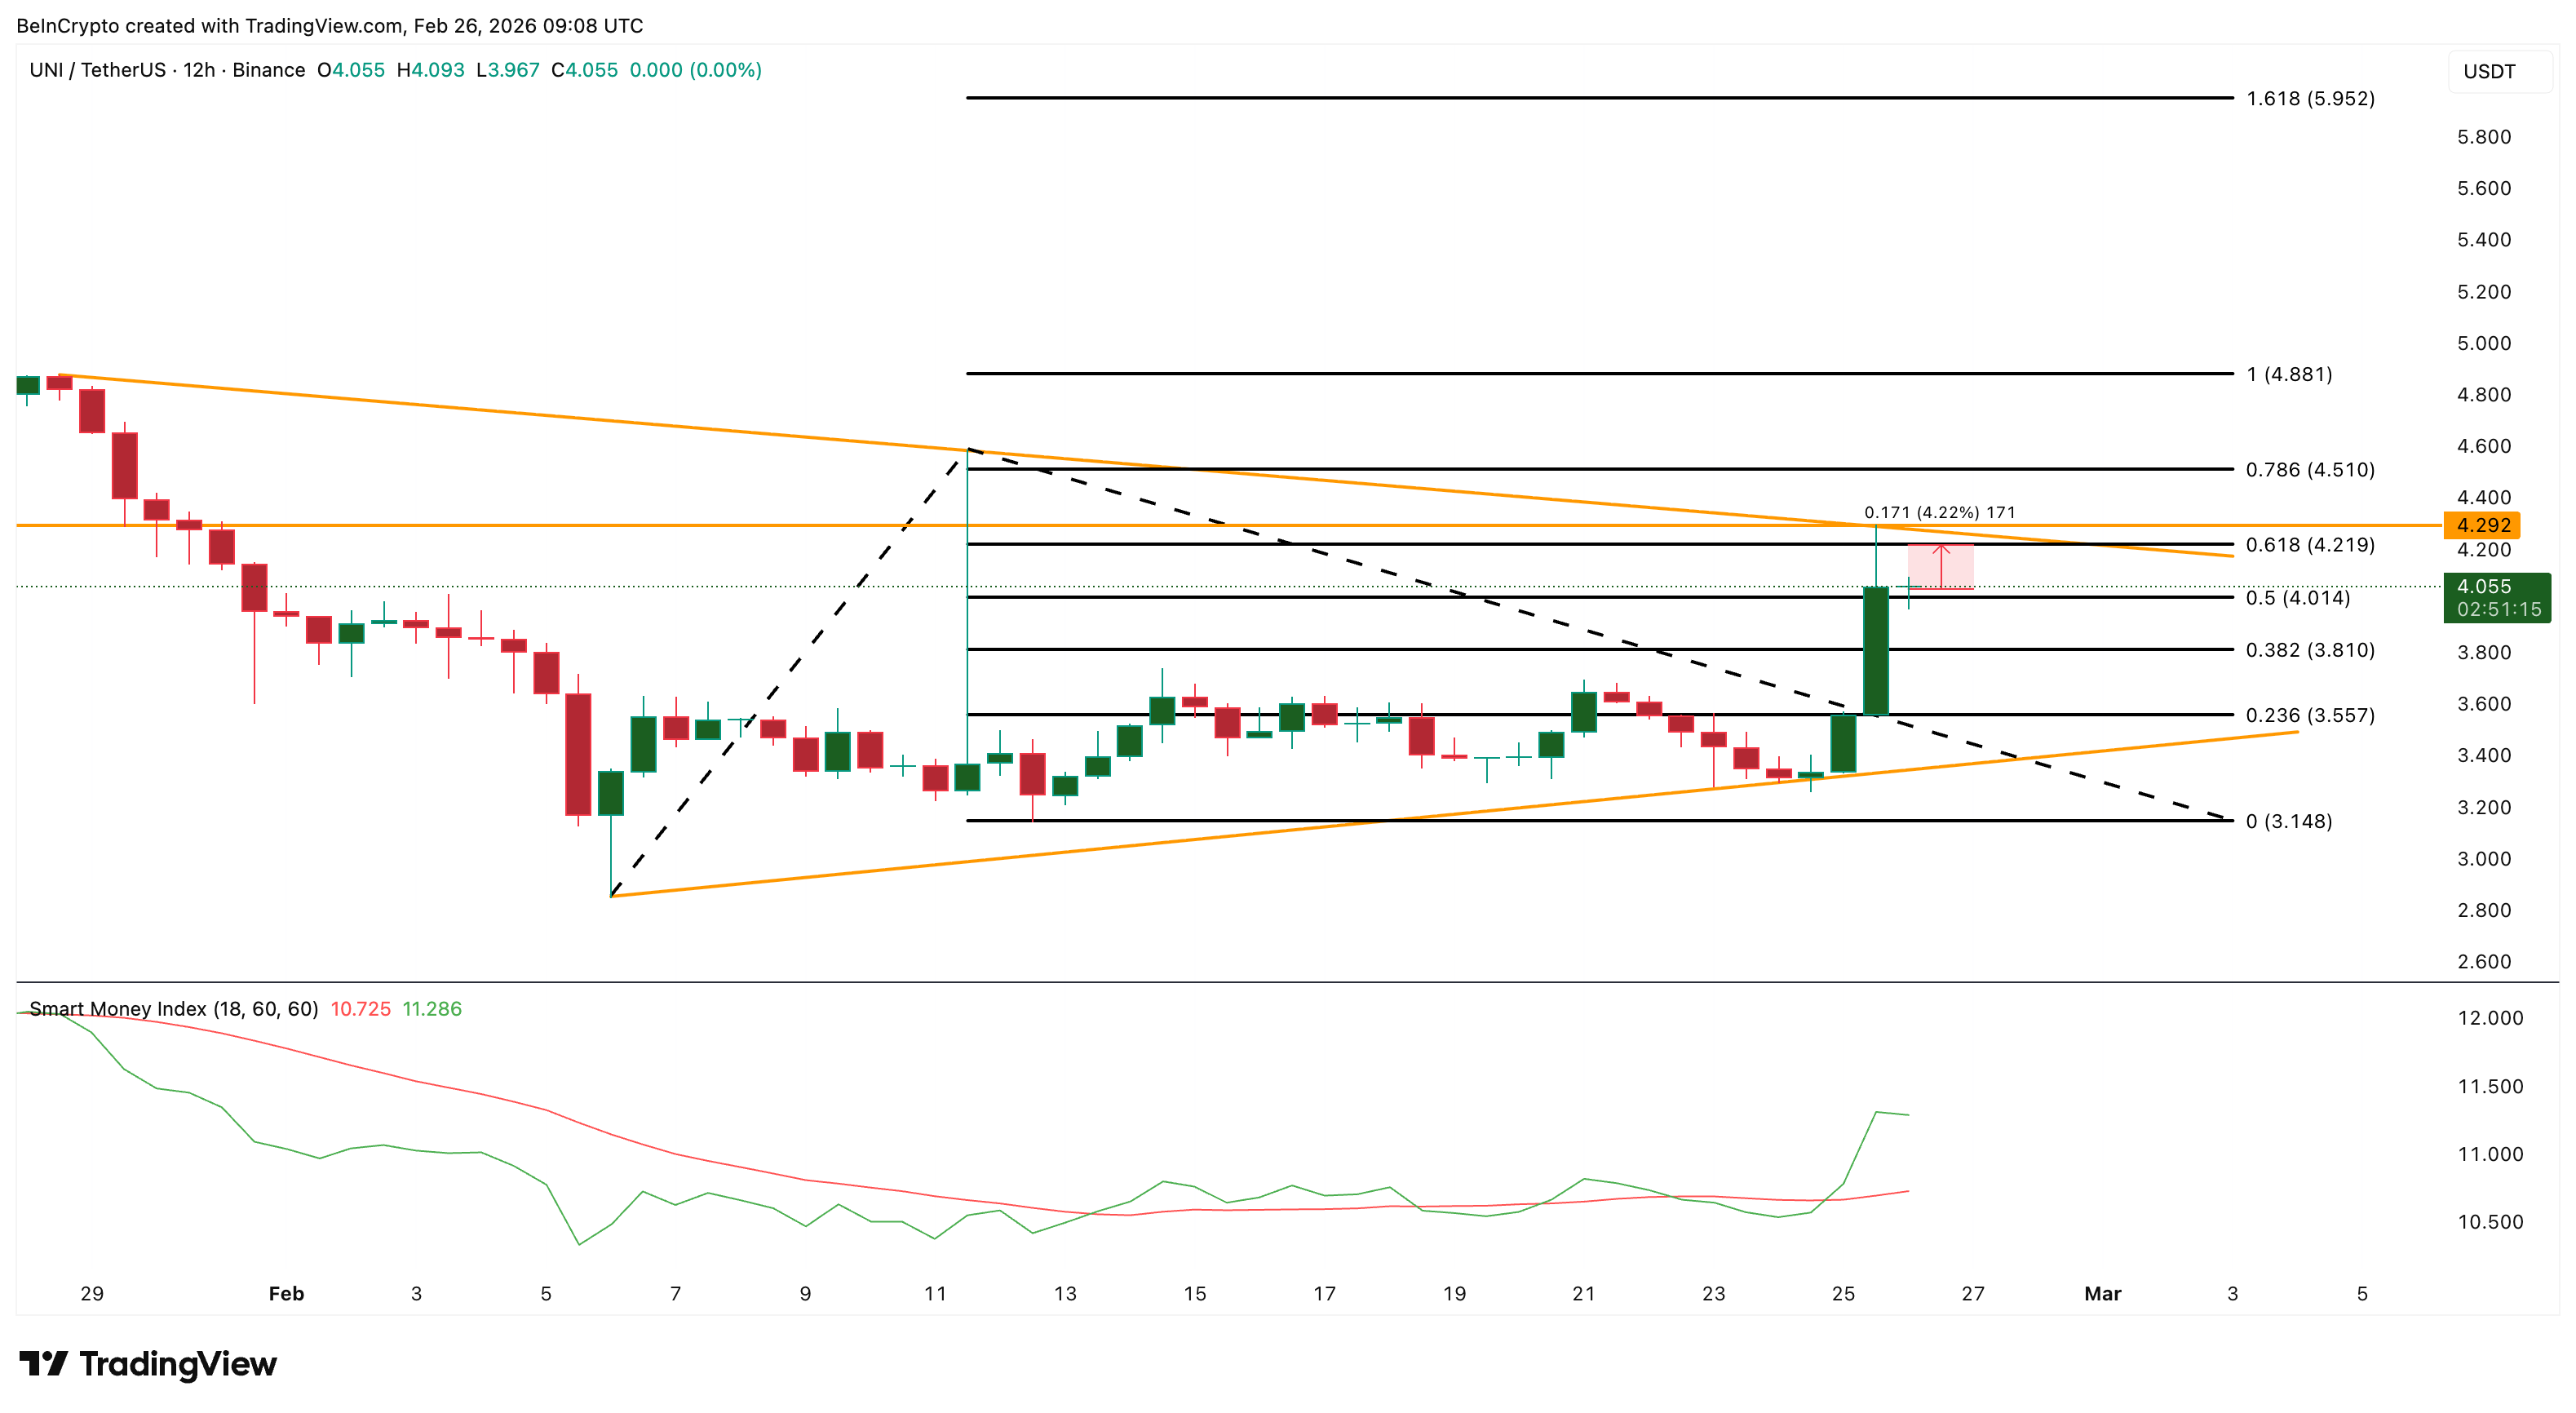
On the downside, $3.81 is the key support. A break there risks pushing UNI toward the lower triangle boundary. However, buyers have consistently defended that zone since early February, suggesting the symmetrical structure remains intact and continues narrowing. However, if the broader market sell-off begins, traders need to keep a close eye on whale and smart money positioning.
Bitcoin Cash (BCH)
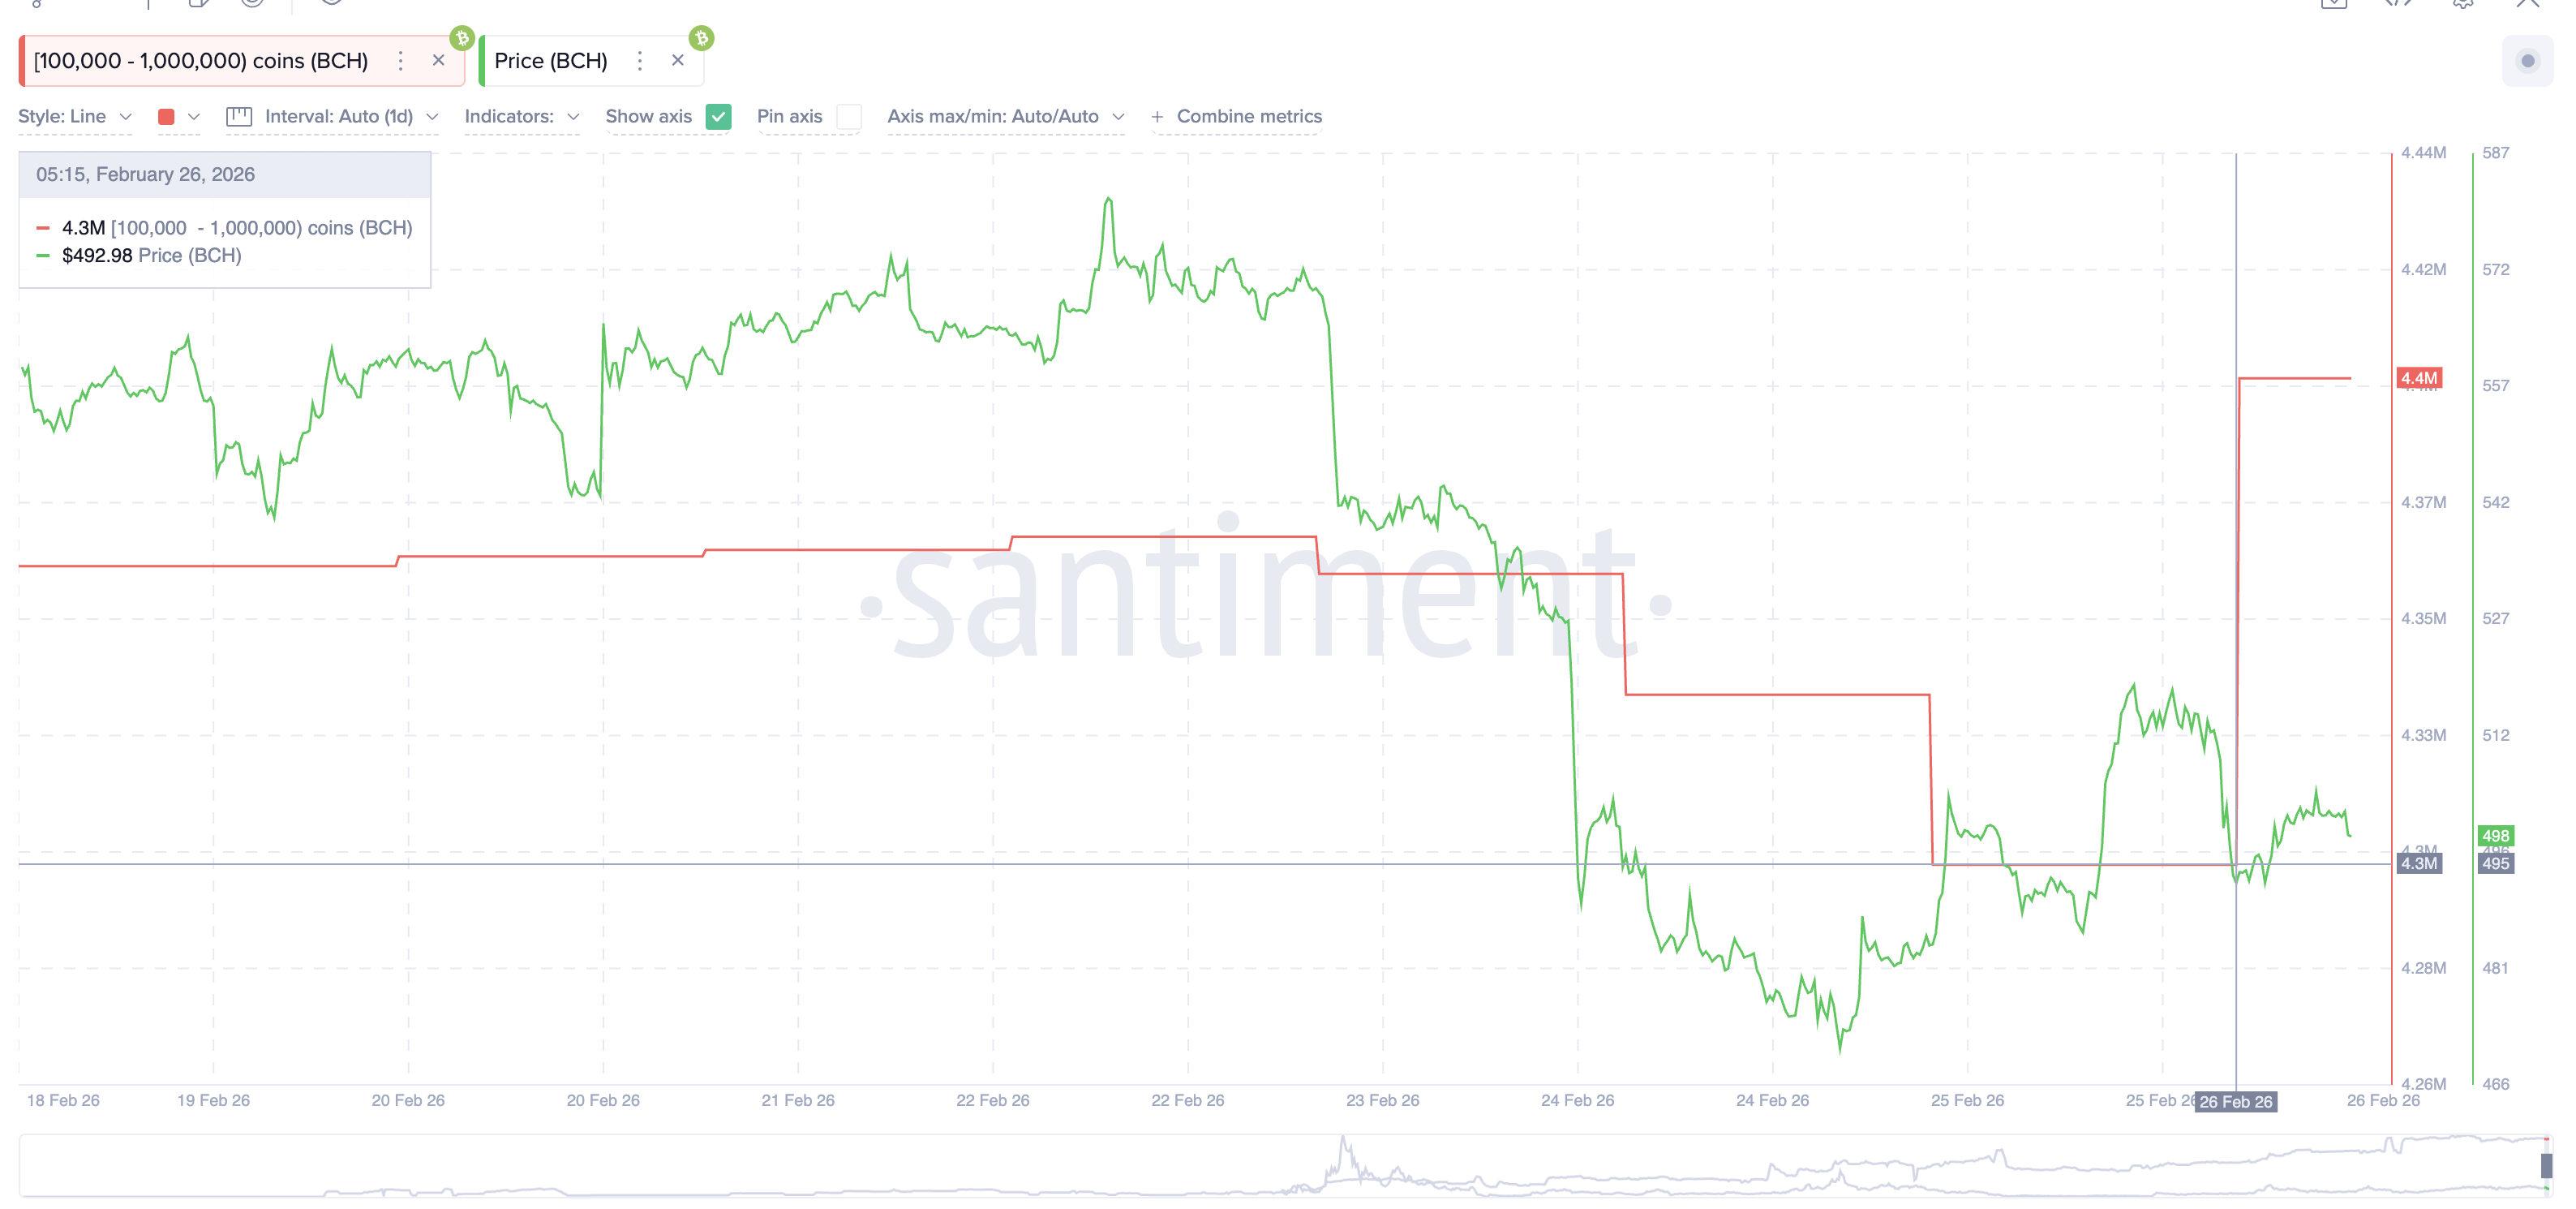
Bitcoin Cash is another name where whale accumulation has turned suddenly aggressive. BCH is up just 1.5% in the past 24 hours, underperforming the broader market. But zoom out, and Bitcoin Cash is up nearly 70% year-on-year. That is a standout number. Most major crypto names cannot say the same.
That long-term strength appears to be driving fresh conviction. The largest BCH holder cohort, wallets holding between 100,000 and 1,000,000 coins, increased their stash from 4.3 million to 4.4 million today, almost $50 million. The move was rapid and decisive. Notably, these whales were steadily reducing holdings until February 25. Then the shoulder of an inverse head-and-shoulders pattern formed.
Want more token insights like this? Sign up for Editor Harsh Notariya’s Daily Crypto Newsletter here.
Price began moving on February 24. By February 26, accumulation kicked in sharply. The timing is deliberate. Whales waited for the pattern to develop before committing. That is disciplined positioning, not reactive buying. On the 8-hour chart, BCH has rallied roughly 10% since February 24, only to pull back.
It is now approaching the neckline of that inverse head-and-shoulders formation. A confirmed break above $598 would signal a breach of the neckline, which BCH could attempt in March. Based on pattern projection, that opens a path toward $777. However, it would first need to push past $570, a strong technical resistance, before that.
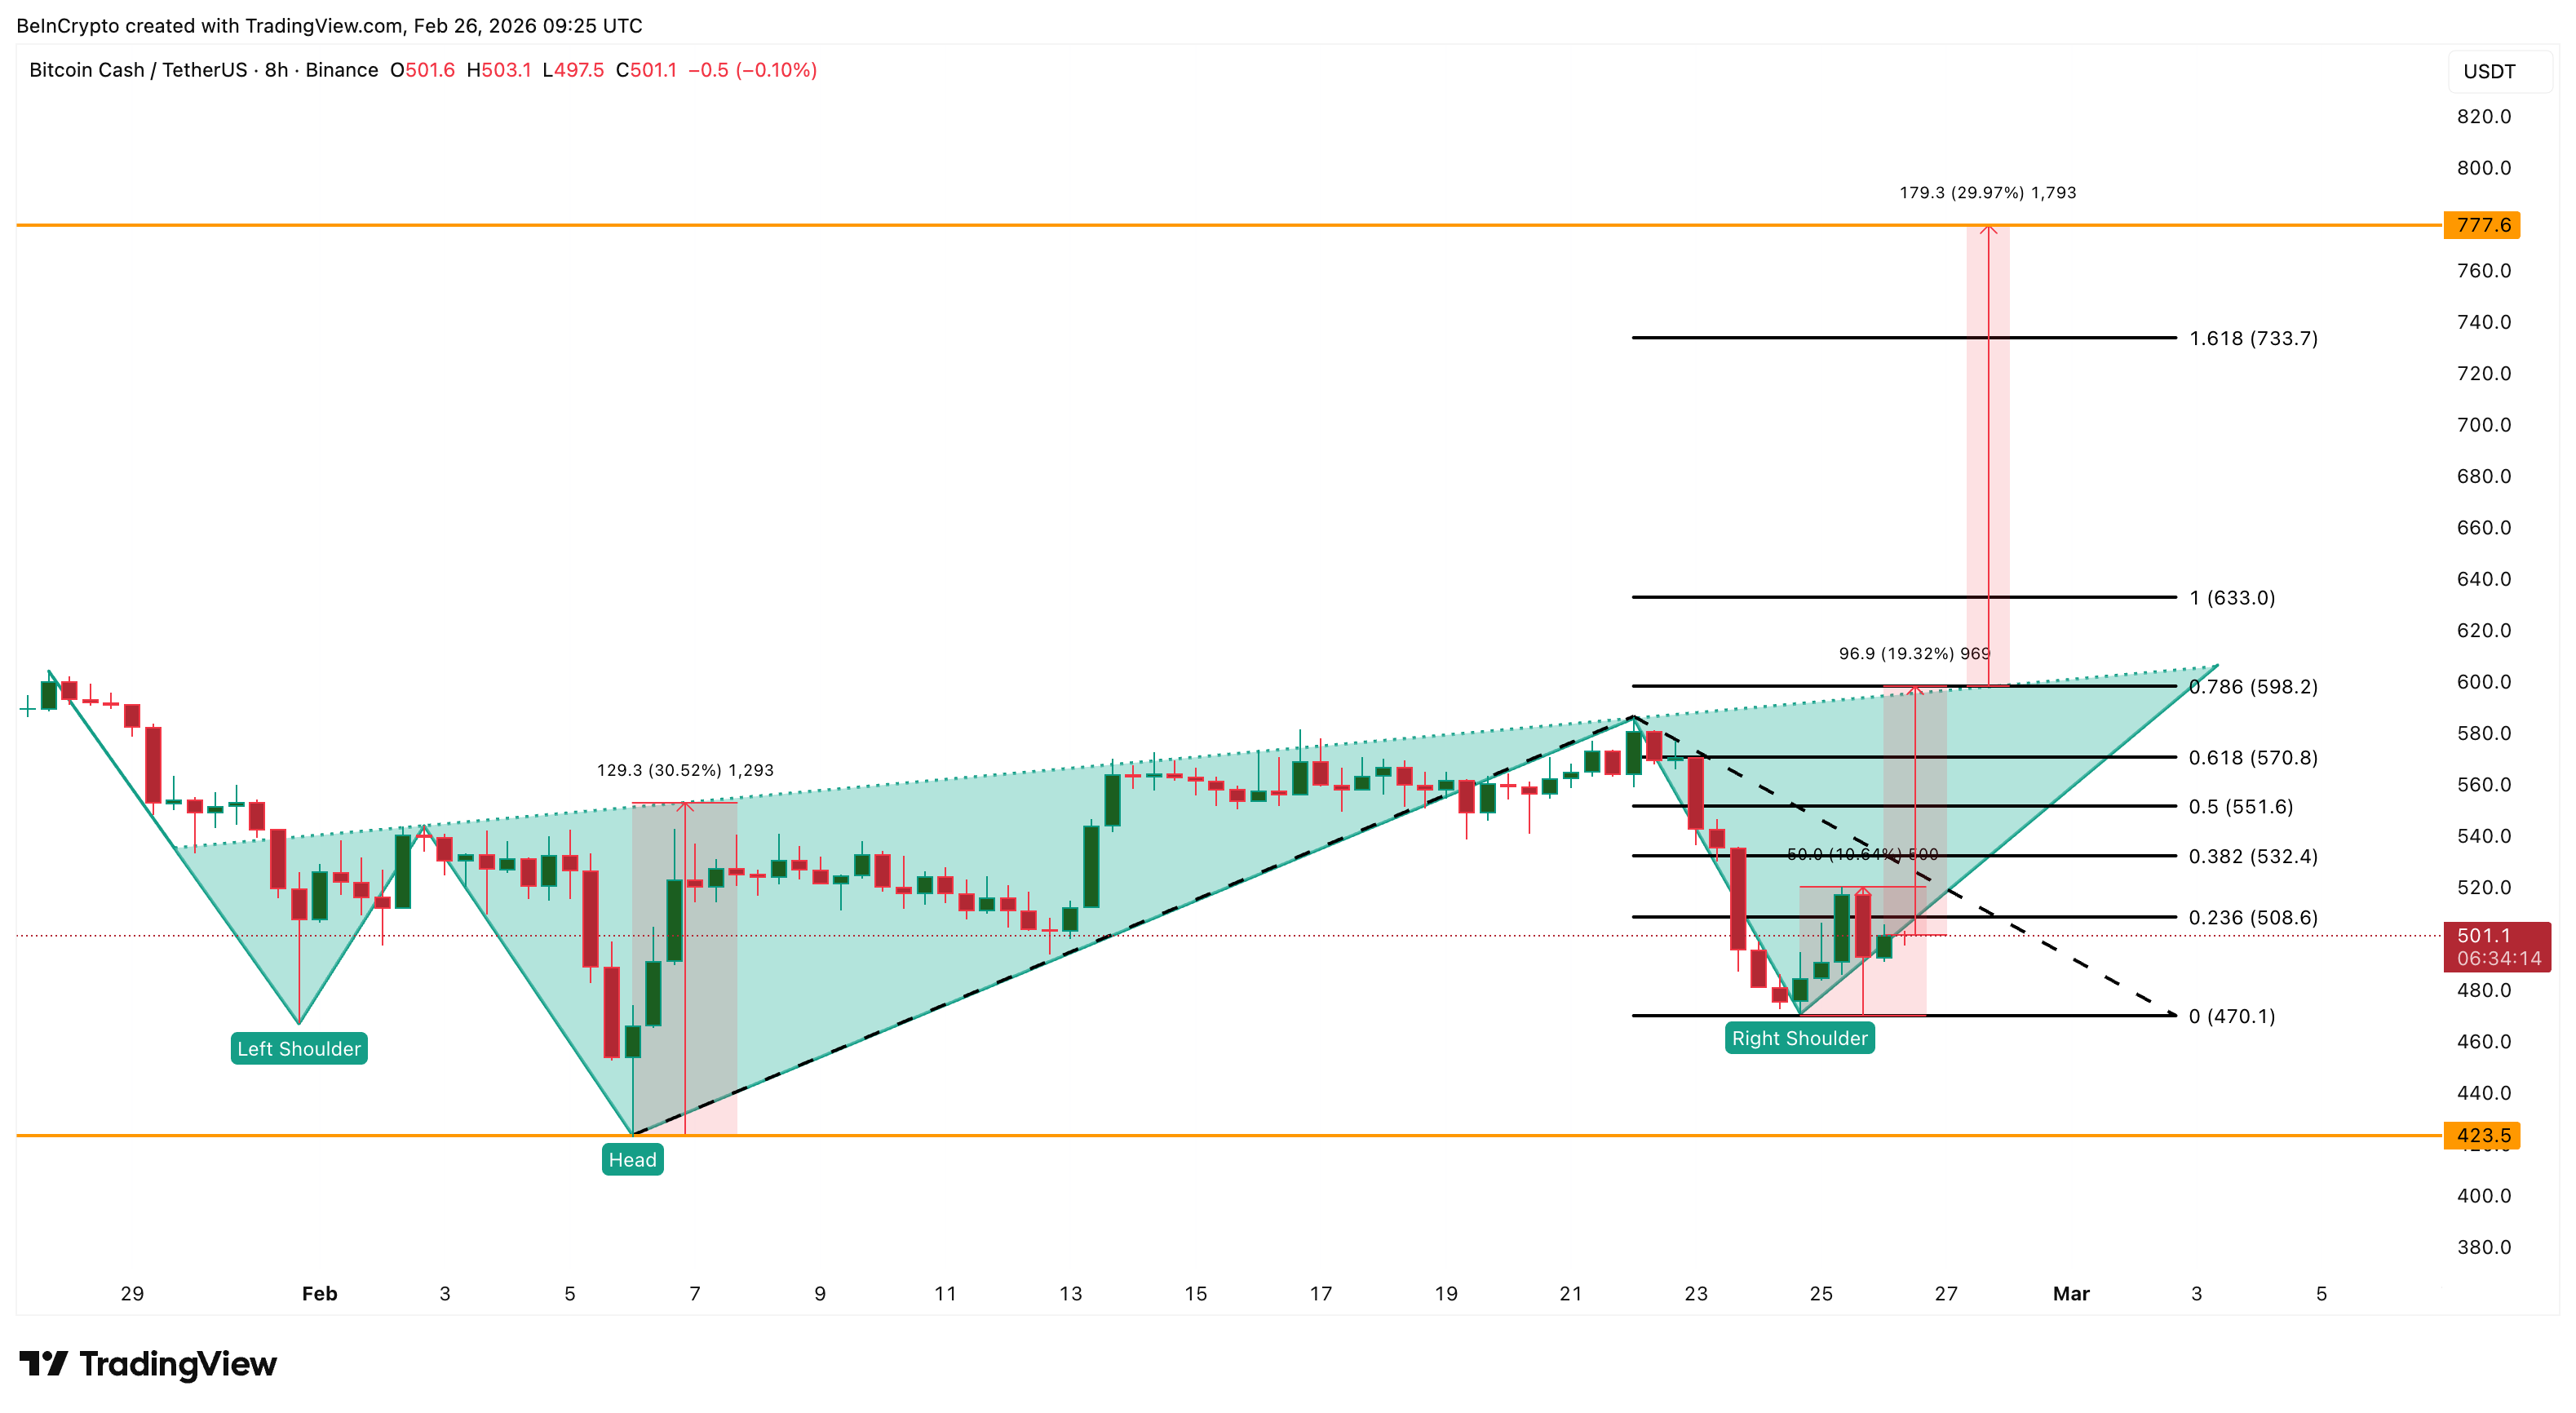
Given BCH’s year-on-year track record, both the targets, first the neckline at 19% and then the target, are not far-fetched. However, the setup has clear invalidation levels. Failure to reclaim $508 would be an early warning sign. A drop below $470 weakens the pattern meaningfully. A close under $423 invalidates the structure entirely, and the whale thesis unravels with it.
Chainlink (LINK)
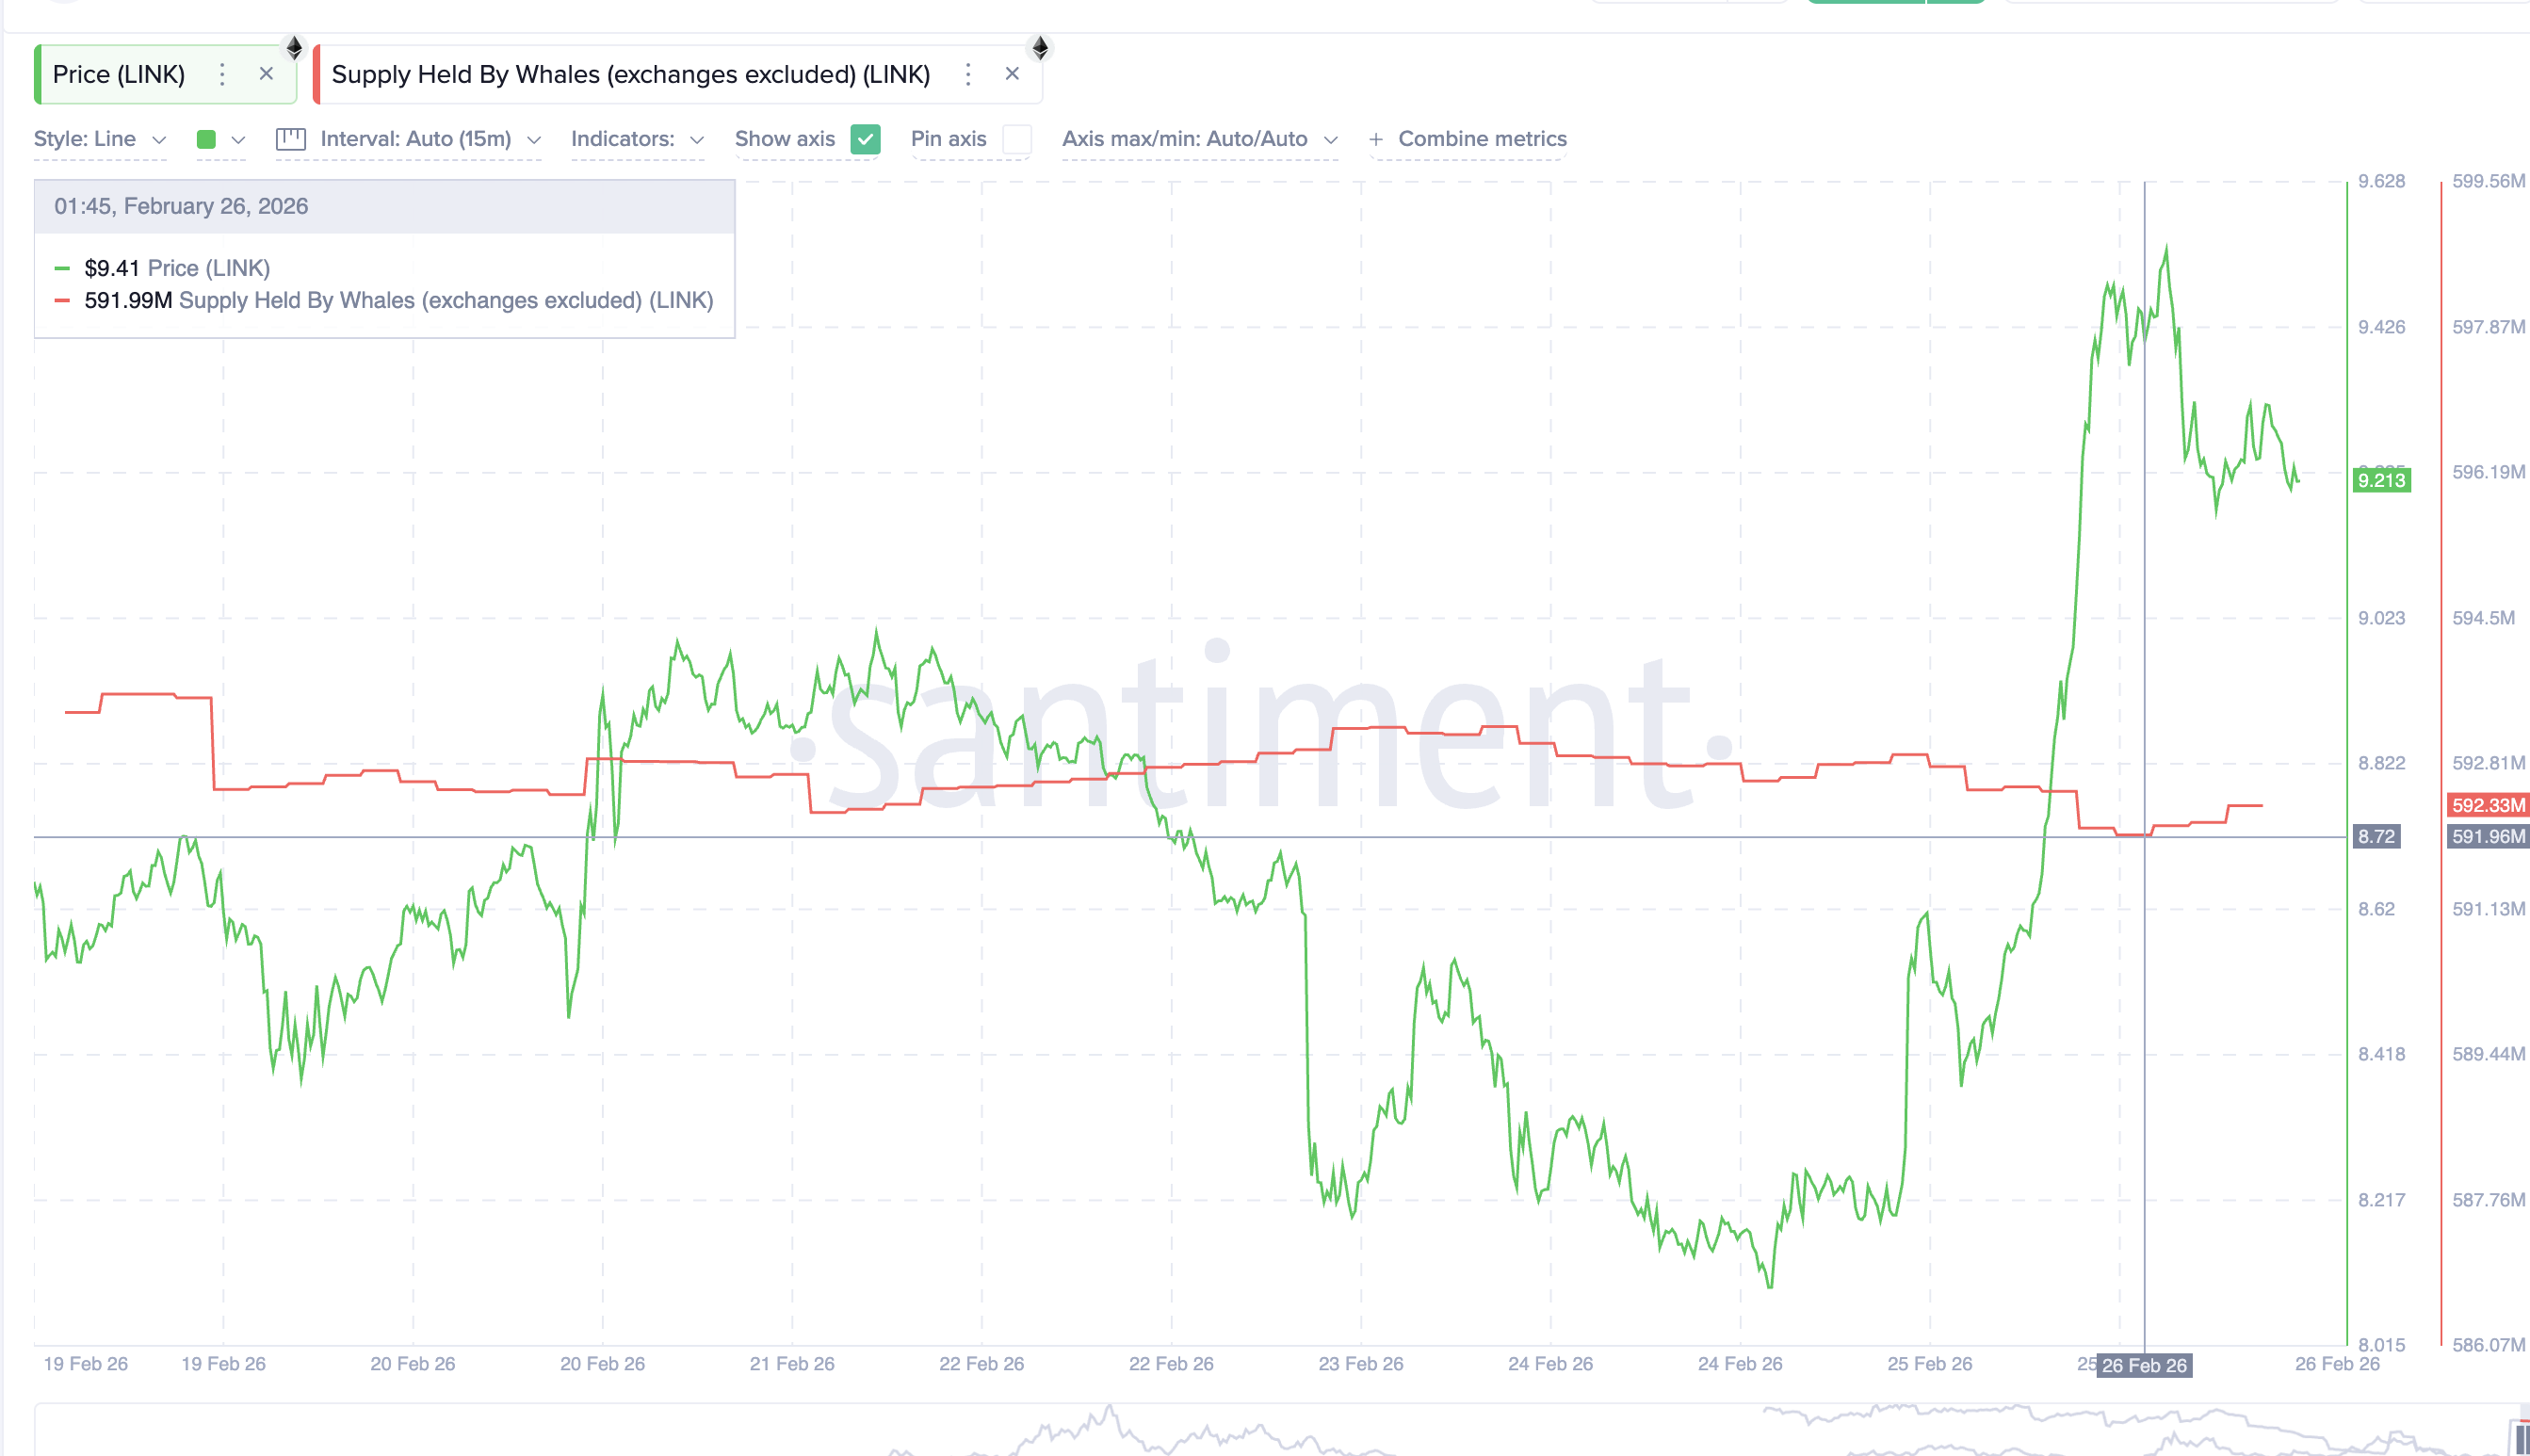
Chainlink rounds out the three tokens where crypto whale accumulation has turned decisive heading into March. LINK saw continuous whale selling through February 25. That changed on February 26. Large holders increased their stash from 591.96 million to 592.33 million tokens. That is an addition of 370,000 LINK. At the current price, that accumulation is worth roughly $3.5 million — a sudden shift in positioning.
The trigger is clear. On the 12-hour chart, Chainlink broke out of an inverse head and shoulders pattern yesterday, as predicted by BeInCrypto Analysts. This is not anticipatory buying. Whales moved after the breakout was confirmed, adding on evidence rather than speculation.
Since the breakout, LINK has met resistance at $9.62 and pulled back, possibly due to profit-taking. However, it is holding firmly near $9.28, a strong support zone. That level needs to hold for the bullish structure to remain intact.
There is another layer of strength here. The Chaikin Money Flow, or CMF, crossed above the zero line on February 20. That cross preceded the breakout, signaling institutional money flowing into LINK before the price moved. CMF currently sits at 0.13.
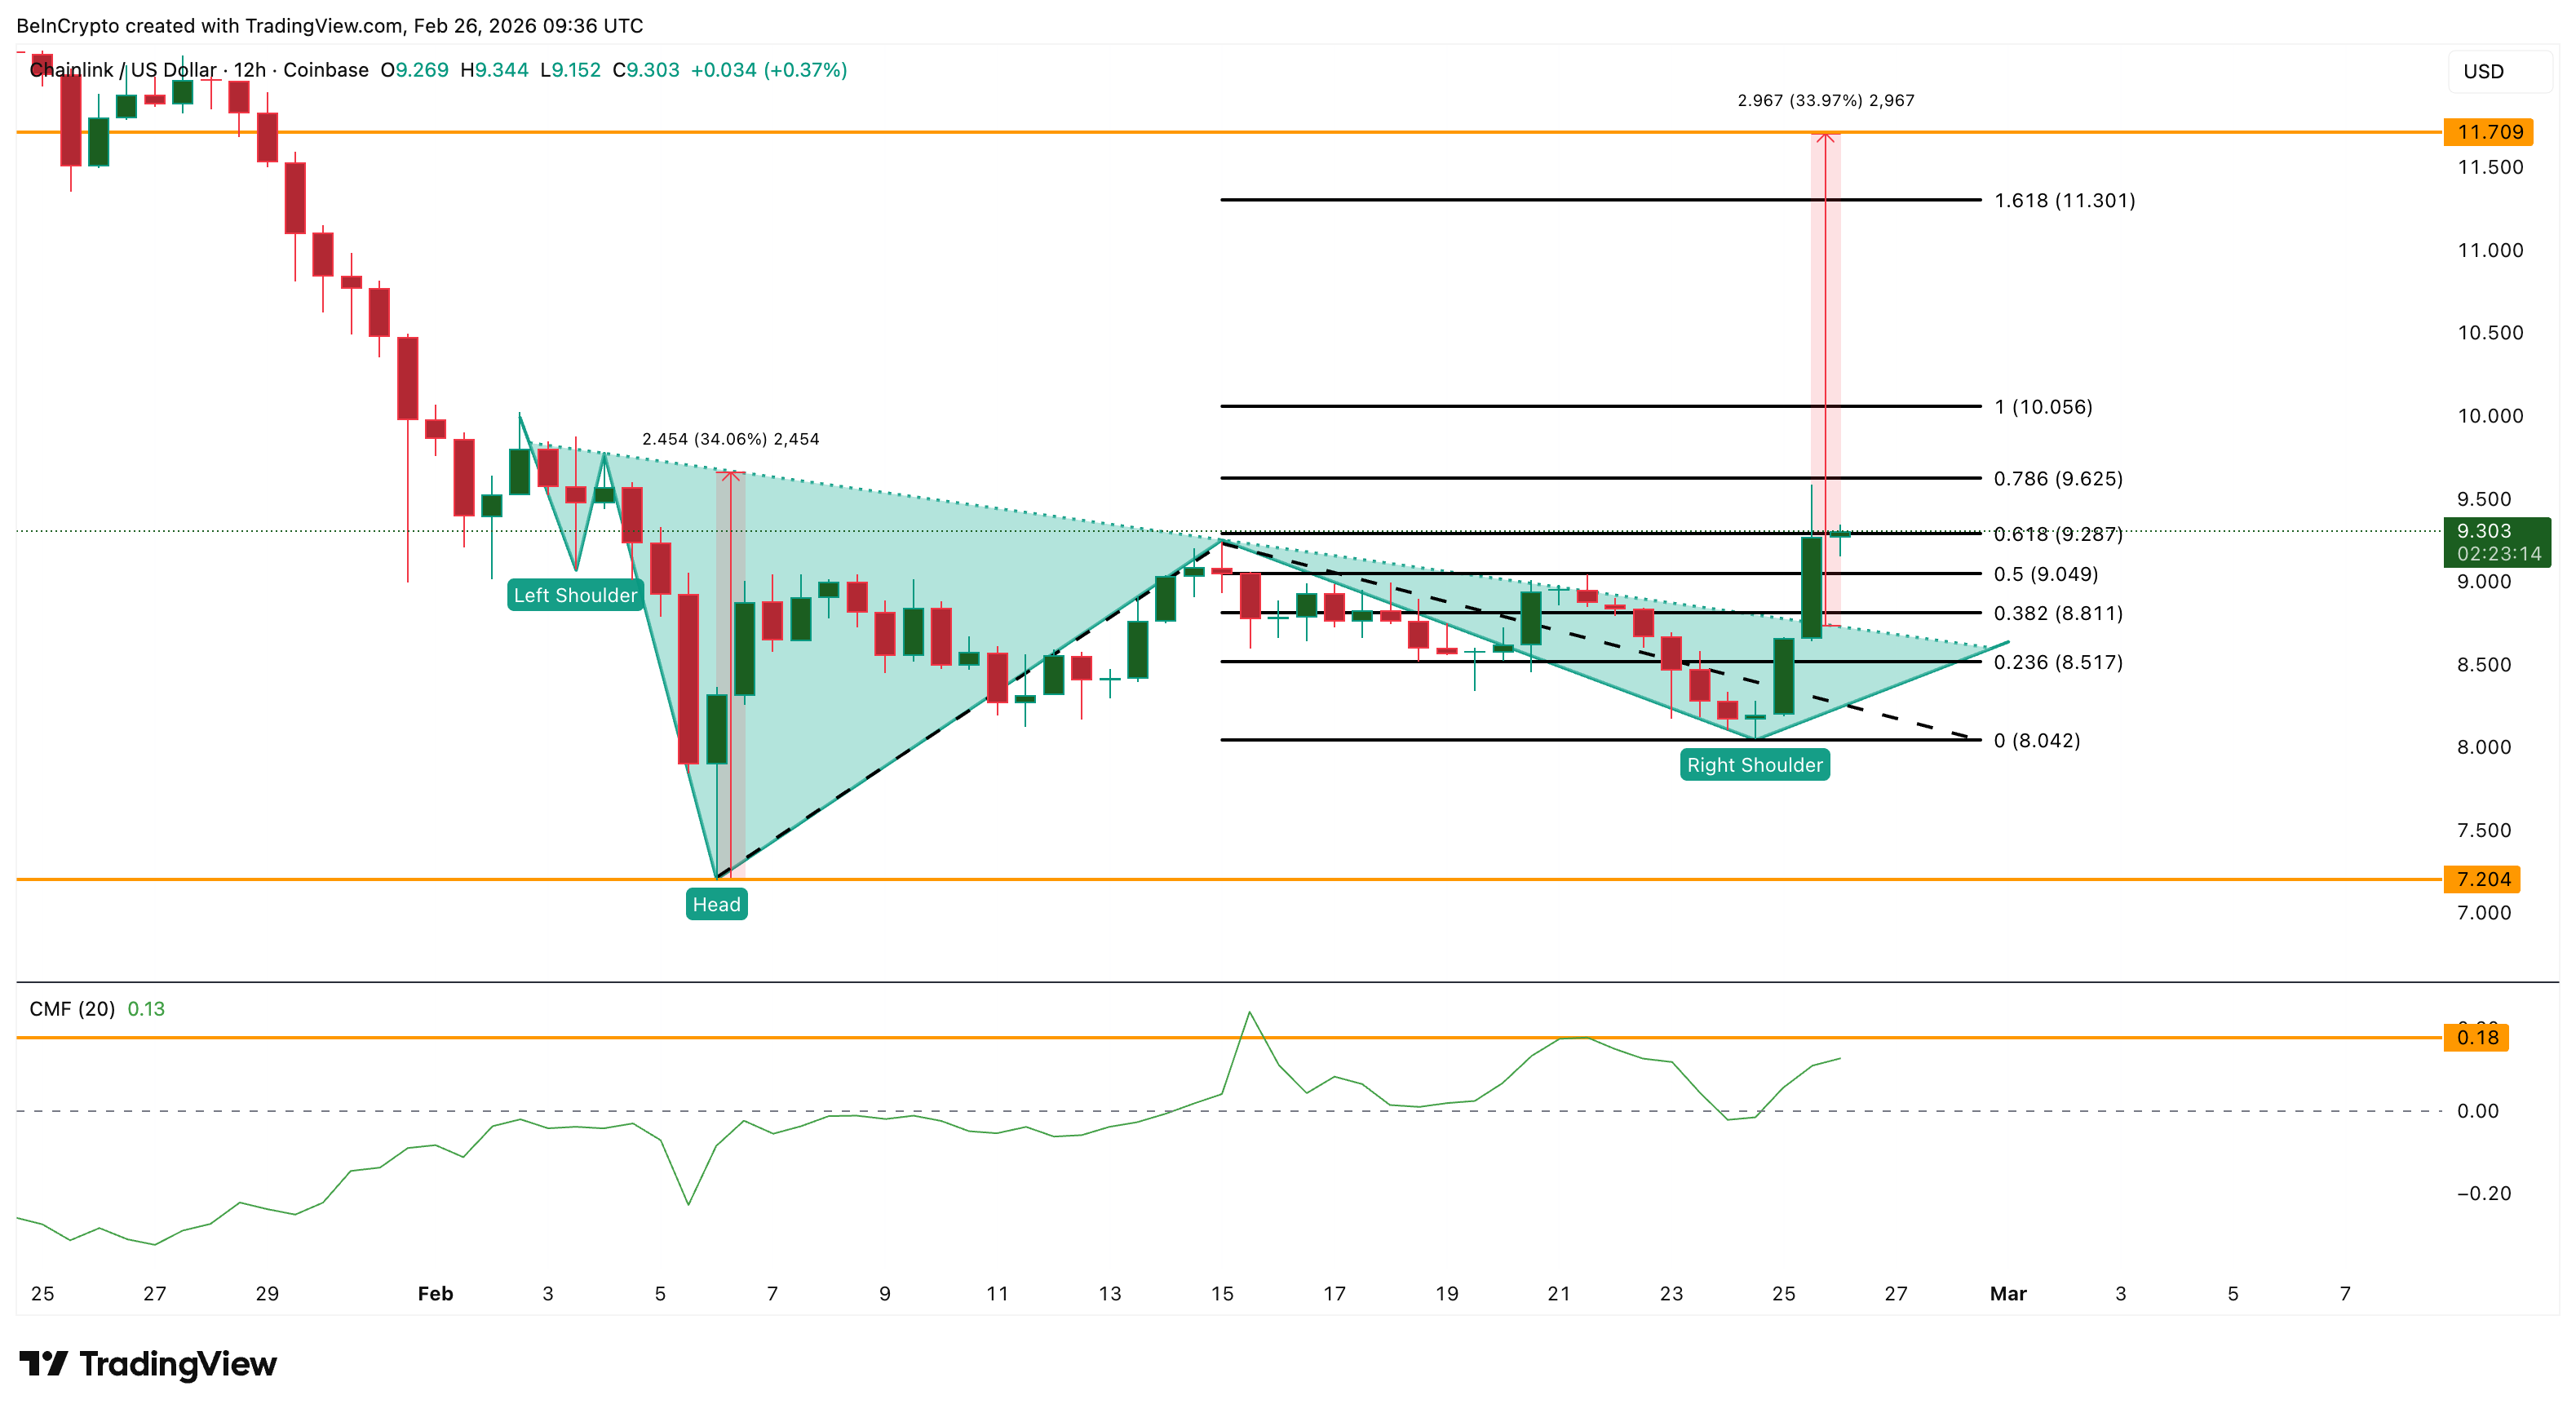
A push toward 0.18 would confirm deepening institutional participation and give LINK the momentum needed for the next leg.
If buying resumes and sentiment holds, a move above $9.62 followed by $10.05 opens the path toward the realized projection target of $11.70.
Invalidation is straightforward. A correction toward $8.51 is the first warning. A close below $8.04 weakens the structure considerably and puts the entire bullish thesis at risk.

Bitcoin price faces growing downside risks after rejecting major resistance near $69,700. Weak bullish volume and loss of key support levels now raise the probability of a corrective move toward $62,000.
Summary
- Rejection at $69,700 0.618 Fibonacci resistance confirms weakness
- Loss of Point of Control signals bearish short-term structure
- $62,000 support becomes next key downside target
Bitcoin’s (BTC) recent recovery rally appears to be losing momentum after price action encountered strong resistance at a critical technical zone. The market briefly pushed higher but failed to sustain acceptance above a key Fibonacci resistance level, signaling exhaustion among buyers.
Bitcoin price key technical points
- Major Resistance: $69,700 aligns with the 0.618 Fibonacci retracement level.
- Structural Shift: Bitcoin has closed below the Point of Control, signaling rejection.
- Downside Target: Weak volume increases the probability of a move toward $62,000 support.
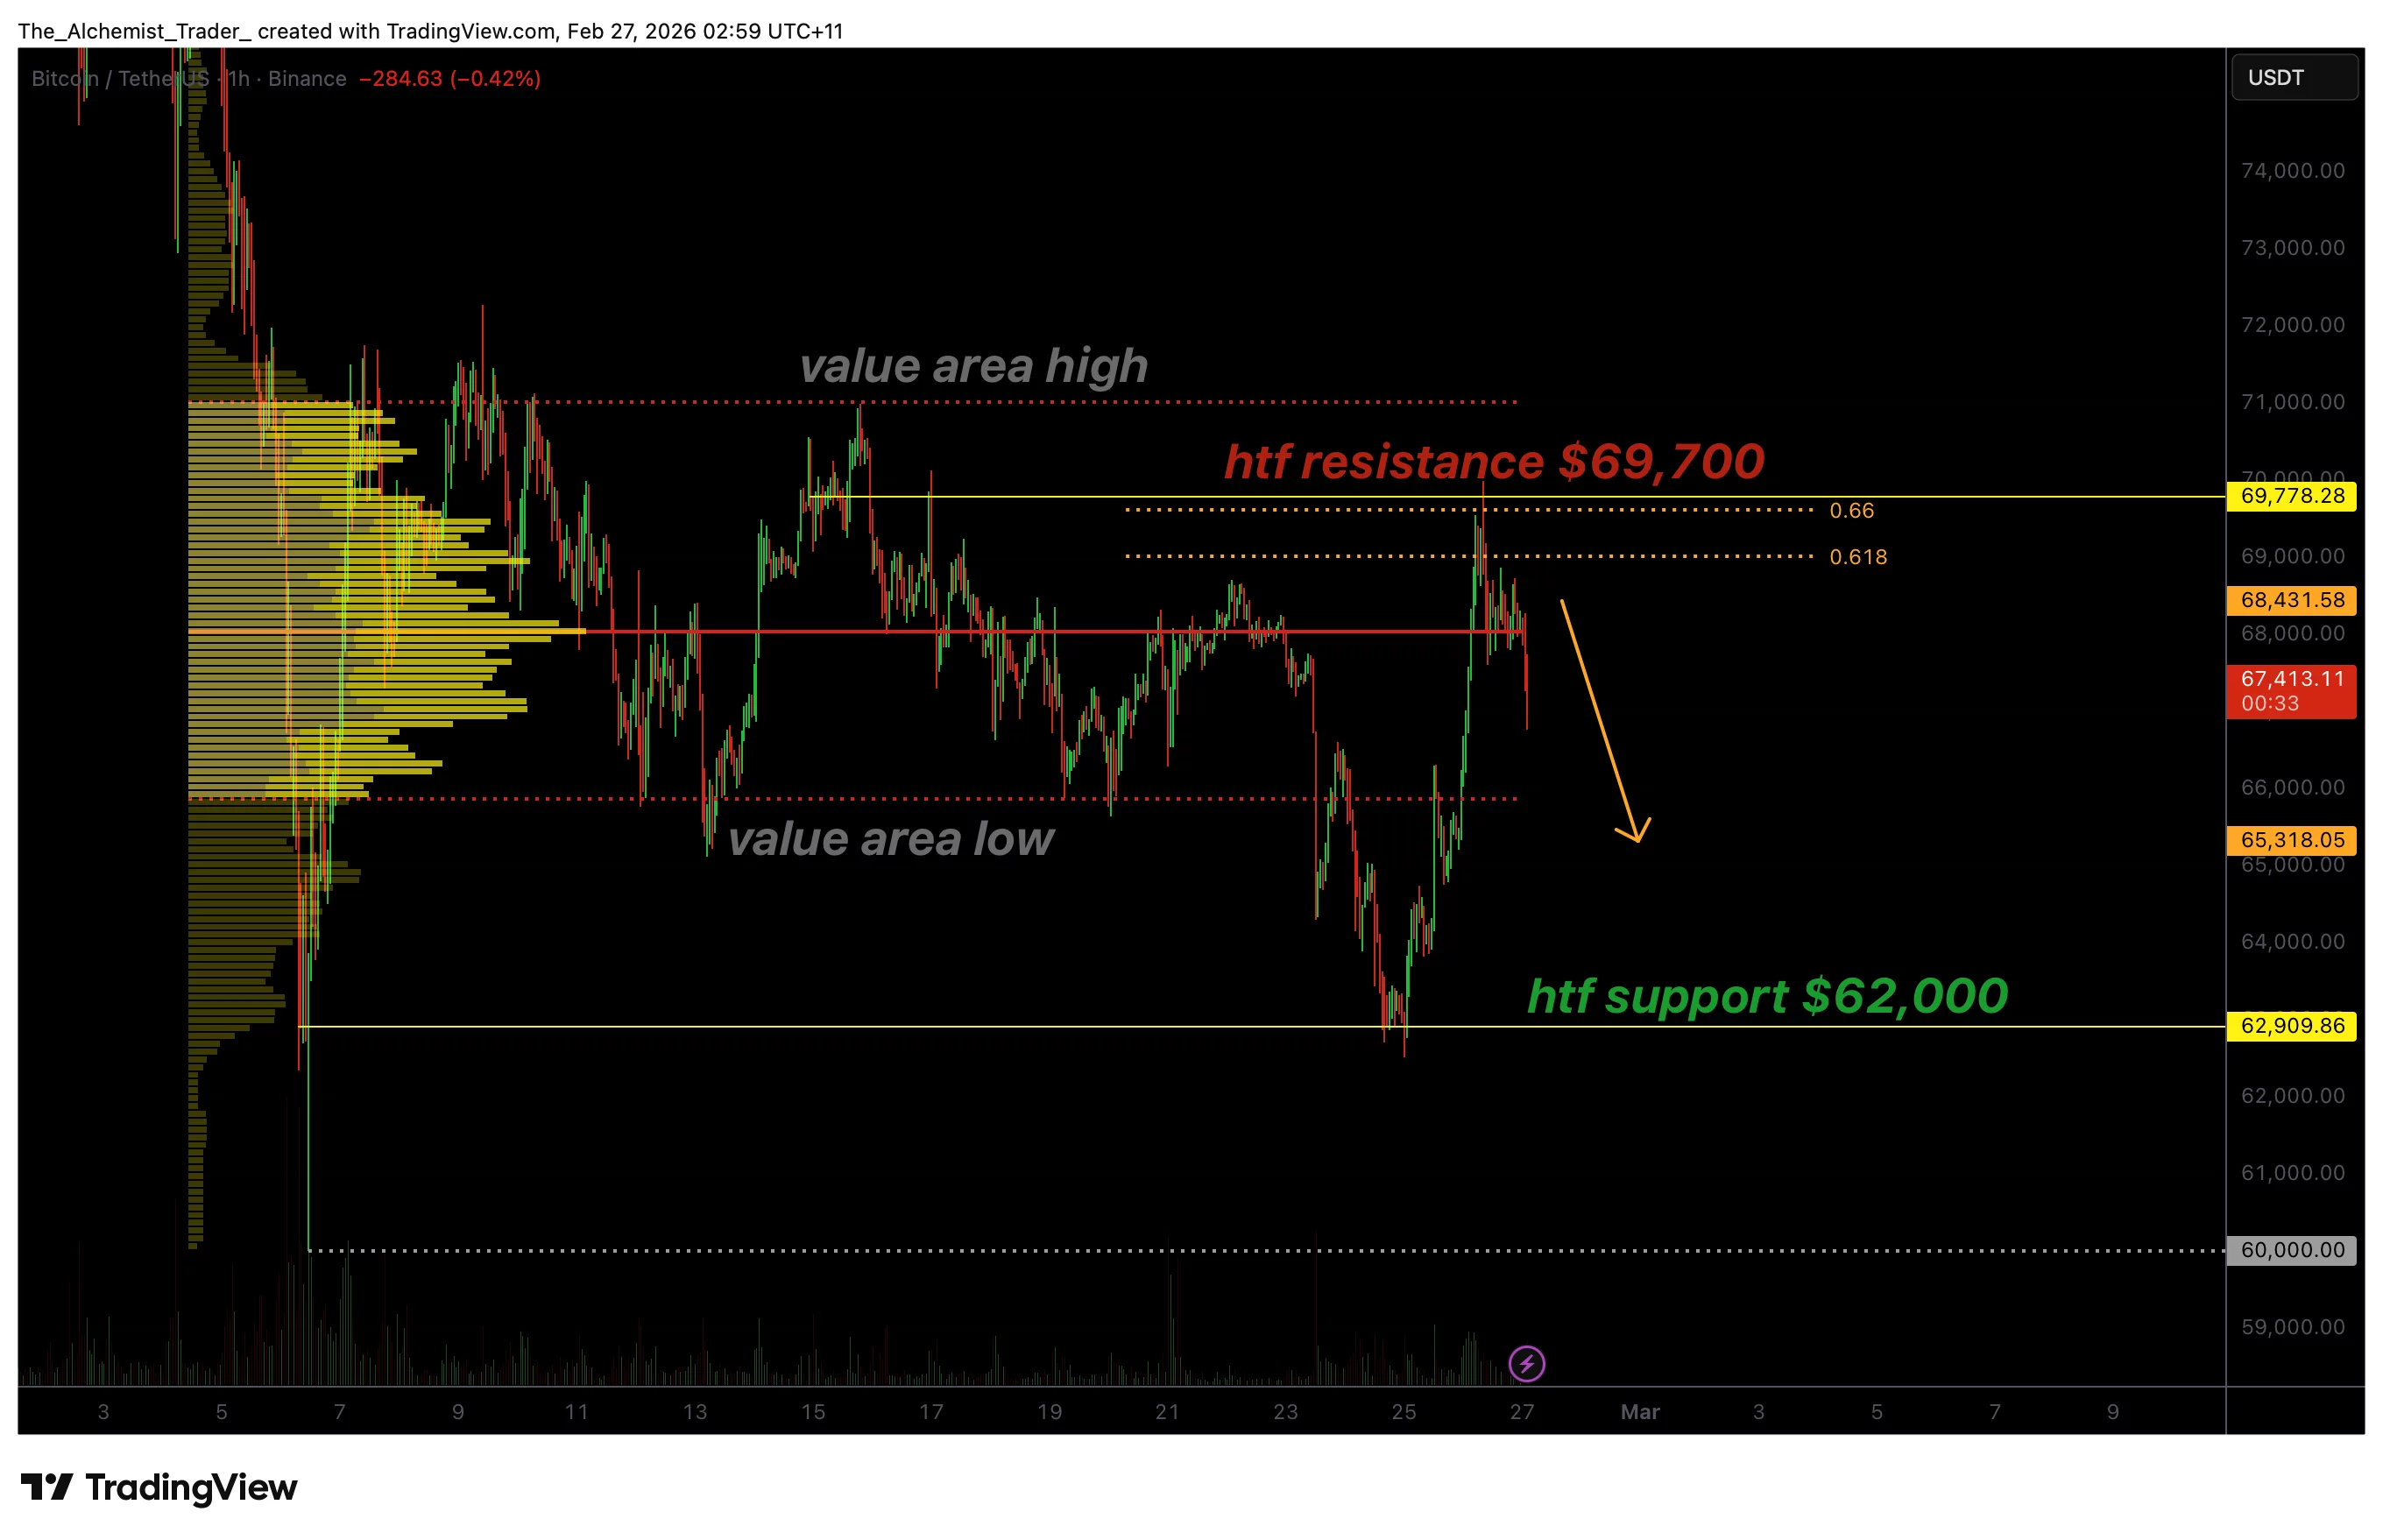
Bitcoin recently traded into a major resistance cluster around $69,700, a region defined by both historical supply and the 0.618 Fibonacci retracement. This level typically represents a decisive barrier during corrective rallies, often separating continuation from rejection. Price action briefly tested the zone but failed to establish acceptance above it, leading to a clear rejection signal.
The rejection becomes more significant when viewed through volume dynamics. Despite the upward move, bullish participation has remained relatively weak compared to prior impulsive expansions. Rising prices without corresponding volume expansion often indicate a lack of conviction among buyers. Instead of sustained accumulation, the rally appears driven more by short-term positioning rather than strong market demand.
Following the rejection, Bitcoin has now moved back below the Point of Control (POC) of the current trading range. The POC represents the price level with the highest traded volume and often acts as equilibrium within a market structure. Losing this level on a closing basis suggests that buyers failed to maintain control, confirming resistance rather than reclaiming it.
This structural development shifts short-term bias toward consolidation or correction, even as Indiana lawmakers approved House Bill 1042, known as the Bitcoin Rights Bill, sending the measure to Governor Mike Braun for final approval and reinforcing ongoing institutional and legislative engagement with digital assets.
From a market structure perspective, Bitcoin remains within a broader trading range rather than a confirmed bullish trend. Failed breakouts at key Fibonacci resistance frequently lead to rotational moves back toward lower liquidity zones. In this case, the next logical destination sits near $62,000, where high timeframe support and prior demand previously triggered strong reactions.
A corrective move toward $62,000 would not necessarily invalidate the broader bullish outlook. Instead, such a pullback could represent a healthy reset following a weak rally attempt. Markets often revisit strong support zones to rebuild liquidity before initiating sustained directional moves. The absence of strong bullish volume during the recent rise reinforces this scenario, suggesting the market may require further consolidation before another expansion phase develops.
Conversely, an increase in bearish volume could accelerate downside momentum toward deeper support zones if sentiment deteriorates further, especially as Bitcoin remains roughly 50% below its all-time high with a growing share of supply now held at a loss following months of sustained selling pressure.
Overall, Bitcoin’s technical landscape currently reflects hesitation rather than strength. The inability to reclaim resistance combined with fading bullish volume suggests that upside momentum is weakening, placing increased importance on upcoming support reactions.
What to expect in the coming price action
Bitcoin’s next directional move will likely depend on whether buyers can quickly reclaim lost volume support. Failure to do so increases the probability of a corrective move toward $62,000, while a reclaim of the POC would invalidate the bearish scenario and restore bullish continuation potential.
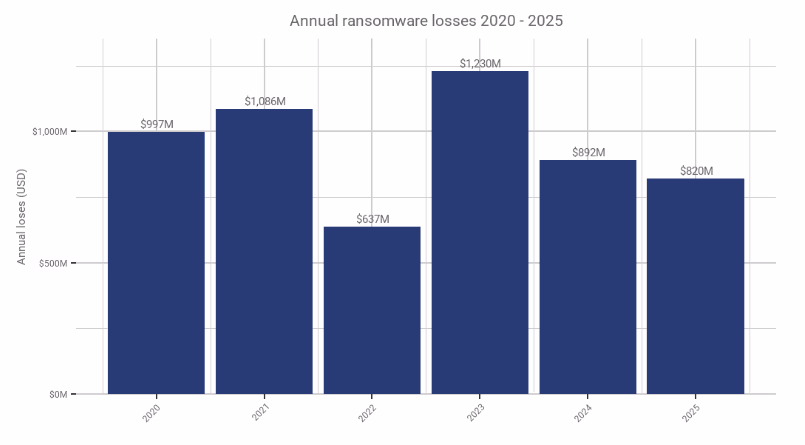
Although hackers made less money overall last year, victims who paid faced far higher bills than a year earlier.
Ransomware crypto payments stalled for a second year in 2025, even as attacks hit record levels and ransom demands jumped. Data from Chainalysis shows that total on-chain payments fell about 8% from a year earlier to roughly $820 million, while claimed attacks rose by about 50%.

The biggest shift was in how much victims paid when they did give in. The median ransom payment surged 368% year-over-year to nearly $60,000 from about $12,700 in 2024.
Jackie Koven, head of cyber threat intelligence at Chainalysis, told The Defiant that the surge in median payment is “likely not related to price,” adding that ransomware actors “anchor their extortion demands in USD or other fiat currencies, not BTC.”
“So if they are demanding $1M, as an example, it doesn’t matter whether BTC is priced at 1M or 10k. The increase in median ransom is more likely related to high outlier payments rather than a return to big-game hunting ransomware tactics that dominated in the past,” Koven explained.

Only 28% of victims paid a ransom in 2025, the lowest rate on record.
“This overall trend is a major win against the ransomware ecosystem. Fewer victim payments mean more work for less for attackers, an important step in shifting the economic incentives,” the report reads.
There were still several high-impact incidents that shaped the year. A cyberattack on Jaguar Land Rover in late August 2025 halted production across multiple countries and caused an estimated $2.5 billion in damage, the costliest cyber incident in UK history.
Retailers and hospitals were also hit hard. Major British multinational retailer Marks & Spencer suffered long outages after an attack tied to the Scattered Spider group, while global healthcare provider DaVita reported exposure of nearly 2.7 million patient records.
The U.S. stayed the top target worldwide, with Canada, Germany, and the UK behind it, and attacks rose sharply in manufacturing, finance, supply chains, and critical infrastructure, Chainalysis says.

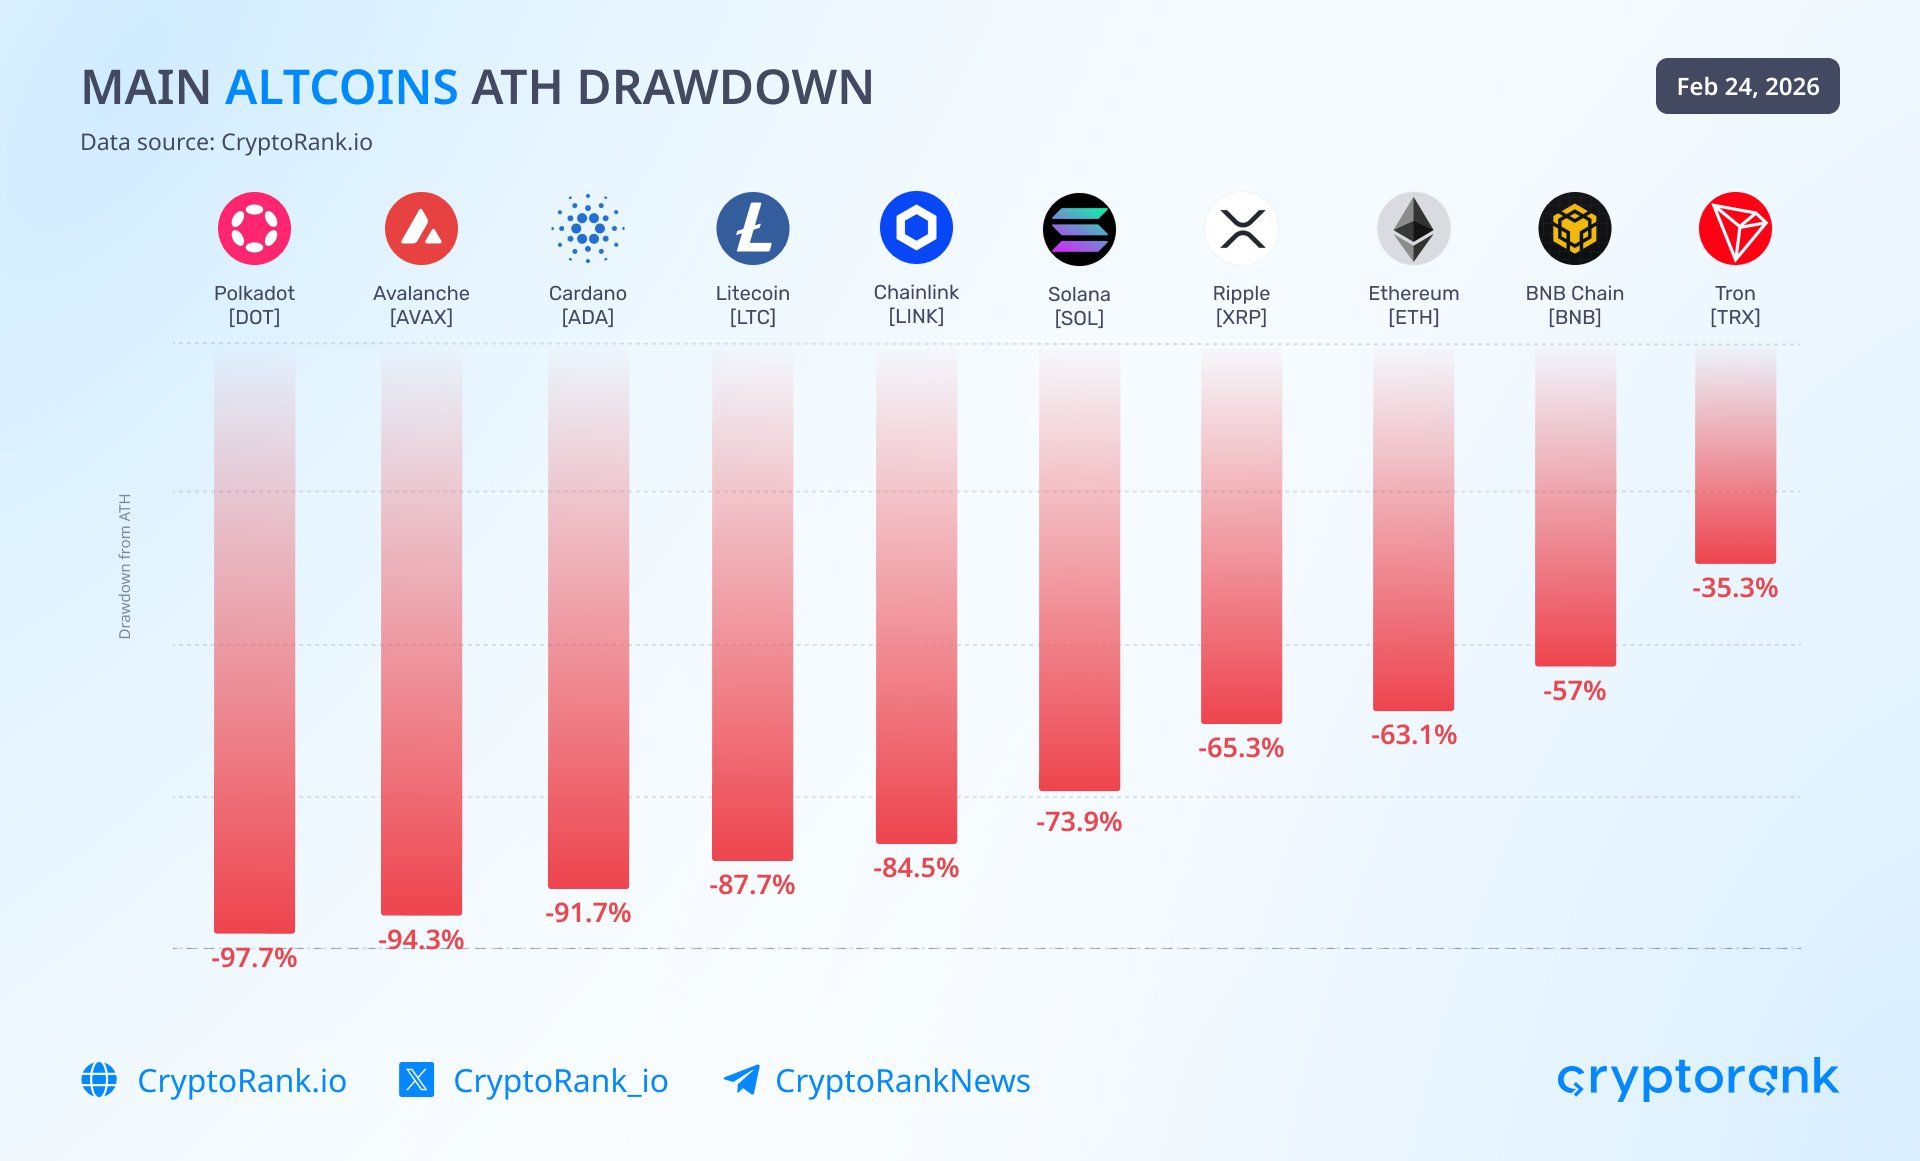
Avalanche (AVAX), a layer-1 blockchain once viewed as a rival to Ethereum in 2021, has seen its price fall more than 94% from its all-time high (ATH). By 2026, the question remains whether any catalysts can help this altcoin stage a comeback.
Behind the disappointing price performance, infrastructure developments and growing institutional adoption are shaping a potentially promising recovery scenario for the ecosystem.
A Boost From Japan: When $2 Billion Moves “On-Chain” With Avalanche
One of the most significant developments strengthening Avalanche’s position is Progmat’s decision to migrate its assets to Avalanche, Japan’s largest digital securities (security token) platform.
More than $2 billion in tokenized real-world assets (RWA), including real estate and corporate bonds, are moving from the Corda platform to Avalanche.
An Avalanche report states that Progmat currently accounts for approximately 63% of issuance volume and 53.8% of projects in Japan’s digital securities market, with total issuance value exceeding ¥216.9 billion. The market is expected to surpass ¥1.05 trillion (approximately $7 billion) by the end of 2026.
Progmat’s decision to choose Avalanche over competing platforms represents a strong endorsement of Avalanche’s technology. The network enables financial institutions to create customized blockchains that comply with regulations while leveraging the security of the main network.
How VanEck Views Avalanche
A recent report from investment firm VanEck outlines the reasons Avalanche continues to maintain its appeal.
VanEck highlights that the system’s core lies in its Snowman consensus mechanism. This mechanism allows block production in just 1.2 seconds and achieves near-instant transaction finality.
“Avalanche competitor Ethereum produces blocks every 12 seconds while finality takes around 12.8 minutes. This allows Avalanche users to recognize settlement of their transactions within a few seconds, giving the chain significant practical advantages for financial use cases,” the VanEck report states.
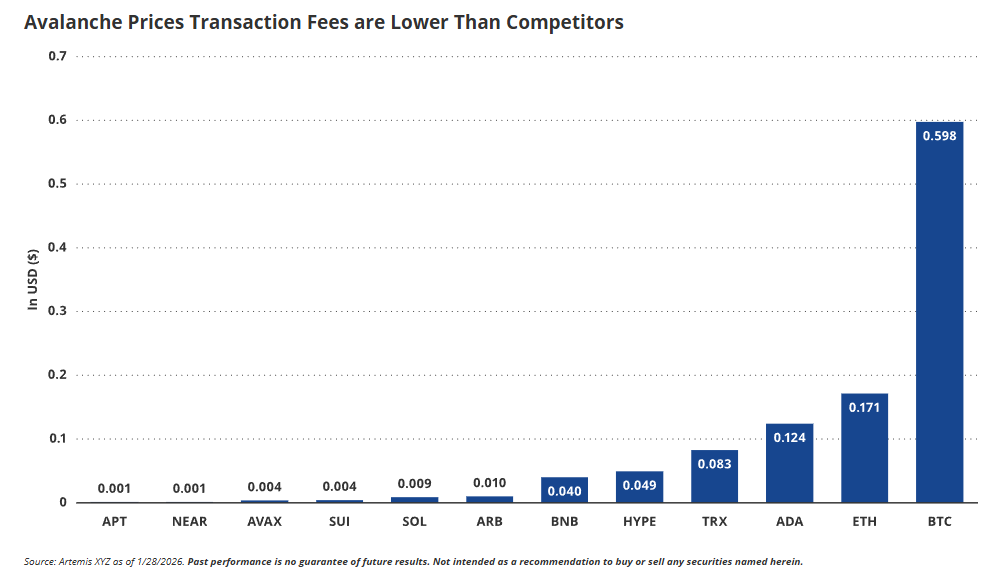
The report also emphasizes that Avalanche’s lower transaction fees compared to competitors provide a competitive advantage.
In addition, VanEck’s spot Avalanche ETF remains the only AVAX ETF currently trading on the market.
However, data indicate that investor demand for exposure remains modest. After one month of trading, total net assets reached $11.5 million. By comparison, LINK ETFs have attracted more than $81 million, while SOL ETFs have surpassed $800 million.
Can AVAX Regain Its Former Glory?
A report from CryptoRank shows that among leading altcoins, AVAX and DOT have experienced the worst drawdowns, each exceeding 94%. Such a decline represents a major shock for many investors.
However, Data from Avalanche signals positive momentum in February as users return to the network. Daily active addresses climbed above 1,300,000, marking the highest level in this layer-1 blockchain’s history.
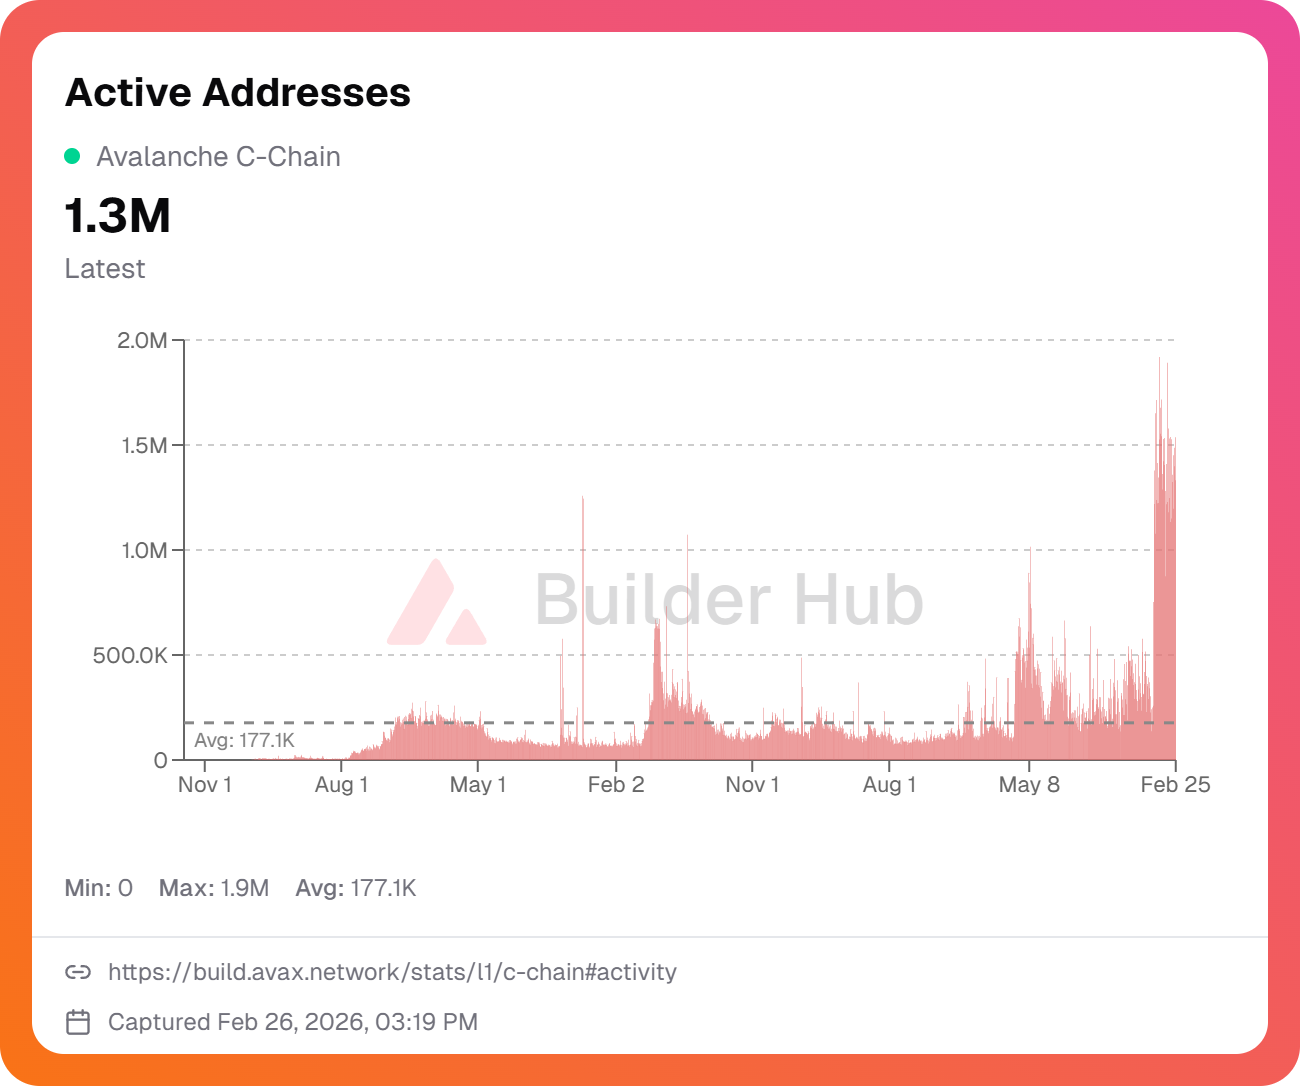
“AVAX’s new slogan should be: Believe in the tech, not in the price,” investor Emperor Osmo stated.
A recent report by BeInCrypto also points to widespread negative sentiment, prompting many investors to hesitate before allocating capital. However, when capital flows return, projects with strong fundamentals may become priority choices for investors.
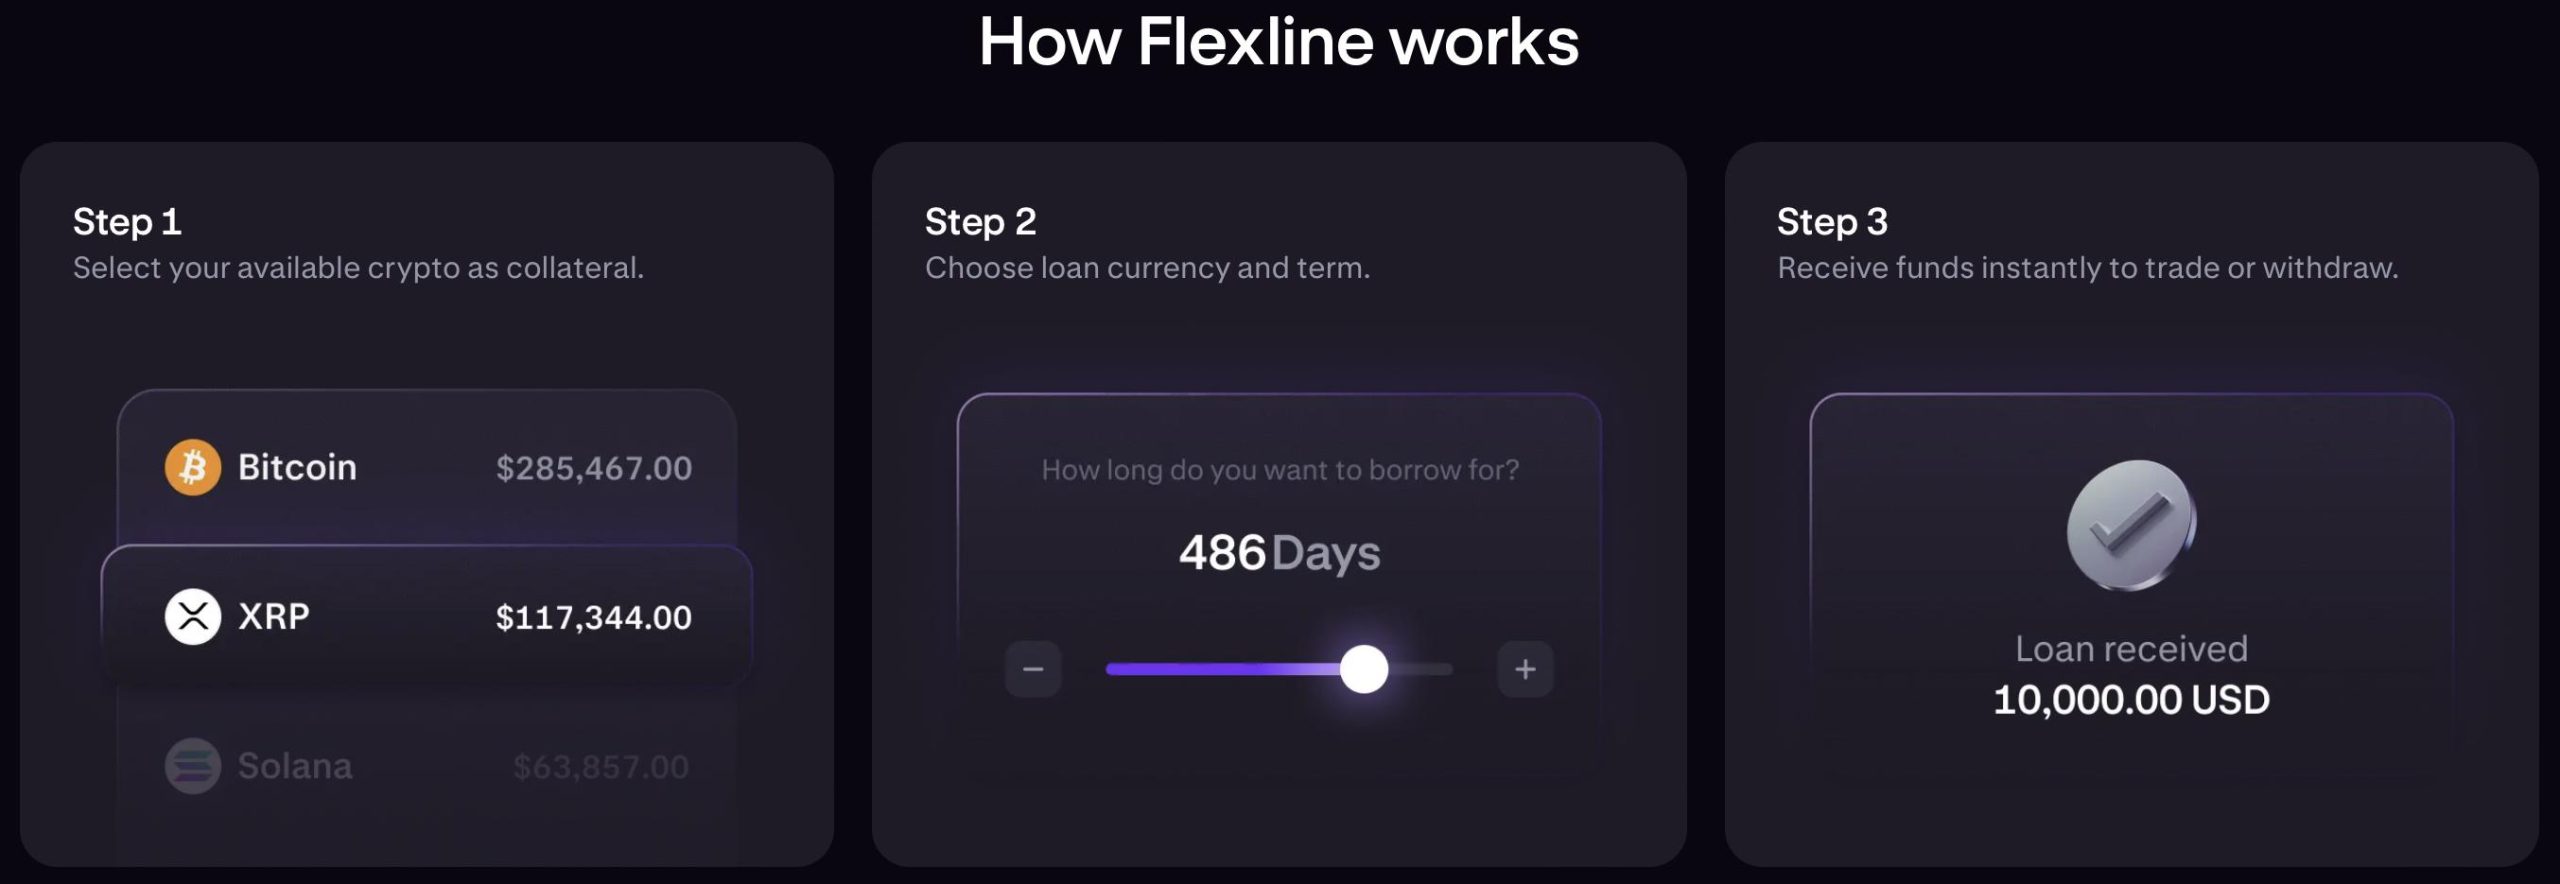
Kraken introduces Flexline for Pro users
Kraken has introduced Kraken Flexline, a crypto-backed loan product to Kraken Pro members. The service enables users to borrow against supported digital assets without the need to sell their holdings. The company targets advanced and institutional traders through its Pro platform.
Flexline provides two-day to two-year-term, fixed-rate loans. Borrowers will be able to get proceeds in cryptocurrencies or stablecoins. Therefore, eligible users may trade the funds on the platform or withdraw them, depending on jurisdictional rules. Kraken has restricted access in several countries, including the United States and the United Kingdom.
Annual percentage rates range from 10% to 25%, according to the exchange’s website. Kraken has not disclosed specific loan-to-value ratios. Users may repay loans early through their account balances, although early repayment fees apply.
Collateral structure and risk controls
Kraken demands borrowers to post supported cryptocurrencies as collateral. The funds are credited to the platform virtually immediately upon approval. The exchange maintains collateral in segregated wallets and incorporates it into its Proof of Reserves attestations, which certify client assets on a 1:1 basis.

Source: Kraken
Kraken can sell off collateral in case a borrower does not meet maintenance obligations or does not repay the loan before the maturity date. According to the exchange, these controls are meant to contain credit risk and ensure transparency. The company markets the product as a formalized alternative to unstructured crypto lending services at variable rates.
Crypto-backed lending gains momentum across exchanges, DeFi and traditional finance
Kraken’s launch follows renewed revival of crypto-backed lending markets. Coinbase has recently increased its collateral loan provision. US eligible users are now able to borrow up to $100,000 in USDC with collateral against assets like XRP, Dogecoin, Cardano, and Litecoin.
Holding XRP, DOGE, ADA, or LTC?
Now you can unlock the value of your portfolio without giving up your position.
Borrow up to $100k in USDC against your tokens, instantly, without selling.
Available now in the U.S. (ex. NY). pic.twitter.com/Uozxim3t7C
— Coinbase 🛡️ (@coinbase) February 18, 2026
Decentralized finance lending protocols also continue to grow. DeFiLlama data indicates that the sector carries a total value of approximately $51.9 billion, of which nearly $30.8 billion is borrowed. Apollo Global Management also ventured into the space by partnering in the blockchain-based lending infrastructure.
The trends signal continued interest in crypto-backed liquidity solutions in exchanges, DeFi and traditional finance.

XRP has a liquidity problem that has nothing to do with price: More than 2 billion tokens, or about 3.5% of the circulating supply, aren’t actually circulating.
The tokens, valued around $3 billion, are held in wallets from Xaman, and are largely locked out of decentralized finance (DeFi). To access DeFi means downloading new wallets, bridging assets across chains, managing gas tokens and navigating unfamiliar interfaces. Most holders never bothered.
Now, Xaman said it has reached an agreement with the Flare blockchain that will reduce the process into a single transaction, allowing users to deposit their XRP directly into a curated vault on the Flare blockchain.
The system rests on three components working in the background.
First are FAssets, which create a trust-minimized representation of XRP on Flare — effectively a wrapped version of the token that can interact with smart contracts. Then come Flare Smart Accounts, which abstract away the need for users to manage a second wallet. Instead of juggling private keys across chains, users authorize transactions with their existing XRPL credentials. Finally, Xaman acts as the front-end, embedding the process directly inside the wallet many XRP holders already use.
From the user’s perspective, the process is reduced to a single action. Behind the scenes, the transaction carries detailed instructions. Flare’s Data Connector validates the request, while Smart Account controllers handle the minting of the wrapped asset, allocation into vault strategies and any subsequent yield distribution. What would typically require bridging assets, acquiring gas tokens and interacting with multiple decentralized applications is compressed into one workflow.
“This integration lets our users explore new options directly from the wallet they already know, while keeping full control of their keys and decisions,” said Wietse Wind, founder of Xaman, in a statement to CoinDesk.
The vault strategies themselves are managed by Upshift and curated by Clearstar, which oversee capital deployment and risk management. While specific yield targets were not disclosed, the strategies are built around familiar DeFi primitives such as lending markets, collateralized positions and structured products.
There are early signs that XRP holders are willing to experiment. Flare’s FXRP — its existing wrapped XRP token — has surpassed 100 million in minted supply, with more than 60 million currently deployed across staking programs and structured products. That growth suggests at least some appetite for putting XRP to work, rather than leaving it idle.
The broader backdrop makes the timing notable. XRP rose 6% earlier this week amid a 212% spike in retail buying volume, and exchange-traded fund inflows have remained positive since their November launch. Yet much of that activity reflects directional bets on price.
For XRP’s DeFi ambitions — sometimes dubbed “XRPFi” — the bigger challenge has been usability, not demand. If billions of dollars’ worth of tokens are effectively stranded by friction, lowering that friction may matter more than another rally. Infrastructure that turns passive holdings into productive capital could determine whether XRP’s DeFi narrative evolves beyond branding.

Editor’s note: Nvidia’s latest earnings release highlights a booming AI infrastructure cycle, with the company topping expectations and guiding $78 billion for Q1 FY2027. The data centre segment led growth while margins remained robust as hyperscale customers expand their AI deployments. This preview frames a broader trend: AI-ready data centres are becoming the core engine of digital transformation, and Nvidia sits at the center of that wave.
Key points
- NVIDIA (NASDAQ: NVDA) guides Q1 FY2027 revenue midpoint of US$78 billion, above consensus.
- Q4 revenue reached US$68.13 billion, with data centre revenue at US$62.3 billion.
- Data centre revenue accounts for about 91% of total revenue, with gaming softer due to supply constraints.
- Networking revenue surged 263% YoY to US$11 billion; inventory/capacity commitments total US$95.2 billion.
- Hyper-scaler AI infrastructure spending projected at US$650 billion for 2026, driven by Microsoft, Amazon, Google and Meta.
Why this matters
The results reinforce that the AI infrastructure cycle is accelerating, not slowing. Strong data centre demand, high gross margins at 75.2%, and large-scale capacity commitments suggest durable momentum as AI workloads drive broader data-centre re-architecture. The report notes that China data centre revenue could add upside if export restrictions ease.
What to watch next
- Any changes to export restrictions affecting China data centre revenue and potential upside to guidance.
- Trends in data centre demand and Nvidia’s inventory/capacity commitments amid hyperscaler spending.
- Gaming segment performance and supply constraints ahead of Q1.
- Progress of AI infrastructure investments by Microsoft, Amazon, Google, and Meta.
Disclosure: The content below is a press release provided by the company/PR representative. It is published for informational purposes.
Nvidia earnings underscore accelerating AI infrastructure boom
Abu Dhabi, UAE – February 26, 2026: Nvidia has once again delivered a standout set of earnings, beating expectations across the board and, crucially, surpassing its own forward guidance. The company guided Q1 FY2027 revenue to a midpoint of US$78 billion, comfortably ahead of the US$72.78 billion analysts had forecast. Notably, this guidance assumes zero data centre revenue from China, meaning any easing of export restrictions would represent pure upside not currently priced in.
Quarterly revenue reached US$68.13 billion, ahead of consensus expectations of approximately US$65.9 billion. Data centre revenue surged to a record US$62.3 billion, exceeding the US$60.4 billion forecast, while adjusted earnings per share came in at US$1.62 versus expectations of US$1.53. Profit for the quarter totalled US$43 billion — a figure that exceeds Nvidia’s entire annual revenue as recently as 2023. For a company of this scale to sustain such rapid expansion underscores the structural strength of demand.
Gross margins of 75.2% also came in ahead of forecasts, helping to dispel concerns about profitability as the Blackwell platform continues to ramp up. The results send a clear message that the AI infrastructure buildout is not slowing — it is accelerating. Despite recurring scepticism each quarter, Nvidia continues to demonstrate the durability of this cycle.
Spending commitments from Microsoft, Amazon, Google and Meta — collectively projected at US$650 billion for AI infrastructure in 2026 — highlight the scale of investment driving this trend. Nvidia sits firmly at the centre of that wave. Networking revenue alone surged 263% year-on-year to a record US$11 billion, reflecting that the AI transformation extends beyond chips to the full-scale re-architecture of data centres.
The company has secured US$95.2 billion in inventory and capacity commitments, nearly double the level from a year ago, ensuring it can meet demand from hyperscalers operating at unprecedented scale. Gaming was the only softer segment, with supply constraints expected into Q1, but with data centre revenue now accounting for 91% of total revenue, it is no longer the primary growth driver.
Since the emergence of ChatGPT, Nvidia’s data centre revenue has grown nearly thirteenfold. As the AI race intensifies and big tech spending remains at historic highs, Nvidia continues to position itself as the essential enabler of the AI ecosystem — reinforcing why it is widely regarded as the engine powering this technological shift.
About eToro
eToro is the trading and investing platform that empowers you to invest, share and learn. We were founded in 2007 with the vision of a world where everyone can trade and invest in a simple and transparent way. Today we have 40 million registered users from 75 countries. We believe there is power in shared knowledge and that we can become more successful by investing together. So we’ve created a collaborative investment community designed to provide you with the tools you need to grow your knowledge and wealth. On eToro, you can hold a range of traditional and innovative assets and choose how you invest: trade directly, invest in a portfolio, or copy other investors. You can visit our media centre here for our latest news.
XRP price has struggled to mount a decisive recovery in recent weeks, yet it continues to defend a critical support level. The altcoin has avoided a deeper breakdown despite repeated tests of lower price zones. This resilience suggests underlying accumulation.
Investor sentiment initially leaned cautiously. However, from spot markets to derivatives, traders appear to be preparing for a potential rebound.
XRP Is Not Too Deep Underwater
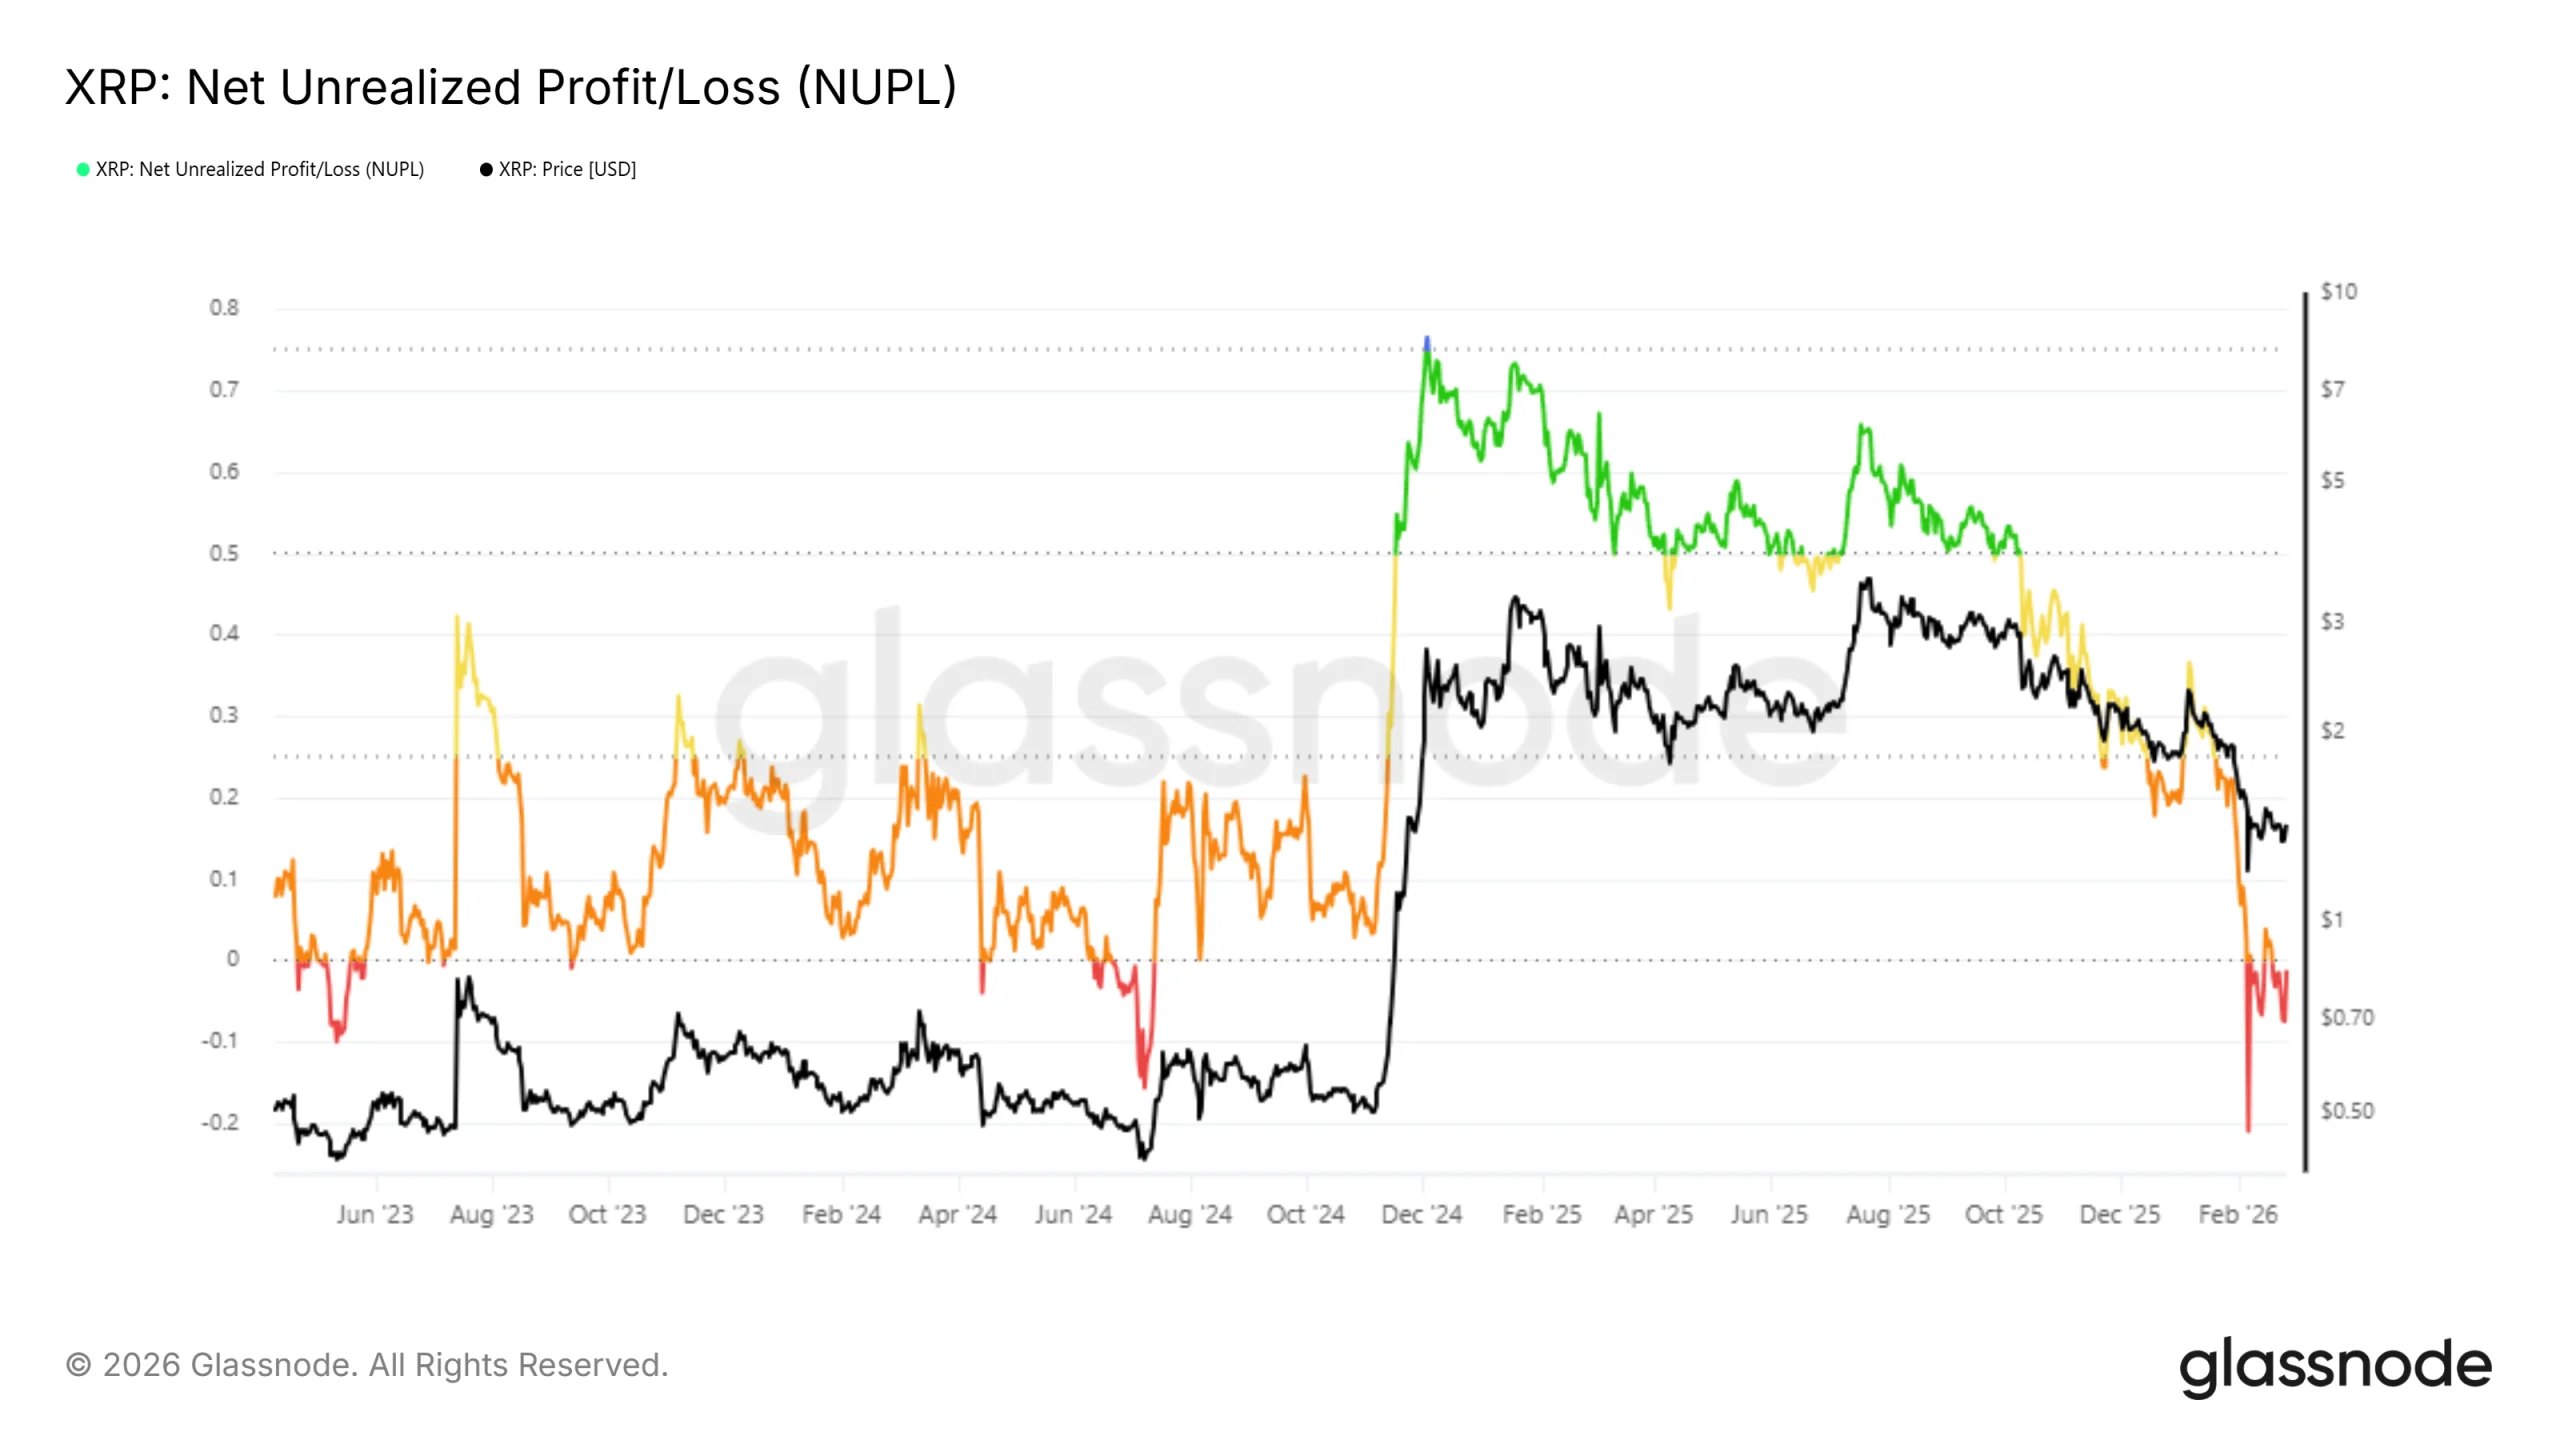
Net Unrealized Profit and Loss, or NUPL, indicates XRP is in a capitulation phase but not deeply so. The metric is currently hovering around the zero line. This position reflects that losses among holders are declining, nearing neutral conditions rather than extreme loss realization.
Historically, XRP has remained in the capitulation zone for extended periods, sometimes lasting up to a month. These phases often precede rebounds once selling pressure exhausts. The current stretch is nearing the one-month mark, suggesting a potential inflection point may be approaching.
Want more token insights like this? Sign up for Editor Harsh Notariya’s Daily Crypto Newsletter here.

How Are XRP Traders and Holders Reacting?
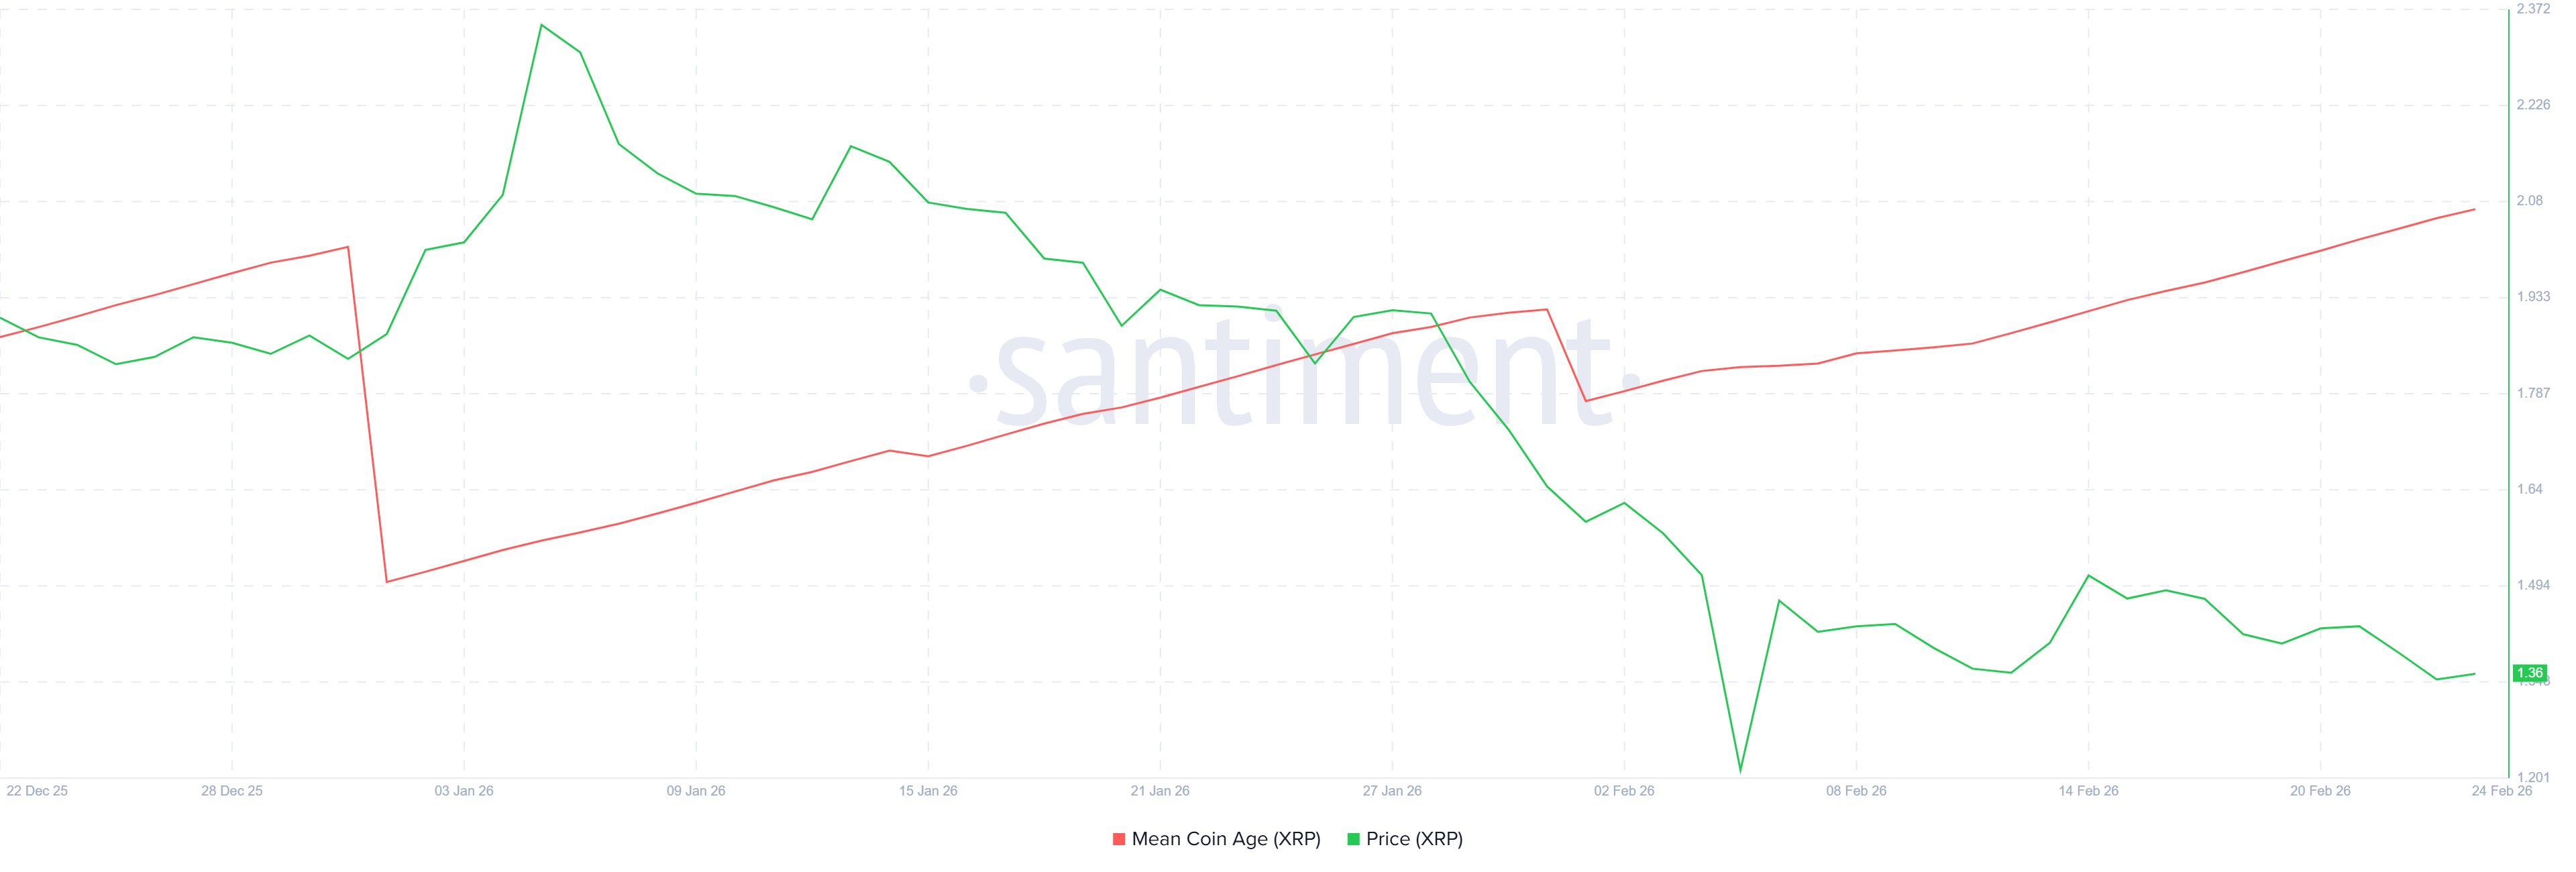
Mean Coin Age, or MCA, offers additional insight into holder behavior. Ahead of a potential bounce, XRP long-term holders appear to favor accumulation over distribution. Rising MCA values typically indicate coins are aging in wallets rather than being spent or sold.
Aside from a minor dip, XRP long-term holders have maintained a constructive stance. Continued accumulation reduces circulating supply pressure. Sustained conviction among these investors often supports structural price recovery over time.
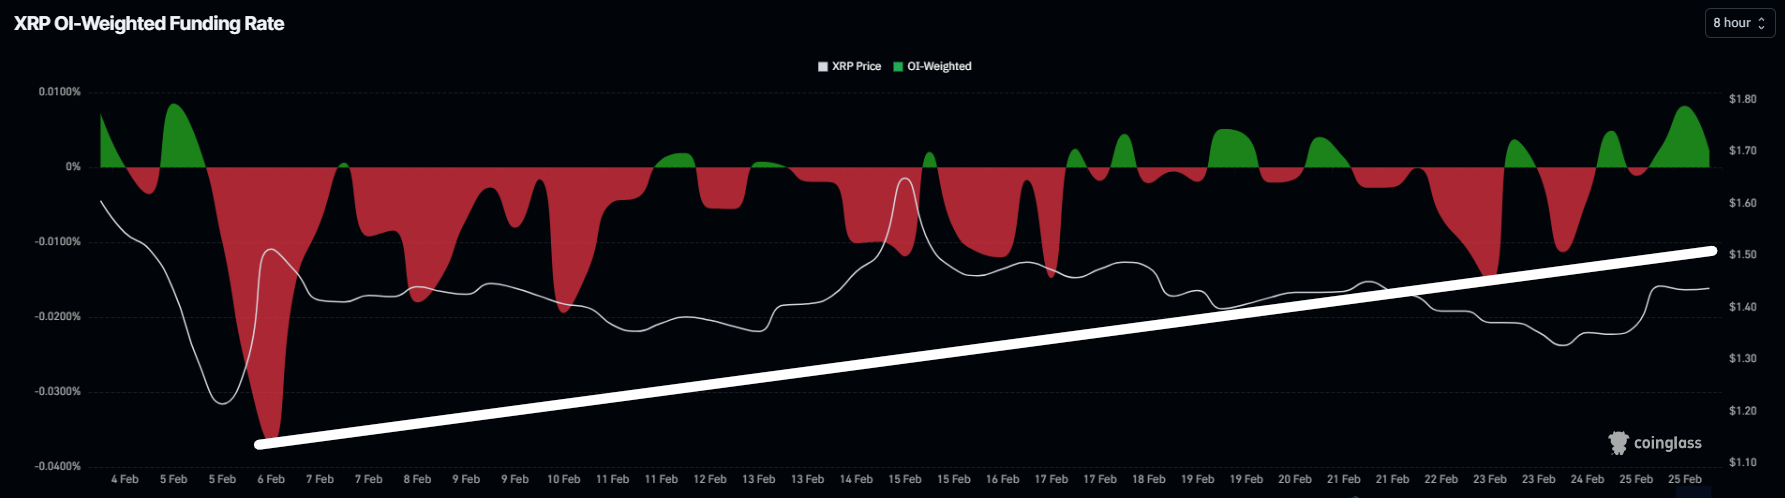
Derivatives market data mirrors developments in spot trading. XRP Funding rates have shifted meaningfully over the past three weeks. Previously deeply negative readings have transitioned to modestly positive territory.
A positive funding rate reflects the dominance of long positions over short positions. This dynamic signals improving trader confidence. Increased long exposure can generate upward pressure as demand strengthens through leveraged positioning.
XRP Price Holds Above Support Floor
XRP is trading at $1.43 at the time of writing, hovering near the 38.2% Fibonacci retracement level. The 23.6% retracement, often viewed as a bear market support floor, remains intact. Sustained trading above this threshold reinforces structural stability.
Holding above the bear market support floor suggests limited immediate bearish pressure. If improving sentiment persists, XRP could challenge the $1.53 resistance level. A successful breakout may push the token toward $1.62. Flipping the 61.8% Fibonacci level into support would confirm a recovery phase.
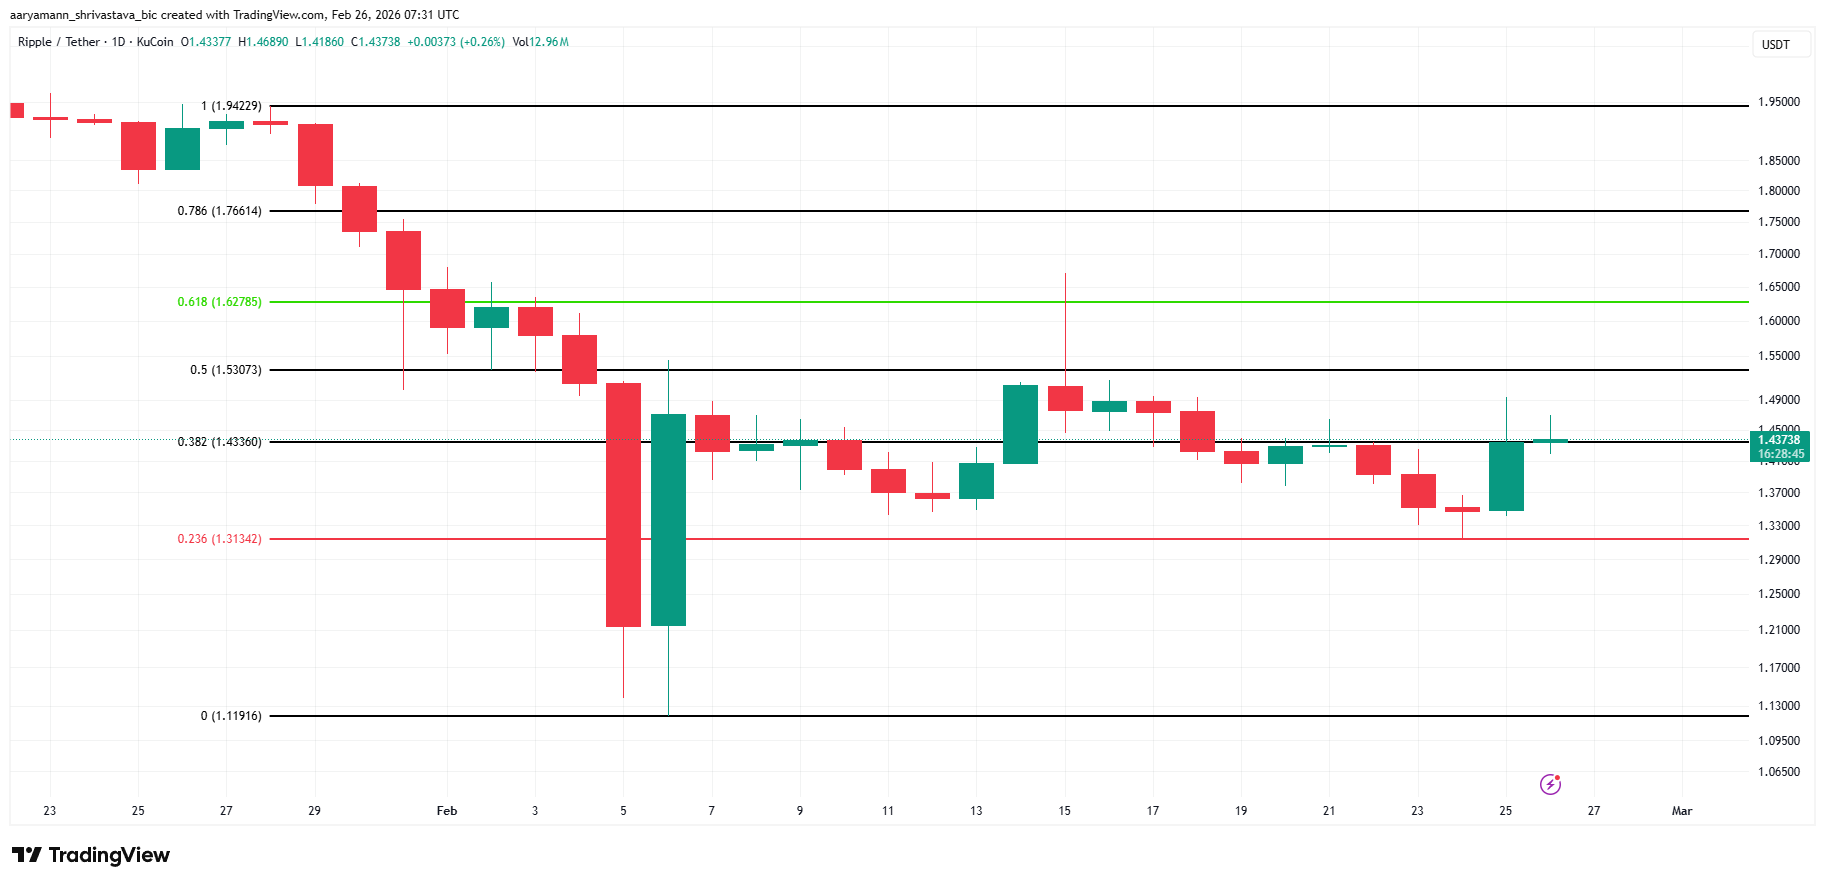
Conversely, weaker macro conditions could delay upside progress. Failure to clear $1.53 may extend consolidation. Continued range-bound trading would invalidate the short-term bullish thesis. Without stronger demand, XRP may remain subdued until broader crypto market momentum improves.

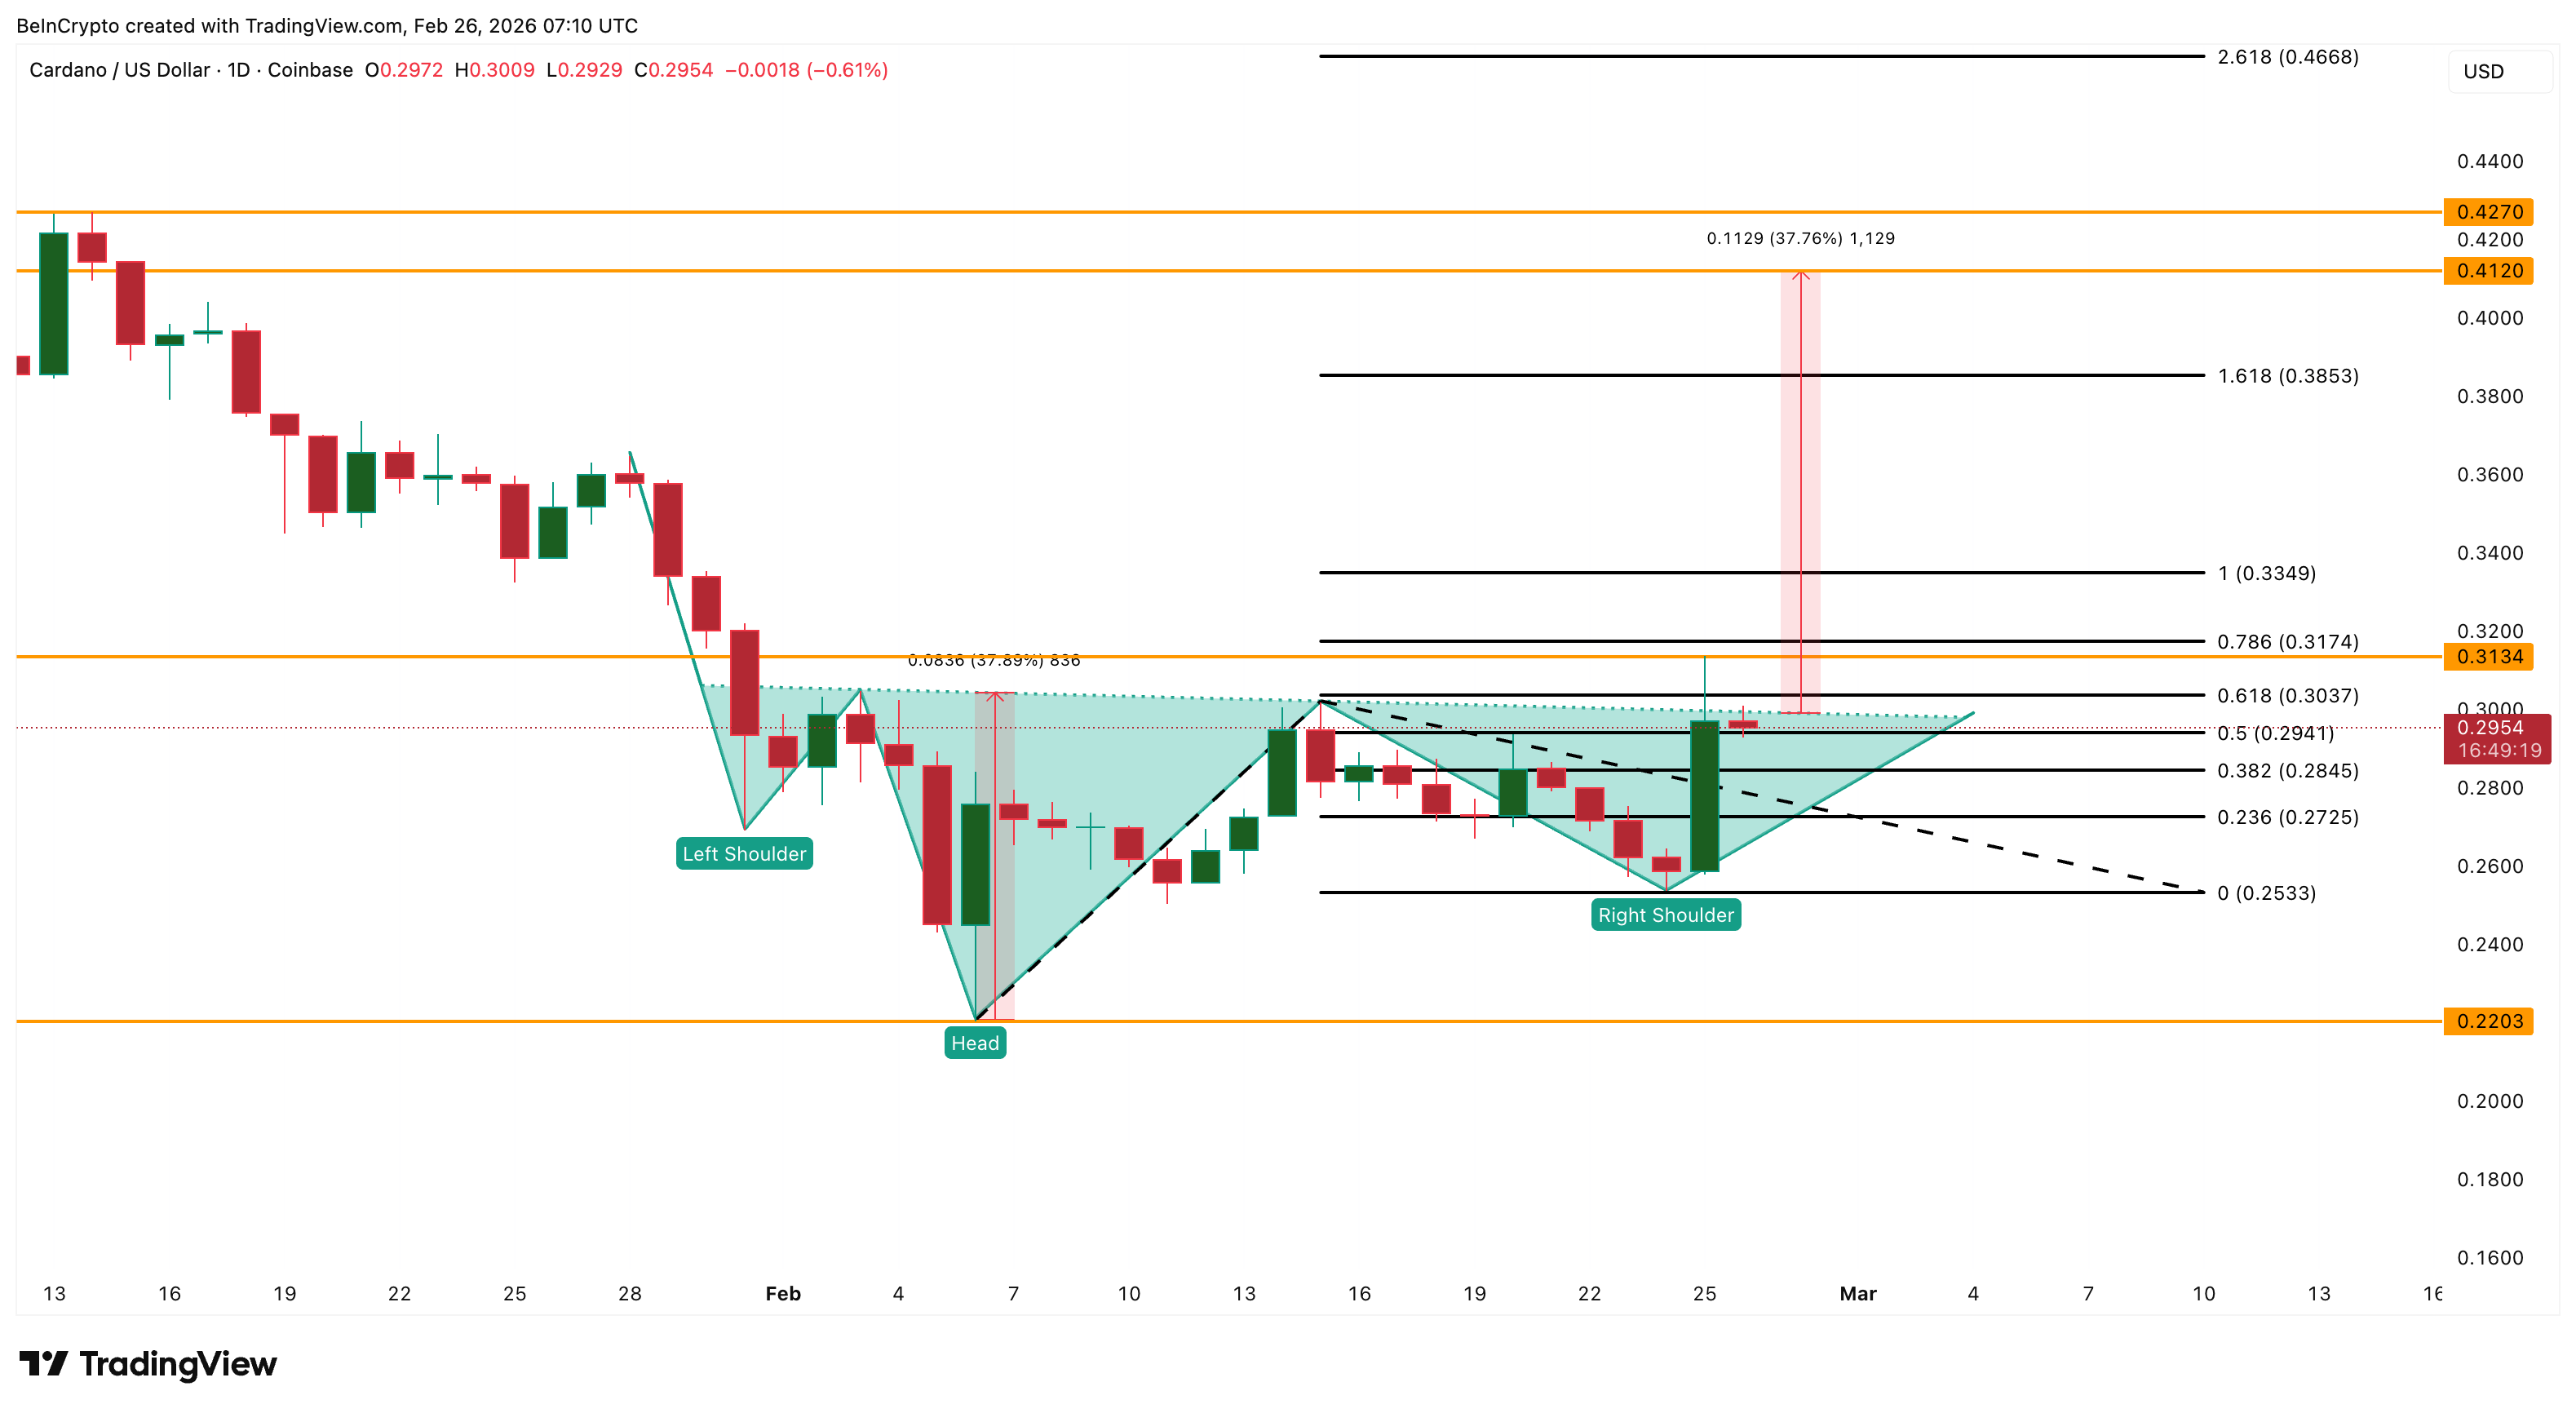
The Cardano price is still up nearly 12% over the past 24 hours, holding near $0.29 after rebounding from its recent lows. On the surface, this looks like the start of a larger recovery. The price even attempted a breakout that projected a roughly 38% rally toward $0.41. But that breakout has failed so far.
The rejection was not sudden. It happened despite massive whale buying worth about $340 million. The real story is deeper. Multiple hidden forces, including conflicting whale activity and liquidation risk, quietly blocked the rally.
Bullish Divergence And Breakout Setup Initially Pointed To A 38% Rally
The recovery setup began forming weeks earlier. Between January 31 and February 24, the Cardano price formed a lower low. This means the price dropped to a new bottom compared to the previous swing. Normally, that signals weakness. But at the same time, the Relative Strength Index (RSI) formed a higher low.
RSI is a momentum indicator that measures buying and selling strength. When RSI rises while price falls, it creates a bullish divergence, a reversal cue. This usually signals that selling pressure is weakening, even as the price continues to decline.
This exact pattern appeared within an inverse head-and-shoulders structure, a classic bullish reversal pattern. When Cardano approached the neckline level on February 25, it appeared ready to break out. The projected upside from this pattern was about 38%.
Want more token insights like this? Sign up for Editor Harsh Notariya’s Daily Crypto Newsletter here.
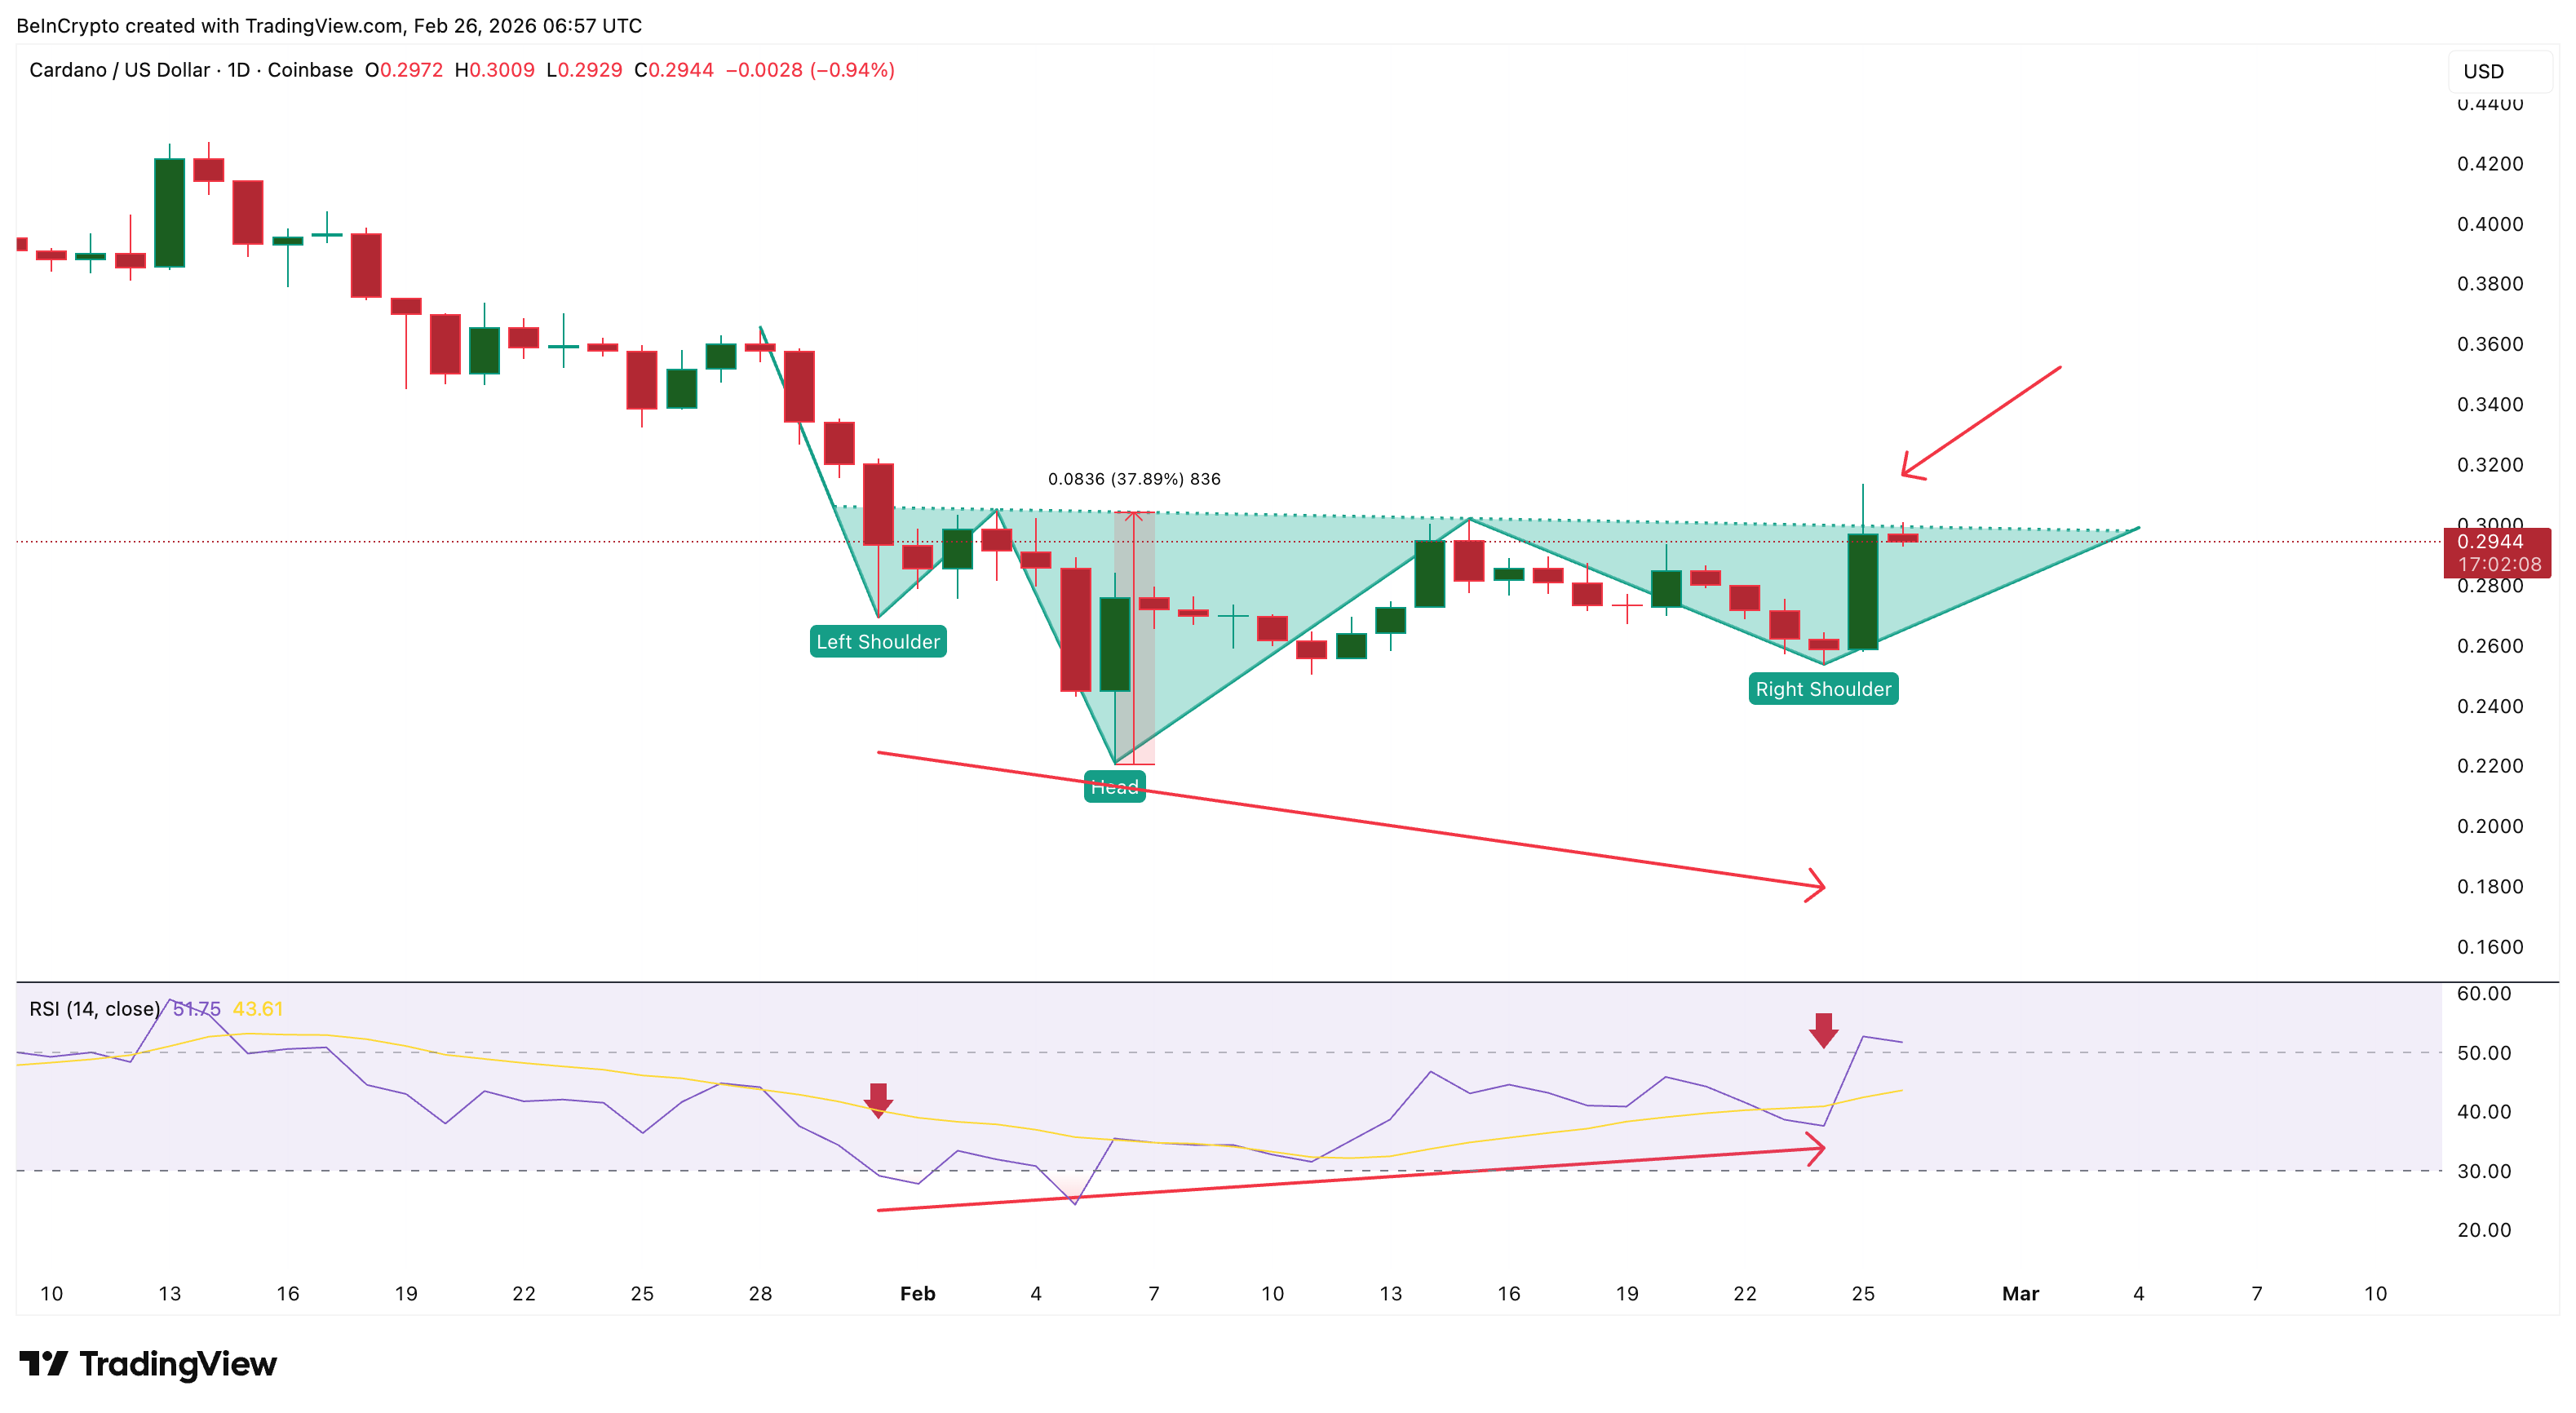
But instead of breaking cleanly, Cardano formed a long upper wick and fell back. This long wick shows sellers entered aggressively and absorbed the buying pressure before the breakout could be confirmed. At this point, the breakout failed.
The failed breakout did not happen without warning. Right after the rejection on February 25, another dangerous signal appeared on the chart — a hidden bearish divergence.
Between January 21 and February 25, the Cardano price formed a lower high. This means the recent peak was still weaker than the previous rally peak. But during the same period, the Relative Strength Index (RSI) formed a much higher high.
This is called a hidden bearish divergence. It happens when momentum rises faster than price, but price still fails to break key resistance. This usually signals that the rally is running out of strength and that sellers are preparing to regain control.
The timing makes this signal even more important. The divergence as Cardano printed the long upper wick on February 25 and failed to break above $0.31.
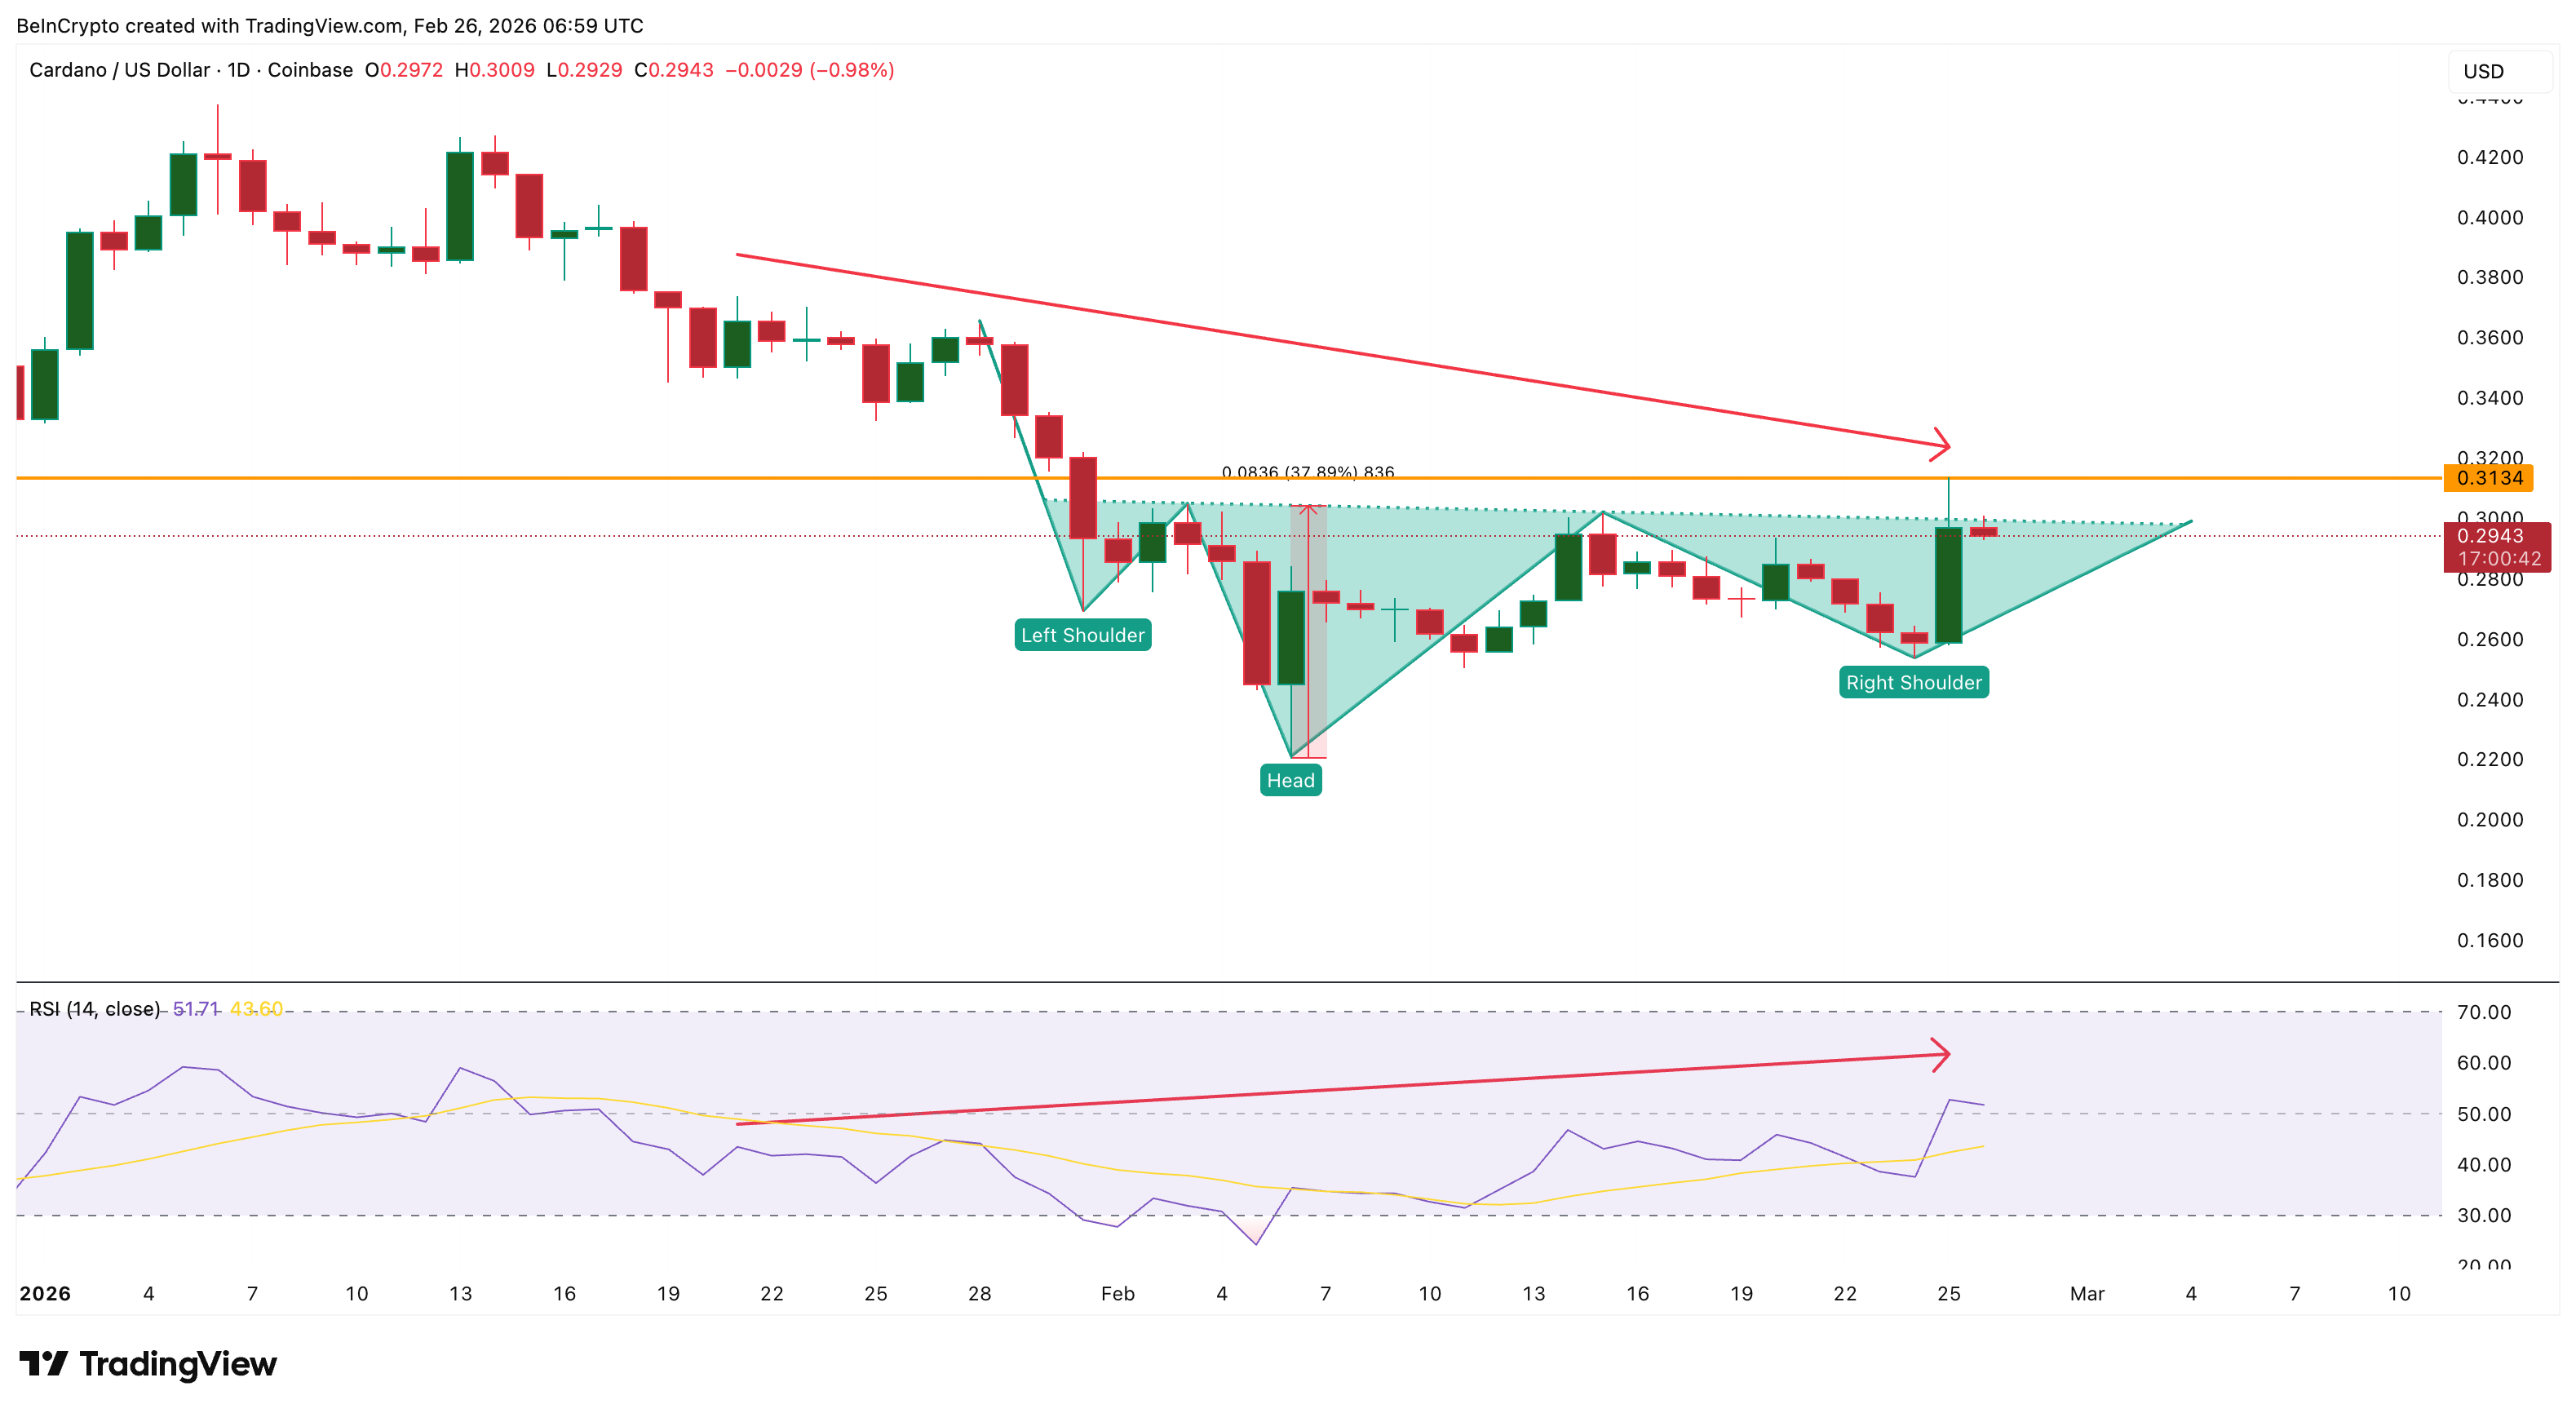
This confirms that the breakout rejection was not just random profit-taking. It was a structural rejection backed by weakening price strength beneath rising momentum. Hidden bearish divergences often lead to pullbacks. That pullback now appears to have already started, with Cardano slipping back below its breakout level.
This creates a risky situation. The bullish breakout structure is still technically alive, but only if the pullback remains limited. A deeper decline would confirm that sellers have fully regained control.
$340 Million Whale Buying Happened — But Larger Whales Quietly Sold Much More
At first glance, whale data looked extremely bullish. Wallets holding between 100 million and 1 billion ADA increased their holdings from 2.33 billion ADA to 3.47 billion ADA. This means they bought 1.14 billion ADA, worth about $340 million. This is the buying activity most traders possibly saw.
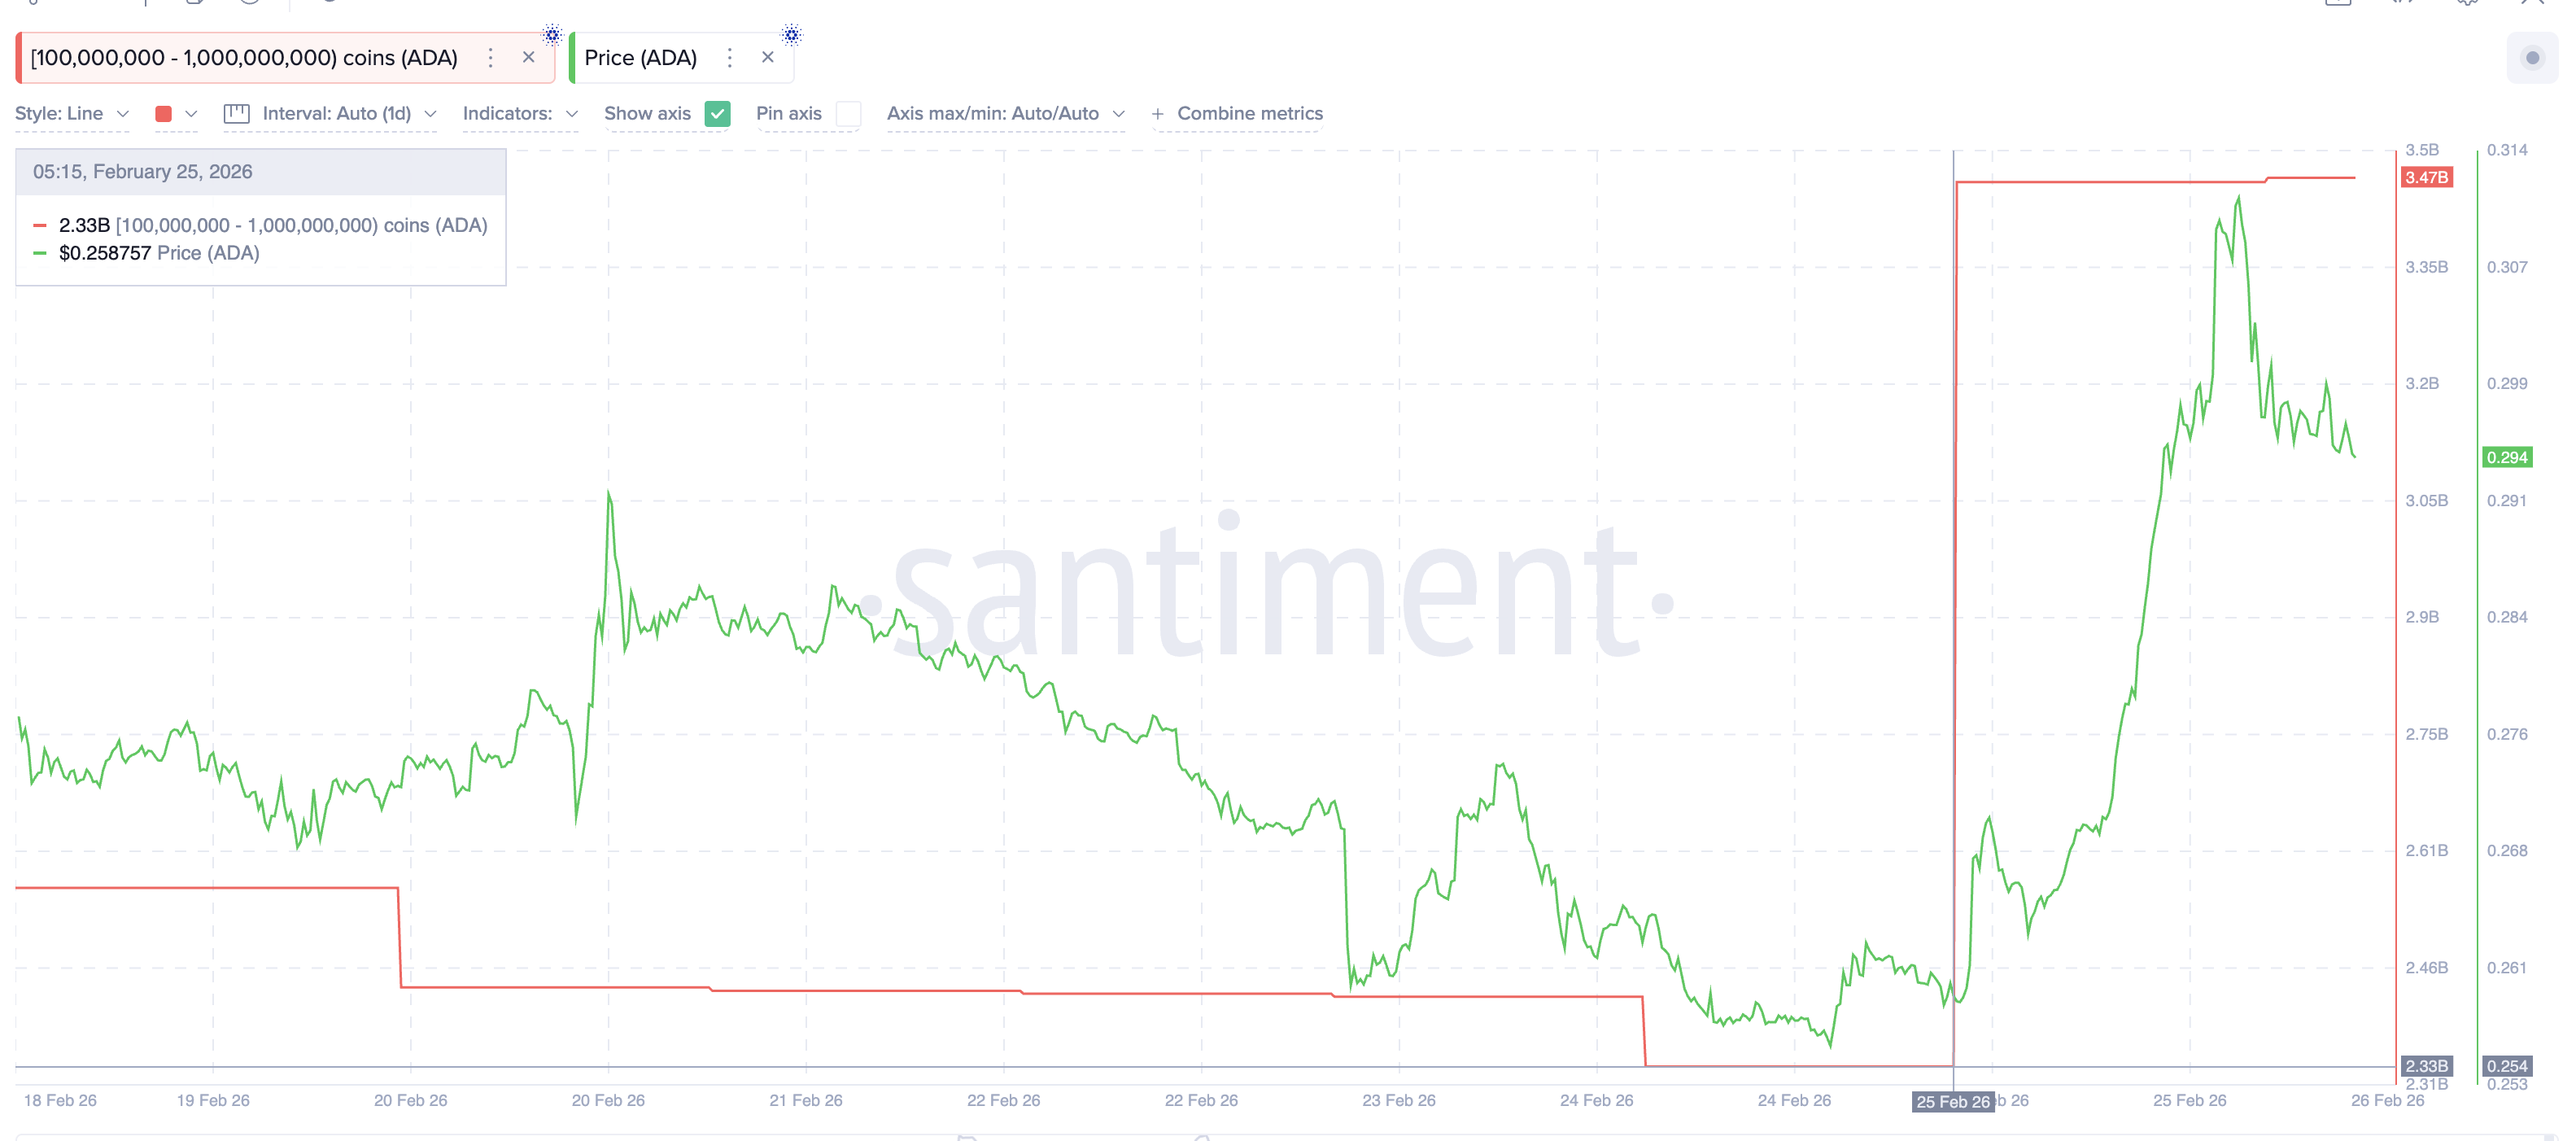
But this was only part of the picture. Other whale groups were selling heavily at the same time. The largest whales, holding over 1 billion ADA, reduced their holdings from 2.89 billion to 1.88 billion ADA. This equals 1.01 billion ADA sold, worth about $297 million.
Mid-size whales holding 10 million to 100 million ADA sold 70 million ADA, worth about $21 million. Smaller whales holding 1 million to 10 million ADA sold 3.41 billion ADA, worth about $1.0 billion.
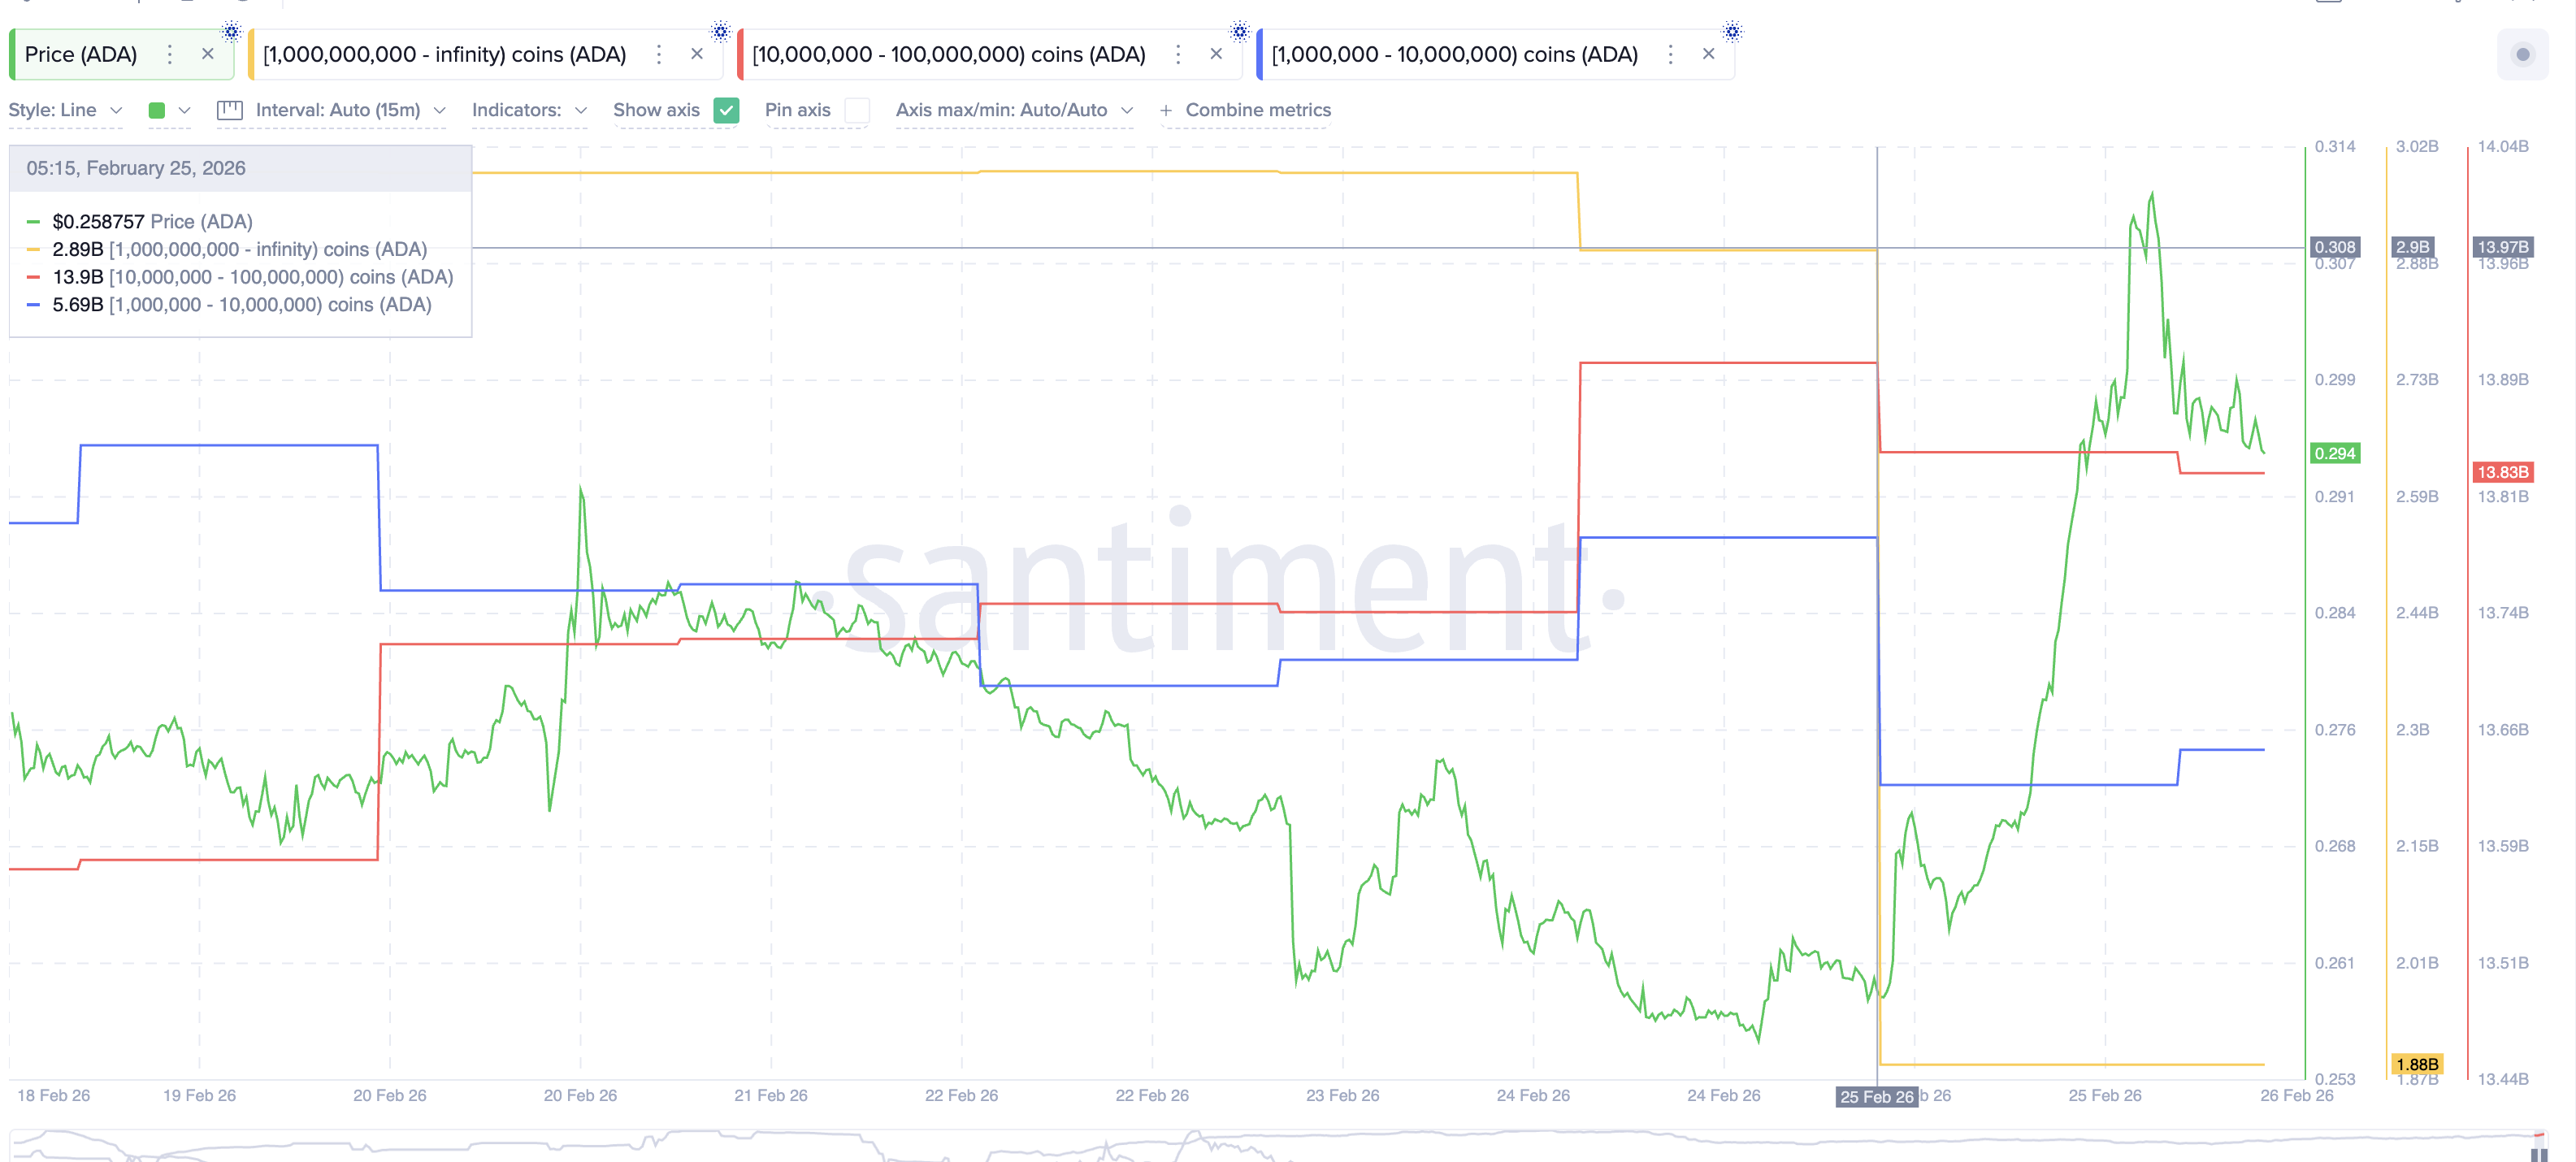
In total, selling reached about $1.32 billion. Compare this to the $340 million bought. That creates a net whale selling imbalance of roughly $980 million.
This explains the failure, including the long upper wick. The visible whale buying created optimism, but the larger, hidden whale selling completely overwhelmed it. This silent distribution blocked the breakout.
Derivatives Traders Took The Bait — Now Liquidation Risk Is Rising
Derivatives traders reacted exactly as expected. They saw a breakout forming, so they opened long positions expecting the rally to continue.
Liquidation data, on Binance alone, shows $11.40 million in long liquidations sitting below current price levels, while short liquidations are only $5.67 million. This means bullish traders are far more exposed to downside risk.
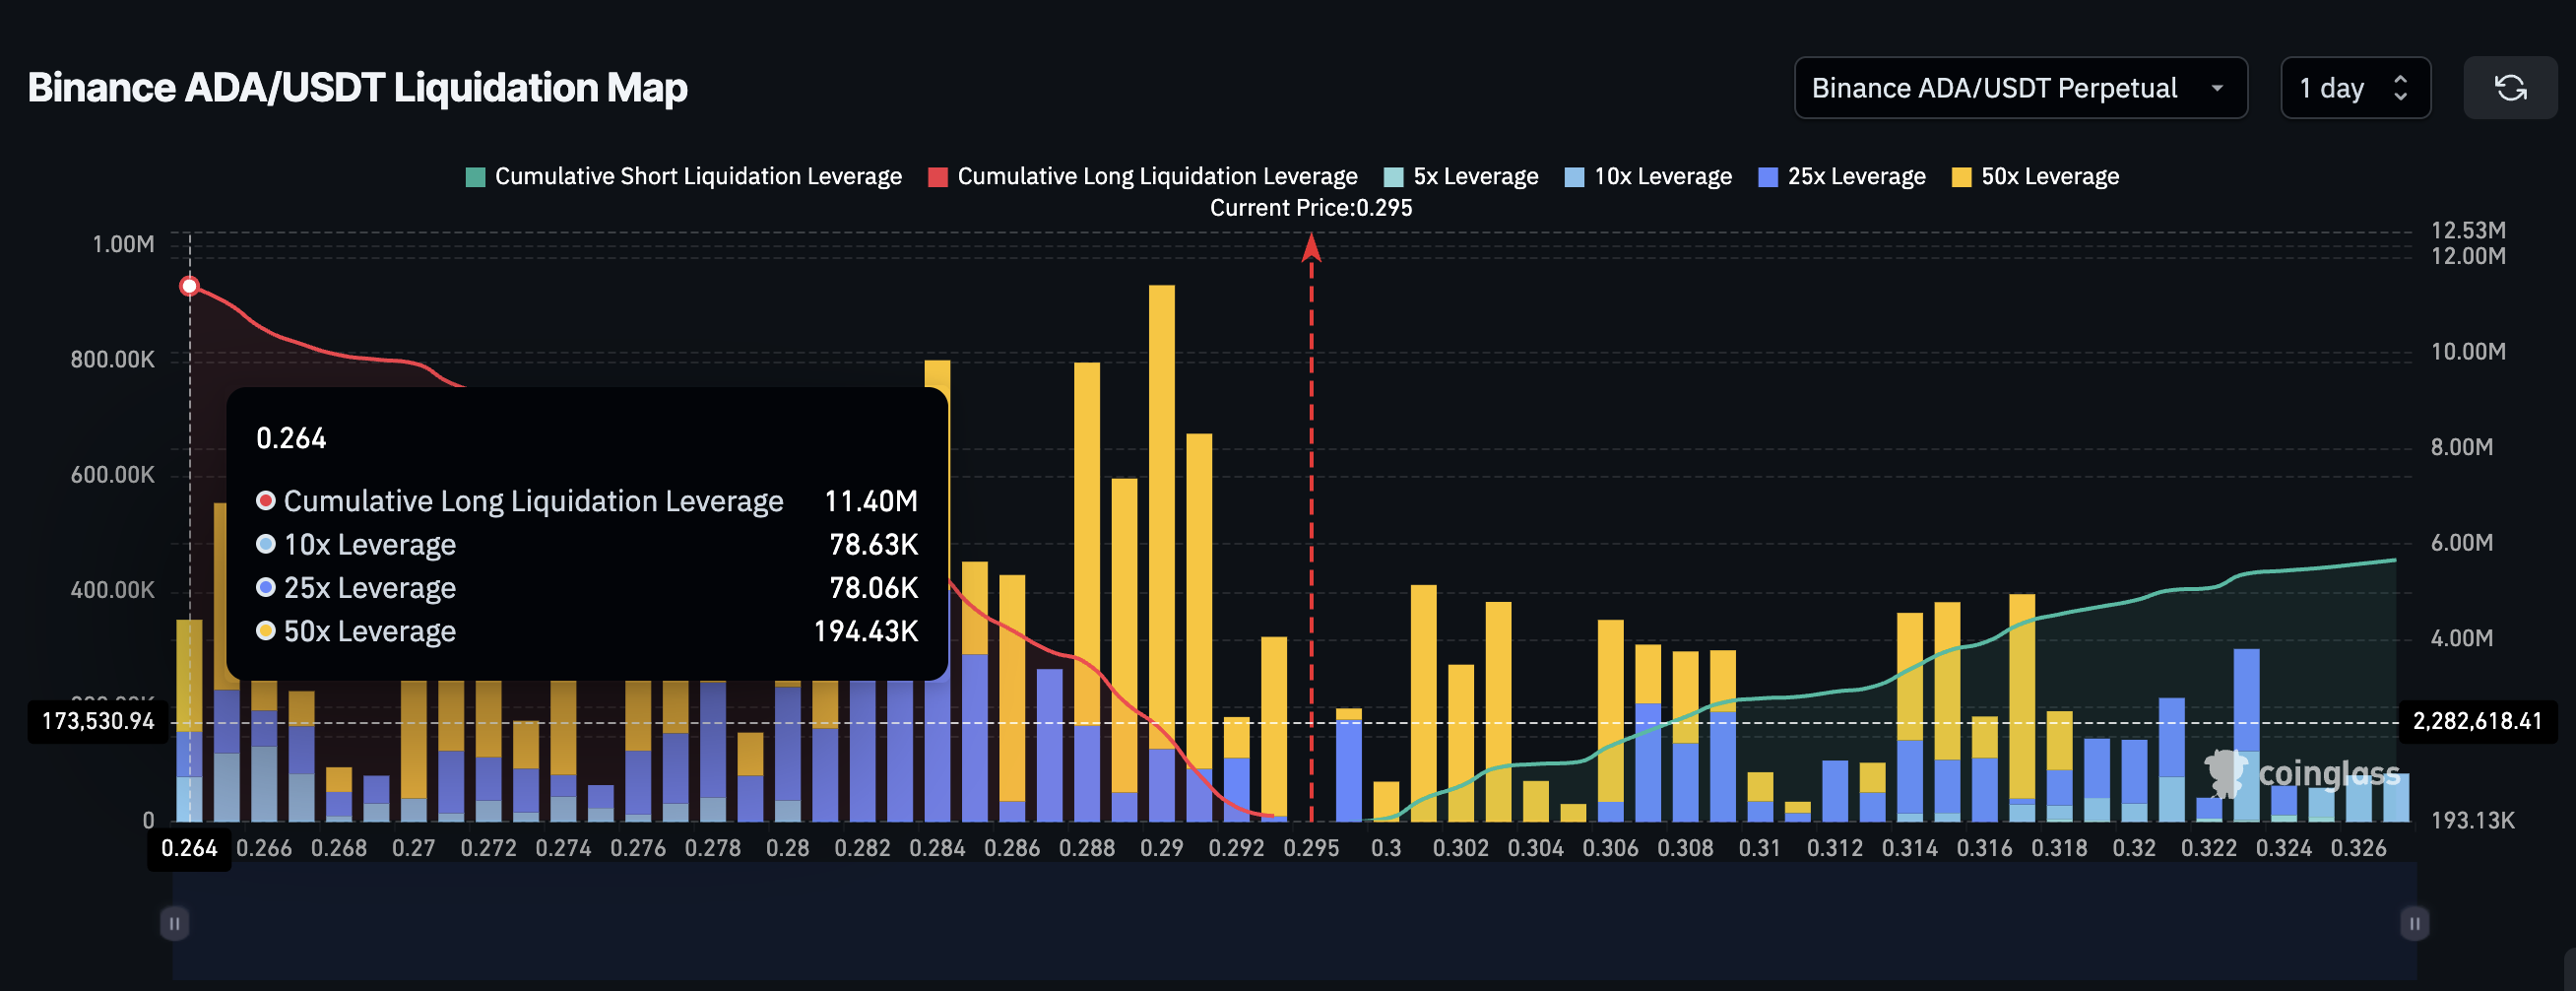
If the Cardano price falls, long positions will be forced to close. This creates a long squeeze. A long squeeze happens when falling prices force bullish traders to exit, and their forced selling pushes the price even lower. This is how failed breakouts often accelerate into deeper corrections.
Cardano Price Now Faces A Critical Breakdown Risk Toward $0.22
The ADA price structure now sits at a critical point. For the bullish breakout to remain valid, Cardano must reclaim and hold above $0.30. This would restart the path toward the $0.41 target.
But downside risks are growing. If Cardano falls below $0.27, the pullback strengthens. If it falls below $0.25, the bullish structure becomes invalid. This level is especially dangerous because it aligns with heavy, long liquidation exposure.
A break below $0.25 could trigger cascading liquidations, which could likely push the price toward $0.22, the full pattern breakdown possibility.
Right now, Cardano’s failed breakout (at press time) is not just a technical rejection. It is the result of nearly $1 billion in hidden whale selling. This imbalance is quietly turning into a high-probability breakout into a trap, and until buying fully outweighs selling, the recovery remains wishful.

Money over passion: Why Tsitsipas skips South America

Apple Watch Series 11 drops to $299, plus grab deals on titanium styles

Wuthering Heights Accents: A Linguist Explains The Nuances


-

 Video7 days ago
XRP News: XRP Just Entered a New Phase (Almost Nobody Noticed)
-

 Politics4 days ago
Baftas 2026: Awards Nominations, Presenters And Performers
-

 Fashion6 days ago
Weekend Open Thread: Boden – Corporette.com
-

 Sports3 days ago
Women’s college basketball rankings: Iowa reenters top 10, Auriemma makes history
-

 Politics3 days ago
Nick Reiner Enters Plea In Deaths Of Parents Rob And Michele
-

 Business2 days ago
True Citrus debuts functional drink mix collection
-

 Crypto World2 days ago
XRP price enters “dead zone” as Binance leverage hits lows
-

 Business4 days ago
Mattel’s American Girl brand turns 40, dolls enter a new era
-

 Business4 days ago
Law enforcement kills armed man seeking to enter Trump’s Mar-a-Lago resort, officials say
-

 Tech2 days ago
Unsurprisingly, Apple's board gets what it wants in 2026 shareholder meeting
-

 NewsBeat17 hours ago
Cuba says its forces have killed four on US-registered speedboat | World News
-
 NewsBeat19 hours ago
Manchester Central Mosque issues statement as it imposes new measures ‘with immediate effect’ after armed men enter
-
 NewsBeat3 days ago
‘Hourly’ method from gastroenterologist ‘helps reduce air travel bloating’
-

 Tech4 days ago
Anthropic-Backed Group Enters NY-12 AI PAC Fight
-

 NewsBeat4 days ago
Armed man killed after entering secure perimeter of Mar-a-Lago, Secret Service says
-

 Politics4 days ago
Maine has a long track record of electing moderates. Enter Graham Platner.
-
 NewsBeat2 days ago
Police latest as search for missing woman enters day nine
-

 Business13 hours ago
Discord Pushes Implementation of Global Age Checks to Second Half of 2026
-

 Crypto World2 days ago
Entering new markets without increasing payment costs
-
 Sports3 days ago
2026 NFL mock draft: WRs fly off the board in first round entering combine week