

Crypto World
Will Ethereum price hit $2.5K as funding rates flip green?

Ethereum price is trying to steady itself after a rough February, but the bigger question is whether this bounce has enough strength to push through the $2,500 ceiling.
Summary
- Ethereum has bounced above $2,000 after a sharp February drop but remains in a broader downtrend and well below the key $2,500 resistance.
- Funding rates on Binance have turned positive, easing short-term downside pressure, though high volatility suggests a bigger move is coming.
- To reclaim $2,500, ETH must hold $2,000 support and break above $2,200 with strong momentum
At press time, ETH was trading near $2,050, up about 3% over the past 24 hours. The move extends a week-long rebound of roughly 9%. Even so, the token is still down 30% over the past month and sits nearly 58% below its August 2025 peak of $4,946.
February started with Ethereum (ETH) trading between $2,200 and $2,400 before sellers took control mid-month. The slide accelerated around Feb. 24–25, when the price dipped toward $1,800. Since then, buyers have stepped back in, lifting the price back above the $2,000 mark.
Volatility spikes to highest level since March 2025
Derivative data shows a notable shift in positioning. According to a Feb. 26 analysis by CryptoQuant analyst PelinayPA, funding rates had remained positive for an extended period earlier this year, indicating that long traders were paying shorts.
Despite that optimism, the price failed to build a consistent rally. More recently, when short positions grew and the price faced pressure, funding went sharply negative.
Binance, which has the biggest share of global derivatives liquidity, often sets the tone during liquidation waves. The short- to mid-term trajectory of Ethereum is often affected by changes in Binance funding.
Funding has now flipped back to positive. This indicates that there is less immediate downside pressure now that many short positions have been cleared. Positive funding, however, does not prove a long-term recovery. The market could experience a long squeeze if it rises too quickly.
In a separate report, analyst Arab Chain revealed that Ethereum’s 30-day realized volatility on Binance has climbed to roughly 0.97, its highest level since March 2025.
Such high volatility often precedes a significant directional move, but if buying and selling pressure is evenly distributed, it can also occur during a prolonged period of sideways trading.
Ethereum price technical analysis
From a chart perspective, ETH is still in a clear daily downtrend, marked by lower highs and lower lows. Price recently bounced after touching the lower Bollinger Band near the $1,850–$1,900 zone. It now trades around $2,050, below key resistance areas.
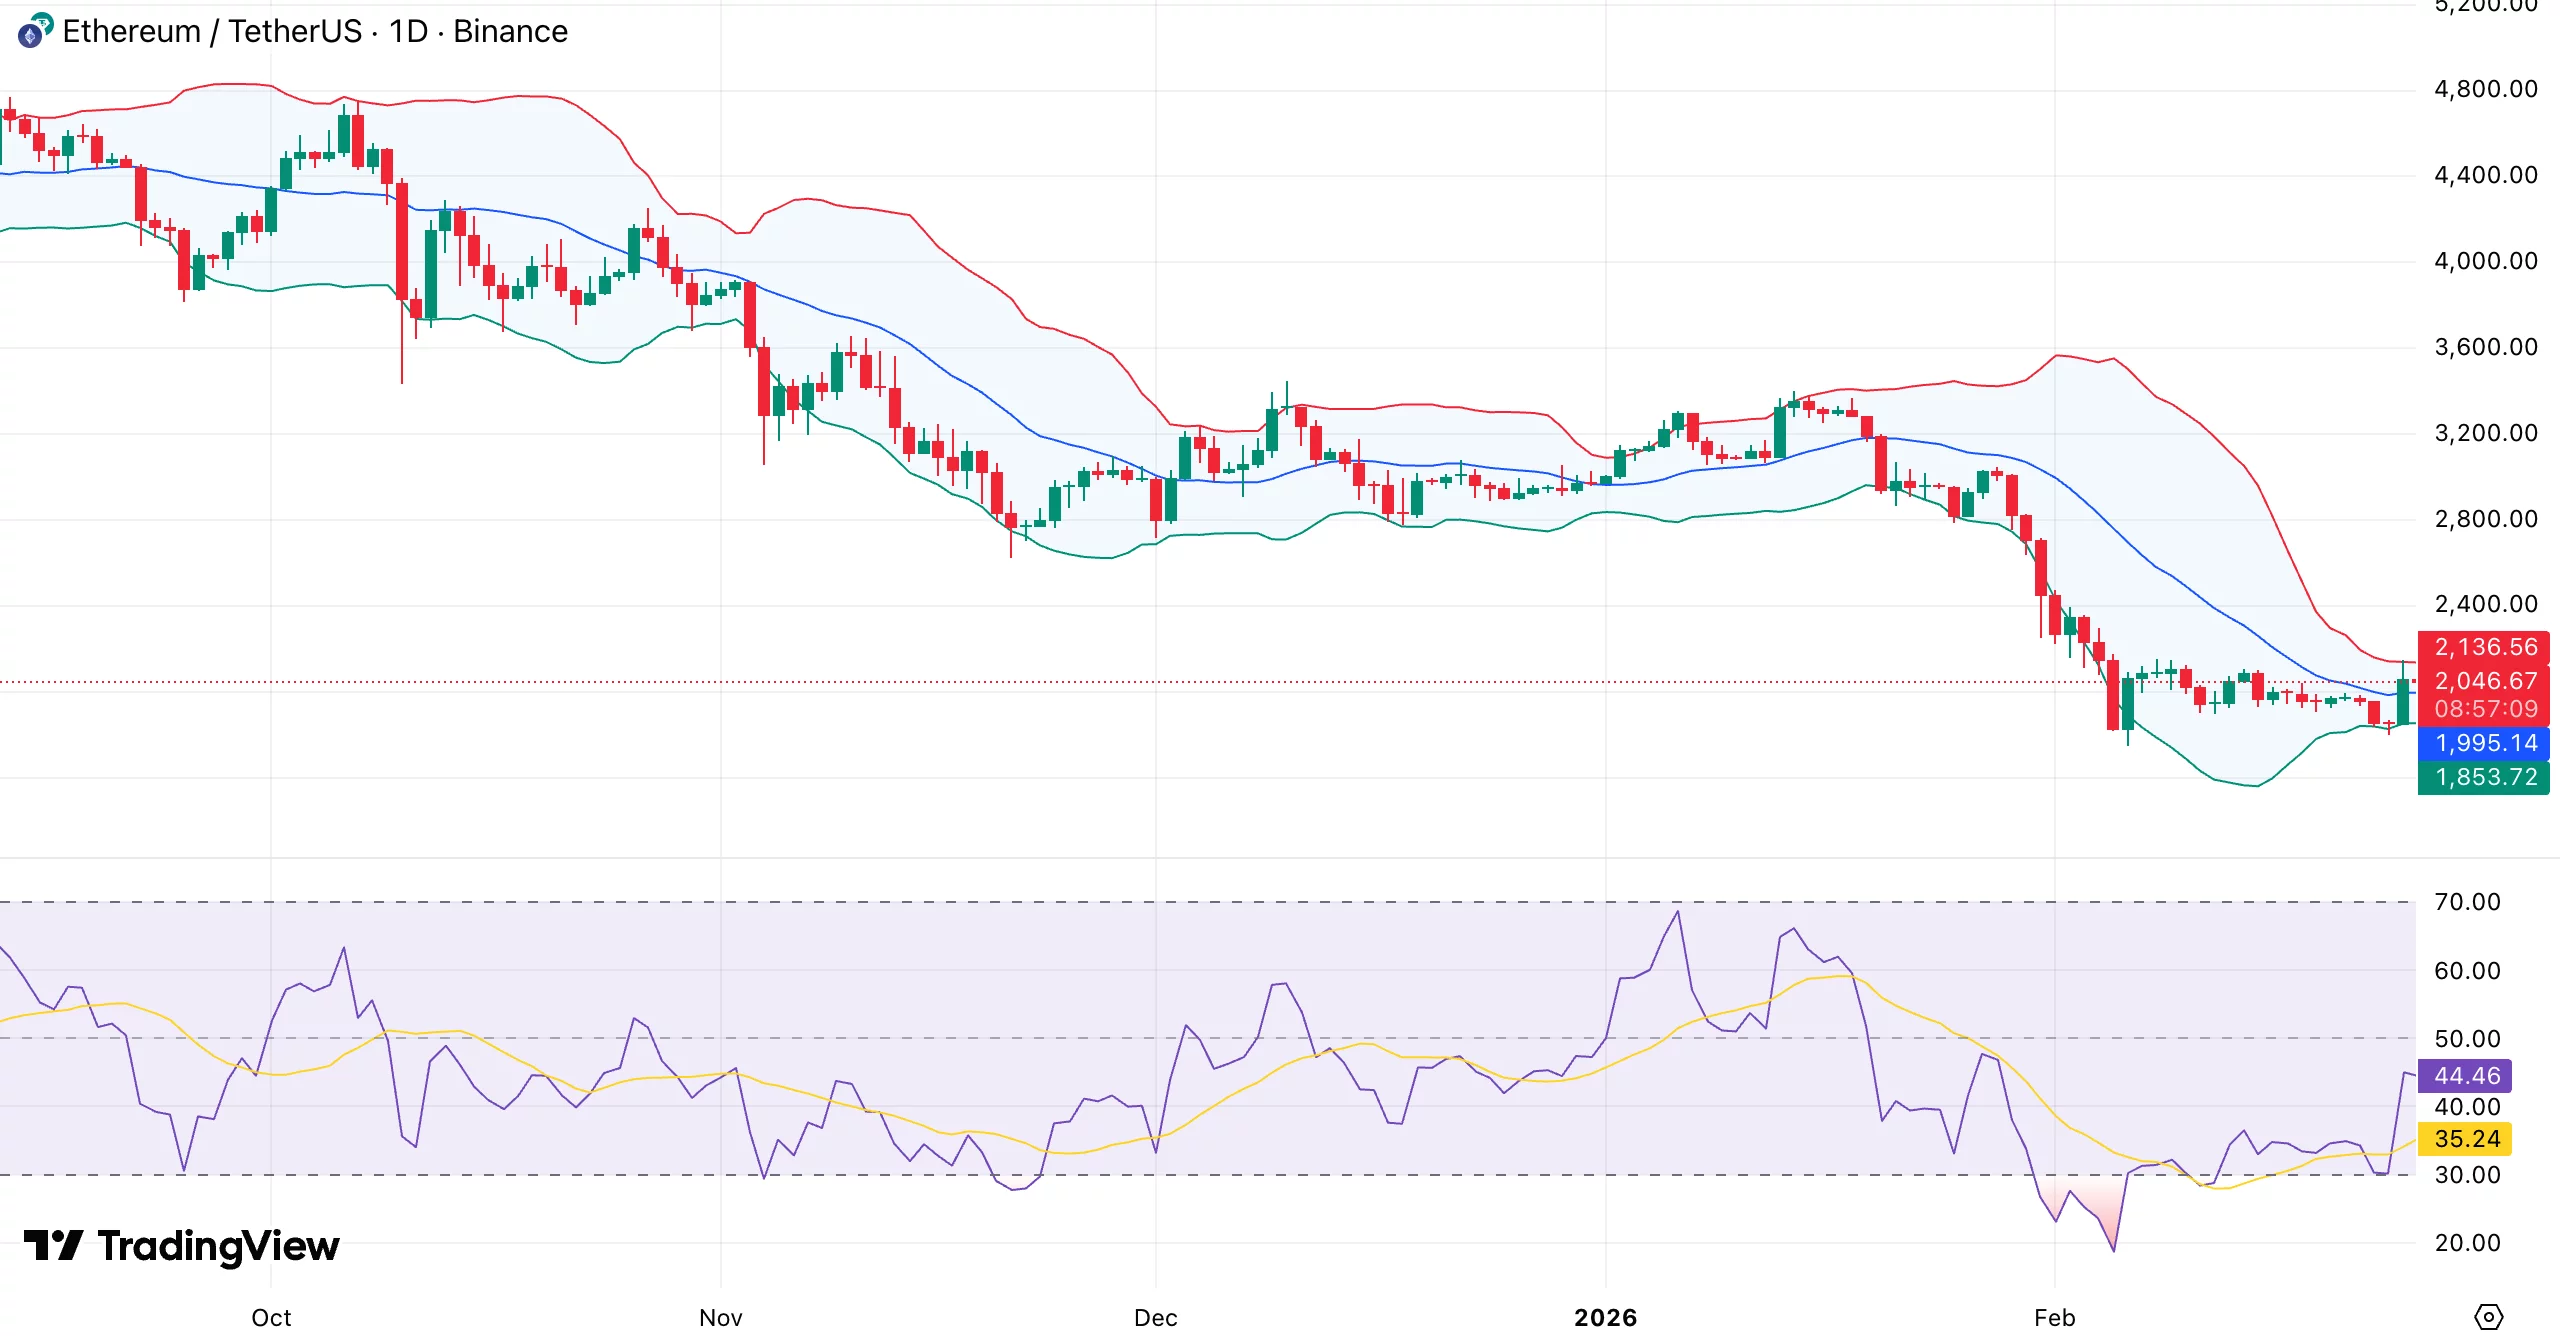
Immediate support sits near $2,000, followed by the recent low between $1,850 and $1,900. On the upside, supply is clustered around $2,130–$2,150, then $2,300–$2,350.
Because it corresponds with a previous breakdown area and has psychological weight, the $2,500 level continues to be the primary structural barrier.
Momentum is improving but not yet decisive. Following a recovery from oversold conditions, the relative strength index is close to 44.
A sustained move above 50 would strengthen the case for a shift in momentum. Bollinger Bands are starting to narrow after widening during the selloff, suggesting a possible attempt at a breakout.
For Ethereum to recover $2,500, it must clear the $2,200 area with substantial volume and maintain above $2,000 to form a higher low. The current move might turn out to be a relief bounce inside a bigger downward structure if there is no follow-through.


- The World Liberty Financial governance overhaul proposal proposes 180-day staking for voting rights.
- The WLFI price closely mirrors Bitcoin’s price and overall crypto market sentiment.
- The key WLFI price levels to watch are the support at $0.115 and the resistances at $0.120 and $0.1428.
World Liberty Financial (WLFI) is making headlines with a major governance overhaul proposal that could reshape how its token holders participate in the protocol.
The proposal requires all holders with unlocked WLFI tokens to stake them for at least 180 days to qualify for governance voting.
This is designed to encourage long-term commitment and reduce short-term speculation.
If the proposal passes, voting power will now take into account both the number of tokens staked and the remaining lock-up time.
Larger holders who commit for longer periods will have a stronger influence on protocol decisions.
In addition to staking requirements, the overhaul introduces a tiered reward system.
Token holders who stake and participate in at least two governance votes during the lock-up period can earn a roughly 2% annual yield.
These incentives aim to reward active governance engagement rather than just holding tokens passively.
WLFI is also integrating USD1 stablecoin usage into its reward framework. Stakers may receive additional benefits for depositing USD1 on the WLFI trading and lending platform.
Large stakers, designated as nodes or supernodes, will gain further privileges such as access to USD1 conversion services and priority partnership opportunities.
World Liberty Financial (WLFI) token price reaction
These reforms come as WLFI’s market performance reflects broader crypto trends.
The token currently trades at $0.1155, down about 2.9% over 24 hours, with a market cap of roughly $3.2 billion.
Notably, WLFI’s price action has closely mirrored Bitcoin’s recent 2.55% decline, as well as a 2.48% drop in total cryptocurrency market capitalisation.
This high correlation indicates that WLFI is behaving as a high-beta asset, amplifying broader market movements.
Market sentiment is notably negative, with the Fear & Greed Index indicating “Extreme Fear.”
Traders are watching Bitcoin’s price closely, as any significant move below $66,734 could drag WLFI lower.
Conversely, Bitcoin’s stabilisation above $66,000 may allow WLFI to consolidate near its current range between $0.115 and $0.12.
Technically, WLFI has found short-term support around $0.0994. Resistance levels have been observed at $0.1200, $0.1428, and $0.1632.
A sustained move above $0.1200 could pave the way for higher ranges, while failure to hold above support could trigger testing of lower levels near $0.11.
The token’s historical price volatility highlights both opportunities and risks.
It recently reached an all-time high of $0.3313 but has since declined more than 65%.
Its all-time low in recent weeks was $0.09831, showing that buyers have stepped in at sub-$0.10 levels.
WLFI price forecast
The governance overhaul adds a long-term bullish element, as staking reduces circulating supply and encourages sustained engagement.
However, WLFI’s price remains tethered to broader market trends, making Bitcoin and general crypto sentiment key determinants for its short-term trajectory.
The immediate support lies at $0.115, and a breakdown below this level may see WLFI test $0.11, especially if Bitcoin weakens further.
On the upside, breaking through $0.1200 could open the door to $0.1428, followed by $0.1632 if bullish momentum persists.
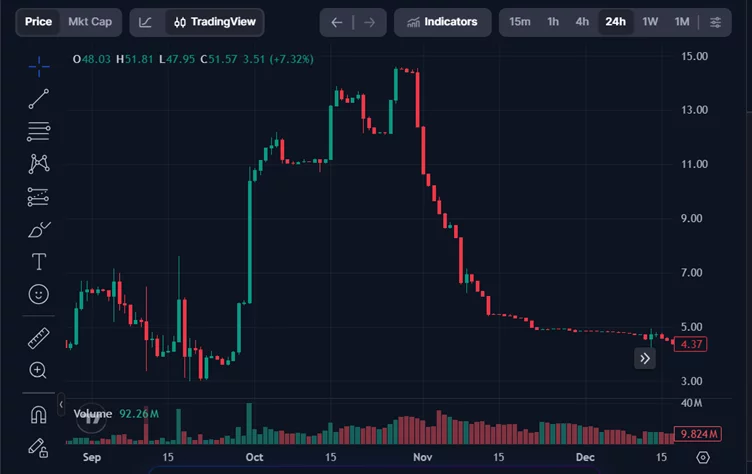
The MicroStrategy stock price couldn’t continue its upswing despite the company continuing to buy more Bitcoin. Its latest $40 million purchase, on February 23, came just as the stock began sliding again. But that wasn’t the entire story.
While MSTR stock dipped by over 9% on February 24, a 16% bounce followed on February 25, showing excitement. At press time, it’s down over 3% since yesterday’s close. The stock is now down about 4% from last Friday’s high and almost 63% over six months, raising fresh concerns about a deeper breakdown, all while the BTC stash was loaded again.
Latest $40 Million Bitcoin Buy Fails to Stop MSTR’s Slide
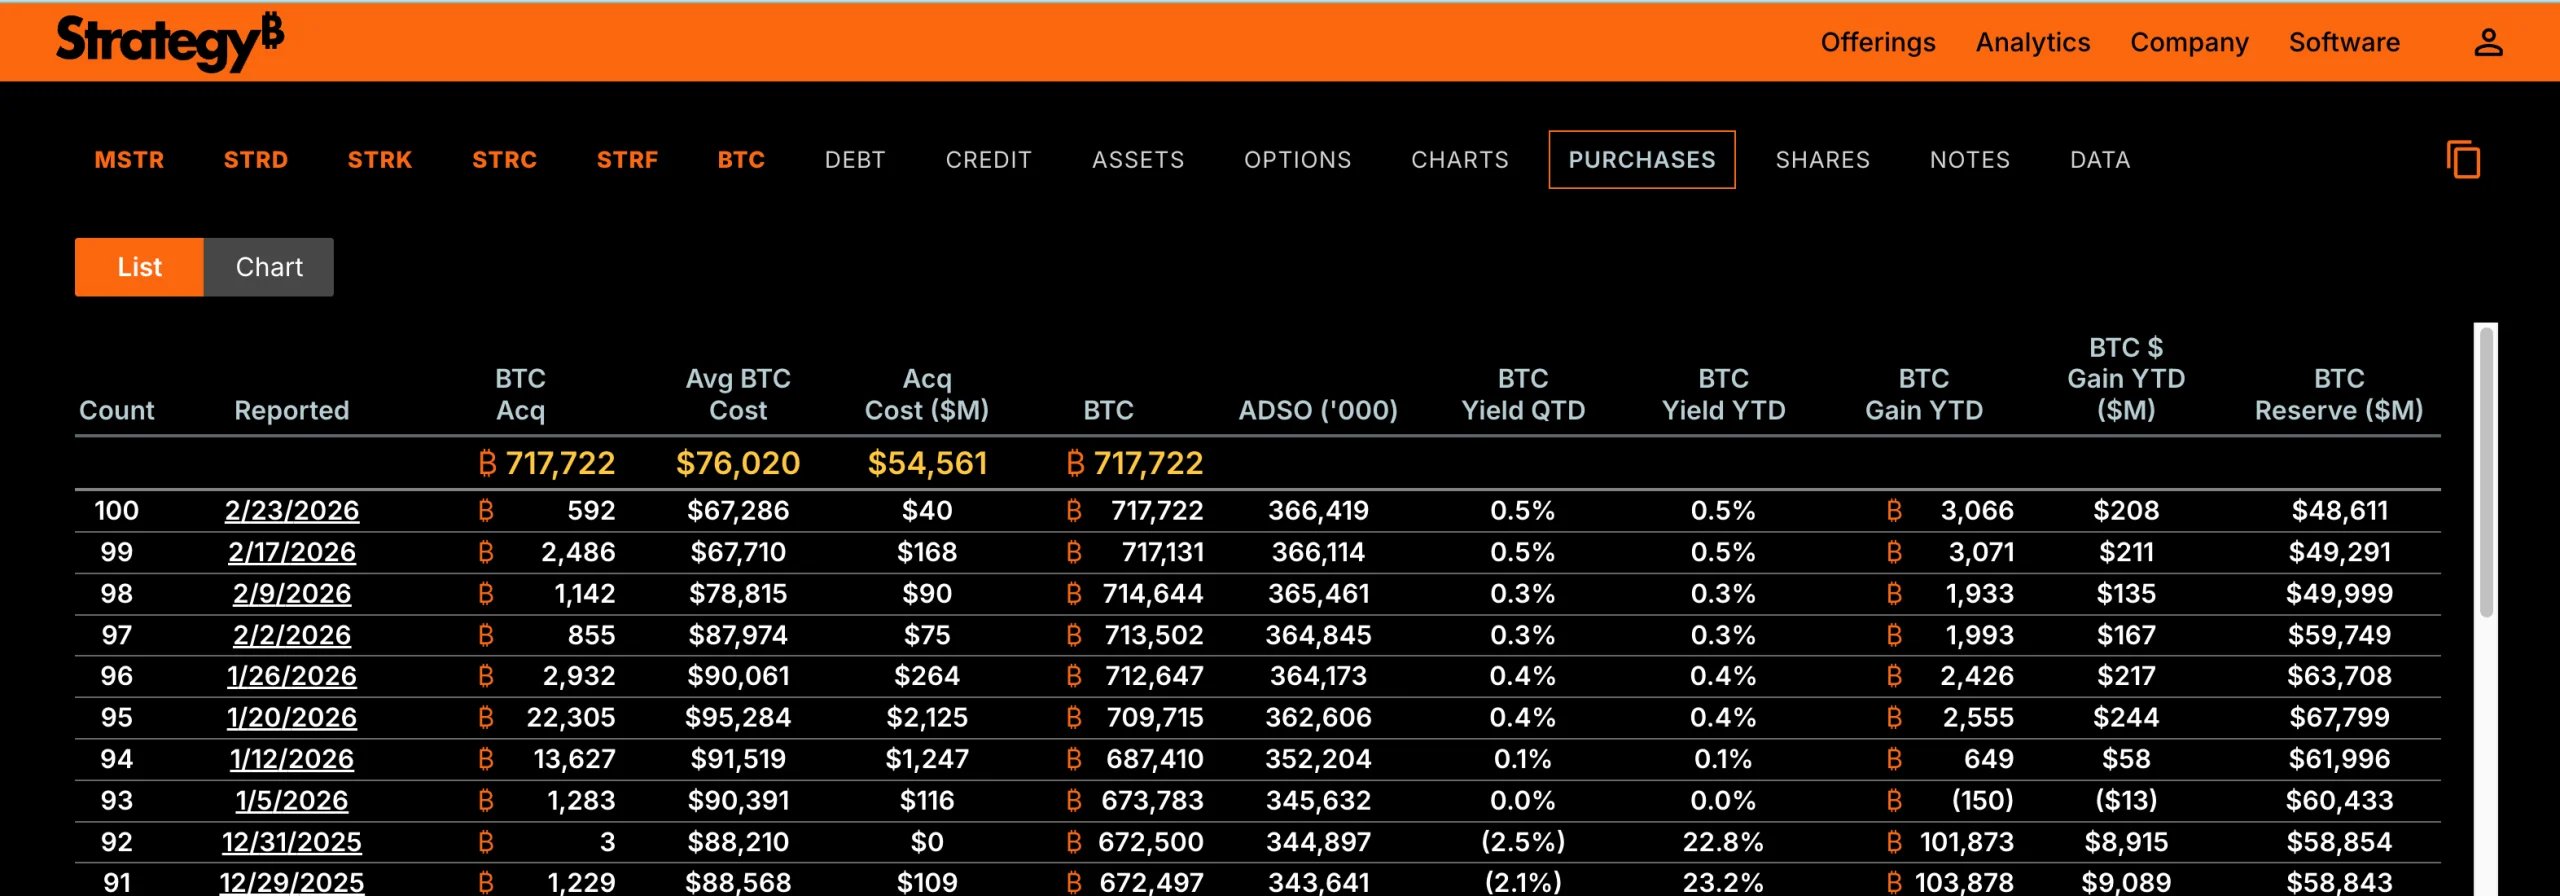
MicroStrategy added 592 Bitcoin on February 23, spending about $40 million at an average price near $67,286. This pushed its total holdings to 717,722 Bitcoin, with an overall average cost basis of $76,020.
Normally, such aggressive buying supports investor confidence because it signals long-term conviction in Bitcoin’s future.

Want more token insights like this? Sign up for Editor Harsh Notariya’s Daily Crypto Newsletter here.
But at this time, the MicroStrategy stock price continued to fall rather than stabilize, moving steadily on its bear-flag breakdown path that started on February 19, despite a few rebounds. This weakness closely reflects Bitcoin’s own behavior.
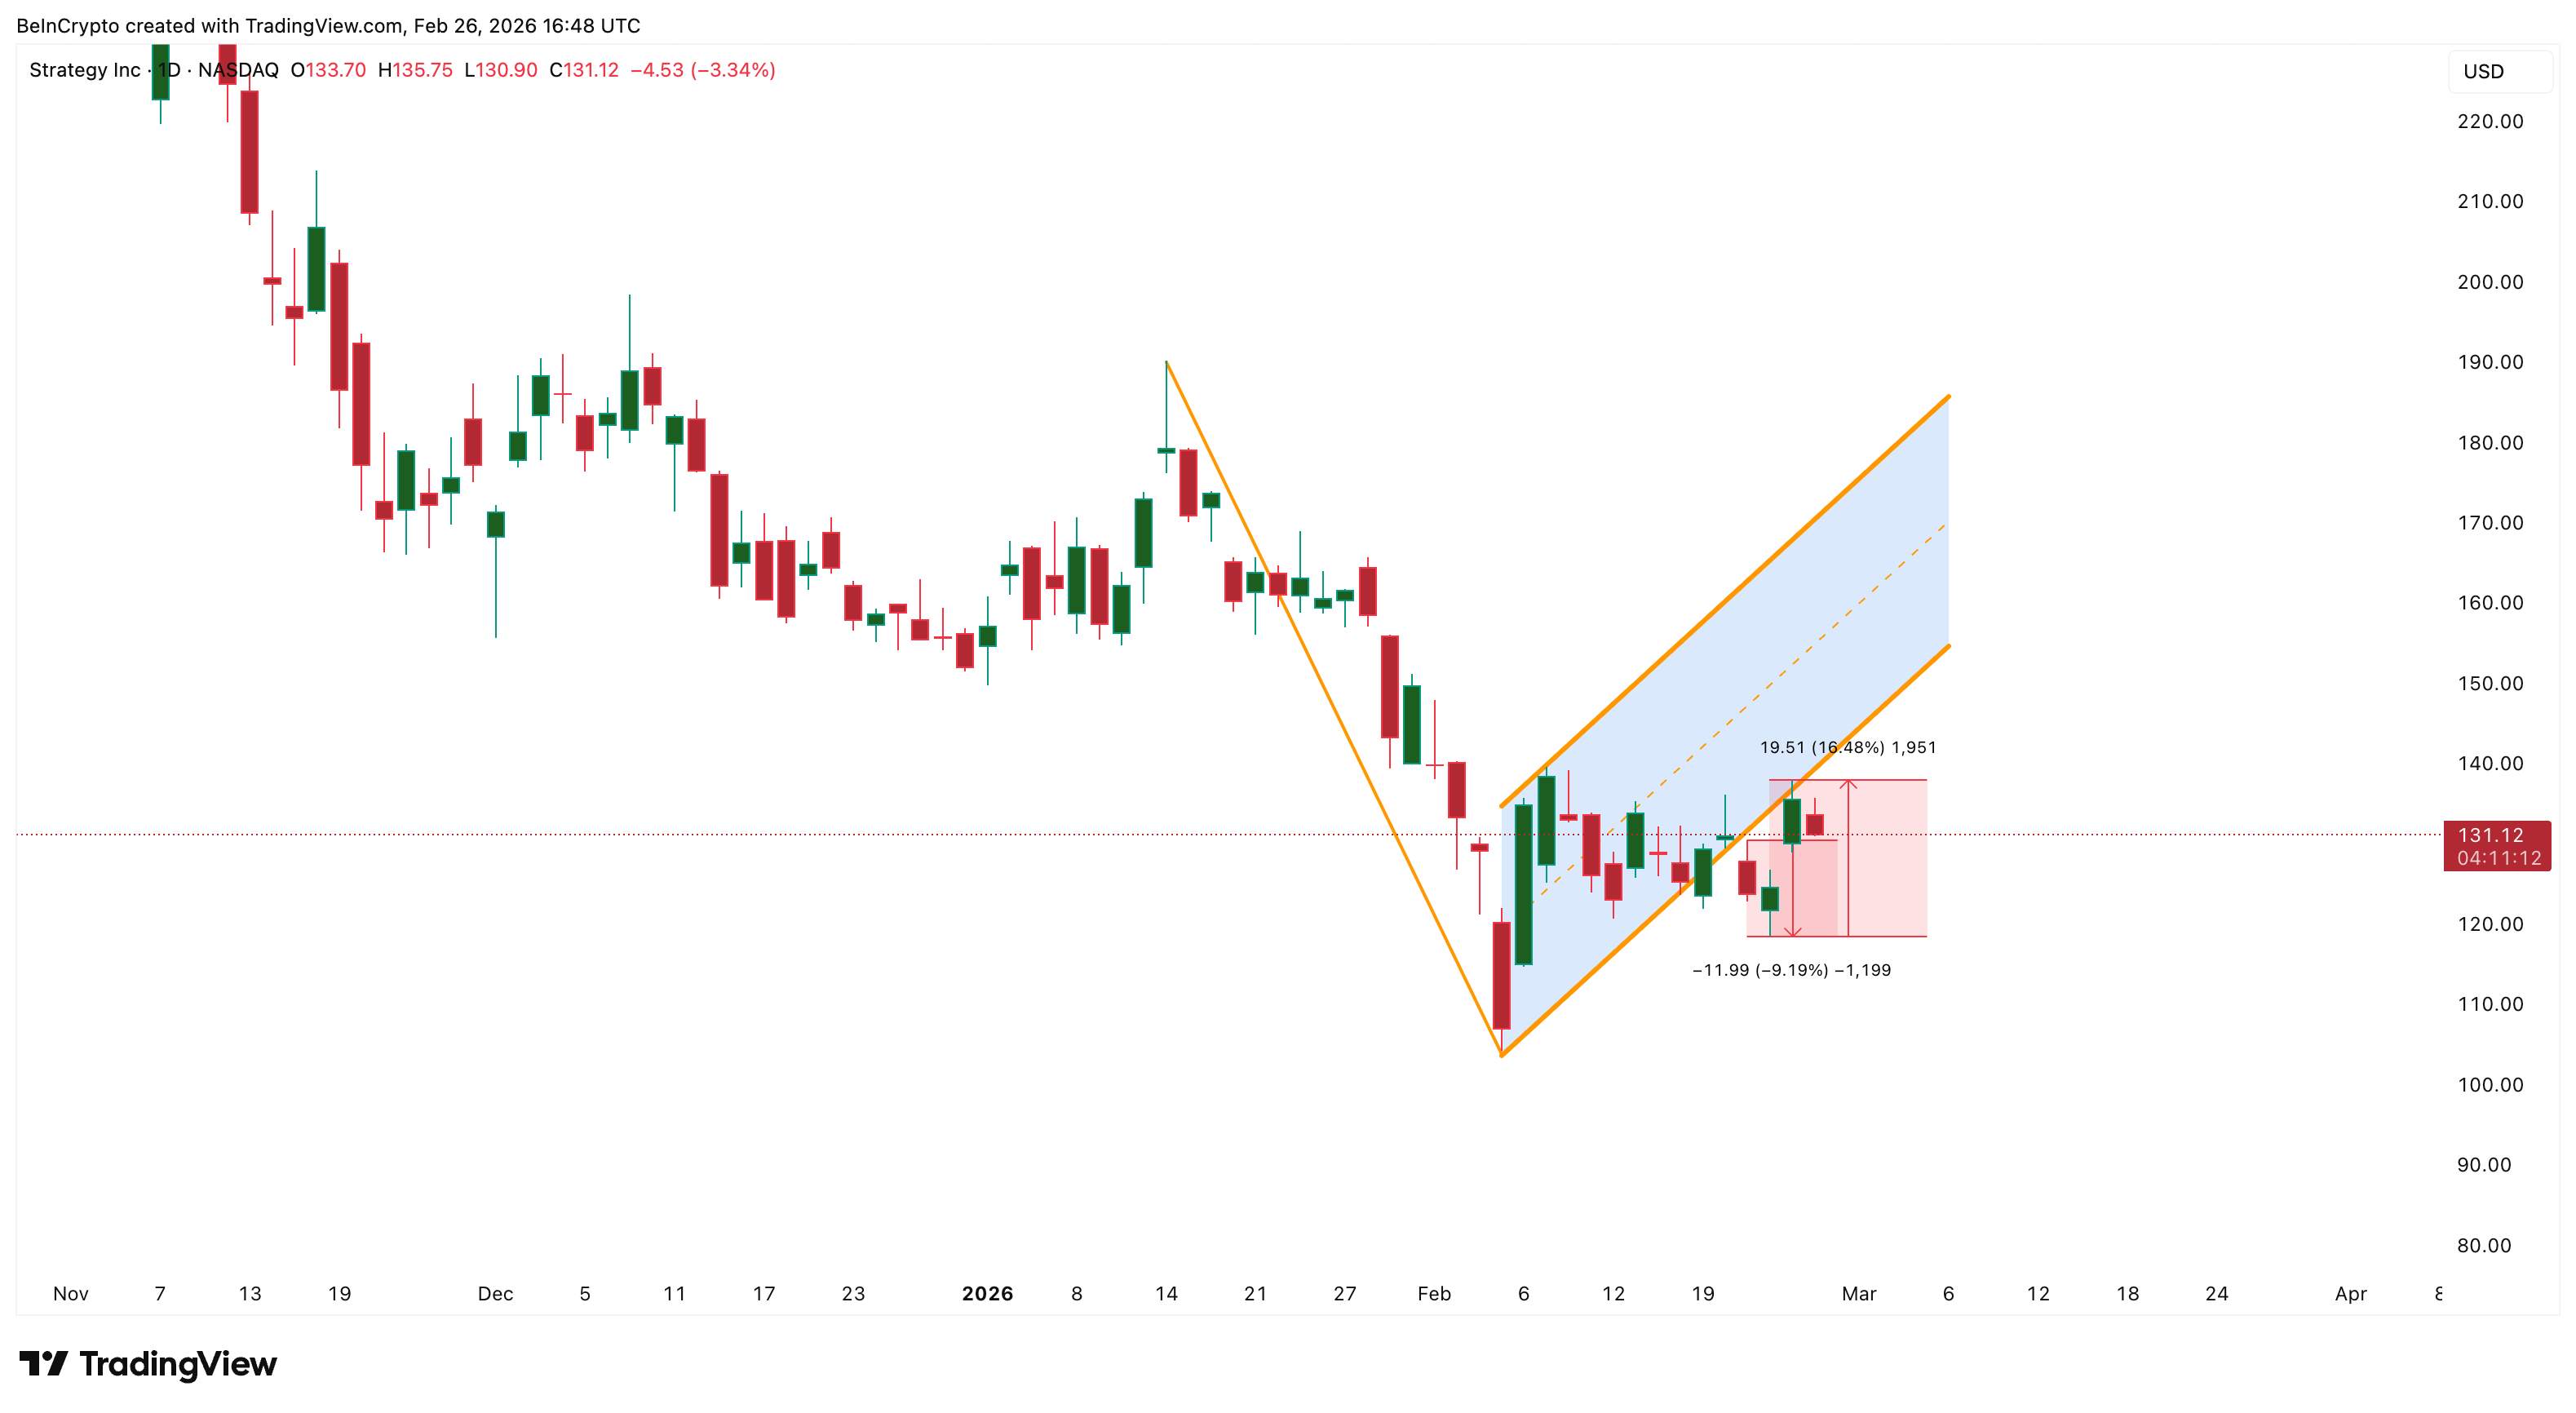
The stock had briefly rallied to $137 on February 25, riding Bitcoin’s rebound from $64,500 to $69,400, a 2.5% move. However, as Bitcoin cooled again, MicroStrategy immediately reversed lower, showing how tightly its performance remains tied to Bitcoin’s direction.
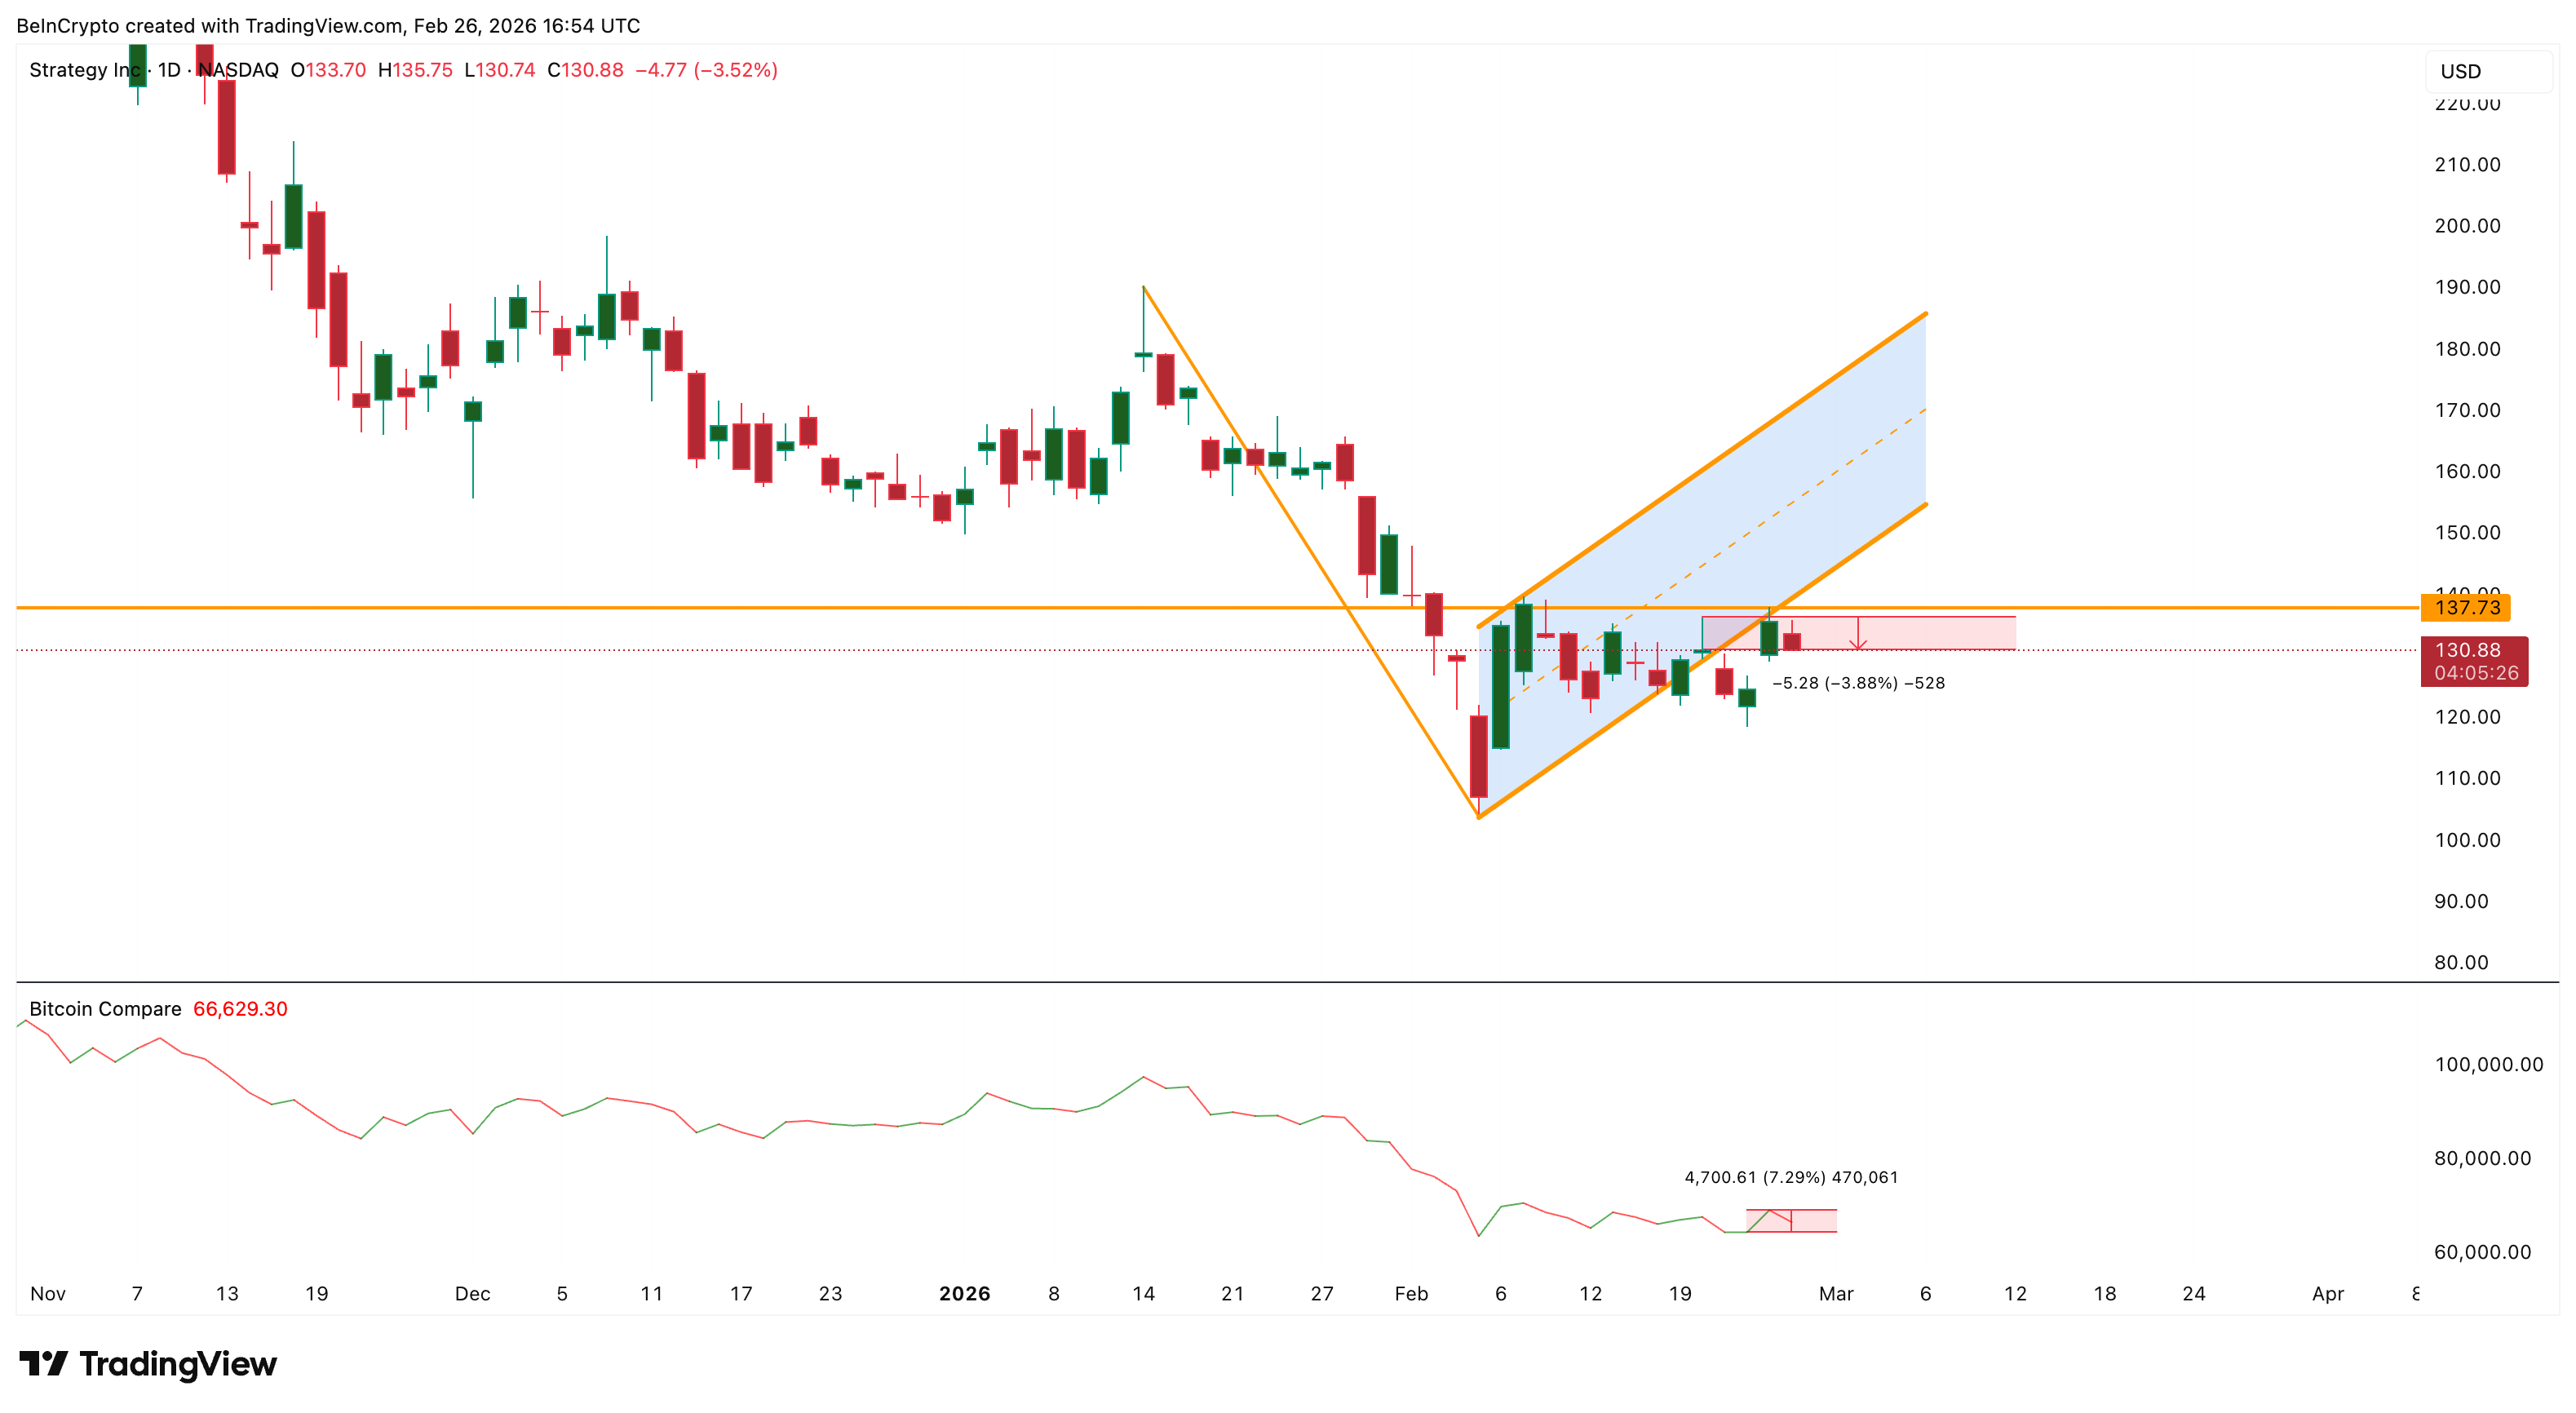
This shows MicroStrategy is still trading like a leveraged Bitcoin proxy. When Bitcoin pauses or weakens, MicroStrategy often falls faster because its valuation already assumes strong upside from its Bitcoin holdings.
The latest Bitcoin purchase did not change that dynamic, raising a more important question: whether institutional investors still support the stock.
Institutional Money Flow Signals Growing Exit Risk
The Chaikin Money Flow (CMF) indicator is now flashing a warning sign. CMF measures whether large investors are buying or selling by combining price and volume.
When CMF rises above zero, it signals accumulation, meaning institutional investors are buying. When it drops below zero, it signals distribution, meaning capital is leaving the asset.
Earlier, between January 12 and February 23, CMF rose while MicroStrategy’s stock price fell, with a few bounces above the zero line. This bullish divergence showed that institutional investors were quietly accumulating shares during weakness. That accumulation even translated into net positive flows at times, leading to sizeable rebounds.
It even helped fuel a 33% rebound between February 5 and February 25. However, the situation is different now. The CMF has flatlined, hugging the zero line. This shows institutional money is undecided at the moment.
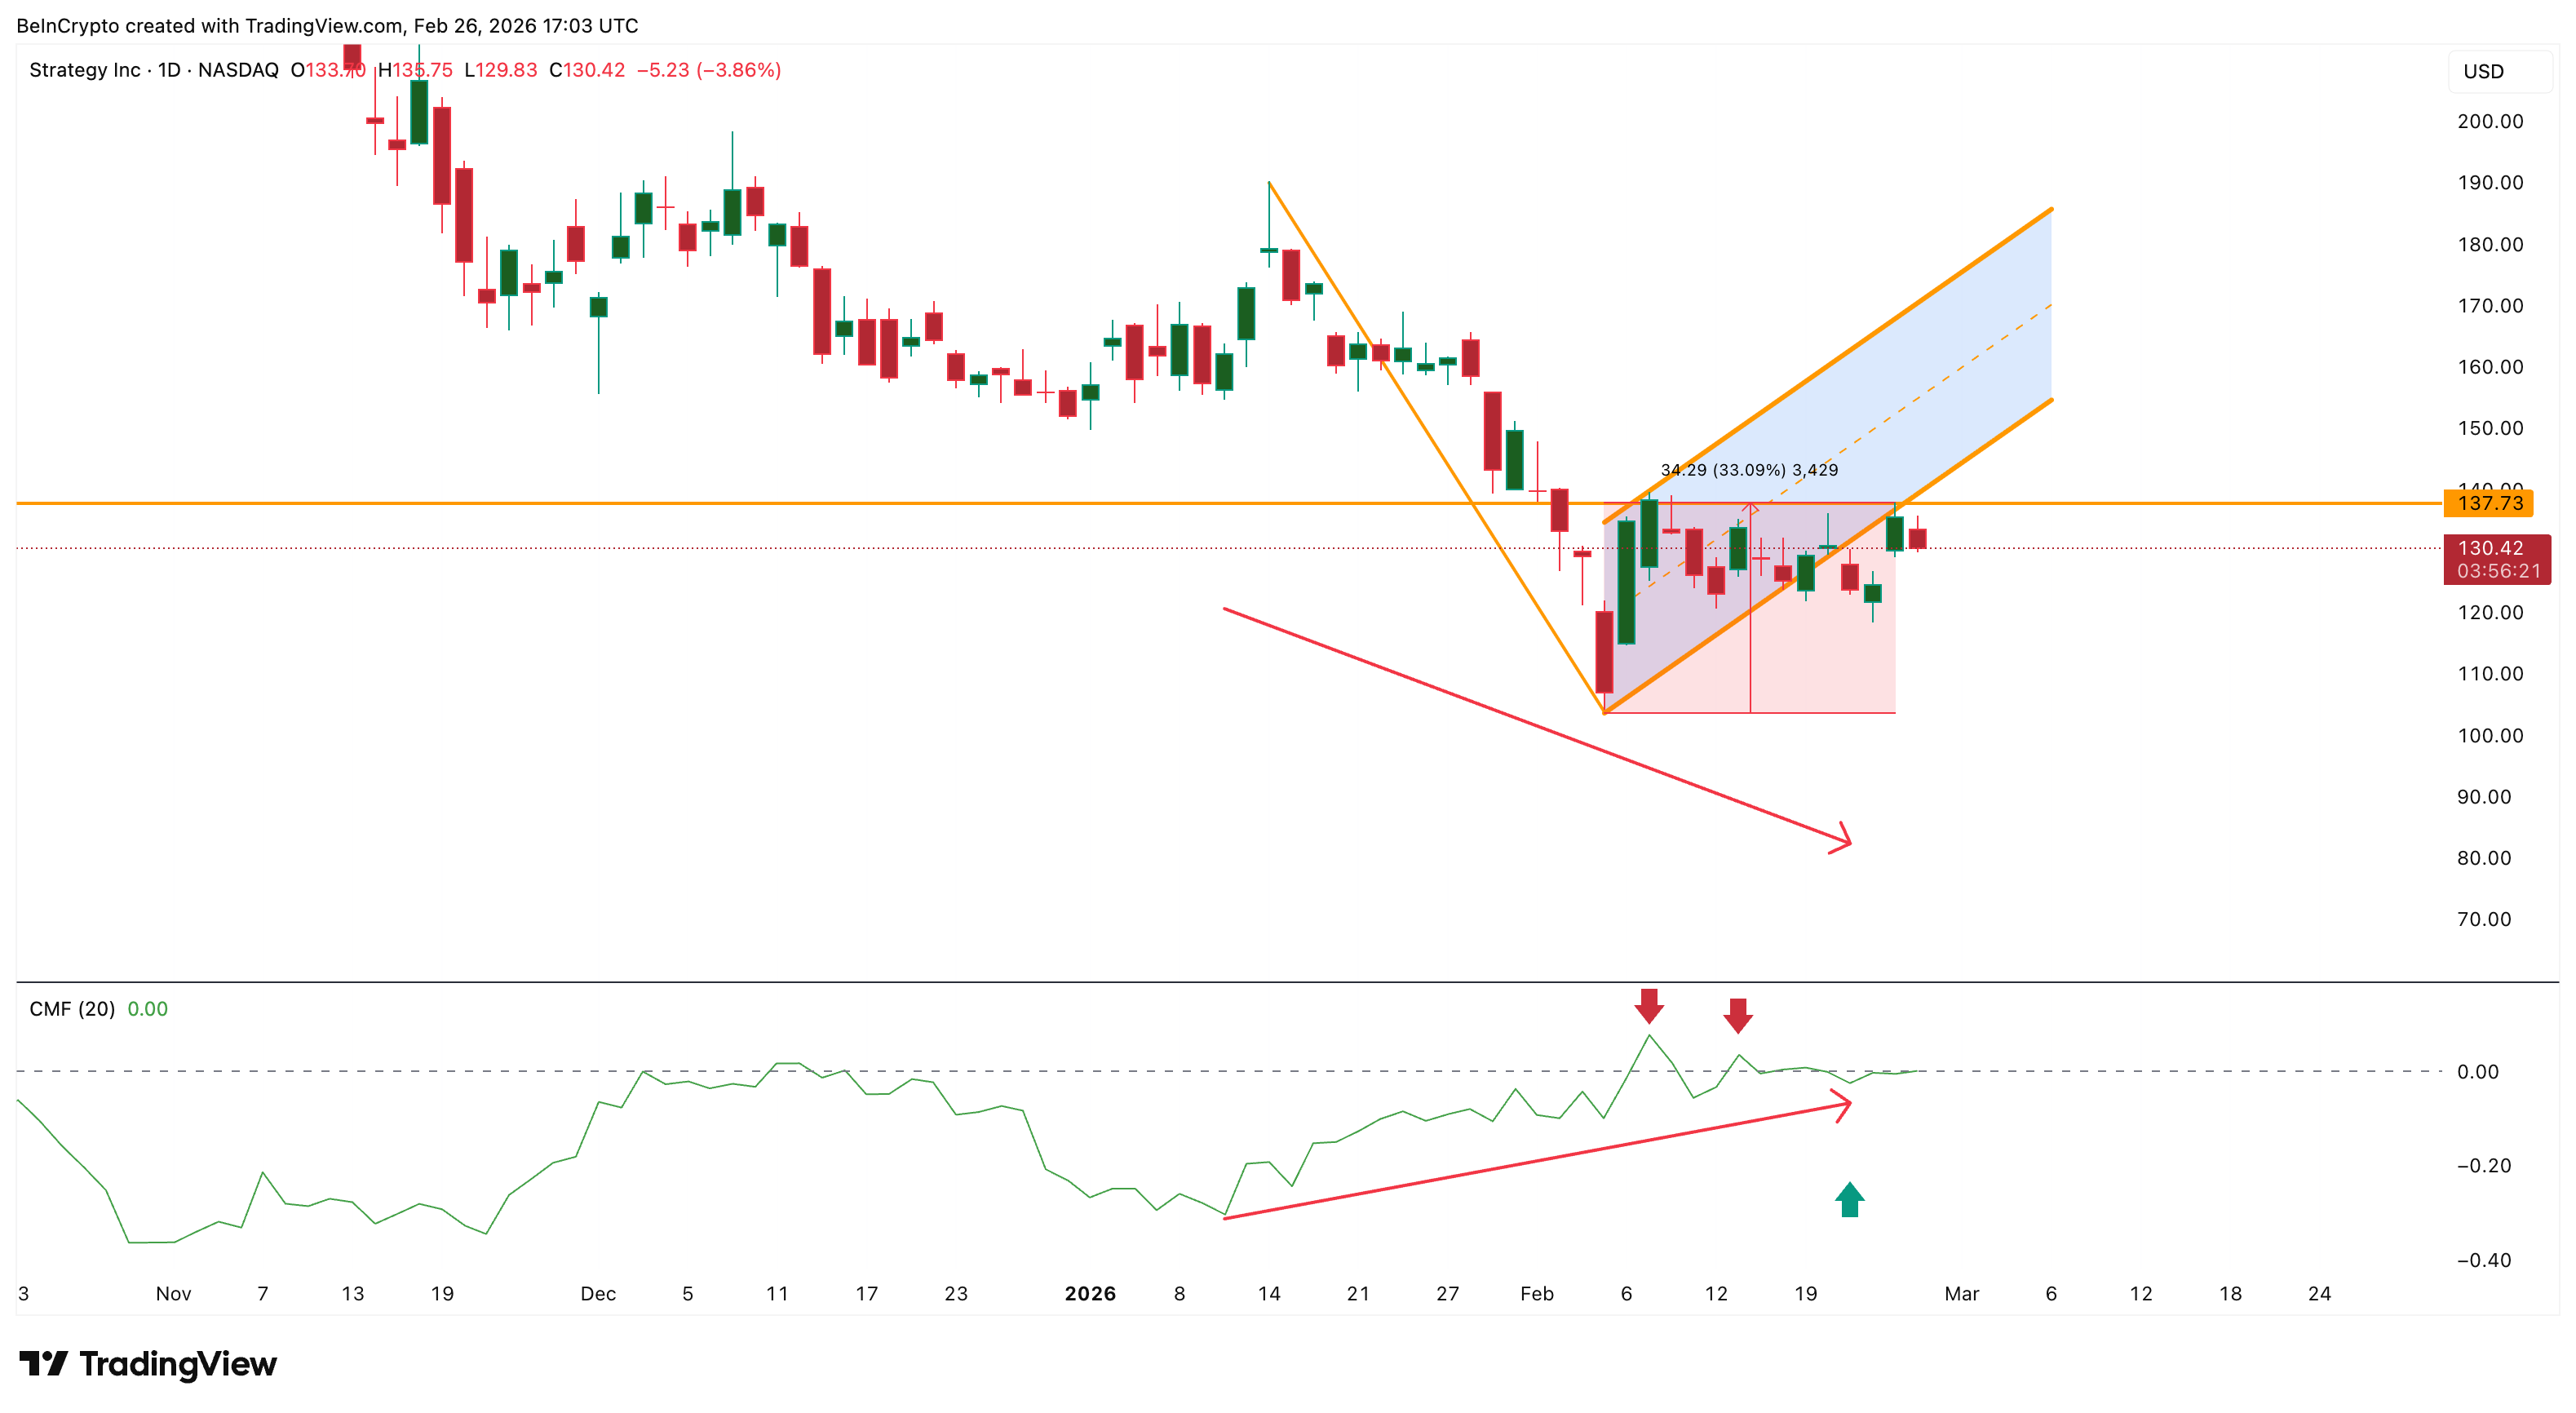
What’s troubling is that the shift happened immediately after MicroStrategy announced its latest Bitcoin purchase on February 23. CMF suggests institutional investors may not be accumulating MicroStrategy stock despite its Bitcoin buying.
This disconnect weakens the bullish case and suggests confidence in the stock itself may be fading. The next direction the CMF line takes might decide the fate of the MSTR stock price.
At the same time, momentum indicators show that the recent drop (between February 25 and February 26) was not unexpected, as underlying strength had already been weakening.
Bearish Divergence Warned of MSTR Stock Price Drop
The Relative Strength Index (RSI), which measures momentum strength on a scale from 0 to 100, showed a bearish divergence before the recent drop.
Between December 9 and February 25, the MicroStrategy stock price formed a lower high, while RSI formed a higher high. This pattern signals weakening momentum because the price is rising without strong buying support.
This type of divergence often appears before major pullbacks. Similar divergences have appeared multiple times in recent months, and each one led to sharp corrections.
For example, a previous divergence completed in mid-Jan triggered a 45% crash, forming the major downtrend that still defines the stock’s broader structure.
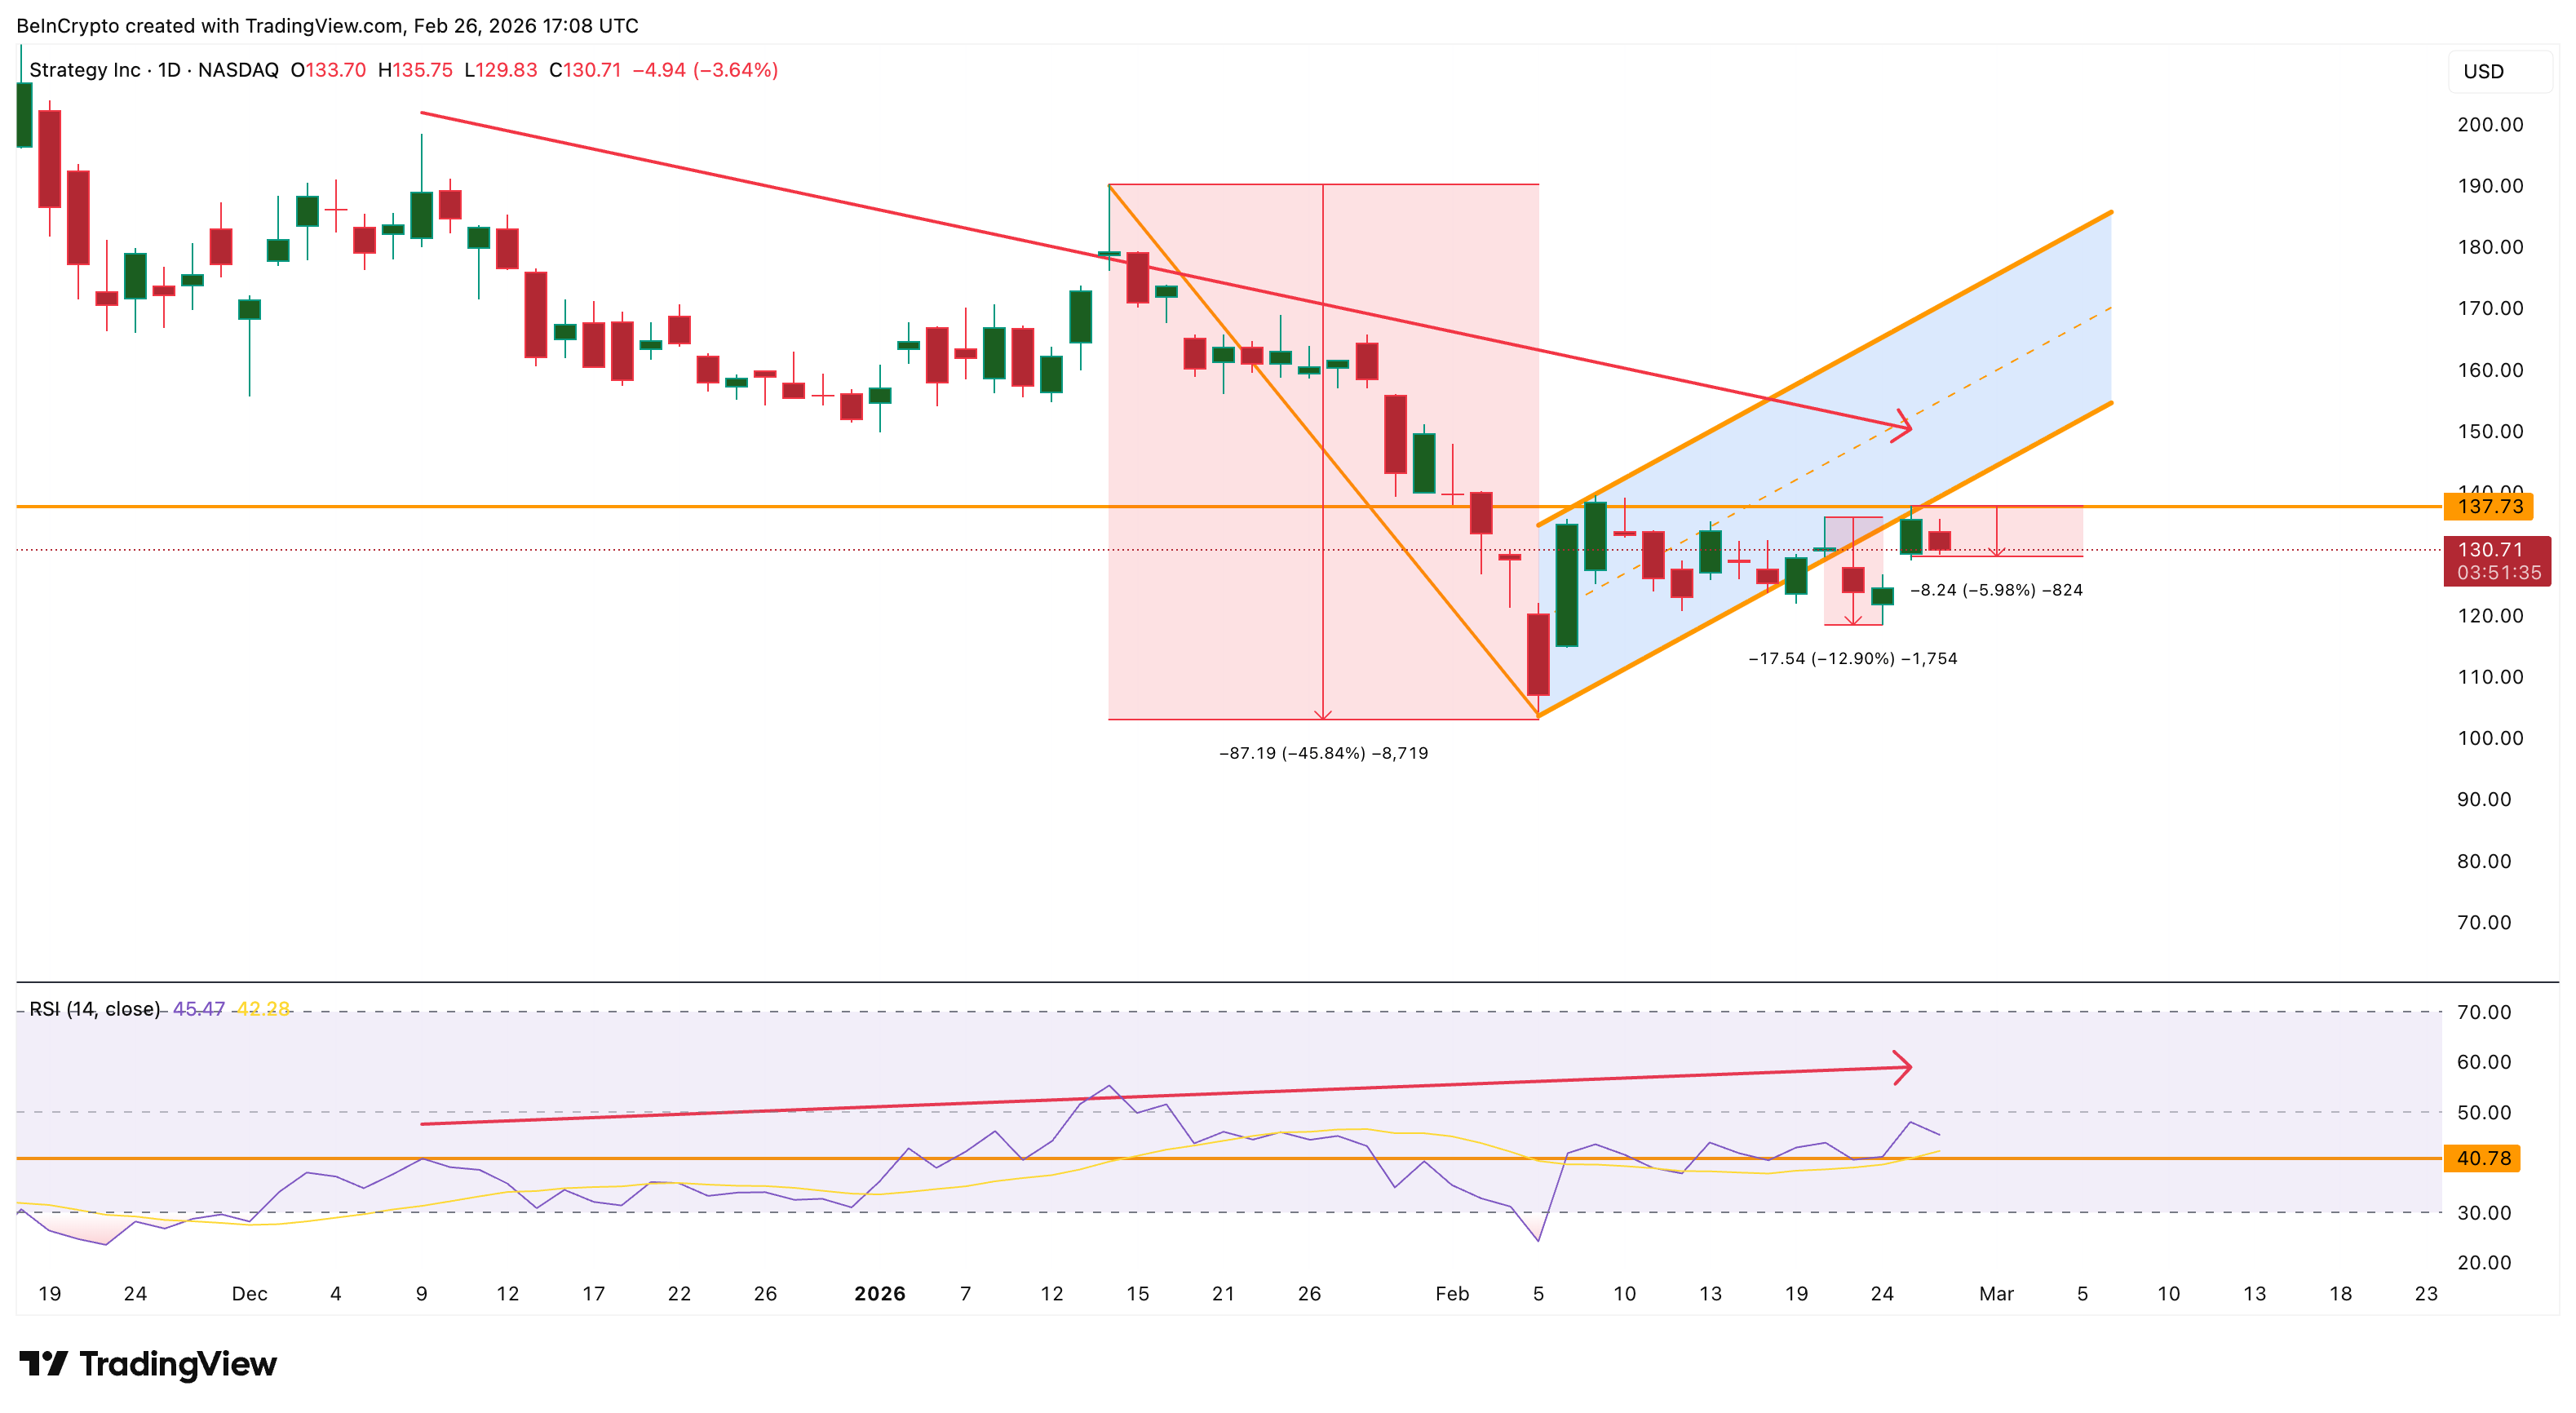
A recent one, concluding on February 20, led to a near 13% dip. The current one has already eaten into 6% of the gains, but because the broader bearish pattern remains active, this decline may be only the early stage of a larger move lower. That wouldn’t be great news for the MicroStrategy shareholders.
MicroStrategy Stock Price Breakdown Structure Points Toward $70
The MicroStrategy stock price has already broken below a bear flag pattern, which is a continuation pattern that forms during temporary rebounds inside larger downtrends. When this pattern breaks down, it usually leads to another strong leg lower.
Right now, the most important support level sits near $119. If this level fails, the next support appears near $106, followed by a stronger technical level near $85.
However, the full breakdown projection based on Fibonacci retracement levels points toward the $71 (the $70 zone) region, which aligns with the 0.786 Fibonacci level and pole’s projected 45%+ dip.
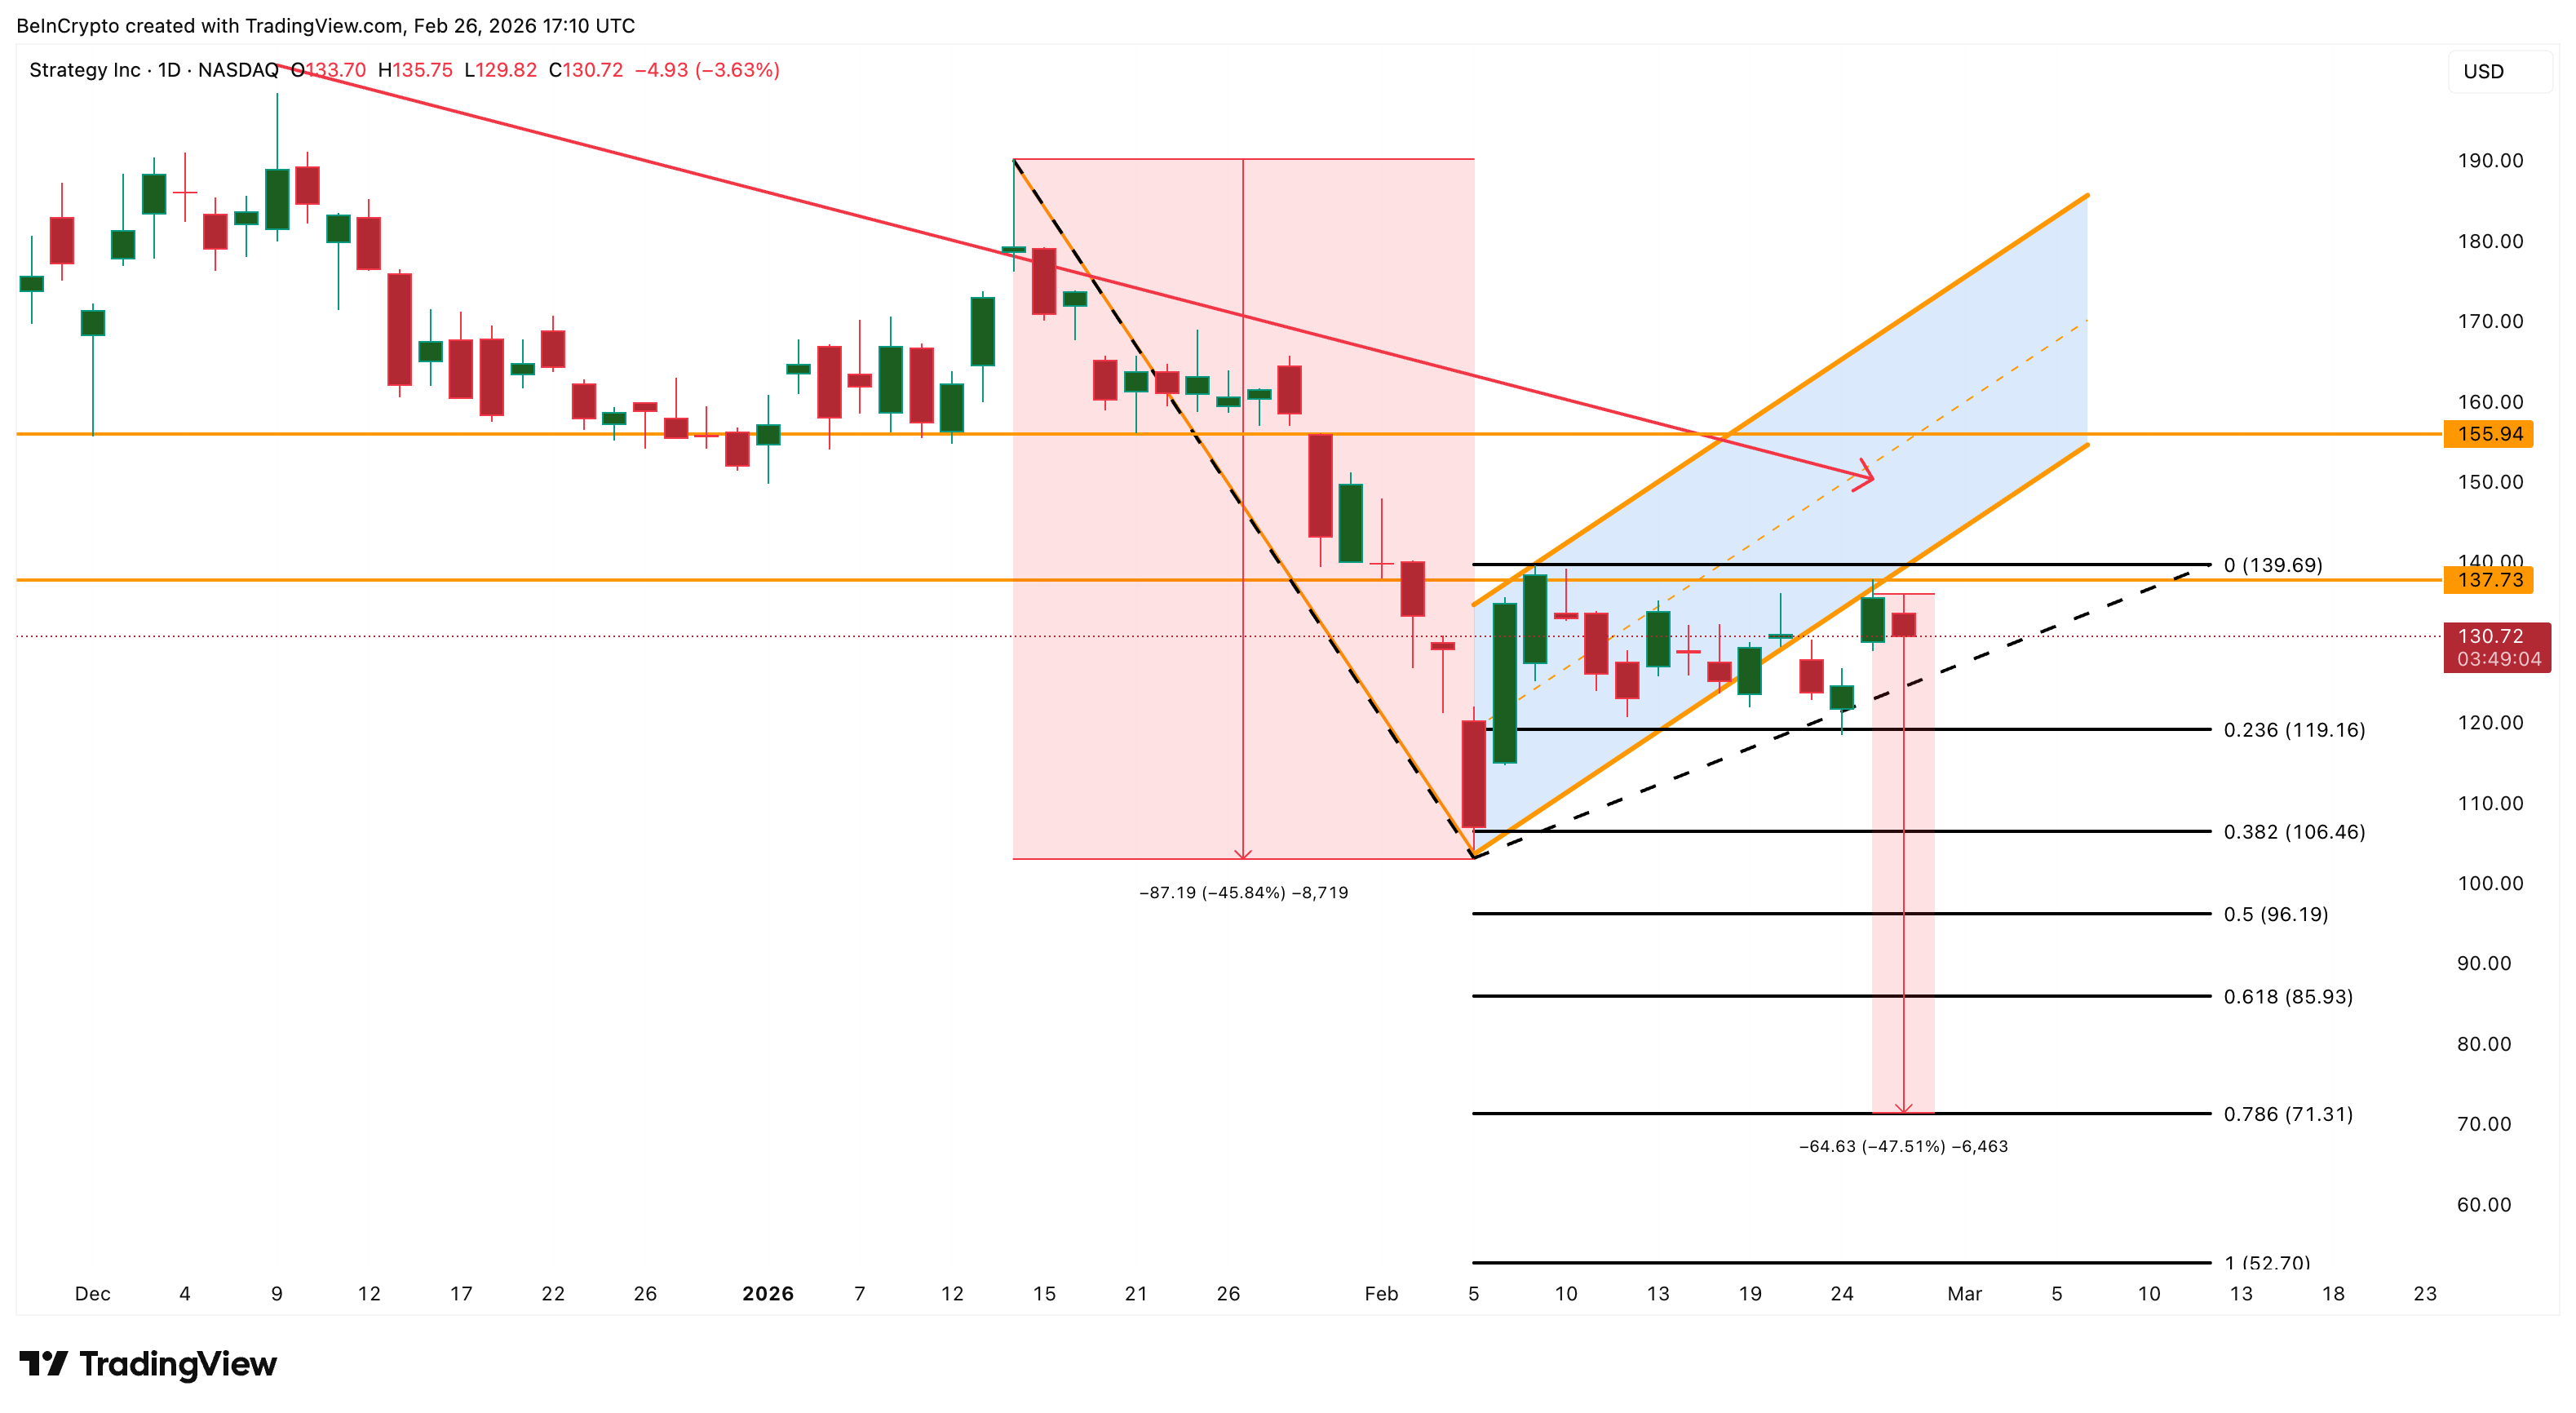
On the upside, the first sign of strength would only appear if MicroStrategy reclaims $139. However, the broader bearish structure would remain intact unless the stock breaks above $155, which would invalidate the breakdown pattern and signal a potential trend reversal.
Until those resistance levels are reclaimed, the current structure suggests MicroStrategy remains vulnerable to further downside, with the $70 zone now emerging as a realistic technical target if $85 gives way, given Bitcoin’s continued weakness.
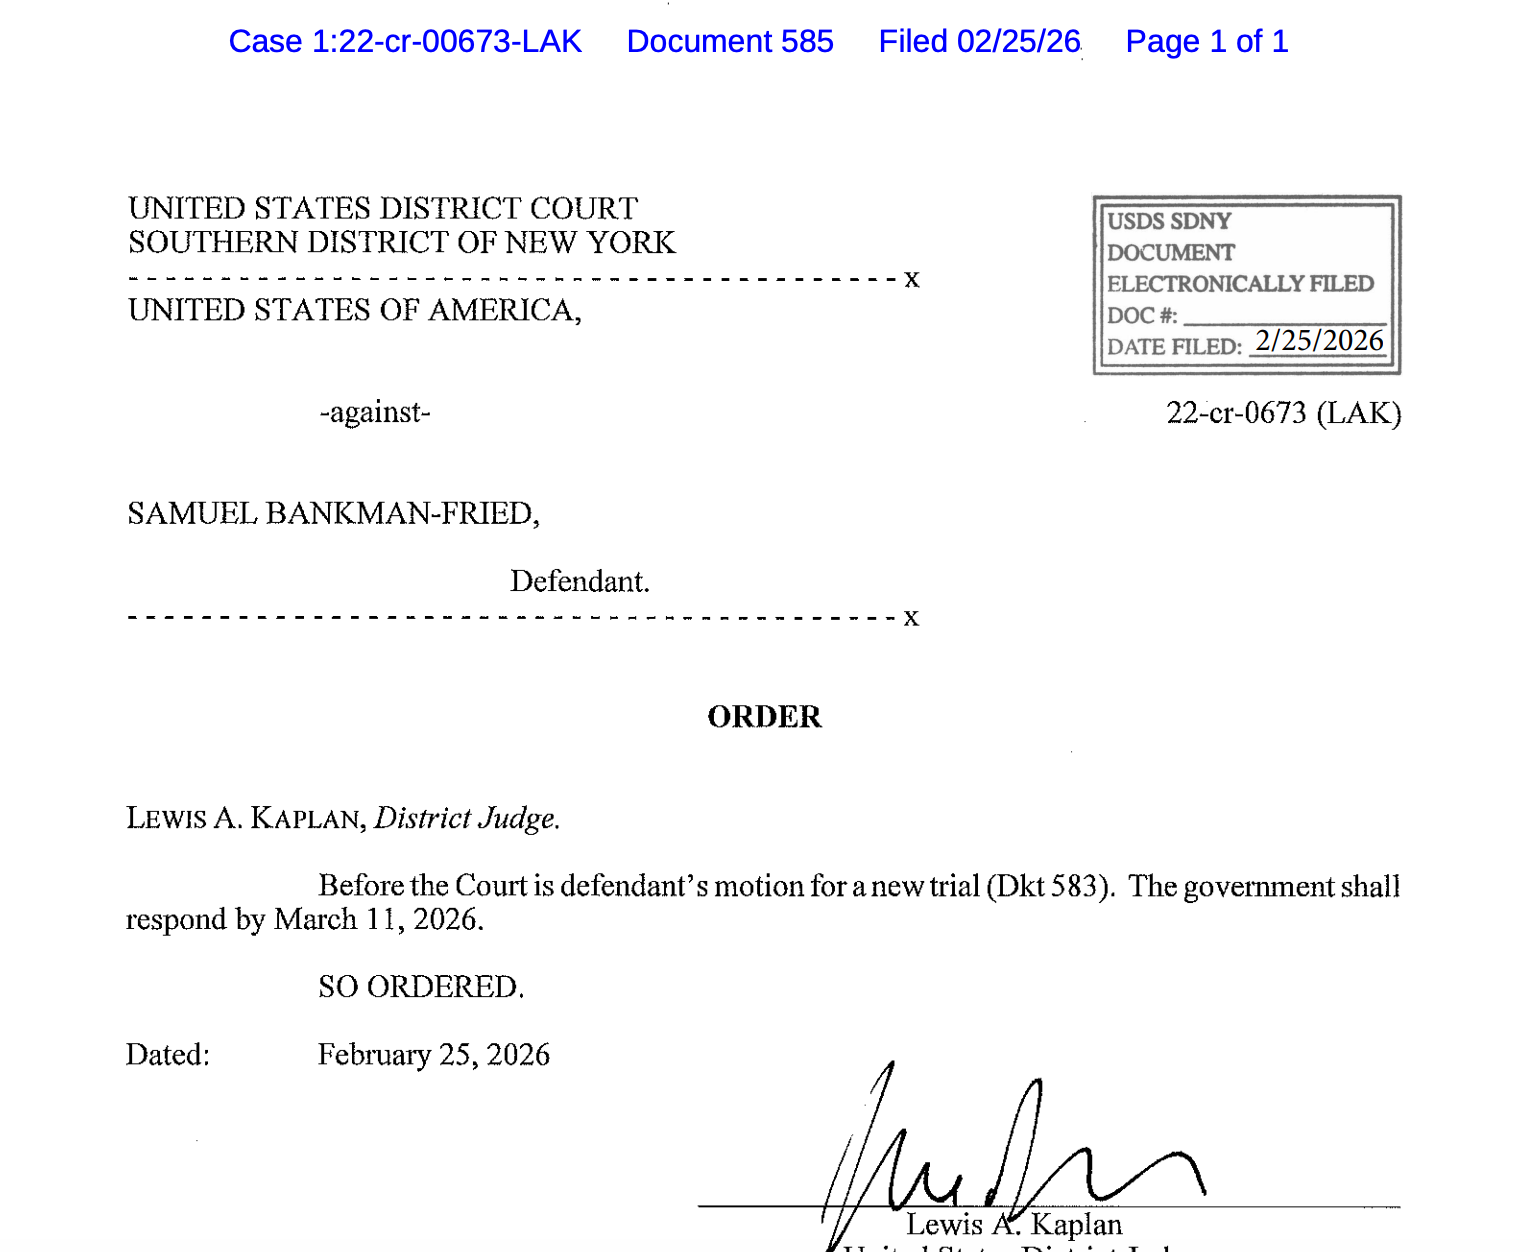
Lawyers representing the US government in the case against Sam “SBF” Bankman-Fried have two weeks to respond to the former FTX CEO’s motion for a new criminal trial.
In a Wednesday filing in the US District Court for the Southern District of New York, Judge Lewis Kaplan said that the US government shall respond by March 11 to SBF’s motion for a new trial. The former FTX CEO, who was convicted of seven felony counts in 2023 and later sentenced to 25 years in prison, requested a new trial earlier this month, claiming that new witness testimony could help bolster his case.

Bankman-Fried, once revered by many as one of the most prominent faces representing the crypto and blockchain industry, was at the center of the controversy around the collapse of FTX. He stepped down as CEO in November 2022, later facing criminal charges in the US for the misuse of user funds.
After Kaplan ordered the former CEO to serve 25 years in prison in March 2024, SBF’s lawyers filed to appeal the conviction and sentence. As of Thursday, the US Court of Appeals for the Second Circuit had not reached a ruling on the filing.
Related: Kalshi bans US politician over alleged insider trading violation
Former Alameda Research CEO Caroline Ellison, who testified against SBF at trial as part of a plea deal with US authorities, was released in January, having spent 440 days in US custody. Ryan Salame, the former co-CEO of FTX Digital Markets, was sentenced to more than seven years and remains incarcerated at the time of publication.
Is Bankman-Fried angling for a presidential pardon?
Although the former CEO was largely silent on social media for his first year in prison, Bankman-Fried later began posting messages supporting US President Donald Trump and challenging information about the collapse of FTX.
In March 2025, SBF gave an interview to political commentator Tucker Carlson — a move that reportedly led to his transfer to a federal correctional institution — claiming that he had better relationships with Republicans than Democrats.
This year, he has posted several times to X, claiming that there had been “political bias” in his case. Bankman-Fried praised Trump’s actions in “standing up” to such bias, while also criticizing Kaplan for overseeing the civil defamation case brought against the then-presidential candidate in 2023.

However, despite Bankman-Fried’s efforts and speculation by many in the crypto industry, the White House has repeatedly said that Trump is not considering a pardon for the former CEO, both in a January New York Times interview and according to a Tuesday report by Fortune. Trump has pardoned several figures in the crypto and blockchain industry since taking office, including former Binance CEO Changpeng Zhao and Silk Road founder Ross Ulbricht.
Magazine: Big questions: Should you sell your Bitcoin for nickels for a 43% profit?


- The TON Wallet Vaults will let users earn yield on BTC, ETH, and USDT.
- Toncoin (TON) is deeply oversold, trading near $1.29 with bearish momentum.
- The key levels to watch are the support around $1.23–$1.26 and the resistance around $1.41–$2.02.
Toncoin (TON) cryptocurrency has faced a sharp decline even as Telegram rolls out its new Vault feature within the TON Wallet.
The launch of “Vault” in TON Wallet allows users to earn yield on Bitcoin (BTC), Ethereum (ETH), and Tether (USDT) without leaving the app.
Vaults are self-custodial, meaning users retain control of their private keys and assets while participating in decentralised earning strategies.
This integration of decentralised finance (DeFi) into a widely used messenger app marks one of the most accessible on-ramps to DeFi for everyday users.
The TON Wallet uses a combination of DeFi protocols to generate yield behind the scenes.
Morpho provides the lending backbone, while the TON Applications Chain executes transactions, and Re7 manages risk and strategy design.
Users simply interact through the Telegram interface, making the process seamless and user-friendly.
Toncoin market reaction
Despite the positive news, Toncoin’s market performance has been under pressure.
The cryptocurrency has dropped to $1.29, down 3.6% over 24 hours.
This decline aligns with a broader market-wide risk-off rotation.
The total crypto market cap fell 2.43%, and sentiment remains in extreme fear, with the Fear & Greed Index at 16.
Notably, altcoins are underperforming Bitcoin, and Toncoin has moved in line with the market.
TON price technical analysis
Technical indicators show a bearish trend.
The price has broken both the 7-day and 30-day simple moving averages, confirming downward momentum.
In addition, the Relative Strength Index (RSI) reads 26.42, indicating deeply oversold conditions.
The selling volume has also increased by almost 30%, showing persistent pressure despite the oversold state.
Looking at the historical chart movements, the key support lies between $1.23 and $1.30, and the Fibonacci levels highlight this zone as critical for potential short-term rebounds.
A bounce could occur if buyers step in at these levels, especially if Bitcoin stabilises after its recent decline.
CoinLore’s analysis highlights additional support at $1.06 and a secondary zone near $0.8280.
On the upside, the immediate resistance is at $1.41, $1.79, and $2.02, marking key thresholds for traders to watch.
Traders should focus on high-volume rejection or acceptance around the $1.26–$1.30 range to gauge the next move.
Toncoin price prediction
With the introduction of Vaults, TON now combines utility and DeFi access, which could support demand if broader market conditions improve.
If the Toncoin price holds above the $1.23–$1.26 support zone, a short-term rebound toward the 7-day SMA at $1.33 could be possible.
Otherwise, a break below $1.23 may open the path to $1.14, where further downside could extend toward $1.06.
But the oversold RSI suggest a potential bounce, although caution is advised, as the market remains under pressure.
In case of a rebound, clearing the $1.41 resistance would signal strength and potentially push TON toward $1.79 and $2.02.
As US policymakers scrutinize prediction markets platforms, many Polymarket users won bets over speculation as to which insider trading an online sleuth had exposed.
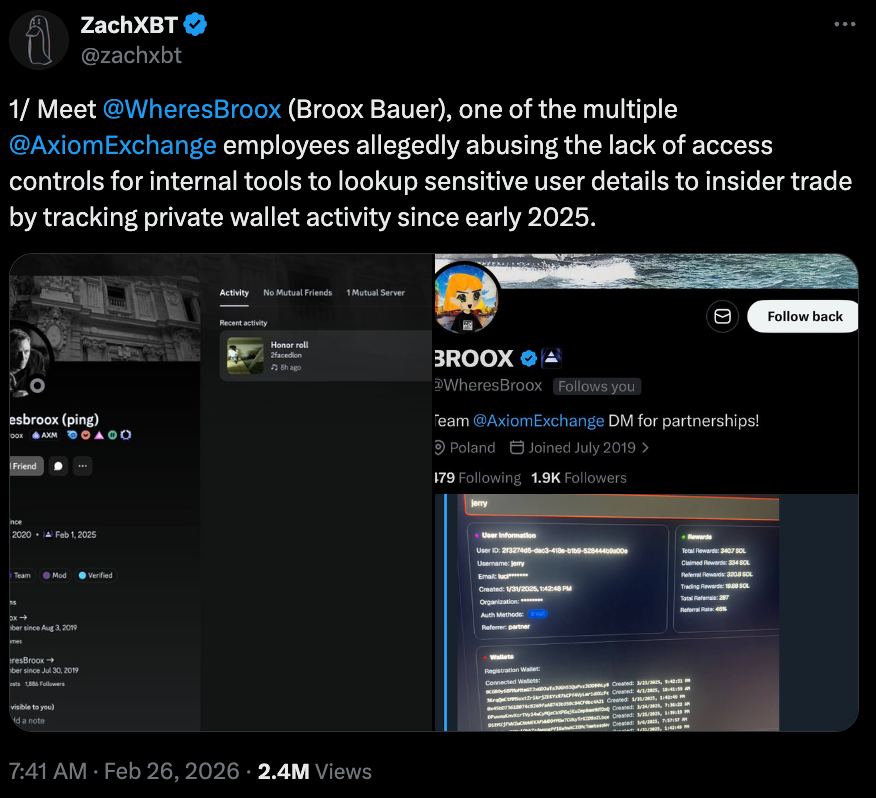
Polymarket users betting on an employee at trading platform Axiom as the target of an insider trading investigation by ZachXBT were rewarded after the crypto sleuth announced the results on social media to his 977,500 followers.
In a Thursday X post, ZachXBT said Axiom employee Broox Bauer and others allegedly were responsible for insider trading activity at the company “since early 2025.” According to the pseudonymous onchain investigator, Bauer allegedly used internal tools “to lookup sensitive user details to insider trade by tracking private wallet activity.”

ZachXBT shared audio clips related to the investigation, in which an individual he said was Bauer claimed he could track Axiom users. In an X post following the announcement, Axiom said it was “shocked and disappointed” in the news.
“We have removed access to these tools and will continue to investigate and hold the offending parties responsible,” said Axiom. “This does not represent us as a team, we have always tried to put the user first.”
The investigation was the latest by the online sleuth, known in the industry for uncovering scams, hacks and instances of insider trading or other unscrupulous activities. Polymarket users bet nearly $40 million leading up to today’s reveal speculating that Axiom would be the target of the probe.
Related: Kalshi bans US politician over alleged insider trading violation
One Polymarket user, who placed separate bets on a similar event contract, profited by about $400,000. Others traded more than $9.7 million on the platform’s “Which crypto company will ZachXBT expose for insider trading?” contract, winning their bets.
Prediction platforms under scrutiny in US for state-federal divide on enforcement
Last week, Commodity Futures Trading Commission (CFTC) Chair Michael Selig said that the federal regulator had “exclusive jurisdiction” over prediction markets, pushing back against several state-level authorities targeting platforms like Polymarket and Kalshi over sports betting. The CFTC chair warned that any state-level entities challenging the federal agency would be met in court.
Magazine: Clarity Act risks repeat of Europe’s mistakes, crypto lawyer warns
Disclosure: This article does not represent investment advice. The content and materials featured on this page are for educational purposes only.
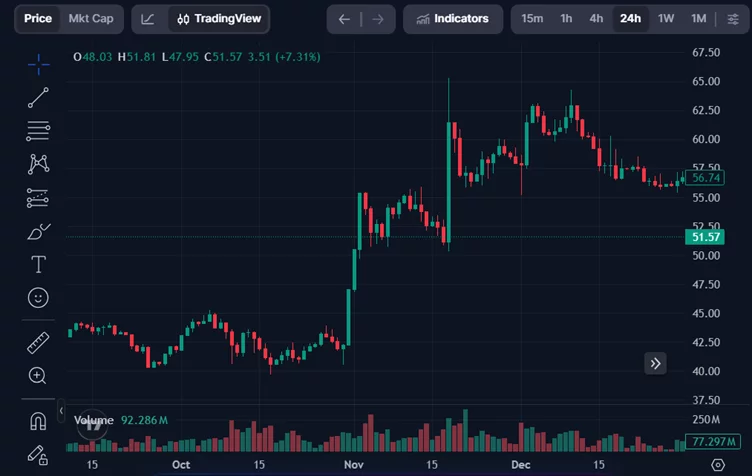
WhiteBIT’s WBT surges 3,337% in three years, hitting $65.30 from a $1.90 launch price.
Summary
- WhiteBIT’s WBT surges from $1.9 in 2022 to $65.30, marking a 3,337% rise in three years.
- WBT powers WhiteBIT’s ecosystem, offering fee discounts, staking perks, and weekly token burns to cut supply.
- WBT joins five S&P Crypto indices, signaling growing institutional recognition of exchange-based tokens.
WhiteBIT launched its native token WBT in August 2022 at around $1.9. Three years later, it touched an all-time high of $65.30 — a roughly 3,337% gain from its low — making it one of the top-performing exchange tokens in the market.
The numbers tell the story
WBT bottomed at around $3 in September 2022, just weeks after launch. It spent most of 2023 quietly grinding between $3 and $6. Nothing flashy. By the end of 2023, it closed the year at $5.78. A slow start by crypto standards.

Then came 2024. The token climbed steadily to close the year at around $24.61, roughly a 4x from where it started the year. And 2025 is where things really accelerated. WBT went past $30, then $40, then $50, eventually hitting $65.30 on November 18, 2025, according to CoinMarketCap. As of February 2026, it’s consolidating around $50, sitting at a market cap above $10 billion and ranking among the top 15 globally.
What’s actually driving it
WBT is not a standalone token. It’s the native coin of WhiteBIT, one of the largest European crypto exchanges by traffic. The exchange was founded in 2018 and serves 8 million customers. It’s also a part of the W Group, which serves 35 million customers globally, and reached a total capitalization of $38.9 billion in 2025.
WBT’s utility is embedded in the platform. It is said that holders of WBT get up to 90% off taker fees, up to 100% off maker fees, free daily ERC 20 and ETH withdrawals, free AML checks, boosted referral rates up to 50%, access to staking rewards, VIP status, and access to the Earn program.
WBT has a maximum token number of 400 million. On top of that, the exchange runs a weekly token burn mechanism, creating a deflationary pressure that reduces circulating supply over time. As of early 2026, about 214 million tokens are in circulation.
Most notably, WBT was added to 5 S&P Crypto indices, underscoring the platform’s expanding influence in the global digital asset market and highlighting a broader industry shift toward regulated, infrastructure-focused players.
Strategic moves that mattered
WhiteBIT relies on tokenomics, but the exchange has also made strategic bets that directly impacted WBT’s visibility and credibility.
In 2025, WhiteBIT doubled down by becoming the sleeve partner and official cryptocurrency exchange partner of Juventus FC. The deal marked a strategic move towards the company’s mission to make cryptocurrency more accessible to a wider audience.
On the expansion side, WhiteBIT launched operations in the United States through WhiteBIT US, an independent entity to scale and operate locally across the country. It also entered a cooperation agreement with Saudi Arabia, focusing on Kingdom’s blockchain infrastructure and CBDC framework development, and stock market tokenization.
Where could it go from here?
WBT is currently trading about 25% below its all-time high, with 99.52% of its circulating supply in profit according to recent on-chain data. That’s a positive position, but it also means the token is at a level where holders could take profits during any broader market weakness.
The bull case rests on continued exchange growth, further geographic expansion (the US and Saudi launches are still early), institutional adoption, and the deflationary burn mechanism steadily compressing supply. WhiteBIT has also mentioned that it is currently progressing with its MiCA compliance efforts and pursuing EU licensing.
If WhiteBIT continues scaling at its current pace and the broader crypto market enters a sustained bull cycle, WBT could push past its previous high.
The bear case is simpler: exchange tokens live and die by the exchange’s performance. Regulatory headwinds, increased competition from Binance or Coinbase, or a prolonged market downturn could stall momentum.
Disclosure: This content is provided by a third party. Neither crypto.news nor the author of this article endorses any product mentioned on this page. Users should conduct their own research before taking any action related to the company.
Crypto World
Ethereum adds $15b in market value amid rising allocations to emerging crypto protocols


Disclosure: This article does not represent investment advice. The content and materials featured on this page are for educational purposes only.
Mutuum Finance gains momentum as Ethereum rebounds, raising $20.6m with 19,000+ holders.
Summary
- Mutuum Finance raises $20.6m as Ethereum gains momentum, with MUTM priced at $0.04 and 19,000+ holders.
- Ethereum-based Mutuum lets users borrow via over-collateralization while retaining full asset ownership.
- Lenders earn yield through mtTokens, which grow in value as borrowers repay interest-backed loans.
While much of the early year was defined by caution, a sudden surge in crypto buying activity has caught the attention of global analysts. Ethereum (ETH), the world’s second-largest cryptocurrency, is leading this recovery.
This move represents a deeper change in how the market values blockchain projects. Large investors are increasingly looking for platforms that provide transparent financial services. By rotating capital back into Ethereum and its broader ecosystem, investors are prioritizing projects with deeper liquidity, stronger fundamentals, and proven infrastructure.
Ethereum
The road to this recovery has been difficult for Ethereum. Since reaching peaks in August 2025, the asset faced a long and steady decline. By February 6, 2026, the Ethereum price had fallen to approximately $1,746, representing a drop of over 45% from its previous highs.
This fading period was caused by a mix of high interest rates and a general lack of confidence in the broader market. Many traders feared that the asset would continue to slide as leverage was wiped out across various exchanges.
However, the trend shifted dramatically in late February. In less than 24 hours, Ethereum managed to add more than $15 billion to its total market capitalization. This sudden jump pushed the asset back toward the $2,000 mark and restored a sense of optimism to the ecosystem.
This increase is crucial because it suggests that a “market bottom” has likely been formed. When such a massive amount of value is added in a single day, it usually indicates that institutional buyers are stepping in to secure positions before the next growth cycle begins.
This recovery is also supported by a massive drop in “open interest.” After a $7 billion leverage collapse earlier in the month, the market is now much “cleaner.” Most of the risky, debt-based positions have been closed, leaving behind long-term holders and spot buyers. With the market cap now holding firm, the focus has shifted to the projects being built on top of this rejuvenated network.
Mutuum Finance
As Ethereum regains its strength, the Mutuum Finance (MUTM) protocol is showing similar momentum. This Ethereum-based project has raised over $20.6 million in total funding, with the MUTM price currently at $0.04. This financial success is backed by a rapidly growing community that has officially surpassed 19,000 individual holders.
Preparing the dual-market mechanism
One of the primary reasons Mutuum Finance is catching the eye of professional investors is its dual-market design. According to its official plans, the protocol is preparing two distinct ways for users to interact with liquidity:
- Peer-to-Contract (P2C): This model uses automated liquidity pools. It allows lenders to deposit assets and earn immediate interest. Borrowers can access these pools to get instant loans without needing a direct match with another person. This is ideal for major assets like ETH and USDT where speed and high liquidity are needed.
- Peer-to-Peer (P2P): This market is designed for more customized deals. It allows two individuals to agree on their own terms, such as specific interest rates or loan lengths. This is perfect for niche or more volatile assets that might not fit into a standard pool.
By preparing both models, Mutuum Finance provides a complete solution for different types of risk profiles. It gives users the freedom to choose between automated, fast transactions and direct, custom agreements.
How lending and borrowing works
The Mutuum Finance whitepaper describes a system where users can unlock the value of their crypto without selling it. This is done through a process of over-collateralization. Those want to borrow money must provide assets that are worth more than the loan itself. This ensures the protocol remains safe even if the market becomes volatile.
While providing more collateral than the loan amount may seem counterintuitive, the advantage is that users keep 100% ownership of their assets. If the price of the collateral (like ETH or WBTC) increases while the user has an active loan, they still benefit from that entire price appreciation.
Lenders play a vital role by supplying these assets to the protocol. In return, they receive mtTokens. These are yield-bearing receipts that represent their share of the pool. As borrowers pay back their loans with interest, the value of the mtTokens grows.
This means a lender’s balance increases automatically over time. This mechanism is a draw for long-term holders who want to earn passive income while keeping their original investments.
Protocol launch and on-chain whale allocations
The recent activation of the V1 protocol on the Sepolia testnet has moved Mutuum Finance from a concept to a working product. This version allows the community to test the lending pools, the mtToken system, and the automated risk bots in a live risk-free environment. It supports major assets like WBTC, LINK, ETH, and USDT, giving a look at how the platform handles liquidity.
Since the V1 launch, on-chain data has revealed a significant spike in activity. Several whale allocations have been spotted, with single investments exceeding $100,000. By delivering a working protocol on the testnet and completing a security audit with Halborn, Mutuum Finance has provided the transparency that these larger players require.
Disclosure: This content is provided by a third party. Neither crypto.news nor the author of this article endorses any product mentioned on this page. Users should conduct their own research before taking any action related to the company.
Crypto World
Progmat Taps Avalanche for $2B Token Migration as Japan Pushes Toward Global On-Chain Finance

TLDR:
- Progmat is migrating 439.6 billion yen in tokenized assets from Corda5 to Avalanche, targeting full completion by June 2026.
- All Security Token projects on Progmat’s platform will become EVM-compatible, enabling integration with Ethereum-based DeFi ecosystems.
- Project Keystone uses LCP technology to enable DvP settlement between Security Tokens and stablecoins across different blockchains.
- Avalanche’s sub-second finality and customizable validator controls meet Japan’s strict financial regulatory and settlement infrastructure requirements.
Progmat, a Japan-based fintech company backed by major megabank groups, is migrating over $2 billion in tokenized assets to the Avalanche blockchain.
The company announced the move on February 26, 2026, as part of a broader infrastructure renewal. The migration covers all Security Token projects currently on its platform, totaling assets worth more than 439.6 billion yen. This shift marks one of the largest tokenized asset migrations in Asia’s financial history.
Tokenized Asset Migration Moves From Corda5 to Avalanche
Progmat’s Security Token platform, “Progmat ST,” has operated on Corda5 since its SaaS migration in October 2024.
Now, the company is replacing Corda5 with Avalanche as the underlying distributed ledger. All existing ST projects will transition to an EVM-compatible, gradually permissionless environment on the new chain.
The migration began in fall 2025 and is expected to reach full completion by June 2026. New ST projects have already started including Avalanche transition disclosures in their securities reports.
Trust banks, securities companies, and relevant authorities have been briefed and are cooperating with the process.
Progmat structured the migration to minimize disruption for financial operators and investors already using the platform.
The SaaS layers for ST issuers and administrators remain largely unchanged. Only the chain layer is being replaced, keeping the operational impact on existing participants as low as possible.
Avalanche Selected for Financial-Grade Performance and Flexibility
Avalanche’s technical architecture made it a strong fit for Japan’s regulated financial market. Its L1 framework allows operators to control who can transact, who can develop on the chain, and who can run validator nodes. These controls can be tightened or relaxed over time without stopping the chain.
The platform’s consensus algorithm delivers finality in under one second. This speed is critical for financial settlement, where delays create counterparty risk.
Avalanche also supports native cross-chain communication through its InterChain Messaging protocol, enabling fast and low-cost transfers between L1 chains.
EVM compatibility adds another layer of value. Developers can use existing Ethereum tools and libraries when building on Progmat’s Avalanche infrastructure.
This opens the door to integration with a wide range of DeFi services and smart contract ecosystems, expanding the market reach for tokenized assets held on the platform.
Cross-Chain Infrastructure Enables Global Settlement Capabilities
Beyond the migration, Progmat is commercializing cross-chain settlement services under a project named “Project Keystone.”
At its core is LCP, a light client proxy running on Trusted Execution Environments, developed in collaboration with Datachain.
This technology enables DvP settlement between Security Tokens and stablecoins, and PvP settlement between stablecoins from different jurisdictions.
The need for cross-chain services stems from a fragmented global market. Japan, the United States, Europe, and South Korea are each developing their own currency-denominated stablecoins on separate ledgers.
Without interoperability, cross-border transactions between these platforms remain blocked. Progmat’s infrastructure aims to bridge these gaps for institutional participants.
The IBC/LCP protocol was chosen as a core component because it operates without locking operators into a single vendor.
As an open standard, it allows multiple solution providers to participate, which protects the sovereignty concerns of regulated financial institutions.
Combined with Avalanche’s native communication tools, the framework positions Progmat’s platform as a bridge between Japan’s domestic ST market and global on-chain finance infrastructure.

Recordings and screenshots reviewed by the blockchain investigator show internal tools that surfaced users’ private wallets and trade histories.
Blockchain sleuth ZachXBT has accused employees at crypto trading platform Axiom of abusing internal tools to spy on users and trade using private wallet data, according to a detailed investigation posted on X today.
The alleged activity dates back to early 2025 and involves a senior business development employee based in New York.
According to ZachXBT, the employee, Broox Bauer, is heard on recordings claiming he could track “any Axiom user via ref code, wallet, or UID” and could “find out anything to do with that person.” In one clip cited by ZachXBT, Bauer also describes gradually increasing the number of wallets he monitored “so it does not look that suspicious.”

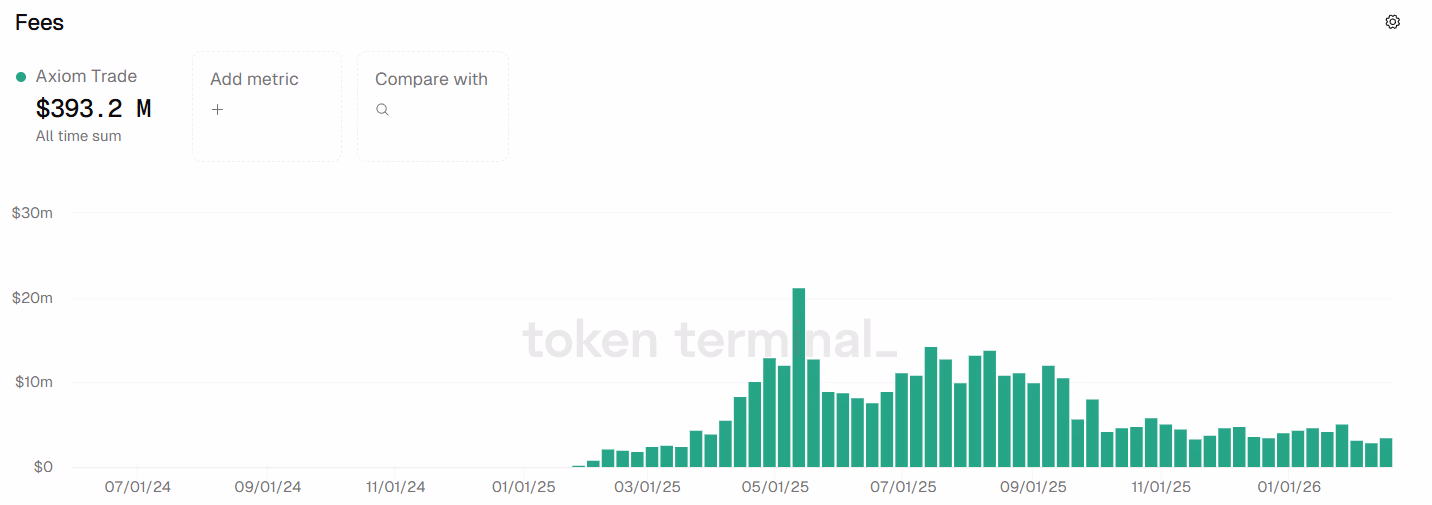
Axiom was founded by Henry Zhang — also known as Mist — and Preston Ellis — also known as Cal — in 2024 and later went through Y Combinator before quickly becoming one of the most profitable crypto platforms. The web-based trading terminal pulled in tens of millions of dollars in fees just months after launching in late January 2025, The Defiant reported earlier.
‘No Monitoring or Access Controls’
Screenshots shared in the X thread also show internal dashboards listing users’ private wallets, linked accounts, and transaction history, data that sources contacted by ZachXBT said appeared accurate.
The group also allegedly maintained shared spreadsheets mapping wallets tied to well-known traders and memecoin promoters. In another recording, Bauer lays out a plan to help a colleague make $200,000 by abusing this access, saying he would send over “the full list of wallets.”
“Regardless of whether Cal or Mist were aware, there was little to no monitoring or access controls in place to mitigate this abuse from happening in the first place,” ZachXBT wrote.
Because Bauer is based in New York, he added that the case could fall under the Southern District of New York, even if no criminal charges are ultimately filed.
It’s unclear, however, how much profit, if any, was made using the alleged insider information.
‘Shocked and Disappointed’
As the details came out, Axiom said in an X post, “We are shocked and disappointed to hear that someone on our team abused internal customer support tools to look up user wallets.” The company added that it “removed access to these tools and will continue to investigate and hold the offending parties responsible.”
Days before ZachXBT publicly named the firm, an alleged Axiom affiliate using the alias devininsider was already pushing back on speculation around Axiom. “We are simply a terminal that allows people to trade open market memecoins, what could we be possibly insider trading lol,” they said.
Blockchain tracker Lookonchain noted in an X post that just hours before ZachXBT named Axiom as the company accused of insider trading, two new anonymous wallets bet $59,800 on Axiom on Polymarket, and within three hours, turned it into $109,000.


Blockchains and artificial intelligence are complementary technologies, according to crypto asset manager Grayscale, even as markets have recently treated them as part of the same trade.
Zach Pandl, Grayscale’s head of research, said that while disruptive technologies tend to produce clear winners and losers, the relationship between AI and blockchain is more symbiotic than competitive. Rapid AI adoption is expected to reward some industries, such as chipmakers, while pressuring others, including segments of professional services.
“Although crypto valuations have been tightly correlated with the drawdown in software stocks, we think blockchains and AI are complementary from a fundamental standpoint,” he said in the Wednesday blog post.
U.S. equity markets have lately focused on the downside. The S&P 500 software index has fallen roughly 20% year to date, and crypto valuations have moved closely with the selloff. But Pandl maintains that the parallel drawdown obscures a more constructive long-term dynamic between the two technologies.
Investor anxiety about artificial intelligence’s disruptive potential has sparked a broad sell-off in tech and software stocks, erasing significant market value as traders reassess long-held valuations.
U.S. software and services shares have plunged sharply, wiping out roughly $1 trillion in market capitalization, as fears mount that fast-advancing AI tools could upend traditional business models and revenue streams.
The S&P 500 software index has slumped as investors rotate out of high-flight tech names amid heightened volatility and skepticism over how quickly and profitably AI adoption will play out.
Pandl contends that blockchains are likely to become the financial rails for AI agents. Today’s chatbots operate largely outside the financial system. But if AI agents are equipped with digital wallets, he expects them to transact over blockchains rather than traditional bank infrastructure.
Blockchains offer transparency, near-instant settlement, 24/7 availability and global reach with an internet connection, he said. While opening a bank account requires a human intermediary, any user, including a bot, can create a blockchain address. Pandl said rising volumes of low-value stablecoin transactions would be an early signal that this thesis is playing out.
At the same time, he argued that blockchain technology could help mitigate some of AI’s risks. As large language models proliferate, concerns around data provenance, deepfakes and the concentration of control over resources and decision-making are likely to intensify. Public blockchains, Pandl said, can provide verifiable records and more decentralized infrastructure to counterbalance those trends.
The report acknowledged AI may also introduce new challenges for crypto networks. Advanced tools could make blockchain surveillance more effective, potentially eroding user privacy. AI agents may also uncover new vulnerabilities in smart contracts; OpenAI recently launched EVMbench, an initiative aimed at using AI to identify and patch such risks.
Read more: Crypto isn’t losing to AI, its just ‘capitalism doing its job,’ says Dragonfly
McCurdy, Beacon Financial Corp chief banking officer, sells $538k in shares

WLFI price prediction as World Liberty Financial proposes governance overhaul

The Forgotten Buffy Episode That Inspired The Best Superhero Show Ever Made


-

 Video7 days ago
XRP News: XRP Just Entered a New Phase (Almost Nobody Noticed)
-

 Politics5 days ago
Baftas 2026: Awards Nominations, Presenters And Performers
-

 Fashion6 days ago
Weekend Open Thread: Boden – Corporette.com
-

 Sports3 days ago
Women’s college basketball rankings: Iowa reenters top 10, Auriemma makes history
-

 Politics3 days ago
Nick Reiner Enters Plea In Deaths Of Parents Rob And Michele
-

 Business2 days ago
True Citrus debuts functional drink mix collection
-

 Crypto World2 days ago
XRP price enters “dead zone” as Binance leverage hits lows
-

 Business4 days ago
Mattel’s American Girl brand turns 40, dolls enter a new era
-

 Business4 days ago
Law enforcement kills armed man seeking to enter Trump’s Mar-a-Lago resort, officials say
-

 Tech2 days ago
Unsurprisingly, Apple's board gets what it wants in 2026 shareholder meeting
-

 NewsBeat19 hours ago
Cuba says its forces have killed four on US-registered speedboat | World News
-
 NewsBeat21 hours ago
Manchester Central Mosque issues statement as it imposes new measures ‘with immediate effect’ after armed men enter
-
 NewsBeat3 days ago
‘Hourly’ method from gastroenterologist ‘helps reduce air travel bloating’
-

 Tech4 days ago
Anthropic-Backed Group Enters NY-12 AI PAC Fight
-

 NewsBeat4 days ago
Armed man killed after entering secure perimeter of Mar-a-Lago, Secret Service says
-

 Politics4 days ago
Maine has a long track record of electing moderates. Enter Graham Platner.
-
 NewsBeat2 days ago
Police latest as search for missing woman enters day nine
-

 Business15 hours ago
Discord Pushes Implementation of Global Age Checks to Second Half of 2026
-

 Crypto World2 days ago
Entering new markets without increasing payment costs
-
 Sports3 days ago
2026 NFL mock draft: WRs fly off the board in first round entering combine week