

Crypto World
Solana price slips back into old range as 78 support comes
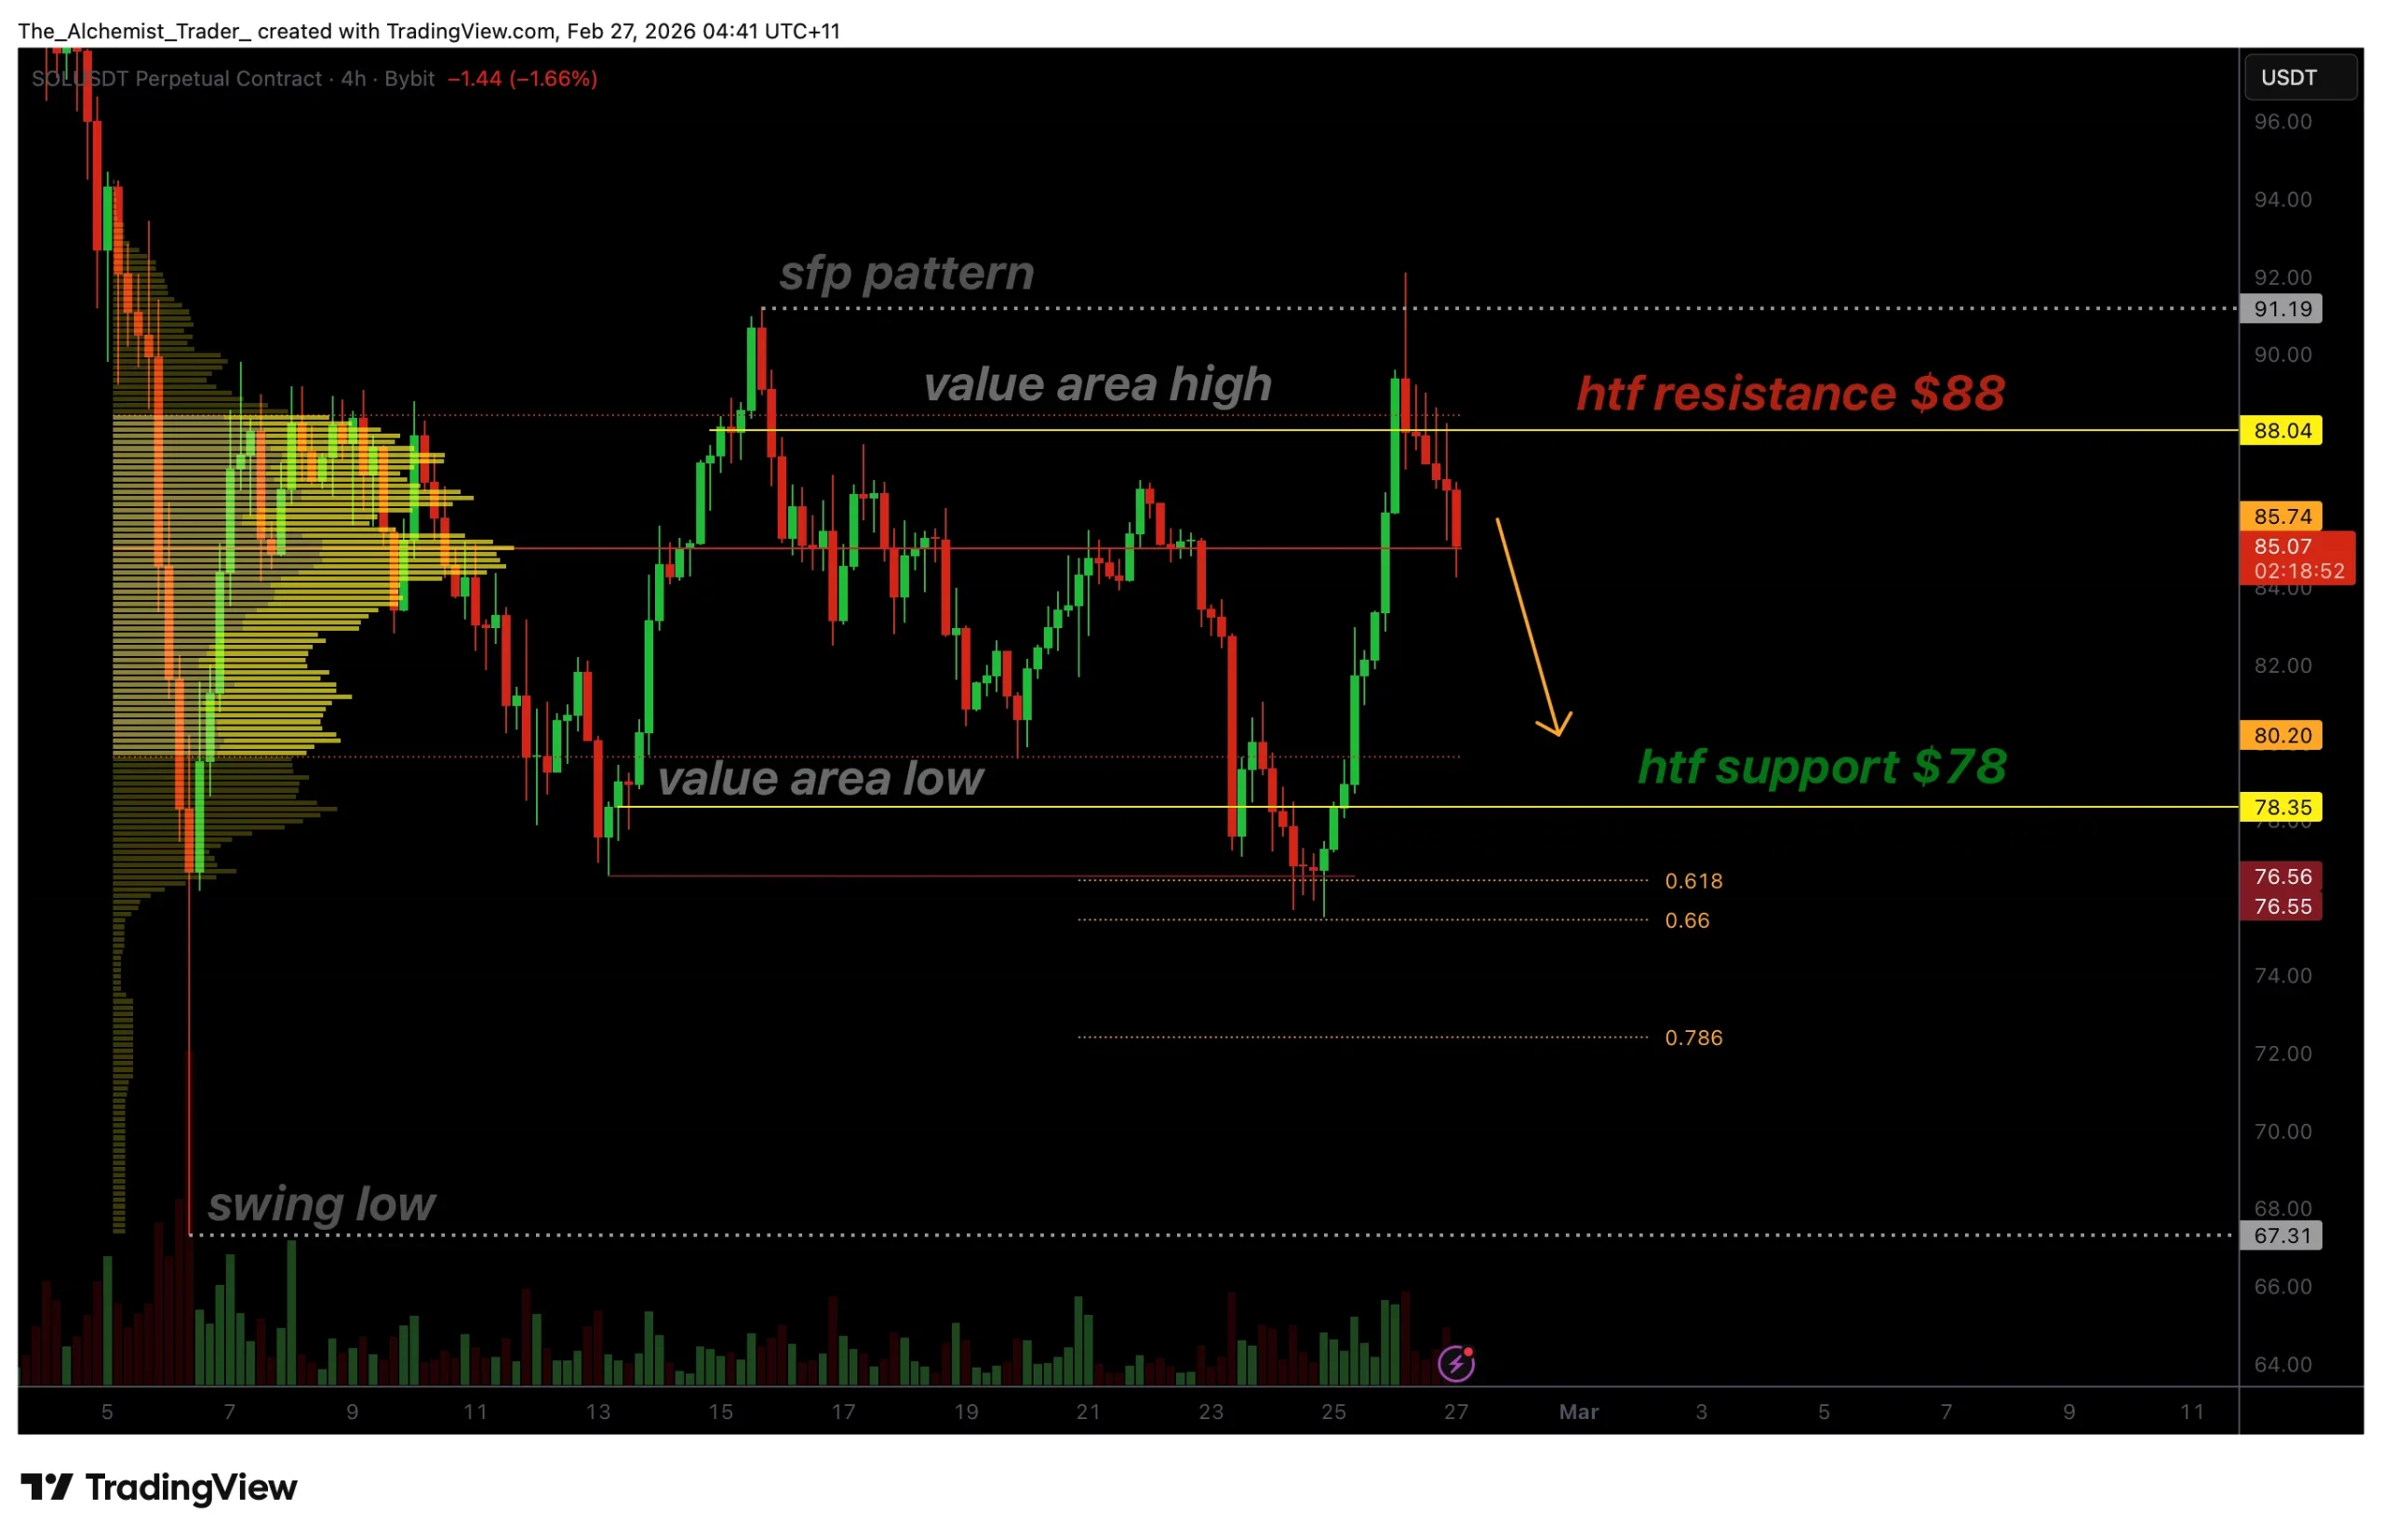
Solana price has turned corrective after losing key support near $88, pushing price back into its previous trading range. The shift in market structure now places $78 support at risk as downside pressure builds.
Summary
- Loss of $88 support flips level into resistance
- Price re-enters established trading range structure
- $78 value area low becomes next key downside support
Solana’s (SOL) recent price action signals a transition away from bullish continuation and back into range-bound conditions. After failing to hold above a major technical level, the market has begun rotating lower, reflecting weakening momentum and growing seller control.
The loss of a key support zone has altered short-term structure, increasing the probability that Solana revisits lower range support before any sustained recovery can develop.
Solana price key technical points
- Lost Support: $88 level flips into resistance alongside the value area high.
- Structural Shift: Price has re-entered its previous trading range.
- Downside Target: $78 aligns with the value area low and high timeframe support.
Solana recently lost the important $88 level, which previously acted as a structural support zone. This area also aligned with the value area high, making it a strong technical confluence region. When price loses a value area boundary, it often signals rejection rather than continuation, forcing markets back toward equilibrium within the established range. The failure to hold above this level confirms that buyers were unable to maintain control following the prior recovery attempt.
With the loss of $88 support, Solana has effectively reverted into its previous trading range. Range environments typically trap price action between clearly defined highs and lows, creating rotational market behavior rather than trending movement. In this case, the range low and major support zone sits near $78, which coincides with the value area low and high timeframe demand.
This comes as Step Finance announced it will shut down its Solana-based platforms following a January exploit that drained roughly $40 million, adding to cautious sentiment surrounding the ecosystem.
Currently, price action is hovering near the Point of Control (POC), the level representing the highest volume traded within the range. The POC often functions as equilibrium between buyers and sellers. Solana barely holding this level suggests market indecision, but it also signals vulnerability. A confirmed close below the POC would indicate acceptance at lower prices, significantly increasing the probability of a move toward range support.
From a market structure perspective, the current movement appears corrective rather than impulsive. Corrective phases typically unfold through gradual rotations toward liquidity pools where demand previously emerged. The absence of strong bullish continuation after losing support further reinforces the corrective bias. Without reclaiming $88 resistance, upside momentum remains limited.
Volume dynamics also support the corrective outlook. The recent decline has not been met with strong accumulation signals, suggesting buyers are waiting at deeper value zones rather than defending mid-range prices. This behavior is common within established ranges, where participants prefer to engage at extremes rather than within the middle of consolidation.
If Solana continues to trade below former support turned resistance, price action is likely to gravitate toward the lower boundary of the range. The $78 level therefore becomes a critical area to monitor. A reaction at this support could trigger a relief bounce or range continuation, while a breakdown below it would expose Solana to a broader structural reset. This comes as Zora expanded onto the Solana blockchain with the launch of its new “attention markets” platform, signaling continued ecosystem development despite the current corrective structure.
Despite the short-term weakness, range environments are not inherently bearish. Instead, they represent periods of market balance where liquidity accumulates before the next major expansion. For now, Solana remains confined within this structure, with directional clarity dependent on either reclaiming resistance or testing deeper support.
What to expect in the coming price action
Solana is likely to continue rotating within its established trading range unless bulls reclaim the $88 resistance level. Failure to hold the POC increases the probability of a move toward $78 support, where the next meaningful reaction is expected to occur.


- Bitcoin price trades around $67,500.
- The asset rose to near $70,000 but is facing key resistance.
- Analyst Rekt Capital warns that it’s “premature” to say the current bear market is over.
Bitcoin price is hovering around $67,500 after retreating from highs near $70,000.
The spike to intraday highs on Wednesday saw chatter across ‘Crypto Twitter’ shift to the potential for BTC to have bottomed out and prospects of a sharp uptick.
While bullish sentiment continues to permeate the crypto market, one analyst is cautioning against “premature” calls of the bear market being over.
This even as US spot Bitcoin ETFs take fresh inflows to cut year-to-date outflows to under $2 billion.
Bitcoin retreats from $70k as analyst warns of further declines
Macroeconomic and geopolitical headwinds have meant Bitcoin has found it hard to break higher since recovering from lows near $60,000 reached in early February.
However, the bellwether crypto asset surged toward $70,000 ahead of Nvidia’s earnings report on Wednesday, February 25, 2026.
Like gains across equities, Bitcoin’s uptick benefited from anticipation around Nvidia’s earnings report.
But despite strong AI-driven results, stock futures stalled, and BTC pulled back, trading to around $67,500 as of writing.
Nvidia shares also fell, down more than 5% at open on Thursday. Reaction to the chip giant’s earnings beat impacted BTC.
Despite this pullback, many traders are upbeat after US spot Bitcoin ETFs snapped a recent losing streak, with over $750 million in net inflows over two days. The flip has the market trending with mixed signals.
Half a bil into bitcoin ETFs yesterday, biggest day in a while, +$750m over past two days, right as obituaries were being published. They needed it too, like a hitter in a slump going yard. YTD is now under $2b in outflows. Unclear still tho if this is legit start to rebound or… pic.twitter.com/hl6JQuFcyI
— Eric Balchunas (@EricBalchunas) February 26, 2026
However, according to crypto analyst Rekt Capital, it’s premature to say the bear market is over.
“The shortest Bitcoin Bear Market lasted 365 days. Bitcoin is currently ~140 days into its current Bear Market,” he posted on X, adding:
“Any talk of the Bear Market being over already is probably premature.”
Spot ETF inflows, on-chain metrics and macro shifts could be key factors in this cycle. But Rekt believes the technical picture says a lot.
In this case, the analyst points to historical cycle bottoms and BTC’s slide below the 200-week exponential moving average.
Even with recent inflows reversing recent outflows to a degree, institutional demand is low, and that could limit any upside.
It’s very tempting to speak about Lengthening Cycles in a Bitcoin Bull Market
After all, nobody wants to see a sunny day end
It’s equally very tempting to speak about the Bitcoin Bear Market bottom already being near
Everybody wants Winter to end, and the sooner the… https://t.co/8bSxwKrdRx
— Rekt Capital (@rektcapital) February 26, 2026
BTC price analysis
Technically, Bitcoin’s retreat from $70,000 exposes support at $68,000-$68,500.
With a breakdown to $67,500, bulls risk an acceleration toward $60,000.
Rekt shares this outlook by noting that bulls remain vulnerable as long as price fluctuates below the 200-week EMA.
The moving average has acted as resistance in previous bear markets, including in 2018.
“Ultimately, as long as Bitcoin remains below the 200-week EMA, history suggests price will favour additional downside,” the analyst noted.
Earlier this month, analysts at Standard Chartered cut their target for BTC in 2026 to $100,000 and forecast a potential retest of $50,000 before a fresh rally higher.
Nasdaq has filed a proposed rule change to list the VanEck JitoSOL ETF, a fund designed to hold the Solana-based liquid staking token JitoSOL.
Liquid staking allows users to stake tokens to help secure a proof-of-stake network while receiving a transferable token in return that represents the staked assets and accrued rewards.
Jito Foundation president Brian Smith told Cointelegraph that if the fund is approved, staking rewards would not be distributed separately but instead reflected in the fund’s net asset value.
Because JitoSOL automatically compounds rewards, each token held by the trust would represent the underlying deposited SOL along with any staking yield accrued on the Solana network.
The exchange submitted the proposal under Nasdaq Rule 5711(d), which governs commodity-based trust shares, seeking approval to list and trade shares of a trust that would hold JitoSOL directly.
Created by the Jito Network, JitoSOL (JTO) is a liquid staking token backed by SOL deposited into a staking pool on the Solana network. It lets holders earn staking rewards through a transferable token without directly running validators or managing onchain staking.
The filing cites the SEC’s prior spot Bitcoin (BTC) and spot Ether (ETH) ETP approval orders, arguing the proposal satisfies fraud, manipulation and surveillance standards and can be approved through “other means” despite the absence of a regulated futures market for JitoSOL.
According to the proposal, the trust would value its shares using the MarketVector JitoSol VWAP Close Index, which is calculated from pricing data contributed by multiple trading platforms, and the trust would permit both cash and in-kind creations and redemptions.
The filing also claims JitoSOL is economically comparable to SOL (SOL), citing correlation data, and says an appropriately structured liquid staking token can be treated as analogous to the underlying asset for purposes of the generic listing standards approved by the SEC in September.
Under the SEC’s review process, the agency has 45 days from Federal Register publication to approve or disapprove the proposal, which can be extended to 90 days.
Related: Ethereum Foundation starts staking ETH as client diversity concerns persist
Staking exposure exists, but not liquid staking ETFs
While the VanEck JitoSOL ETF has reached the SEC’s exchange review stage, no liquid staking token ETF of this type is currently trading in the United States. There are, however, existing funds that provide regulated exposure to staking economics.
One of the earliest US ETFs to offer direct staking exposure was the REX-Osprey Solana + Staking ETF (SSK), which began trading on July 2, and combines spot Solana price exposure with onchain staking rewards distributed to shareholders.
In September, the company launched the REX-Osprey ETH + Staking ETF (ESK), offering spot Ether exposure alongside monthly payouts tied to staking yield.
About a month later, Grayscale expanded staking across its exchange-traded lineup, adding staking exposure to the Grayscale Ethereum Mini Trust ETF and Grayscale Ethereum Trust ETF (ETHE). The company also enabled staking for the Grayscale Solana Trust (GSOL), which is seeking regulatory approval to uplist as an ETP.
While the SEC’s Division of Corporation Finance said in May that certain protocol staking activities generally do not involve the offer or sale of securities under federal law, and in August issued similar staff guidance on liquid staking and staking receipt tokens, the statements are not formal rulemaking and do not automatically approve specific products.
In Europe, 21Shares launched a Jito-staked Solana exchange-traded product in January, providing listed exposure to SOL with staking integrated into the structure.
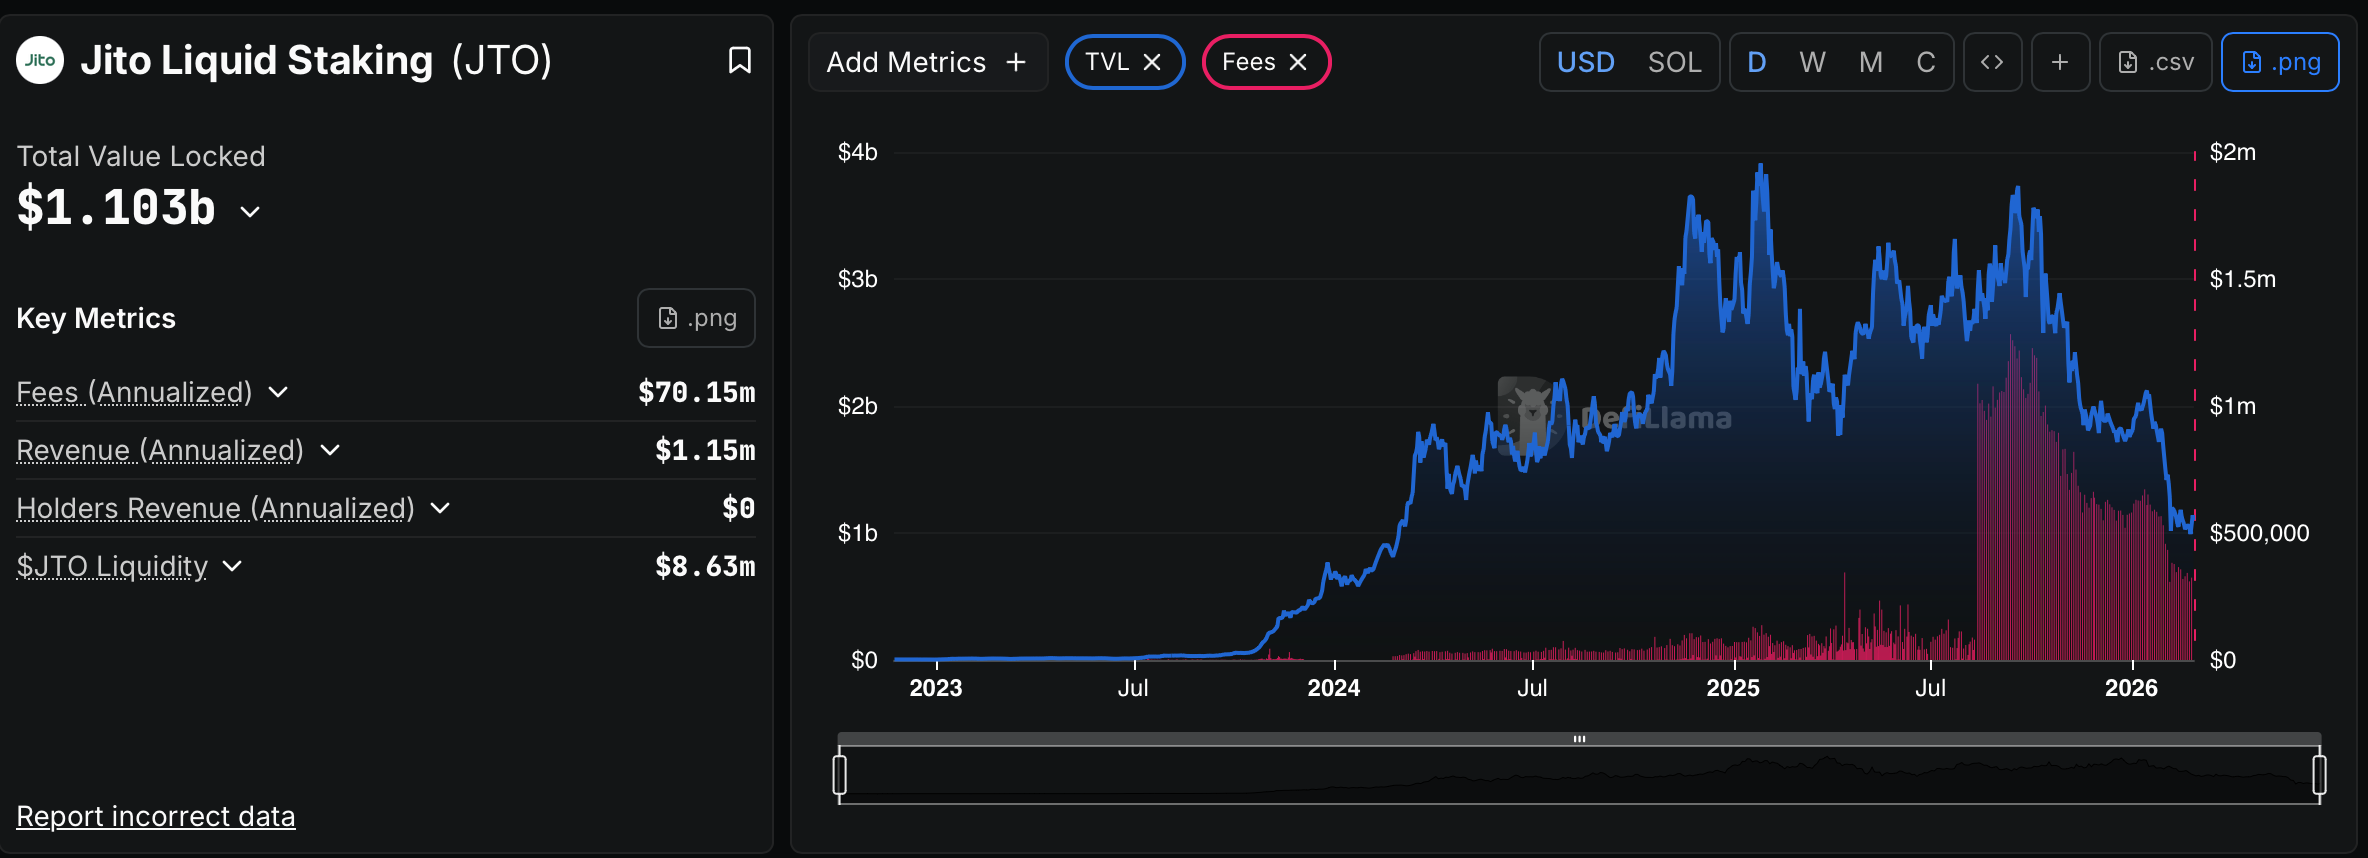
Jito’s total value locked (TVL) stands at around $1.1 billion, after peaking above $3.0 billion in 2025 before retracing into early 2026, according to DefiLlama data.

Magazine: Clarity Act risks repeat of Europe’s mistakes, crypto lawyer warns
Can DOT push higher after reaching a one-month peak?
Over the past 24 hours, the cryptocurrency market staged a solid rebound, with many leading digital assets showing renewed momentum and reclaiming some of their recent losses.
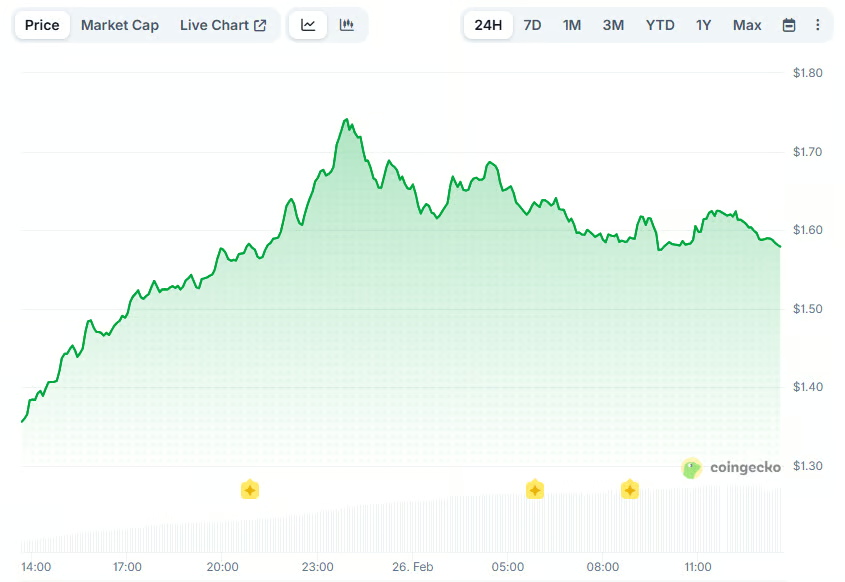
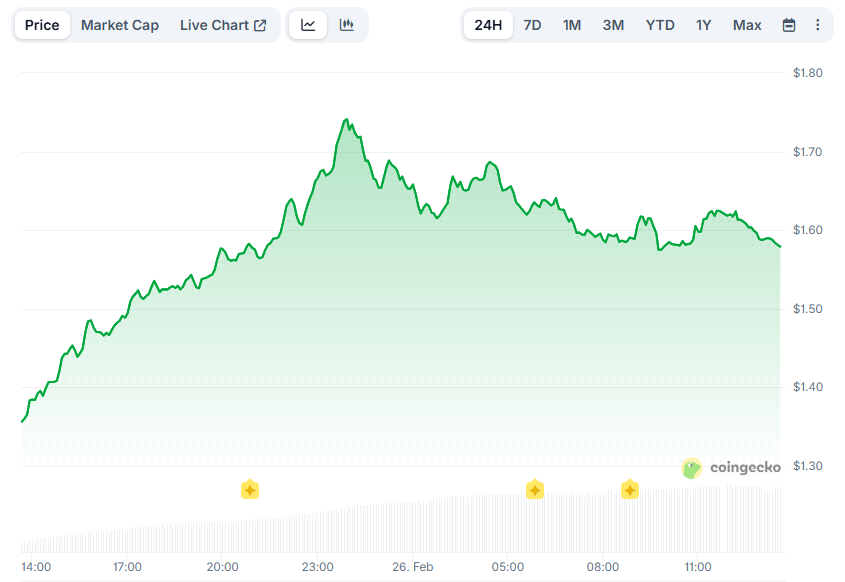
Polkadot (DOT) is among the top performers today (February 26), jumping by roughly 22%.
The Upcoming Halving and More
Polkadot’s native token, which was one of the major cryptocurrencies in 2021 when its price rocketed above $50, has been on a severe decline over the last several months, crashing to a local bottom of $1.15 at the start of February.
Over the past day, though, it posted a strong comeback, with its valuation reaching a monthly high of approximately $1.74. Its market capitalization soared past $2.6 billion, making it the 36th-largest cryptocurrency.
The broader market resurgence, marked by Bitcoin (BTC) nearing $70,000 and Ethereum (ETH) reclaiming the $2,000 psychological level, seems to be the most likely catalyst driving DOT’s price higher. However, some analysts claimed that other factors could have contributed to the upswing as well.
Lark Davis, who has almost 1.5 million followers on X, argued that Polkadot’s upcoming halving might be one such reason. He said the event, scheduled for March 14, will slash annual token issuance by 50%, claiming “the scarcity narrative is driving strong bullish sentiment.”
Another potential driver, as noted by Davis, is the growing anticipation surrounding prospective spot DOT ETFs, which prominent companies like Grayscale and 21Shares have expressed interest in launching.
These products (should they be approved by regulators) will allow investors to gain exposure to Polkadot’s native cryptocurrency through brokerage accounts without holding the token directly. This simplified access can attract more market participants, whereas increased demand could lead to upward price pressure on the asset.
The regulatory climate in the US has shifted toward a more favorable stance on crypto products, with multiple spot ETFs debuting over the past several months. This signals that a similar investment vehicle having DOT as the underlying token may also go live soon.
Davis did not stop there and offered a third possible reason for the asset’s recent revival. He suggested that DOT “broke above the daily 20 EMA and horizontal resistance at around $1.40+, while holding firm support at $1.23, a setup that could have triggered momentum buyers.”
The Next Targets
The resurgence has naturally sparked a fresh wave of enthusiasm among analysts and traders, some of whom believe DOT has more fuel left to chart further gains.
X user RACHEL CRYPTO predicted the price could rise to $1.80, while prior to that, Crypto GVR envisioned an ascent to $2-$3 in the long term.
At the same time, the asset’s Relative Strength Index (RSI) should serve as a warning. The technical analysis tool measures the speed and magnitude of recent price changes and can help identify potential price reversals. It ranges from 0 to 100, where ratios below 30 indicate that DOT is oversold and due for a potential pump, while readings above 70 are interpreted as bearish territory. Currently, the RSI stands at around 73.

Disclaimer: CryptoPotato has received a grant from the Polkadot Foundation to produce content about the Polkadot ecosystem. While the Foundation supports our coverage, we maintain full editorial independence and control over the content we publish.
Binance Free $600 (CryptoPotato Exclusive): Use this link to register a new account and receive $600 exclusive welcome offer on Binance (full details).
LIMITED OFFER for CryptoPotato readers at Bybit: Use this link to register and open a $500 FREE position on any coin!

Nasdaq has filed a proposed rule change to list the VanEck JitoSOL ETF, a fund designed to hold the Solana-based liquid staking token JitoSOL (CRYPTO: JTO). The instrument would give investors exposure to on-chain staking economics without the need to operate validator infrastructure, wrapping the underlying asset in publicly traded shares. If approved, the fund would reflect staking rewards in its net asset value rather than distributing separate yield payments, a detail highlighted by the Jito Foundation’s leadership. The token itself compounds rewards automatically, so each share would represent the SOL deposited and the staking yield accrued on the Solana network (CRYPTO: SOL).
The filing, submitted under Nasdaq Rule 5711(d) governing commodity-based trust shares, seeks approval to list and trade shares of a trust that would hold JitoSOL directly rather than track via futures or other derivatives. The move underscores the ongoing regulatory interest in expanding regulated access to on-chain staking economics, a path that has gained momentum as liquidity and investor demand for crypto yield products continue to evolve across jurisdictions.
The asset at the center of the proposal, JitoSOL, is a liquid staking token issued by the Jito Network and backed by SOL deposited into a Solana staking pool. It enables holders to earn staking rewards through a transferable token without the operational burden of running validators. In the broader regulatory dialogue, the filing references earlier SEC actions on spot crypto ETPs, noting the agency’s prior approvals for spot Bitcoin (CRYPTO: BTC) and spot Ether (CRYPTO: ETH) exchange-traded products and arguing that a liquid staking token can be evaluated under the agency’s generic listing standards rather than requiring a dedicated futures framework. The document also cites the MarketVector JitoSol VWAP Close Index as the basis for valuing trust shares, a price construct derived from cross-platform pricing inputs that would undergird the ETF’s NAV. The trust would allow both cash and in-kind creations and redemptions, a mechanism that could help maintain price alignment with the underlying asset over time.
JitoSOL is designed to sit within the Solana ecosystem’s staking framework but to offer a ready-made exposure vehicle. The token is described as economically akin to SOL, with proponents arguing that an appropriately structured liquid staking token can be treated similarly to the underlying asset for aims of listing standards. The filing rests on the premise that regulators have, in recent months, acknowledged the potential for liquid staking and staking-receipt tokens to fit within existing regulatory frameworks, even as formal rulemaking continues to evolve.
The SEC’s review timeline for such listings typically provides a 45-day window from Federal Register publication to issue a decision, with possible extensions bringing the period to 90 days. The current status places the project in the exchange-review phase, a stage where Nasdaq lenders and the SEC assess disclosures, surveillance, and anti-fraud provisions before determining whether a listing may proceed. While the path forward remains contingent on regulatory signaling, the filing signals a growing appetite to broaden structured exposure to staking economics through traditional market infrastructure.
Staking exposure exists, but not liquid staking ETFs
Even as the VanEck JitoSOL ETF advances through regulatory review, the United States has yet to host a liquid staking token ETF of this explicit design. Market participants have, however, explored regulated access to staking economics through other vehicles. One notable example is the Rex-Osprey Solana + Staking ETF (SSK), which began trading in July and pairs spot Solana exposure with on-chain staking rewards distributed to shareholders. In September, Rex-Osprey expanded its lineup with the REX-Osprey ETH + Staking ETF (ESK), presenting Ether alongside staking-derived yields. Grayscale subsequently broadened staking exposure within its U.S. crypto-ETP roster, adding products tied to staking economics such as the Grayscale Ethereum Mini Trust ETF and Grayscale Ethereum Trust ETF (ETHE). Grayscale also introduced staking for the Grayscale Solana Trust (GSOL), which is seeking regulatory uplisting as an exchange-traded product. These products indicate a clear demand for regulated staking exposure, even as the regulatory framework for liquid staking tokens remains a developing area.
Regulatory guidance in the United States has been cautious. In May, the SEC’s Division of Corporation Finance indicated that certain protocol staking activities generally do not involve the offer or sale of securities under federal law, and in August the agency published staff guidance on liquid staking and staking receipt tokens. These statements do not constitute formal rulemaking and do not automatically approve specific products. In Europe, meanwhile, 21Shares launched a Jito-staked Solana exchange-traded product in January, providing listed exposure to SOL with integrated staking features. Jito’s prominence in the liquidity and staking space is reflected in its TVL, which hovered around $1.1 billion after peaking above $3.0 billion in 2025, according to DefiLlama data.
The evolving landscape around liquid staking, staking revenues, and on-chain reward mechanics sits at the intersection of technology, regulation, and market structure. Investors are watching how these products align with existing surveillance, valuation standards, and consumer protection requirements as new variants of staking exposure enter mainstream trading venues. The debate over whether staking-derived yield should be treated as a security, a yield instrument, or a synthetic exposure continues to shape how products get approved and marketed in regulated markets.
Market dynamics outside the United States add texture to the conversation. As mentioned, Europe has already welcomed a Jito-backed exposure through 21Shares, signaling an appetite for product design that blends price exposure with staking rewards. The global appetite for regulated staking products reflects a broader trend toward translating on-chain value accrual into familiar investment constructs that traditional investors can access without direct operational responsibilities on a blockchain network.
Overall, the idea of a liquid staking ETF for JitoSOL sits at a crossroads of innovation and regulation. It highlights how asset ownership, reward compounding, and on-chain security contributions can be packaged into tradable vehicles while attempting to meet the same standards that govern more conventional assets. The regulatory path ahead is nuanced, but the direction—toward structured exposure to staking economics within established market frameworks—appears to be gaining momentum.
Why it matters
For investors, a Nasdaq-listed JitoSOL ETF would provide a regulated, transparent channel to participate in the Solana staking economy without the operational overhead of running validators. The vehicle would anchor staking yields within a familiar product structure, potentially improving accessibility and diversification for crypto yield seekers. For builders and validators, widespread ETF exposure could bolster liquidity and create more robust on-chain-to-off-chain capital links, potentially increasing the velocity of staking-derived rewards across markets. For regulators, the proposal foregrounds the importance of clear surveillance and custody standards when bridging on-chain activity with traditional financial markets, a dynamic that is likely to inform future rulemakings and product approvals.
From a market context perspective, the emergence of liquid staking-linked ETFs aligns with a broader push to offer regulated access to decentralized finance concepts. As liquidity, risk sentiment, and macro conditions shape crypto markets, these products may influence how institutions allocate crypto exposure and how retail participants manage yield-oriented strategies within a compliant framework. The success or failure of the JitoSOL listing could also influence the pace at which other liquid staking tokens pursue similar registrations, potentially widening the spectrum of staking-backed instruments available in U.S. markets.
What to watch next
- Regulatory decision timeline: The SEC has a 45-day window from Federal Register publication to approve or disapprove, with possible extensions up to 90 days.
- Nasdaq listing decision: The exchange’s review and any required disclosures will determine whether the JitoSOL ETF advances to the next stage.
- Market acceptance: How traders price the trust and how NAV tracking via the VWAP index holds against on-chain SOL staking dynamics.
- Comparative launches: Developments in European ETPs and U.S. competing staking-exposure products (SSK, ESK, ETHE, GSOL) may shape investor expectations and pricing.
Sources & verification
- Nasdaq filing SR-NASDQ-2026-010 detailing the proposed listing of a JitoSOL-based ETF and the use of 5711(d) for commodity-based trust shares.
- SEC commentary and staff guidance on spot BTC/ETH approvals and liquid staking considerations, as referenced in the filing and related communications.
- MarketVector JitoSol VWAP Close Index as the basis for valuing trust shares and its methodology for price tracking.
- DefiLlama data on Jito’s total value locked (TVL), cited as around $1.1 billion after a peak above $3.0 billion in 2025.
- European exposure such as 21Shares’ Jito-staked Solana ETP and the Rex-Osprey U.S. staking ETF lineup including SSK and ESK, which illustrate broader market interest in staking-based products.
Nasdaq eyes listed exposure to JitoSOL amid a shifting staking landscape
Nasdaq’s bid to list the VanEck JitoSOL ETF marks a notable step in the maturation of on-chain staking products within traditional market structures. By directly holding JitoSOL (CRYPTO: JTO), the proposed vehicle would provide a regulated path to Solana’s staking economics, anchoring investor claims to a fungible token that represents staked SOL (CRYPTO: SOL) and the accrued rewards. The approach leverages a NAV framework that encapsulates compounded yields, contrasting with older yield-distribution models and aligning with how many conventional funds account for performance alongside custody and surveillance considerations.
The regulatory dialogue remains nuanced. While the SEC has signaled openness to generic listing standards as a vehicle to accommodate certain digital-asset exposures, it also demands rigorous disclosures and robust market safeguards. The absence of a regulated futures market for JitoSOL adds another layer of complexity, but the filing argues that a well-structured liquid staking token can still meet the standards required for listing through alternative means. If the proposal clears the review, it would join a small but growing set of US products attempting to bridge on-chain staking with mainstream investment channels.
Beyond the United States, the market has already shown appetite for staking-integrated exposure. Europe’s 21Shares has offered a Jito-staked Solana ETP since January, demonstrating demand for listed access to SOL-backed staking yields. In the U.S., comparable products such as the Rex-Osprey SSK and ESK funds and Grayscale’s staking-related ETFs indicate that investors are seeking institutional-grade vehicles to access staking economics without navigating on-chain complexities. The convergence of these products suggests that custody, governance, and surveillance standards will define the pace at which new staking-based vehicles arrive in both regulated markets and crypto-native platforms.
Whether Nasdaq’s bid to introduce the JitoSOL ETF becomes a blueprint for future liquid-staking listings may depend on how the SEC interprets the evolving landscape of staking receipts and related on-chain activity. For market participants, the potential listing provides a focal point for assessing risk, yield, and regulatory alignment across a spectrum of products that connect the on-chain economy with traditional finance rails. The outcome could shape subsequent filings, influence how staking rewards are accounted for in NAV calculations, and influence investor expectations about the accessibility of staking-based yields through regulated exchanges.


- KuCoin’s Zypto integration expands KCS use cases into everyday crypto payments.
- KCS token price remains weak as volume stays low despite a positive adoption narrative.
- Key levels to watch are $8.52 support and $8.66 for short-term trend reversal.
KuCoin crypto exchange has taken another step toward expanding real-world crypto usage by integrating its payment service with Zypto, a move that places everyday spending back at the centre of the digital asset conversation.
The partnership links KuCoin Pay with Zypto’s payment infrastructure, allowing users to spend cryptocurrencies directly without routing funds through traditional banking rails.
KuCoin’s partnership with Zypto
This development is designed to close the gap between holding crypto and actually using it, which has long been one of the industry’s biggest adoption challenges.
Through the Zypto ecosystem, users can now make practical payments such as buying gift cards, paying utility bills, topping up mobile airtime, or funding crypto-linked cards.
The integration supports dozens of digital assets, including KuCoin’s native token, KuCoin Token (KCS), positioning KCS closer to daily transactional use rather than pure exchange utility.
For KuCoin, the move strengthens its broader strategy of building payment rails that sit alongside trading, staking, and yield products.
For users, it reduces friction by allowing them to spend crypto balances directly instead of converting to fiat first.
This shift matters because tokens that gain real-world utility often benefit from stronger long-term narratives, even if the short-term price reaction is muted.
KuCoin Token price reaction
Despite the positive headline, KuCoin Token (KCS) price action has remained cautious, reflecting a broader market reality where fundamentals and price do not always align immediately.
At the time of writing, the KCS token is trading around $8.61, placing it well below its historical peak but comfortably above long-term cycle lows.
The token’s market capitalisation sits near $1.14 billion, which keeps it within the mid-cap range where sentiment can change quickly on relatively modest capital flows.
Short-term performance has been mixed, with KCS down roughly 2.2% over the past 24 hours while still showing gains on a weekly and biweekly basis.
Longer timeframes tell a more defensive story, as the token remains significantly lower on a one-year view, reflecting sustained pressure across exchange tokens.
Volume trends offer additional context, as 24-hour trading activity rose by more than 20% but remains low in absolute terms.
This suggests that recent price movement is not being driven by aggressive accumulation or distribution.
Instead, the decline appears more like a slow, liquidity-driven drift rather than a reaction to negative news.
Broader market conditions support this view, as Bitcoin has been slightly positive while the total crypto market has remained largely flat.
There is no clear evidence of derivatives-driven selling, sector rotation, or defensive flows targeting KCS cryptocurrency specifically.
This points to an isolated weakness rather than a systemic issue tied to KuCoin or its token.
From a technical perspective, KCS is currently trading below its short-term moving averages, which keeps near-term momentum tilted to the downside.
The failure to hold the 7-day and 30-day simple moving averages has reinforced a cautious bias among short-term traders.

Until these levels are reclaimed, upside attempts may continue to face selling pressure.
That said, the absence of panic selling suggests that downside risk may remain measured unless broader market sentiment deteriorates.


Bitcoin miner MARA Holdings has entered a strategic partnership with Barry Sternlicht’s Starwood Capital Group to convert its existing mining sites into data center infrastructure for artificial intelligence and cloud computing.
MARA shares jumped approximately 17% in after-hours trading following the February 26 announcement.
Joint Venture Targets 2.5 GW Capacity
The two companies will jointly develop, finance, and operate data center projects across MARA’s existing portfolio. Starwood Digital Ventures, the firm’s data center platform, will handle design, construction, tenant sourcing, and operations. MARA will contribute sites with access to low-cost energy.
The joint platform targets approximately 1 gigawatt of near-term IT capacity, with a pathway to more than 2.5 gigawatts. The facilities will be designed to switch workloads between Bitcoin mining and AI compute depending on market conditions and customer demand. MARA will have the option to retain up to 50% ownership in the joint venture, with both companies sharing development costs and profits. Financial terms were not disclosed.
“Our partnership with Starwood will allow us to turn power certainty into capacity certainty,” said MARA CEO Fred Thiel, adding that the joint venture offers a more capital-efficient approach to infrastructure buildout.
Starwood Capital manages more than $125 billion in assets. Starwood Digital Ventures operates a 94-person team with data center expertise across more than 10 GW.
Miners Pivot Toward AI Infrastructure
The announcement coincided with MARA’s fourth-quarter earnings, which revealed a $1.7 billion net loss driven largely by unrealized writedowns on its Bitcoin holdings. Quarterly revenue came in at $202 million, down 6% from the same period a year earlier. The company trails only Michael Saylor’s Strategy Inc. in corporate Bitcoin holdings.
MARA’s move fits a pattern across the mining sector. Companies that once focused solely on Bitcoin production are repurposing their energy assets and physical infrastructure for AI workloads, attracted by shorter lead times compared to building new facilities from scratch.
Several miners that embraced this transition early, including IREN, TeraWulf, and Cipher Mining, have seen their market capitalizations outpace MARA’s despite producing less Bitcoin mining hash power. Meanwhile, Starboard Value has taken a significant stake in Riot Platforms, pressuring the Texas-based miner to accelerate its own data center conversion efforts.
JLL and Paul Weiss served as MARA’s strategic and legal advisors.
Bloomberg reported earlier this month that 10% of Block’s workforce could be cut during annual performance reviews as part of a broader overhaul.
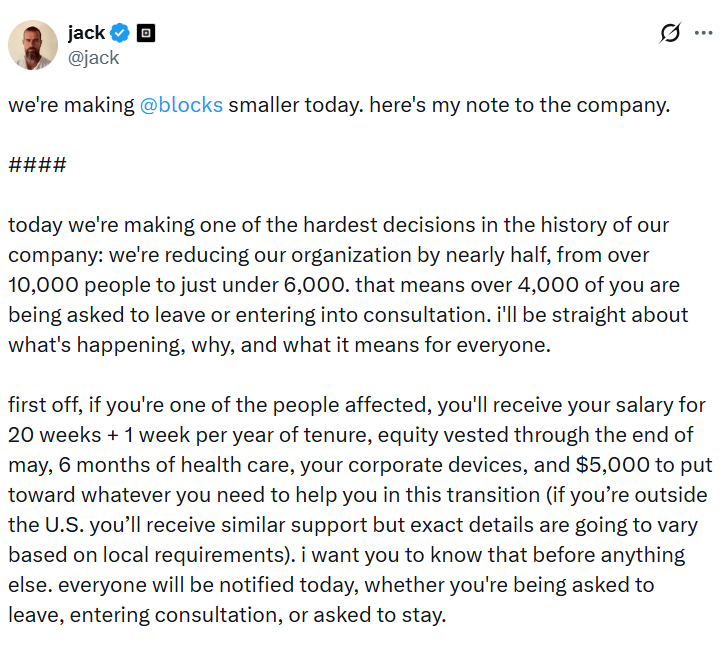
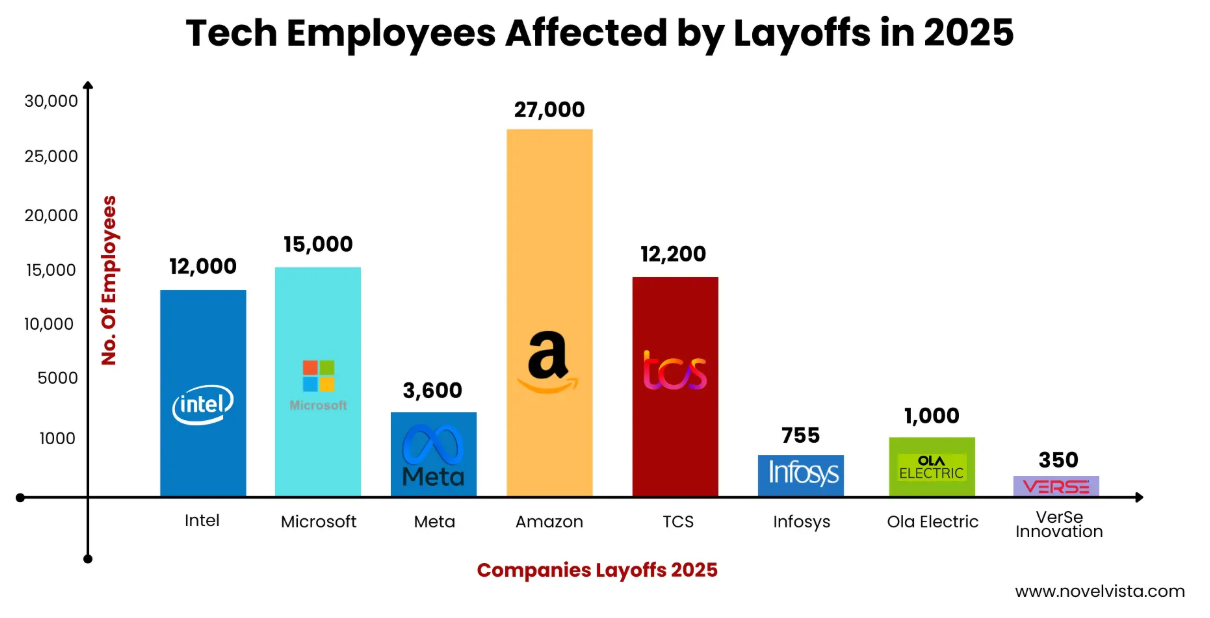
Jack Dorsey’s payments company Block will cut over 4,000 of its staff, with its co-founder pinning the move on the rapid acceleration of AI.
“We’re already seeing that the intelligence tools we’re creating and using, paired with smaller and flatter teams, are enabling a new way of working which fundamentally changes what it means to build and run a company, and that’s accelerating rapidly,” wrote Dorsey in a letter to the company, which he shared on X.
“I had two options: cut gradually over months or years as this shift plays out, or be honest about where we are and act on it now. I chose the latter. Repeated rounds of cuts are destructive to morale, to focus, and to the trust that customers and shareholders place in our ability to lead,” he added.
Affected staff will still receive their salary for 20 weeks, plus one week per year of tenure, six months of health care, their corporate devices, and $5,000 to help them transition to a new role, said Dorsey.

Bloomberg reported earlier this month that 10% of Block’s workforce could be eliminated during annual performance reviews, as part of a wider restructuring effort.
Magazine: Bitcoin’s ‘biggest bull catalyst’ would be Saylor’s liquidation — Santiment founder

Block, the payments company co-founded by Jack Dorsey, is pursuing a sweeping workforce reduction, targeting more than 4,000 roles as part of a broader AI-driven overhaul. The move comes after Bloomberg reported earlier this month that roughly 10% of Block’s staff could be cut during annual performance reviews as part of the restructuring. In a letter to employees posted on X, Dorsey described a shift toward AI-enabled tooling and flatter, smaller teams that he said is accelerating the way the company builds and runs its operations. He argued that letting the process drag on would undermine morale and trust among customers and shareholders. The severance plan outlined by Dorsey includes 20 weeks of salary, plus one additional week per year of tenure, six months of health coverage, the return of corporate devices, and a $5,000 transition stipend. Cointelegraph notes that Bloomberg’s figure framed the scope of the broader restructuring.
Key takeaways
- Block plans to cut more than 4,000 employees as part of an AI-driven restructuring, signaling a rapid shift in how the company organizes operations.
- Bloomberg previously reported that roughly 10% of Block’s workforce could be eliminated during annual performance reviews, reflecting a broader overhaul.
- Dorsey described a move toward AI-enabled tooling and flatter teams as a fundamental change in how Block builds and runs its business, stating that the shift is accelerating.
- The company outlined a severance package including 20 weeks of salary, plus one week per year of tenure, six months of health care, device return, and a $5,000 transition stipend to help staff transition to new roles.
- The restructuring aligns Block with a wider trend among tech and fintech firms leveraging AI to drive efficiency, even as it raises questions about morale and trust among customers and employees.
Market context: The move arrives as fintech and tech firms increasingly pursue AI-driven efficiencies. While the decision signals a willingness to adjust headcount to fit an AI-centric operating model, it also tests morale and trust within the workforce and among customers during a period of heightened scrutiny of automation strategies in the sector.
Why it matters
The decision to prune a sizable portion of Block’s workforce highlights a broader industry shift toward leaner organizational structures that lean on automation and data-driven decision-making. For Block, the aim appears to be speeding up product development and execution by compressing management layers and empowering smaller, cross-functional teams to move more quickly. This approach—emphasizing AI-assisted workflows—could recalibrate how the company allocates resources, prioritizes projects, and measures performance in a rapidly evolving payments landscape.
From an investor and customer perspective, the move introduces a mix of risk and potential upside. On one hand, a large-scale reduction can strain morale in the near term and raise questions about continuity of service and product roadmap execution. On the other hand, if AI-enabled tooling delivers faster iteration cycles and improved efficiency, Block could emerge with lower operating costs and a more agile development cadence. The balance between disruption and long-term gains will likely hinge on how transparently the company communicates with employees, how effectively severance and transition programs are implemented, and how quickly teams can deliver on AI-enabled capabilities without compromising reliability.
The timing of the cuts—coming as AI continues to reshape how consumer and business fintechs build products—also places Block within a broader conversation about automation in corporate America. Analysts and market observers are watching to see whether other large technology and payments players follow suit, mirroring a trend where automation and flatter organizational models are pitched as remedies for cost pressures and productivity gaps. In this context, Block’s restructuring serves as a real-world data point for how a high-profile fintech conglomerate attempts to balance growth objectives with the strategic need to recalibrate staffing in an AI-first era.
Crucially, the announced severance package—20 weeks of salary, an extra week per year of tenure, six months of health coverage, the return of corporate devices, and a $5,000 transition stipend—reflects a structured approach to employee transition. Such terms can help soften the blow for affected workers while signaling that the company is aiming to maintain a competitive benefits framework even as it reshapes its workforce. The efficacy of this strategy will partly depend on execution, including how quickly new roles are found for displaced staff and how smoothly the organization can maintain momentum on its AI initiatives during the transition.
Ultimately, Block’s actions underscore a broader strategic pivot seen across the sector: AI is not just a feature within products, but a central driver of organizational design. The headline figure—thousands of positions cut—reads as a blunt acknowledgment that the cost of scaling AI-driven processes can be high in the short term, even as the promise of faster product cycles and tighter cost structures weighs in the long term. The company’s leadership emphasizes that this shift is essential to remaining competitive and delivering on a vision that places intelligent automation at the core of Block’s operations.
What to watch next
- Block’s official disclosures or filings detailing the scope and timeline of the reductions.
- Updates on severance terms, benefits continuity, and the status of ongoing employee transitions.
- Rationale and progress reports on how AI tooling is changing product development and delivery timelines.
- Market and customer reactions as details emerge about the restructuring’s short- and mid-term impact.
Sources & verification
Block’s AI-driven overhaul reshapes workforce and strategy
Block is moving decisively to align its organizational design with an AI-first operating model. The company’s leadership describes the shift as a necessary evolution, one that leverages intelligence tools to empower smaller, more autonomous teams. In communications to staff, Dorsey framed the change as a way to accelerate decision-making and product development, arguing that a flatter structure could better respond to rapid market shifts and evolving customer needs. The rationale rests on a belief that intelligent automation can reduce friction, cut redundant layers, and enable teams to own end-to-end outcomes—from ideation to delivery.
The reported magnitude of the cuts—over 4,000 roles—signals a broad reevaluation of where value is created within Block. While the exact timeline remains to be clarified, the scope suggests a company-wide reallocation of resources toward AI-enabled capabilities, data analytics, and product platforms that can scale with fewer human handoffs. The emphasis on AI tooling is not merely about replacing tasks; it is positioned as enabling more rapid experimentation, with teams empowered to iterate on features and user experiences in shorter cycles. This approach, proponents say, can compress development timelines and improve product-market fit through faster feedback loops.
Central to Block’s narrative is the assertion that the shift is not a temporary cost-cutting exercise but a fundamental rethinking of how to build and maintain a fintech ecosystem. The company’s leadership has argued that repeated, incremental layoffs would erode morale and trust, whereas a candid, comprehensive restructuring paired with targeted severance support could preserve organizational focus and preserve core commitments to customers and shareholders. The letter to employees on X served as a public articulation of this stance—an attempt to set expectations, preserve morale, and lay out a path for the workforce transition while continuing to pursue aggressive AI-enabled product development.
In practical terms, the transition will require clear governance, transparent communication, and careful management of the change process. The severance package described by Dorsey provides a cushion for affected employees, but the broader test will be whether the company can sustain momentum on product roadmaps and continue to deliver reliable services during the transformation. As with any major realignment, there is potential for short-term disruption even as the long-term objective is to reduce operating costs and accelerate innovation. The public narrative positions Block’s move as part of a larger wave of automation across the technology and financial services sectors, where AI investments are increasingly tied to workforce design and strategic scaling decisions.
Crypto World
Bitcoin Miner MARA jumps 17% after striking a deal with Starwood to build AI data centers


MARA Holdings shares jumped 17% after the bitcoin mining firm announced Thursday a partnership with Starwood Capital Group to build large data centers across its existing U.S. sites.
The agreement will convert select MARA locations, many of which were originally developed for Bitcoin mining, into facilities serving enterprise cloud and artificial intelligence customers.
Starwood, which manages more than $125 billion of assets, will lead design, construction and tenant sourcing through its data center arm, Starwood Digital Ventures. The partners expect to deliver about 1 gigawatt of computing capacity in the near term, with plans to scale beyond 2.5 gigawatts over time. The two firms will jointly finance and operate the projects.
The deal marks a major pivot for MARA.
The company built its reputation as a bitcoin miner, but it controls sites with direct access to large power supplies. That access has become valuable as tech firms struggle to secure power for new AI data centers.
MARA’s move fits into the trend of a slew of bitcoin miners repurposing their infrastructure to meet increasing demand for artificial intelligence compute. The pivot began after Bitcoin’s recent halving cut miners’ rewards in half. With rising power costs, shrinking bitcoin price and intensifying competition for mining, miners’ profit margins have been squeezed, forcing most firms to diversify or completely pivot into hosting machines for AI firms.
Most recently, another bitcoin miner, Bitfarms (BITF), said that it is rebranding as Keel Infrastructure as part of its pivot from bitcoin mining to data center development for high-performance computing (HPC) and AI workloads.
However, for MARA, it’s not ditching its identity as a bitcoin mining company. In fact, its CEO, Fred Thiel, said in a shareholder letter that “Bitcoin remains a core pillar of MARA’s strategy.”
“While the timing of a recovery in bitcoin prices is difficult to predict, our long-term conviction in the asset class remains unchanged,” Thiel added.
MARA has also reported fourth-quarter earnings, with revenues falling 6% to $202.3 million from $214.4 million in Q4 2024, citing a 14% decline in the average price of bitcoin mined over the quarter.

Twitter co-founder Jack Dorsey said that his company, Block, will reduce its workforce by nearly half, cutting more than 4,000 employees and shrinking the company from over 10,000 staff to just under 6,000.
The company is reportedly laying off staff become of AI tools potentially making them redundant.
AI-Driven Layoffs Continue
In a note to employees, Dorsey described the move as “one of the hardest decisions” in the company’s history. He said the layoffs were not driven by financial distress, stating that gross profit continues to grow and profitability is improving.
Instead, he pointed to rapid advances in intelligence tools and a shift toward smaller, flatter teams as the reason for the restructuring.
Affected employees will receive 20 weeks of salary plus one additional week per year of tenure.
They will also receive equity vested through the end of May, six months of healthcare coverage, corporate devices, and $5,000 in transition support. International terms will vary based on local laws.
Dorsey said he chose to act immediately rather than implement gradual reductions. He argued that repeated rounds of layoffs would damage morale and trust.
Block, formerly known as Square, operates merchant payment systems and the peer-to-peer service Cash App.
Cash App allows users to buy and sell Bitcoin. The company also holds Bitcoin on its balance sheet and invests in Bitcoin infrastructure, including self-custody tools and mining initiatives.
Dorsey has positioned Block as closely aligned with Bitcoin development.
Previously, Dorsey co-founded Twitter in 2006 and served as CEO twice. He stepped down in November 2021.
In October 2022, Elon Musk completed the acquisition of Twitter and later rebranded it as X. Dorsey publicly supported the takeover at the time.
The restructuring marks a significant shift for Block as Dorsey moves to run the company with smaller teams and intelligence-driven systems at its core.
Motilal Oswal Alternates raises Rs 1,700-crore fund

Bitcoin price outlook: analyst warns it’s ‘premature’ to say bear market is over

Epstein the eugenicist made comments about hunting black people


-

 Video7 days ago
XRP News: XRP Just Entered a New Phase (Almost Nobody Noticed)
-

 Politics5 days ago
Baftas 2026: Awards Nominations, Presenters And Performers
-

 Fashion6 days ago
Weekend Open Thread: Boden – Corporette.com
-

 Sports3 days ago
Women’s college basketball rankings: Iowa reenters top 10, Auriemma makes history
-

 Politics3 days ago
Nick Reiner Enters Plea In Deaths Of Parents Rob And Michele
-

 Business2 days ago
True Citrus debuts functional drink mix collection
-

 Crypto World3 days ago
XRP price enters “dead zone” as Binance leverage hits lows
-

 Business4 days ago
Mattel’s American Girl brand turns 40, dolls enter a new era
-

 Business4 days ago
Law enforcement kills armed man seeking to enter Trump’s Mar-a-Lago resort, officials say
-

 Tech2 days ago
Unsurprisingly, Apple's board gets what it wants in 2026 shareholder meeting
-

 NewsBeat24 hours ago
Cuba says its forces have killed four on US-registered speedboat | World News
-
 NewsBeat1 day ago
Manchester Central Mosque issues statement as it imposes new measures ‘with immediate effect’ after armed men enter
-
 NewsBeat4 days ago
‘Hourly’ method from gastroenterologist ‘helps reduce air travel bloating’
-

 Tech4 days ago
Anthropic-Backed Group Enters NY-12 AI PAC Fight
-

 NewsBeat4 days ago
Armed man killed after entering secure perimeter of Mar-a-Lago, Secret Service says
-

 Politics4 days ago
Maine has a long track record of electing moderates. Enter Graham Platner.
-
 NewsBeat2 days ago
Police latest as search for missing woman enters day nine
-

 Business20 hours ago
Discord Pushes Implementation of Global Age Checks to Second Half of 2026
-

 Crypto World2 days ago
Entering new markets without increasing payment costs
-
 Sports4 days ago
2026 NFL mock draft: WRs fly off the board in first round entering combine week