New Delhi: Sebi chief Tuhin Kanta Pandey on Saturday urged financial sector stakeholders to look beyond mere technical compliance and act with professional conscience, saying regulations alone can’t create an ethical culture or prevent collapse in corporate governance.
Corporate failures in India and across the globe, Pandey stressed, have taken place even where formal compliances existed but ethical substance was missing, “where governance failed, not because rules were absent, but because courage was.”
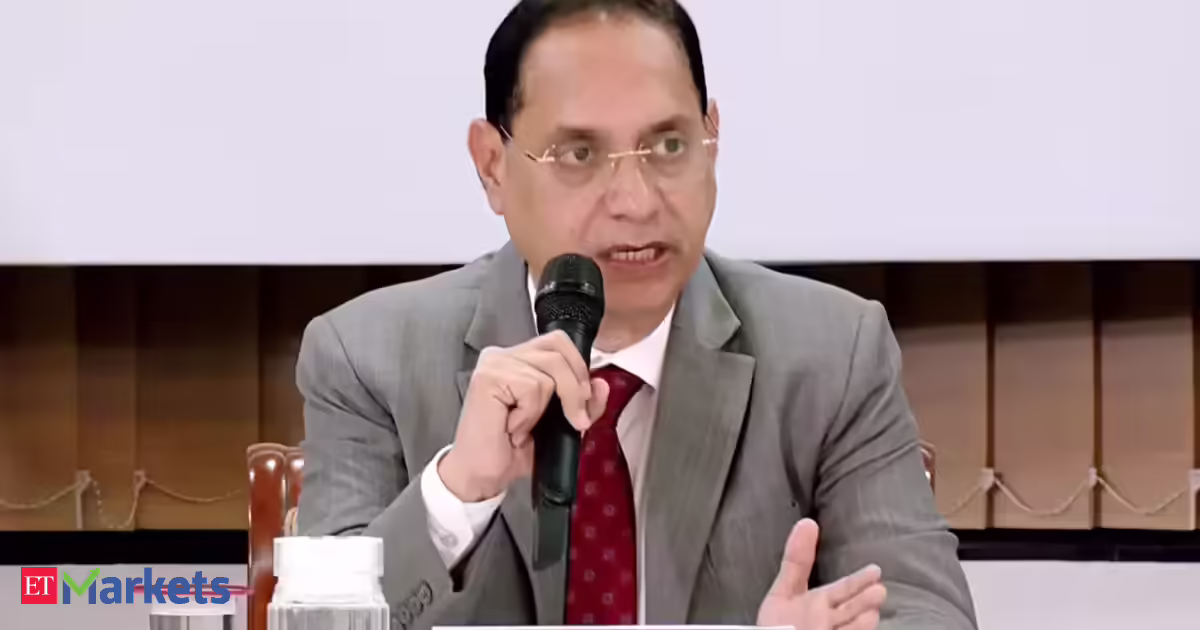
The Securities and Exchange Board of India (Sebi) chairman made these observations while speaking at the World Forum of Accountants 2.0, organised by the Institute of Chartered Accountants of India (ICAI) in Greater Noida.
National Financial Reporting Authority (NFRA) chief Nitin Gupta and Insolvency and Bankruptcy Board of India (IBBI) chairman Ravi Mital, too, spoke at the event.
Advertisement
Agencies
Maintaining Principles
Live Events
Mital pitched for cutting the number of compliance requirements without compromising on the effectiveness of regulations or diluting corporate governance principles. Ethical judgement Pandey said the growing number of initial public offerings (IPOs)-320 in 2024-25 and 311 in the first nine months of the current financial year-signals that issuers increasingly view Indian markets as capable of providing scale, efficiency, and long-term capital. The impressive growth of various components of India’s capital market also indicates increasing stakeholder trust in the market as an institution.
While watchdogs, including Sebi, have been pursuing regulatory excellence, they remain conscious that financial governance is as much shaped by culture as the compliance, Pandey said. “The real question is no longer: ‘is this technically permissible?’ It is increasingly: ‘is this fundamentally fair? is this transparent? is this in the public interest?’”
“These are not questions that regulation alone can answer. They are questions that rest squarely on professional conscience,” he added.
Many areas of the financial ecosystem today-such as management estimates, valuation subjectivity, complex group structures, ESG narratives, non-financial disclosures, and forward-looking statements-are not governed by precise formulas. “They are governed by principles, by interpretation, by judgment. In such an environment, technical compliance alone is no longer sufficient,” Pandey said.
Against this backdrop, the role of chartered accountants also extends beyond just preparing or auditing financial statements of companies; they need to act as custodians of trust in the financial system, Pandey said.
Advertisement
Technology and auditing The growing adoption of new-age technology, he underscored, will transform the profession but not replace judgment.
Technology will bolster audit quality and professional efficiency.
“But technology has its limits….It cannot replace the human responsibility to stand firm when uncomfortable questions must be asked,” Pandey said, highlighting the indispensability of continuous upskilling, and reinvention of the accounting profession.
‘Lower compliance needs’ Pitching for reducing the number of compliance requirements, IBBI’s Mital said the insolvency watchdog has roped in the Indian Institute of Management, Ahmedabad (IIMA) to look at bankruptcy regulations and suggest steps to reduce them where necessary to make compliances easier.
Advertisement
There is no dearth of laws and regulations but what is required is their more effective implementations, he said.
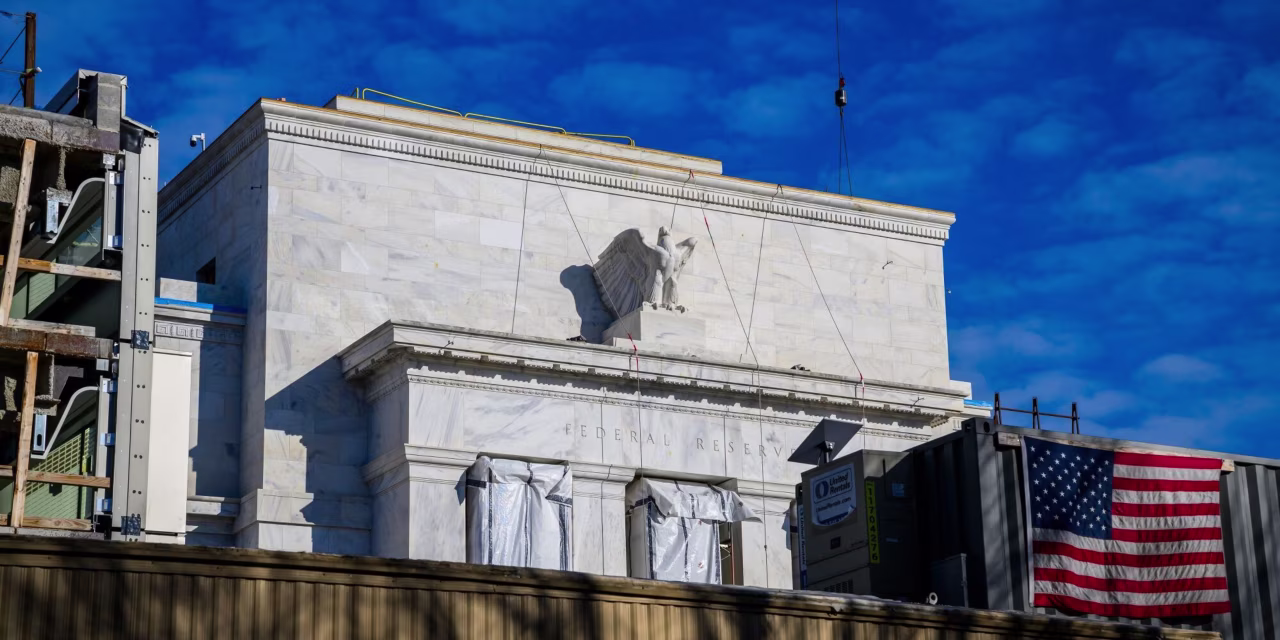
An obscure bank capital rule has helped enable the growth of nonbank lending like private credit. It could be about to get even more enabling.
One of the goals of some newly proposed U.S. capital rules is to help foster more bank lending. The thinking goes that tougher capital requirements for banks since the aftermath of the 2008 crisis have helped give rise to more nonbank lending, including the now trillion-dollar-plus private-credit market. Within that market are the nontraded loan funds that have been receiving a lot of investor redemption requests.
LISBON, Portugal — Cristiano Ronaldo has reassured fans and eased fears about his availability for the 2026 FIFA World Cup after providing a positive update on his recovery from a hamstring injury sustained while playing for Al Nassr in late February.
The 41-year-old Portugal captain posted photos on social media showing himself performing gym exercises, including leg-strengthening work, and captioned the images “Getting better every day.” The message came as he continues rehabilitation, primarily in Madrid, Spain, following the muscle issue in his right thigh.
AFP
Portugal coach Roberto Martinez quickly moved to calm concerns, describing the injury as minor and stating that Ronaldo is not at risk of missing the World Cup, which begins in June. “It’s a minor muscle injury, and we think he can return in a week or two,” Martinez said. “Everything Cristiano has done physically this season shows that he’s in great shape.”
Ronaldo picked up the injury during Al Nassr’s Saudi Pro League match against Al Fayha on Feb. 28, when he was substituted in the 81st minute and later seen with ice on his hamstring. Al Nassr confirmed the diagnosis shortly afterward, noting that he had begun a rehabilitation program with daily evaluations.
Timeline of the Injury and Recovery
Advertisement
Initial reports indicated the injury might be more serious than first thought, prompting Ronaldo to travel to Madrid for specialized treatment with his personal physiotherapist — a common step for the veteran star. Al Nassr coach Jorge Jesus acknowledged at the time that tests revealed a setback beyond early expectations, though the club emphasized ongoing monitoring.
Ronaldo subsequently missed Al Nassr’s next league fixtures and was left out of Portugal’s squad for March friendlies against Mexico and the United States. His absence marked a rare period on the sidelines for the five-time Ballon d’Or winner, who has maintained remarkable durability throughout a career spanning more than two decades.
Recent updates have turned optimistic. Medical assessments and statements from those close to the situation point to a recovery window of one to two weeks from mid-to-late March, potentially allowing Ronaldo to rejoin Al Nassr training soon and target a return to competitive action in early April. Reports suggest he could feature in a club friendly arranged during the international break or in the league match against Al Najma around April 3.
Ronaldo has continued individual work, focusing on strength and mobility exercises. Images shared by the player himself depict targeted leg routines and upper-body training, signaling steady progress without setbacks.
Advertisement
Impact on Al Nassr and Portugal
At club level, Al Nassr has felt Ronaldo’s absence as the team pushes for Saudi Pro League honors and other domestic competitions. With João Félix also in the squad, the side has managed without its talisman, but his return would provide a significant boost in attack. Ronaldo had been in strong form prior to the injury, contributing heavily to Al Nassr’s campaign.
For Portugal, the injury raised brief questions about preparations for the 2026 World Cup, where Ronaldo is widely expected to lead the line in what could be his record sixth appearance at the tournament. Martinez’s comments, combined with Ronaldo’s own social media activity, have largely dispelled doubts. The coach stressed Ronaldo’s excellent physical condition throughout the season and reiterated that the issue poses no long-term threat.
The timing is favorable for Ronaldo. With the World Cup still more than two months away, even a conservative recovery and gradual return to full training would leave ample time to regain match sharpness and fitness. Portugal will use the coming weeks to fine-tune its squad, but Ronaldo remains the undisputed focal point.
Advertisement
Ronaldo’s Remarkable Career Context
At 41, Ronaldo continues to defy conventional expectations for a professional footballer. His longevity, work ethic and recovery discipline have become hallmarks of his career. This latest hamstring concern is relatively minor compared with the demands he has placed on his body over thousands of matches at the highest level for clubs including Sporting CP, Manchester United, Real Madrid, Juventus and now Al Nassr.
Ronaldo has scored more than 900 career goals and holds numerous records, including as the all-time leading scorer in the UEFA Champions League and for the Portugal national team. His pursuit of a sixth World Cup appearance adds another layer of motivation as he approaches the twilight of his playing days.
Injuries have been infrequent for Ronaldo in recent years, making this episode stand out. Fans and analysts alike noted the rarity of him missing an entire month of action, as appeared likely in March. Yet his proactive approach to rehabilitation — including time in Madrid — aligns with the meticulous preparation that has sustained his elite performance.
Advertisement
Broader Implications and Outlook
The positive trajectory of Ronaldo’s recovery has been welcomed across the football world. Supporters of Al Nassr hope to see him back contributing goals and leadership soon, while Portugal fans look forward to his presence in the buildup to the World Cup.
Medical experts note that hamstring injuries in older athletes require careful management to avoid recurrence, but Ronaldo’s history of disciplined training and access to top-tier medical support positions him well. Gradual reintroduction to team training, followed by controlled match minutes, will be key in the coming weeks.
As of late March 2026, Ronaldo remains on track for a return well before the World Cup. While no official date has been confirmed, the combination of his social media update, Martinez’s assurances and club expectations points to availability in early April for Al Nassr, with full fitness expected long before Portugal’s World Cup campaign begins.
Advertisement
Ronaldo’s message of steady improvement serves as both a personal progress report and a signal to fans that the legendary forward continues to chase excellence, injury or not. His focus remains on recovery, with an eye firmly set on adding to his extraordinary legacy on the international stage this summer.
Sleep Factory in Ossett has been ordered to demolish an extension to its factory following a failed appeal against a council enforcement notice
Graeme Whitfield Editor of Journal and Northern Agenda, Tony Gardner and Local Democracy Reporter
17:35, 26 Mar 2026
(Image: Local Democracy Reporting Service)
A luxury bed manufacturer has been instructed to tear down an extension to its factory following an unsuccessful appeal. Wakefield Council rejected a retrospective planning application submitted by Sleep Factory to enlarge its premises in Ossett back in November 2024.
Nine residents living in close proximity to the business on St Oswalds Place raised objections to the new structure, citing concerns that HGV deliveries were creating a hazard on local roads. At the time, council planning officers turned down the scheme on highway safety grounds.
Advertisement
The business owner subsequently lodged an appeal with the Planning Inspectorate against both the decision and a council enforcement notice demanding the structure be demolished. Both appeals were dismissed after an inspector visited the site earlier this month.
The inspector highlighted a “lack of manoeuring space” for large vehicles to exit the area.
A report stated: “The representations of neighbouring occupiers attest to the problems with HGVs reversing out of the site. Such manoeuvres are potentially hazardous due to the nature of St Oswald’s Place.
“Given the site constraints, I am not convinced that there are any conditions that could overcome the identified harm.”
Advertisement
Sleep Factory first attracted complaints during a planning dispute in 2018, when local residents raised concerns about noise from the site disturbing them during the night.
The firm stated at the time that the extension was necessary due to a shortage of space. At that time, the council’s planning committee approved the company’s application to expand the premises by 255 sq m.
However, according to an officer’s report, the total measured floorspace on plans subsequently submitted to the council revealed the extension had in fact been carried out to 285 sq m.
In the cryptocurrency space, platform choice tends to be less about branding and more about execution, liquidity, and control. For UK-based crypto investors—many of whom have already experienced multiple market cycles—the bar is relatively high.
Against this backdrop, FXFinex has started to appear in discussions among traders looking for a more structured way to access crypto markets, particularly through leveraged and CFD-based exposure.
The question is not whether FXFinex offers crypto trading. The more relevant question is whether its environment is suited to how experienced crypto investors actually operate.
Why UK Crypto Investors Are Paying Attention
The UK crypto trading community has matured. Many participants are no longer driven purely by speculation but by strategy, timing, and risk-adjusted exposure.
FXFinex seems to be attracting attention for a few reasons:
Advertisement
Access to major crypto assets without excessive fragmentation
Integration of crypto within a broader multi-asset platform
Tools that support active trading rather than passive holding
This positions it differently from crypto-only exchanges, which often prioritise token variety over trading structure.
Why UK Crypto Investors Are Paying Attention
The UK crypto trading community has matured. Many participants are no longer driven purely by speculation but by strategy, timing, and risk-adjusted exposure.
FXFinex seems to be attracting attention for a few reasons:
Access to major crypto assets without excessive fragmentation
Integration of crypto within a broader multi-asset platform
Tools that support active trading rather than passive holding
This positions it differently from crypto-only exchanges, which often prioritise token variety over trading structure.
1. Crypto Market Access: Focused Rather Than Extensive
FXFinex does not attempt to compete on the number of tokens listed. Instead, it concentrates on:
High-liquidity assets such as Bitcoin and Ethereum
Widely traded crypto pairs
Markets where execution reliability is more predictable
For experienced traders, this approach reduces exposure to illiquid assets and erratic spreads—common issues in smaller altcoin markets.
However, for investors seeking early-stage tokens or niche opportunities, the offering may feel limited.
Advertisement
2. Trading Crypto via CFDs: Flexibility with Trade-Offs
One of the defining aspects of FXFinex is its use of CFD structures for crypto trading.
This allows traders to:
Take both long and short positions
Use leverage to increase exposure
Trade without directly holding the underlying asset
For UK investors, this can be attractive from a tactical trading perspective, particularly during volatile conditions.
At the same time, it introduces considerations:
You do not own the underlying crypto
Overnight fees and spreads become relevant
Risk increases significantly with leverage
This model is better suited to active traders than long-term holders.
3. Execution and Liquidity: Key for Volatile Markets
Crypto markets are known for sharp movements, often within short timeframes. In this environment, execution becomes critical.
Advertisement
FXFinex appears structured to handle:
Rapid order placement
Clear pricing at execution
Consistent liquidity in major pairs
For traders operating with larger positions, this reduces uncertainty—though, as always, performance should be tested under real conditions.
4. Risk Management in Crypto Trading
Risk management is often underestimated in crypto, particularly among less experienced traders. FXFinex integrates core tools directly into the trading interface:
Stop-loss and take-profit controls
Margin monitoring
Real-time exposure visibility
For UK investors used to regulated environments and structured risk approaches, this integration supports more disciplined trading behaviour.
5. Platform Experience: Built for Active Use
FXFinex’s interface reflects a trading-first mindset. There is minimal emphasis on:
Token discovery
Social features
Passive earning products
Instead, the platform focuses on:
Price action
Order execution
Position management
This may not appeal to all crypto users—but for those actively trading volatility, it aligns with practical needs.
Final Thoughts: A Platform for Tactical Crypto Traders
FXFinex presents a structured environment for crypto trading, particularly for those who:
Advertisement
Prefer leveraged exposure
Trade both directions (long and short)
Focus on major, liquid assets
It is less suited to:
Long-term holders
Altcoin-focused investors
Users seeking ecosystem features like staking or DeFi access
For UK-based traders approaching crypto with discipline and strategy, FXFinex offers a functional, execution-focused alternative—one that prioritises control over complexity.
As with any platform, the key is alignment. Not every tool fits every strategy—but for the right type of trader, FXFinex appears designed with clear intent.
Tom Brady may not be returning to the NFL — but he has explored if it’s possible.
The legendary New England Patriots quarterback, a frequent subject of un-retirement rumors, told CNBC Sport this week that he has asked the NFL about its policy around returning to the league as a player while maintaining his status as a minority owner of the Las Vegas Raiders — but he has no plans to return.
“I actually have inquired, and they don’t like that idea very much,” Brady said in an interview promoting his World Cup ad campaign with Ferrero. “We explored a lot of different things, and I’m very happily retired. Let me just say that, too.”
An NFL spokesperson said if Brady were to pursue a return to the league, he would first need to divest his ownership stake in the Raiders, citing a 2023 policy that prohibits players or team employees from taking equity in a club.
Advertisement
“In addition, there would be salary cap issues involving a player/owner,” the spokesperson added.
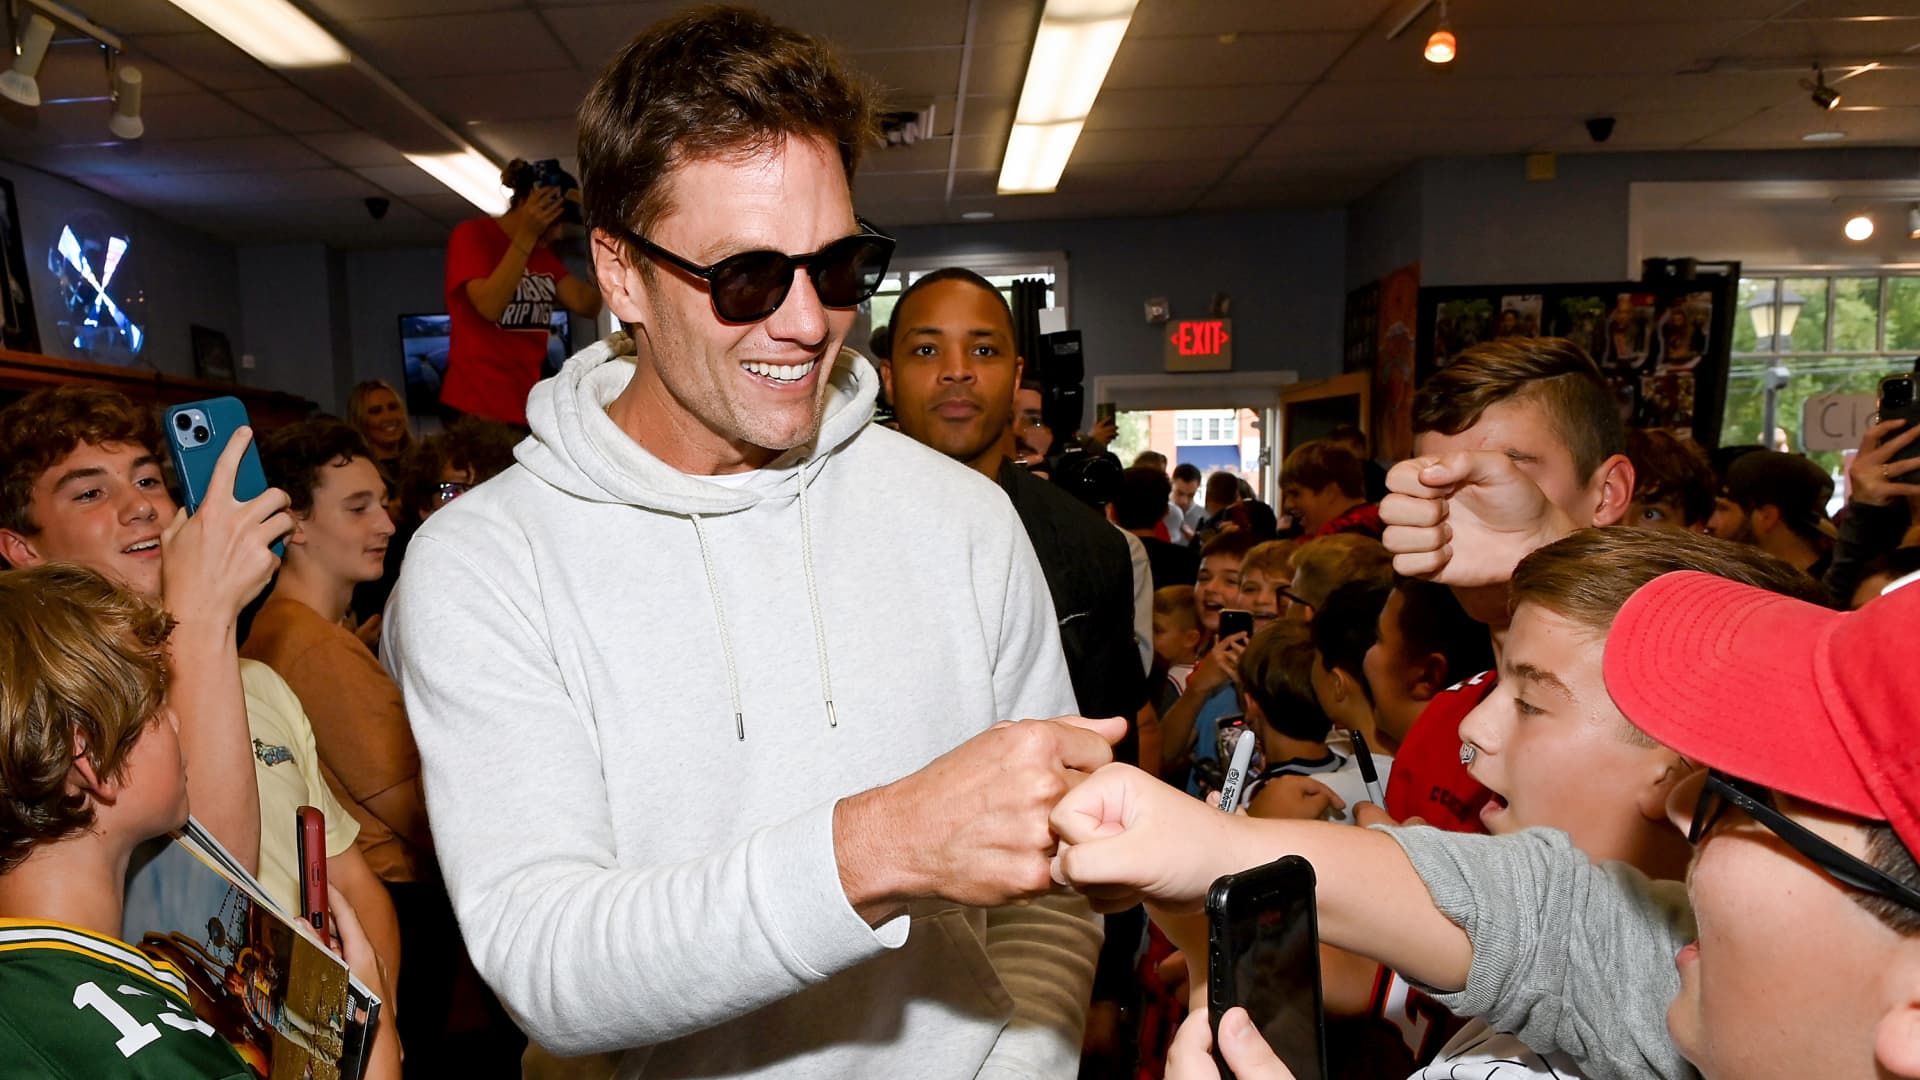
Brady last week participated in a Fanatics flag football game and threw a touchdown pass to wide receiver Stefon Diggs. While Brady acknowledged he loved being back on the field, he said, “if anything, that game reconfirmed to me that I’m very happy in my retirement.”
Get the CNBC Sport newsletter directly to your inbox
The CNBC Sport newsletter with Alex Sherman brings you the biggest news and exclusive interviews from the worlds of sports business and media, delivered weekly to your inbox.
Brady said since taking a minority stake in the Raiders, he’s helped the front office make personnel and coaching decisions in what he called a “strategic advisory role.”
“I’m a minority owner. So, when you’re that, there’s really no job description. I don’t have really a daily role,” he said. “You know, my phone call is always available to everybody who needs it. I want to see everyone succeed, be their best, bring a winning kind of a culture to Las Vegas — to bring the Raiders back to glory. I’d love to be a part of it.”
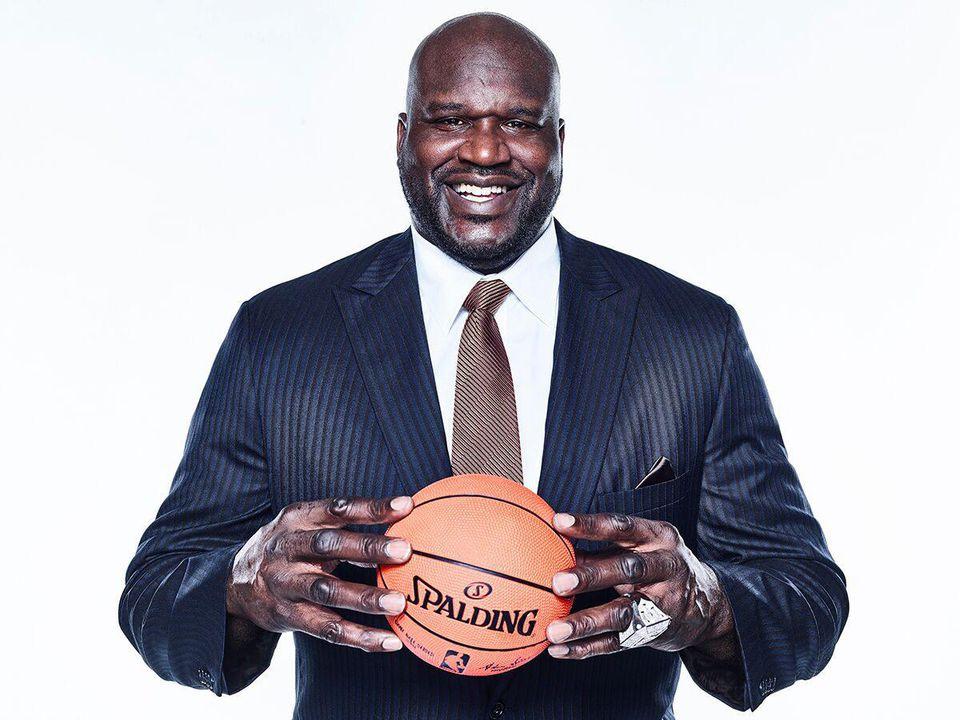
LOS ANGELES — Shaquille O’Neal firmly denied viral claims that he sent explicit and bizarre direct messages to pop star Sabrina Carpenter, telling listeners on his podcast that the screenshots are fake and that he possesses far better flirtation skills than those portrayed.
The 54-year-old NBA Hall of Famer addressed the rumor during a recent episode of “The Big Podcast with Shaq,” reading aloud some of the alleged lewd messages before dismissing them outright. “First of all, ladies, the Diesel got way more game than that,” O’Neal said, using his well-known nickname while laughing off the controversy.
The screenshots, which circulated widely on social media earlier this month, purported to show O’Neal sliding into Carpenter’s Instagram DMs with graphic and unusual content, including a line about keeping her “farts in a cologne bottle” and spraying it daily. Other alleged messages referenced crude sexual boasts. The images appeared to come from a verified account with O’Neal’s photo, but he and his co-hosts quickly pointed out signs of manipulation.
Co-hosts on the podcast, including comedian K.T. Bailey, agreed the messages did not sound like O’Neal. Bailey noted that the profile picture looked photoshopped and suggested the entire exchange could be AI-generated or fabricated by someone seeking viral attention. O’Neal added that the tone and phrasing — including him introducing himself despite messaging from his own verified handle — made the claims implausible.
Viral Rumor Sparks Online Debate
The rumor gained traction rapidly after the screenshots surfaced, with some users initially believing the messages were genuine due to the realistic appearance of the Instagram interface. Discussions ranged from amusement to criticism, with some questioning why a celebrity of O’Neal’s stature would send such overt and awkward overtures to the 26-year-old singer known for hits like “Espresso” and “Please Please Please.”
Advertisement
AFP
Carpenter, who has not publicly commented on the alleged DMs, has remained silent on the matter. No confirmation or denial has come from her representatives, and she has not shared or reacted to the screenshots on her own social channels.
O’Neal’s response mixed humor with dismissal. He joked about the explicit nature of the messages while emphasizing that his real-life approach to interaction differs significantly. Podcast guests reinforced that the content did not align with O’Neal’s public persona or typical communication style, noting that the messages read more like an attempt at internet trolling than authentic celebrity outreach.
O’Neal’s History with Social Media and Public Persona
The former Los Angeles Lakers center has long embraced a larger-than-life personality both on and off the court. Known for his charisma, business ventures and frequent media appearances, O’Neal maintains an active presence on social platforms and his podcast. He has previously shared stories about his dating life and admitted to past personal mistakes, including infidelity during his playing days.
This latest rumor fits into a broader pattern of celebrity DM scandals that often spread quickly online, sometimes fueled by deepfakes, AI tools or edited images designed to generate engagement. Experts note that Instagram DM screenshots are relatively easy to fabricate with modern editing software, especially when combined with AI-generated text or profile elements.
Advertisement
O’Neal has faced scrutiny over personal matters in the past but has generally addressed rumors with a blend of candor and humor. His podcast response continued that approach, turning a potentially awkward situation into lighthearted content for listeners while firmly rejecting the allegations.
Context of Celebrity Interactions and Online Virality
Incidents involving alleged direct messages between high-profile figures often highlight the challenges of social media in the digital age. What begins as a single post can snowball into widespread discussion, speculation and sometimes reputational harm before facts emerge.
In this case, the rapid spread of the screenshots underscores how quickly unverified content can circulate, particularly when it involves a generational gap between a basketball legend and a rising pop sensation. Carpenter, who rose to fame as a Disney Channel star before transitioning to mainstream music success, has cultivated a playful yet confident public image that contrasts sharply with the crude tone of the alleged messages.
O’Neal, standing 7-foot-1 and weighing over 300 pounds in his playing prime, has cultivated the “Big Diesel” persona that emphasizes dominance, wit and self-deprecation. His denial leaned into that image, suggesting that any real attempt at flirtation from him would reflect greater sophistication or “game.”
Advertisement
Social media users reacted with a mix of skepticism and amusement. Some defended O’Neal, arguing the messages were obviously fake, while others treated the story as harmless entertainment. The episode also reignited conversations about the ethics of sharing private messages — real or fabricated — without consent.
Broader Implications for Celebrity Culture
The incident reflects ongoing tensions in how celebrities navigate privacy, public perception and digital interactions. High-profile figures like O’Neal and Carpenter operate under constant scrutiny, where even unproven rumors can dominate news cycles.
O’Neal’s decision to address the claim directly on his podcast allowed him to control the narrative and inject humor, potentially diffusing any lingering damage. It also served as a reminder for audiences to approach viral content with caution, especially when it involves private communications that lack independent verification.
Carpenter has continued her busy schedule, promoting music and touring without addressing the rumor. Her team has not issued any statement, consistent with a strategy of ignoring unsubstantiated online noise.
Advertisement
For O’Neal, the episode adds another colorful chapter to a post-basketball career filled with media appearances, business deals and entertainment projects. The four-time NBA champion remains a beloved figure whose larger-than-life personality often invites both admiration and lighthearted mockery.
As the story fades from immediate headlines, it highlights the speed and reach of social media rumors in 2026. With AI tools making fabrication increasingly convincing, distinguishing fact from fiction requires greater scrutiny from both consumers and platforms.
O’Neal’s closing message on the podcast was simple: the claims were false, and anyone familiar with him should have known better. His co-hosts echoed the sentiment, reinforcing that the viral screenshots represented internet mischief rather than reality.
In an era where celebrity interactions fuel endless online speculation, O’Neal’s blunt denial and self-aware humor offered a straightforward rebuttal: the Diesel has way more game than that.
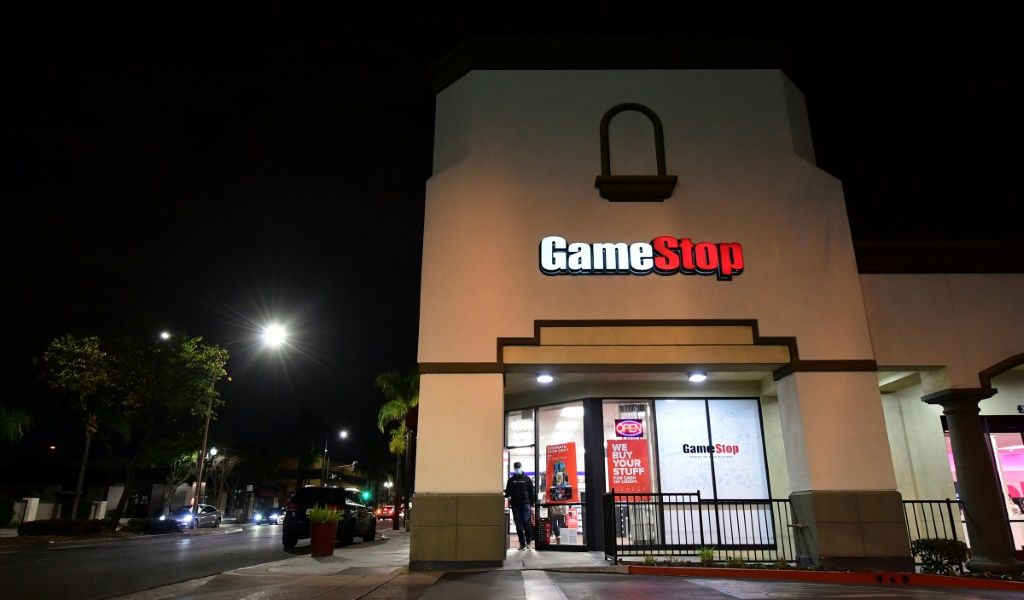
GameStop Corp. shares traded modestly lower in early Thursday trading as investors digested the video game retailer’s latest quarterly results, which showed declining revenue amid a broader industry shift to digital downloads but a surge in profitability and a massive cash reserve that continues to fuel speculation about the meme stock’s future.
AFP / Frederic J. BROWN
As of mid-morning Eastern time on March 26, 2026, GME stock was changing hands around $22.74, down about 1.5% from the previous close of $23.08. The stock has swung between roughly $22.62 and $23.22 so far in the session, with volume approaching 2 million shares. For the week, shares are little changed after posting a 1.18% gain on Wednesday following the earnings release.
GameStop reported fourth-quarter fiscal 2025 results after the market close on Tuesday, March 24. Revenue fell to $1.104 billion, missing Wall Street expectations and reflecting a 13.9% year-over-year decline as consumers increasingly bypass physical stores for digital game purchases and downloads. Adjusted earnings per share, however, came in at 49 cents, comfortably beating forecasts of around 31 cents.
The Grapevine, Texas-based company posted net income of $418.4 million for the full fiscal year, a sharp improvement from $131.3 million in fiscal 2024. Excluding certain one-time items such as impairments and losses on digital assets, the results highlighted better cost management and gross margin expansion. Full-year net sales totaled $3.63 billion, down 5% from the prior year.
Analysts noted the mixed bag. While hardware and software sales continued to soften, the company’s growing emphasis on collectibles — including trading cards, figurines and memorabilia — provided some offset, with that segment showing strength in recent periods. GameStop has been repositioning itself away from traditional video game retail toward a broader entertainment and collectibles play as the industry evolves.
Advertisement
A standout feature of the report was the balance sheet. GameStop ended the period with approximately $9.01 billion in cash and cash equivalents, giving it significant financial flexibility. The company has no long-term debt of note, resulting in a net cash position that values the enterprise well below its cash holdings on some metrics. That war chest has long intrigued investors, sparking talk of potential acquisitions, share buybacks or other capital returns.
“GameStop’s cash pile is its greatest asset right now,” said one retail investor tracking the name on social media platforms, echoing a sentiment common in online communities. “Whether Ryan Cohen deploys it for a big deal or just sits on it, it keeps the short sellers nervous.”
CEO Ryan Cohen, who took the helm in 2023 after building a sizable stake, has kept a relatively low public profile but is widely credited with steering the company toward cost discipline and strategic pivots. Speculation about a major acquisition — with names like eBay occasionally floated in media reports — has periodically lifted the stock, though no deals have materialized.
The stock’s volatility remains a defining trait. GME has traded in a 52-week range of $19.93 to $35.81. Year to date through late March 2026, shares are up roughly 14-15%, outperforming many other former meme stocks that have struggled in 2026. Market capitalization stands near $10.3 billion based on about 448 million shares outstanding.
Advertisement
Short interest continues to draw attention from retail traders. As of mid-March, roughly 64.2 million shares were sold short, representing about 15.7% of the public float. The days-to-cover ratio hovered around 12, meaning it would take more than two weeks of average daily volume to close out those positions at current levels. While far below the frenzied levels seen during the 2021 short squeeze that propelled shares above $80 intraday (pre-split adjusted), the persistent short position keeps alive the narrative of potential upward pressure.
The GameStop saga dates back to early 2021, when social media-driven buying by retail investors, amplified by figures like Keith Gill — better known as “Roaring Kitty” or DeepF**kingValue on Reddit — triggered one of the most dramatic short squeezes in Wall Street history. Shares skyrocketed from under $20 to triple digits in a matter of days, inflicting heavy losses on hedge funds with large short bets and sparking congressional hearings, regulatory scrutiny and a cultural moment around “diamond hands” and meme stocks.
Gill has periodically resurfaced on social media, posting cryptic messages or position updates that have occasionally reignited trading fervor. Michael Burry, the investor made famous by “The Big Short,” has also expressed interest in GME at times, citing its undervaluation relative to net asset value. Such endorsements, even without direct action, tend to boost visibility in retail circles.
Yet the fundamentals tell a more challenging story. The video game industry has shifted dramatically toward digital distribution, with platforms like Steam, PlayStation Network and Xbox Live capturing the majority of software sales. Physical game disc sales have plummeted, pressuring retailers like GameStop. The company has responded by closing underperforming stores, trimming overhead and exploring new revenue streams in collectibles and potentially e-commerce or partnerships.
Advertisement
Circana, an industry tracker, projects U.S. video game spending to rise modestly in 2026, but much of that growth is expected in digital and subscription models rather than brick-and-mortar. GameStop’s employee count has shrunk significantly from its peak, now hovering around 4,000.
Wall Street analysts remain cautious overall. The consensus price target sits well below current levels, around $13.50, implying potential downside of more than 40% for some models. Ratings are generally neutral to sell, reflecting concerns over long-term revenue trajectory in a tough retail environment. However, the massive cash balance and low debt provide a floor that limits bankruptcy risk and supports the “value trap or deep value” debate.
Options activity around earnings was elevated, with implied moves suggesting traders anticipated a 6-7% swing in either direction post-results. The stock initially dipped on the revenue miss but recovered some ground as the earnings beat and cash position took center stage.
For individual investors, GME remains a high-risk, high-volatility name. Trading volume often spikes on news or social media catalysts, and beta above 1.5 indicates it moves more dramatically than the broader market. Those holding through multiple cycles cite community loyalty and the cash hoard as reasons for optimism, while critics point to eroding core business and lack of a clear turnaround path.
Advertisement
GameStop has not provided detailed forward guidance, consistent with its recent practice of limited commentary. The company did note ongoing efforts to optimize its footprint and invest in areas with growth potential, particularly collectibles, which saw sales gains in the quarter.
As the broader market grapples with economic uncertainty, interest rates and sector rotations, speculative names like GME often move independently on narrative rather than pure fundamentals. Whether the stock can sustain momentum or faces renewed pressure will likely depend on how management deploys its cash, any strategic announcements and the unpredictable influence of social media sentiment.
Investors should note that past meme-stock surges were driven by extraordinary short-covering dynamics that may not repeat. With short interest moderated but still notable, and a cash-rich but revenue-challenged business, GME continues to embody the tension between traditional value metrics and modern retail investor enthusiasm.
GameStop is scheduled to hold its next earnings call in the coming months, where further details on strategy could emerge. In the meantime, traders are watching technical levels around $22 support and $24-$25 resistance.


You must be logged in to post a comment Login