

Crypto World
Solana Price Prediction For March 2026: Breakdown Continues?
Solana enters March under heavy pressure. SOL is down over 31% month on month, with February alone delivering a 17% loss. But the Solana price decline is only part of the problem. Underneath the chart, the economic engine that powered Solana through late 2025 — its memecoin ecosystem — has broken down. And the on-chain data tracking holders, exchange flows, and DEX activity all confirm the same thing: the selling is structural, not seasonal.
The question for March is no longer whether Solana can bounce. It is whether anything can stop the pattern already in motion from reaching its target.
Bearish Pattern Meets A Broken Engine
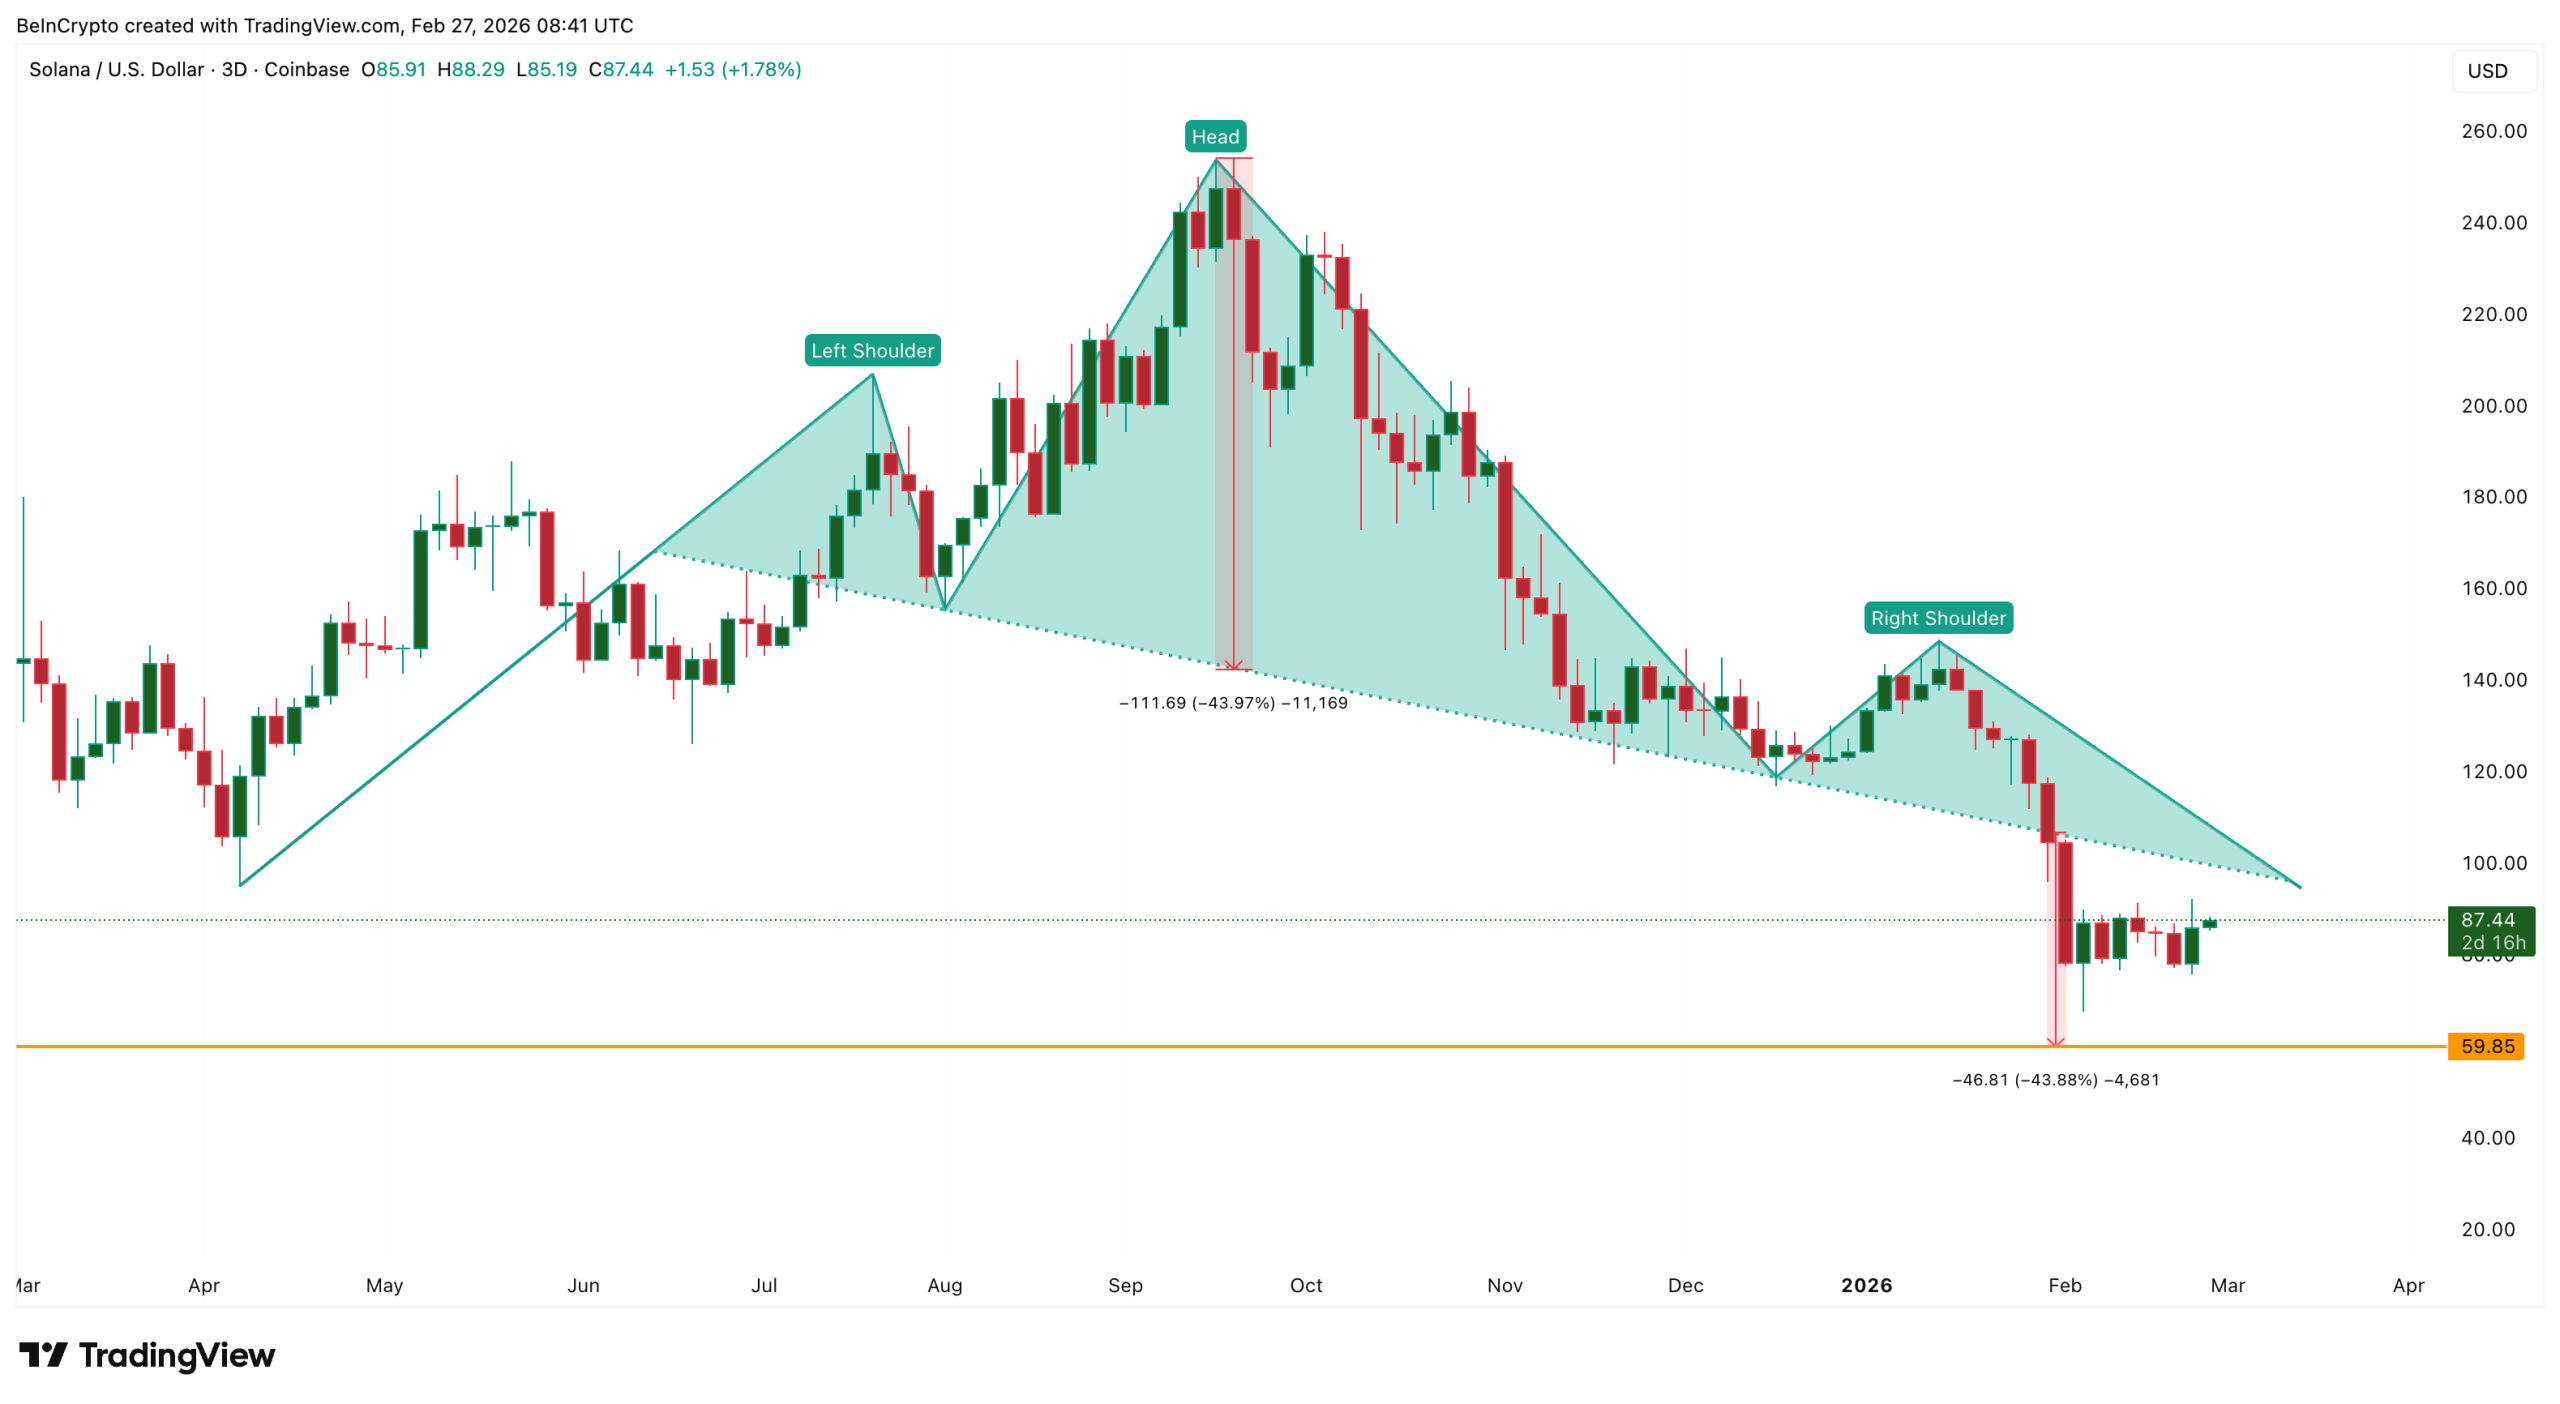
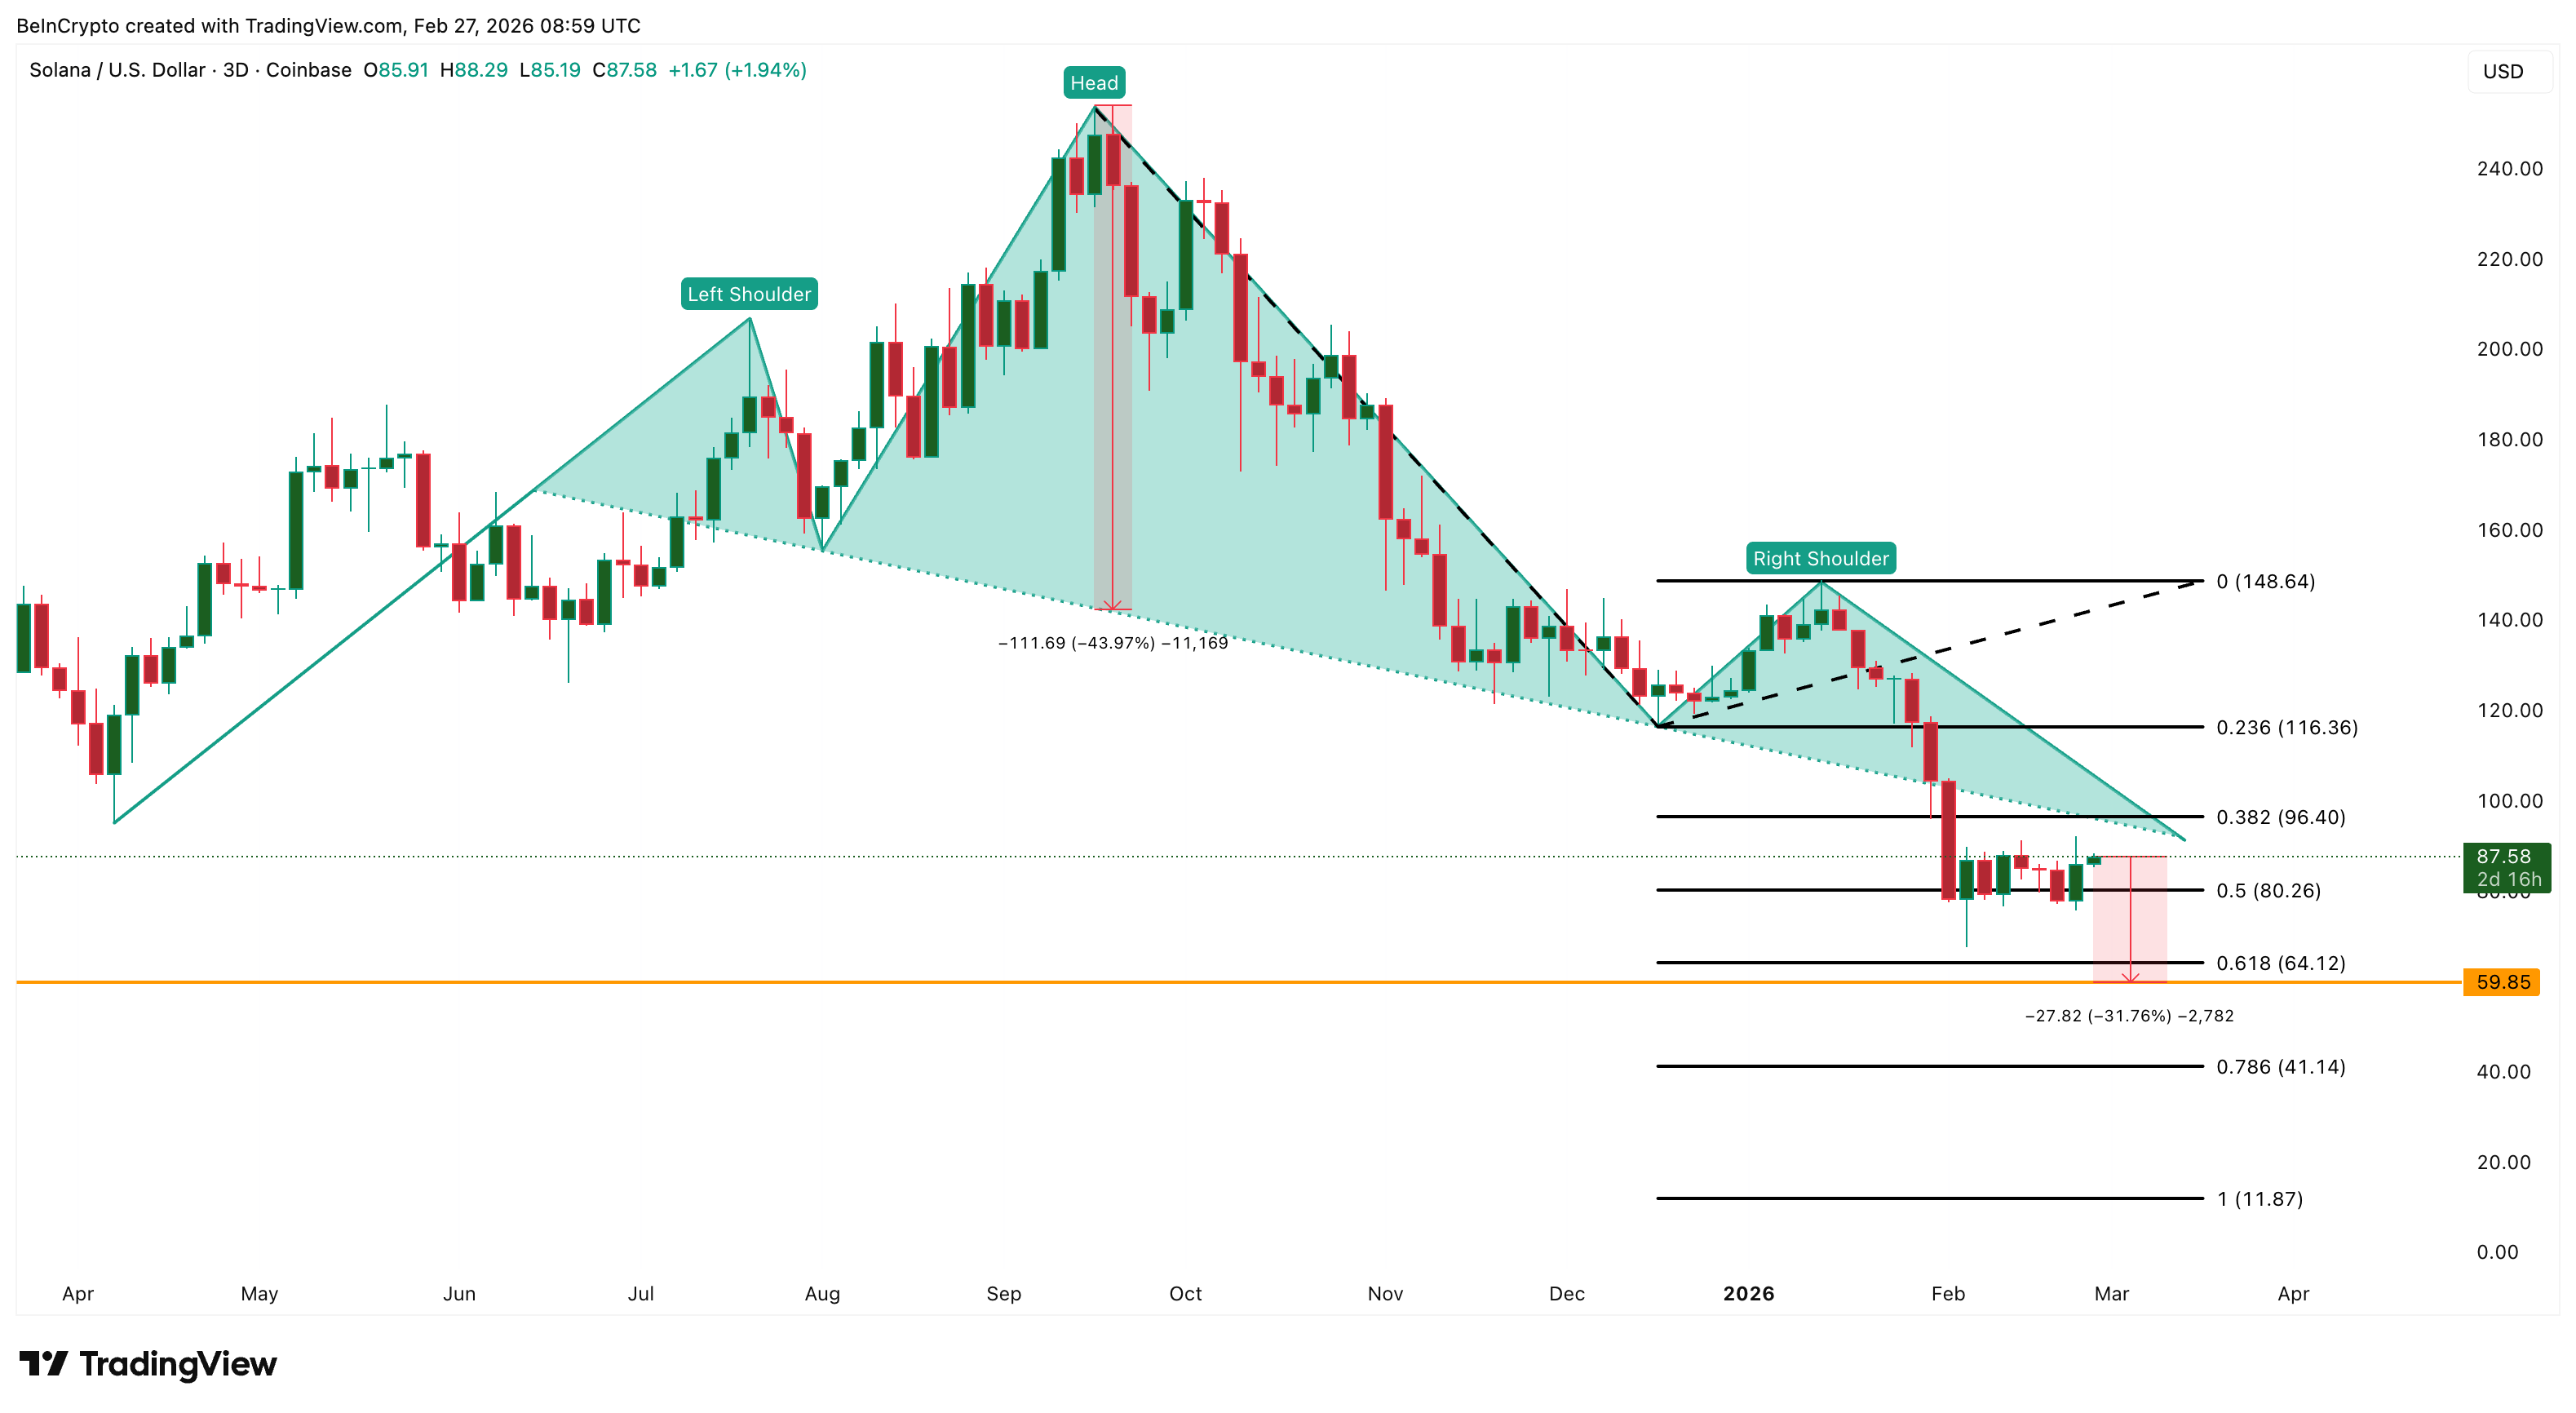
The 3-day chart reveals a confirmed head-and-shoulders pattern, with the neckline near $107 breaking around January 31. The measured move from that breakdown, roughly 44% from the neckline, places the technical target near $59.
SOL currently trades around $87, meaning the pattern is only partially fulfilled. From here, approximately 30% of additional downside remains if the move completes.
Want more token insights like this? Sign up for Editor Harsh Notariya’s Daily Crypto Newsletter here.

What makes this setup more convincing is that the neckline break coincided with the collapse of the very ecosystem driving Solana’s on-chain economy — its memecoin sector.
In the week ending February 2, Solana’s total DEX volume stood at $118.2 billion, with Pump.fun accounting for $61.4 billion and Meteora contributing $20.1 billion. By the week ending February 23, total volume had crashed to $44.5 billion — a 62% decline, per exclusive Dune data pulled by BeInCrypto analysts. Pump.fun dropped to $30.5 billion. Meteora collapsed 83% to just $3.4 billion.
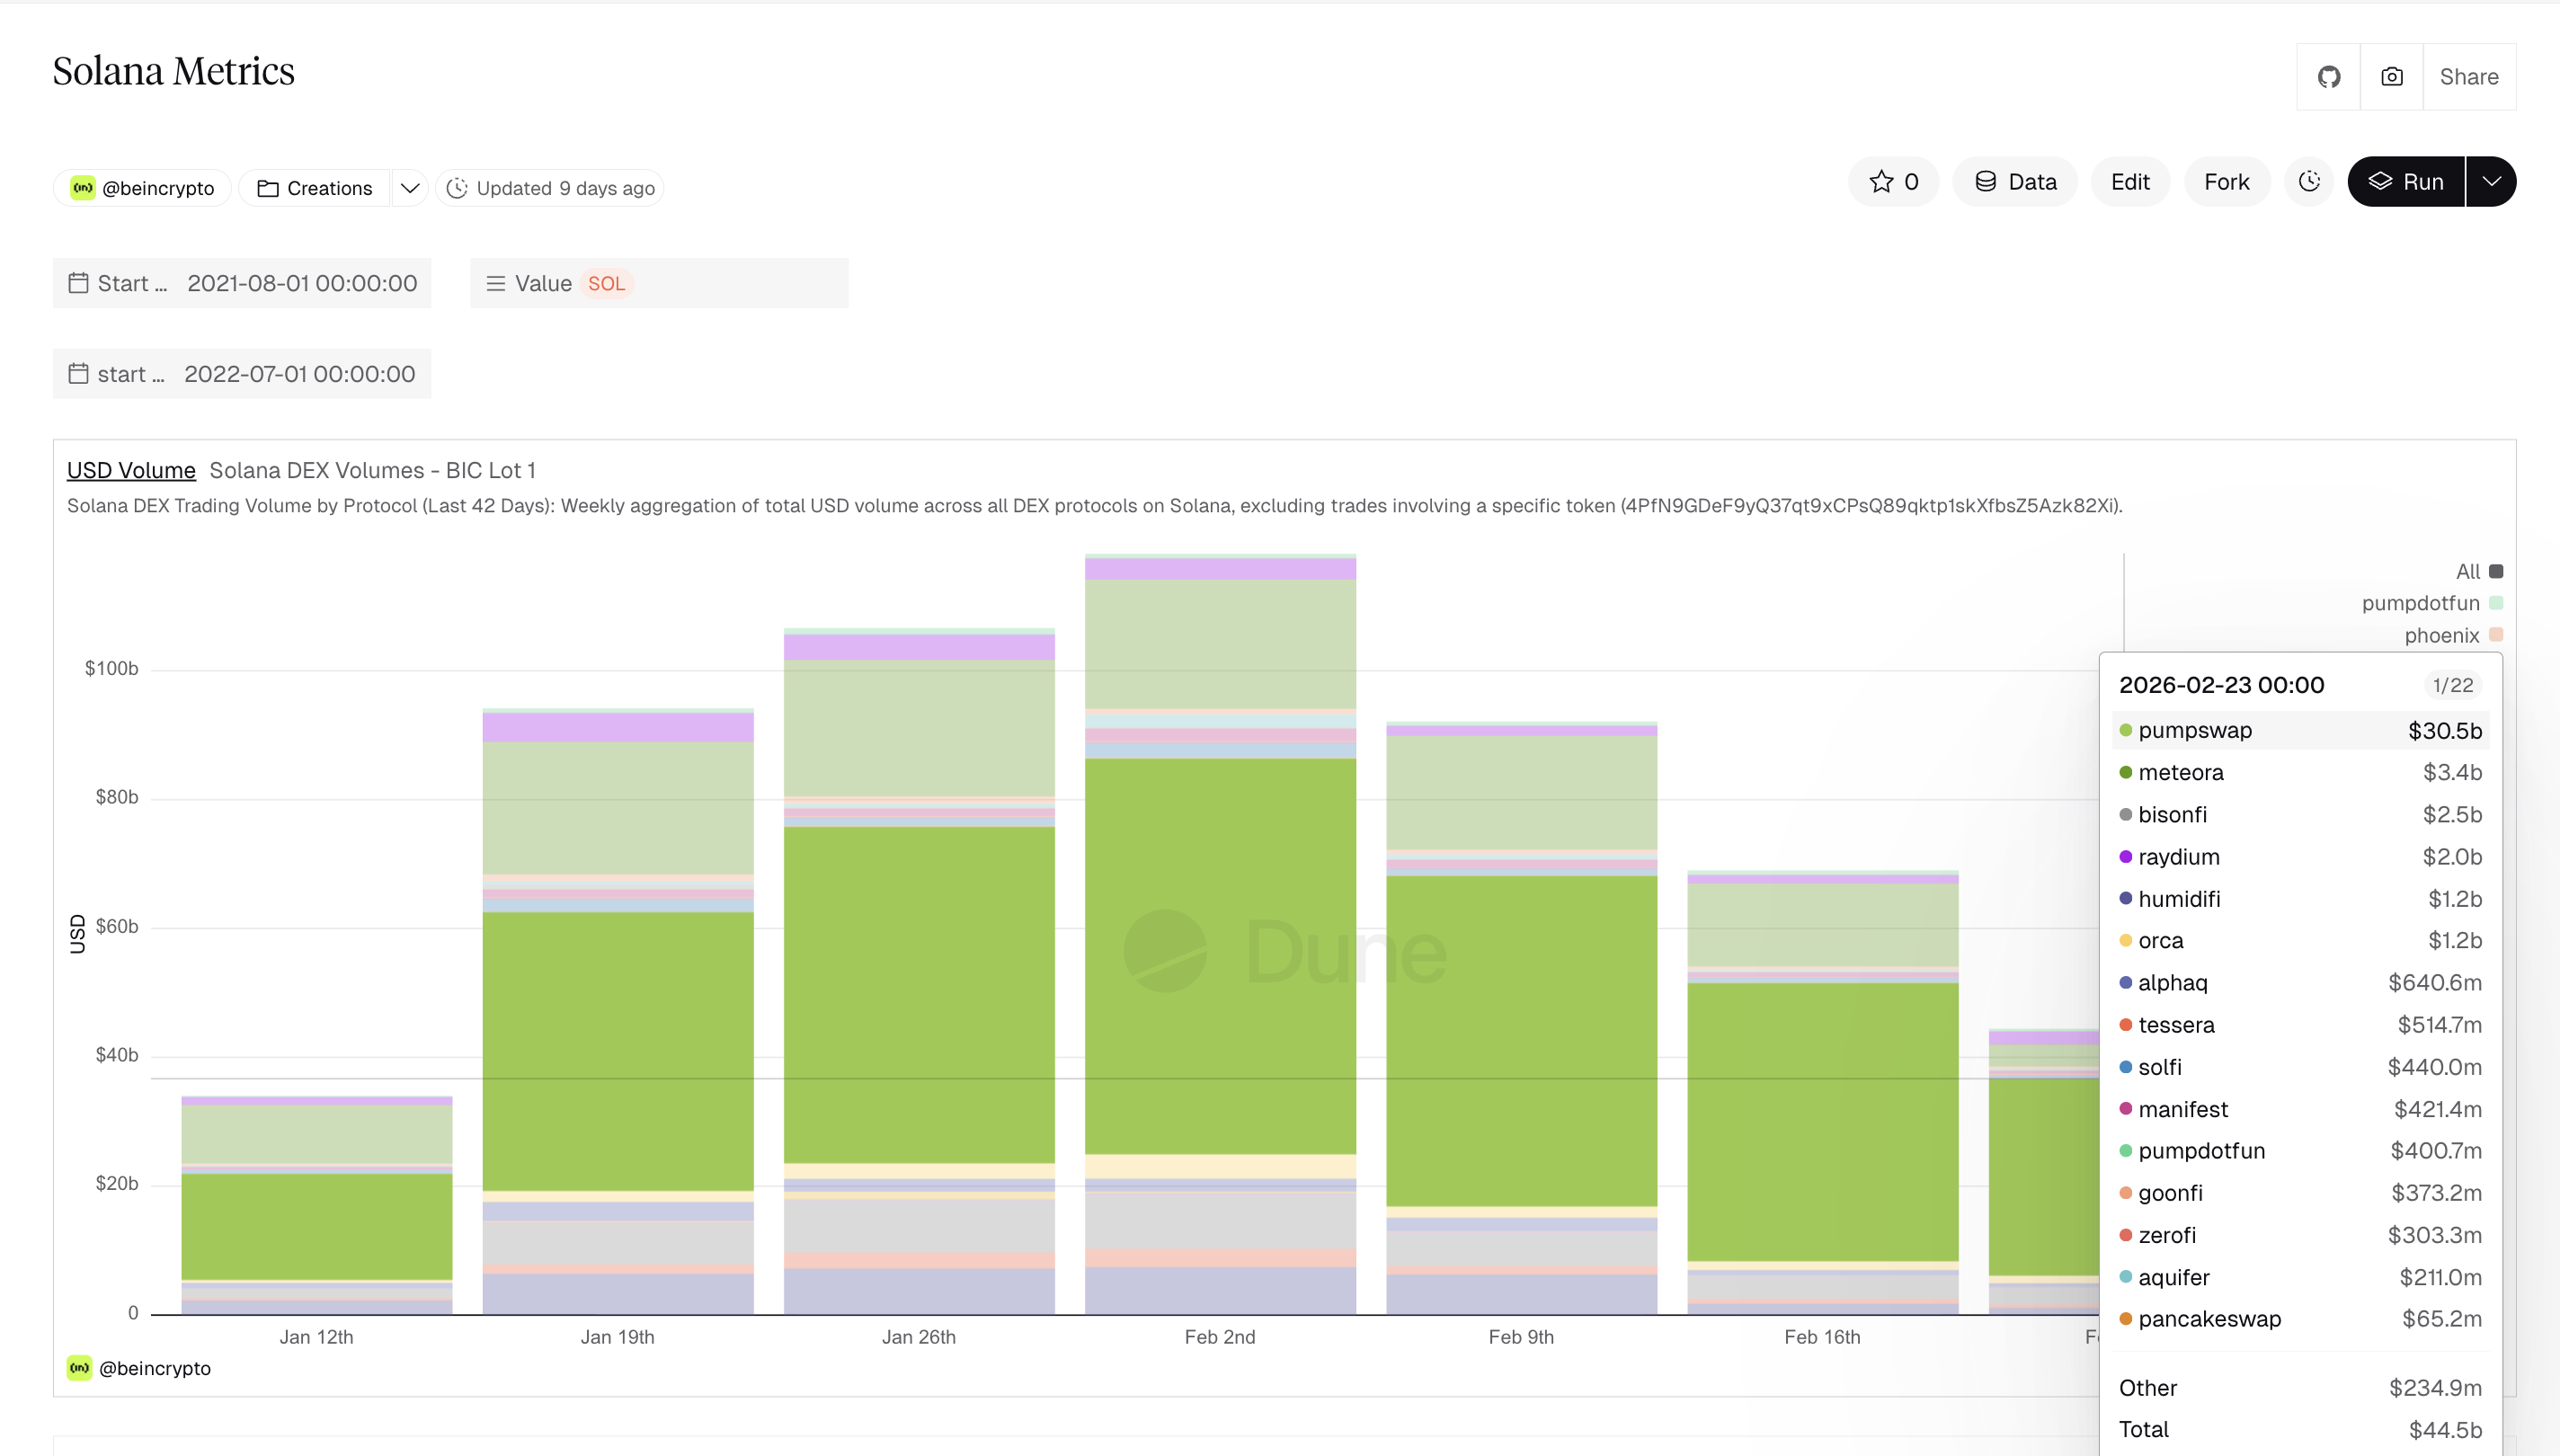
The chart breakdown and the memecoin collapse are not separate events. The pattern started forming as confidence was already cracking. And without its primary revenue driver, Solana now faces the rest of the measured move with weakened fundamentals underneath it.
History And SOL Holders Offer No Relief
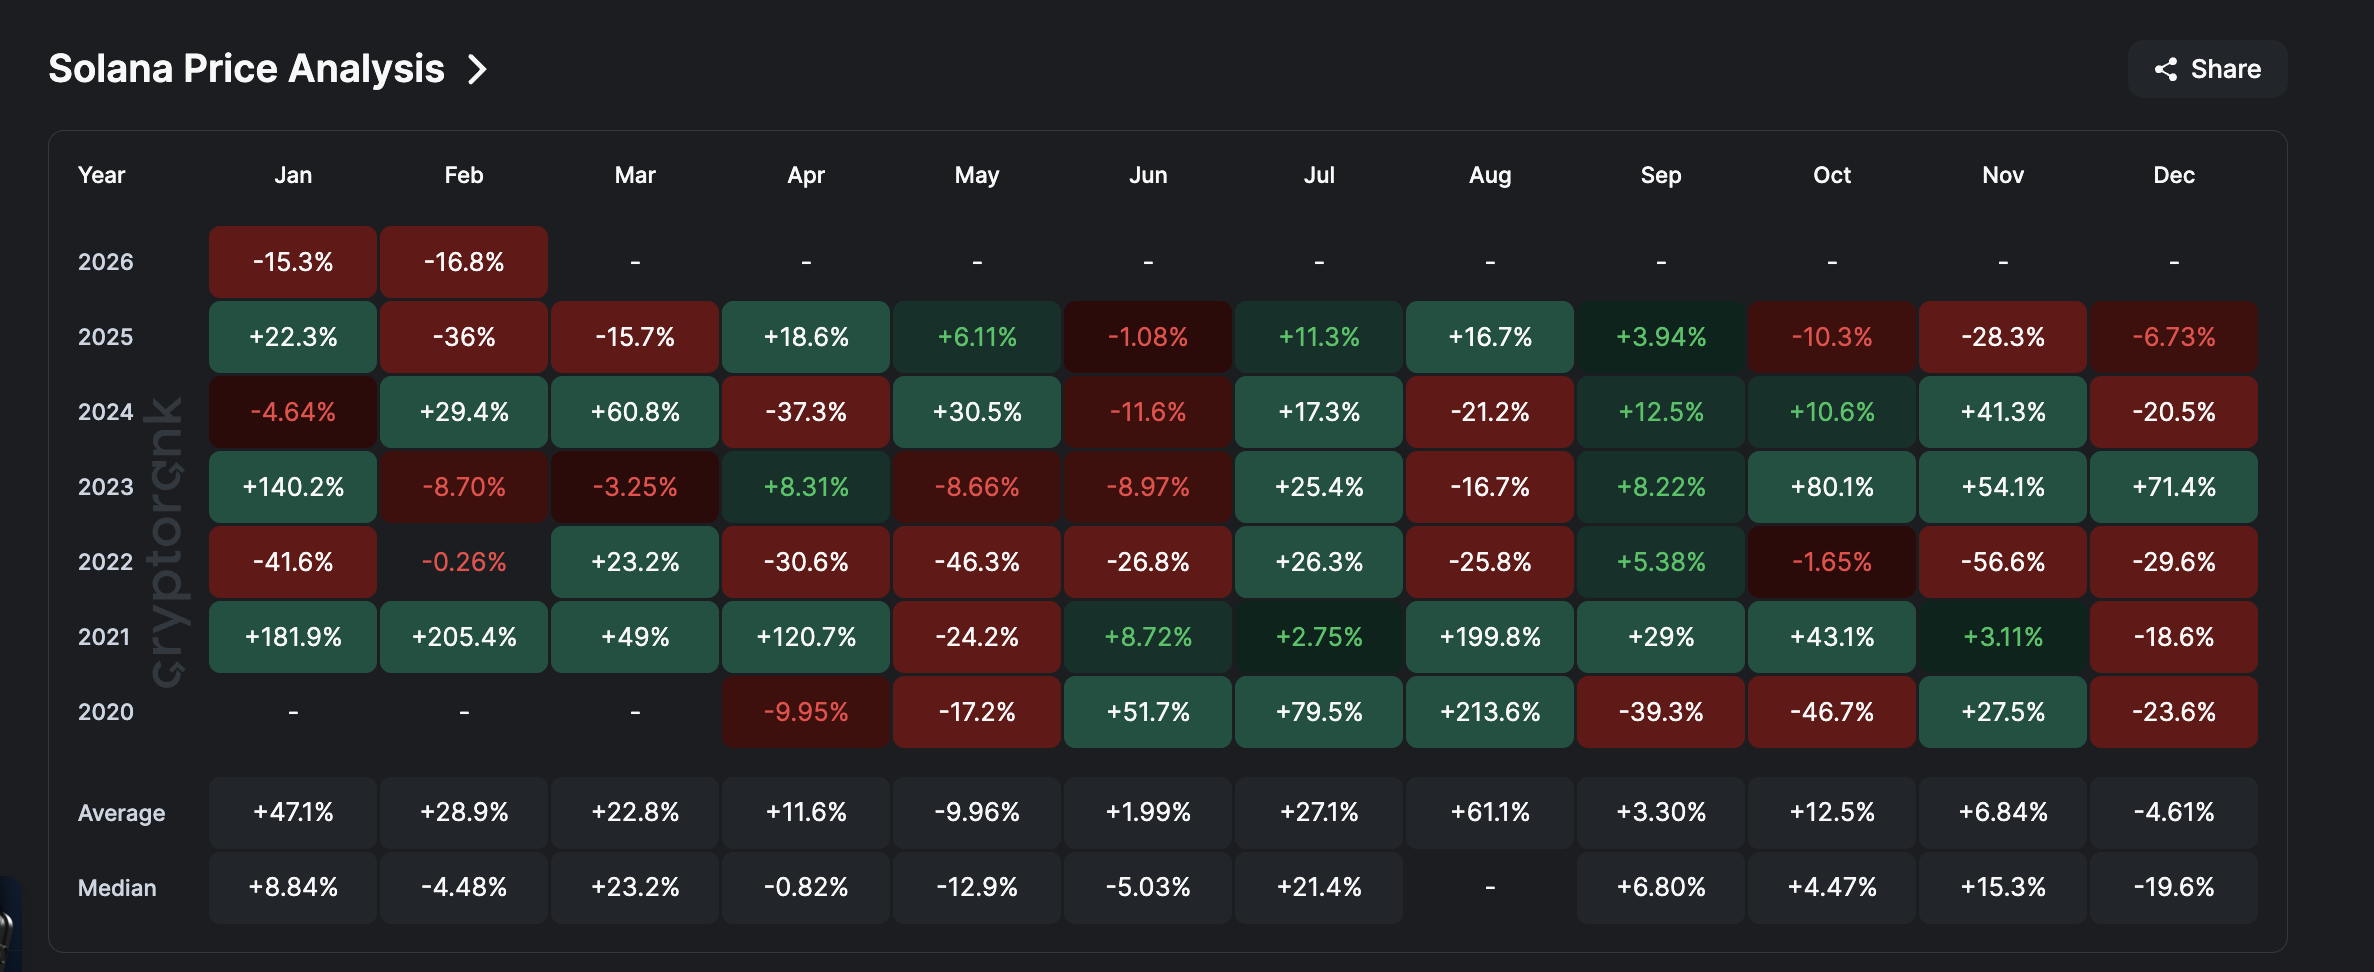
In past cycles, seasonal data would offer some hope here. March carries a median gain of 22.8% for Solana, and February’s historical average sits near positive 28.9%. But February 2026 returned -17%, and January delivered a 15% loss, as opposed to a +47% average.
Two consecutive red months already break the seasonal playbook. The “red month, green month” narrative no longer holds when the pattern has failed twice in a row — and the drivers behind those losses are structural, not cyclical.
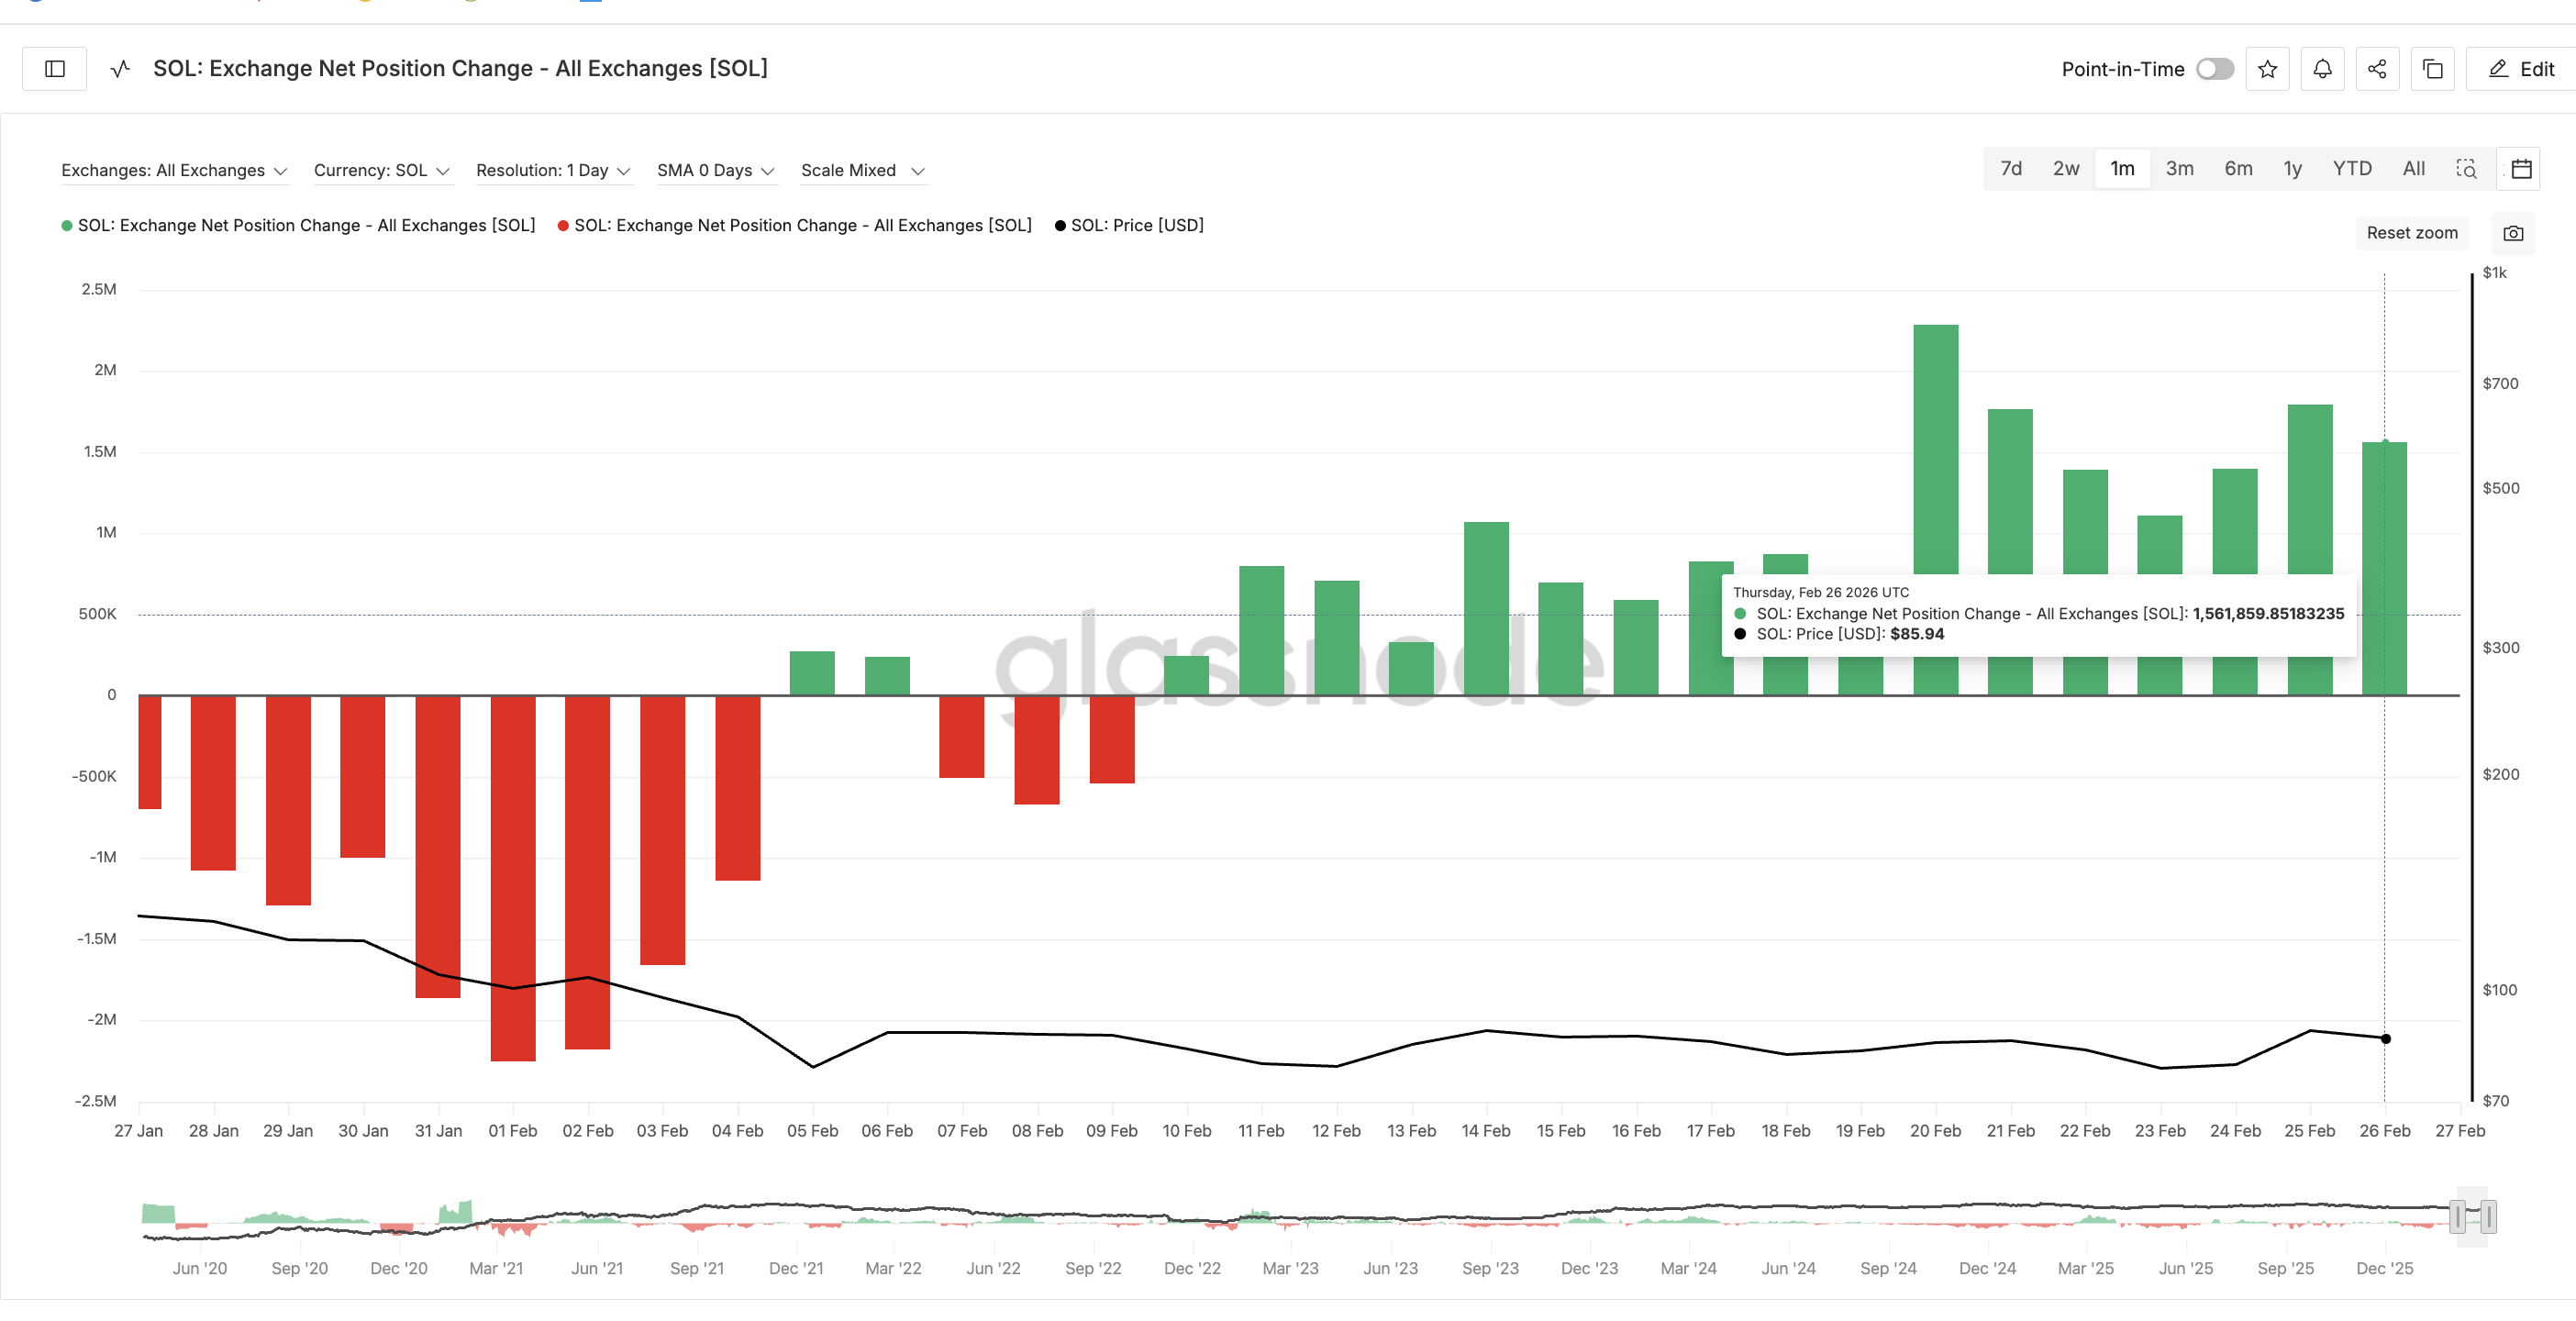
The holder data reinforces this. In early February, when DEX volume was peaking at $118.2 billion, the Exchange Net Position change metric, showing netflows, was deeply negative — tokens were flowing off exchanges, a classic accumulation signal. That behavior matched the on-chain optimism at the time.
By February 26, the picture had fully inverted. Exchange net inflows surged to 1,561,859 SOL on a 30-day rolling basis — up roughly 40% from the 1,106,796 level seen just three days earlier on February 23. As the memecoin economy collapsed and DEX volumes cratered, holders possibly responded by moving tokens to exchanges for liquidation.
Long-term conviction holders tell the same story from the other side. The Hodler net position change metric — a measure of accumulation by longer-term wallets — peaked in late January (near the pattern breakdown) around 3.47 million SOL on a 30-day rolling basis. By February 26, it had collapsed to just 266,744 SOL — a 92% decline and the monthly low.
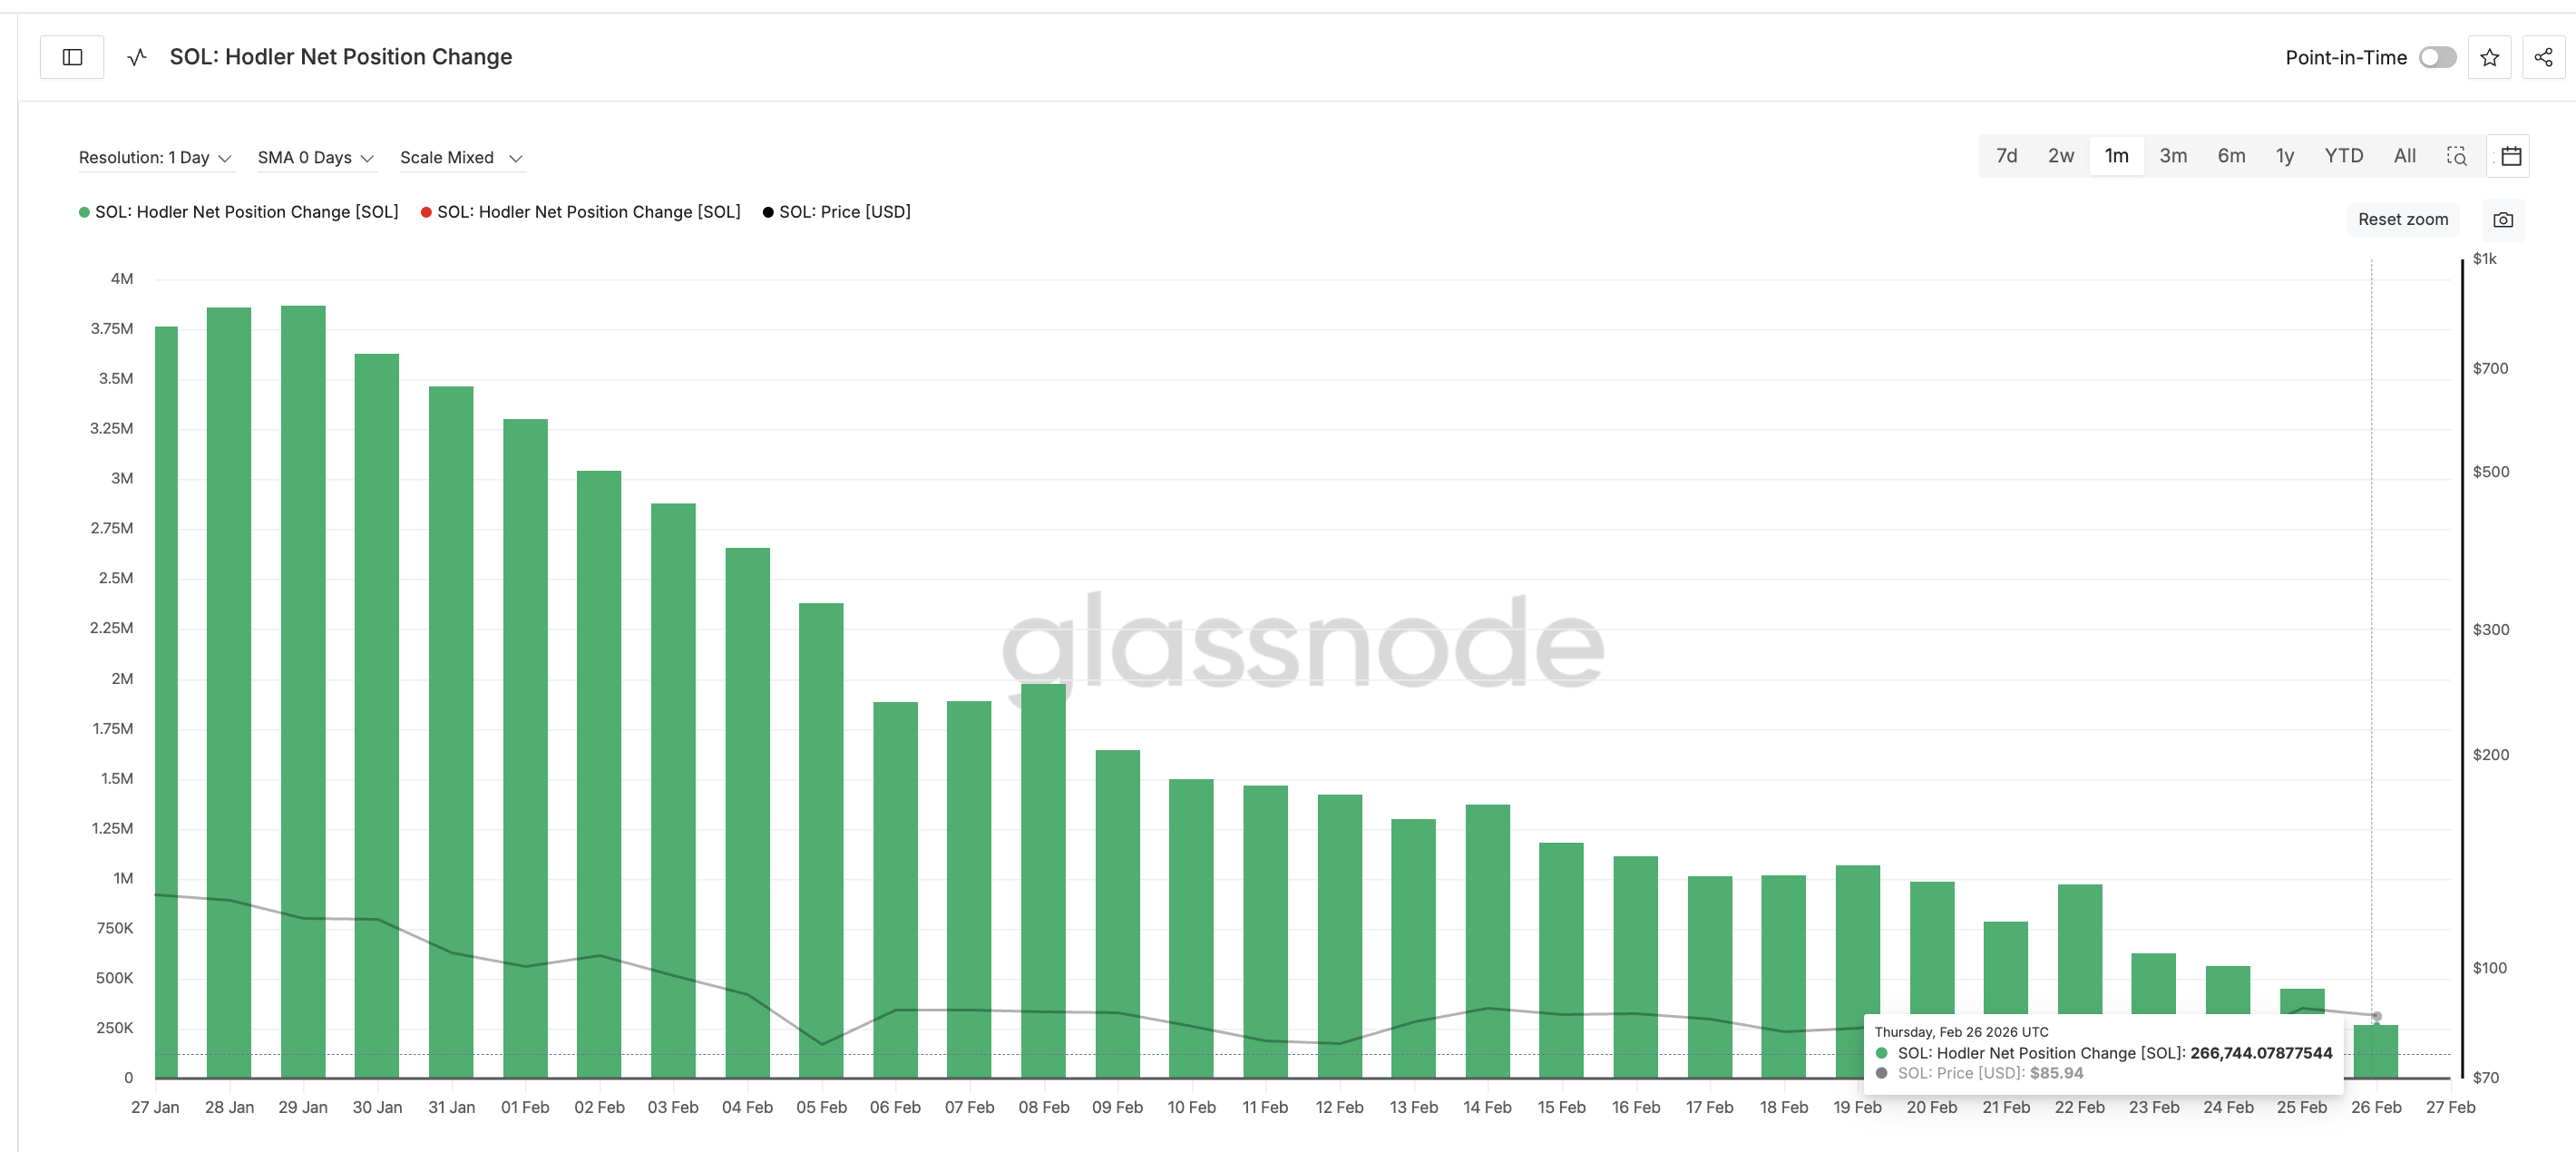
The buyers who would typically support a recovery are stepping back, not stepping in.
ETF Flows Remain The Lone Support
Against all of this, one data point stands in contrast. Solana spot ETFs maintained positive weekly inflows throughout February, even as Bitcoin and Ethereum ETFs collectively bled. In the week ending February 20, SOL ETFs absorbed $14.31 million. By the week ending February 26, that figure had tripled to $43.13 million — the highest weekly inflow of the month.
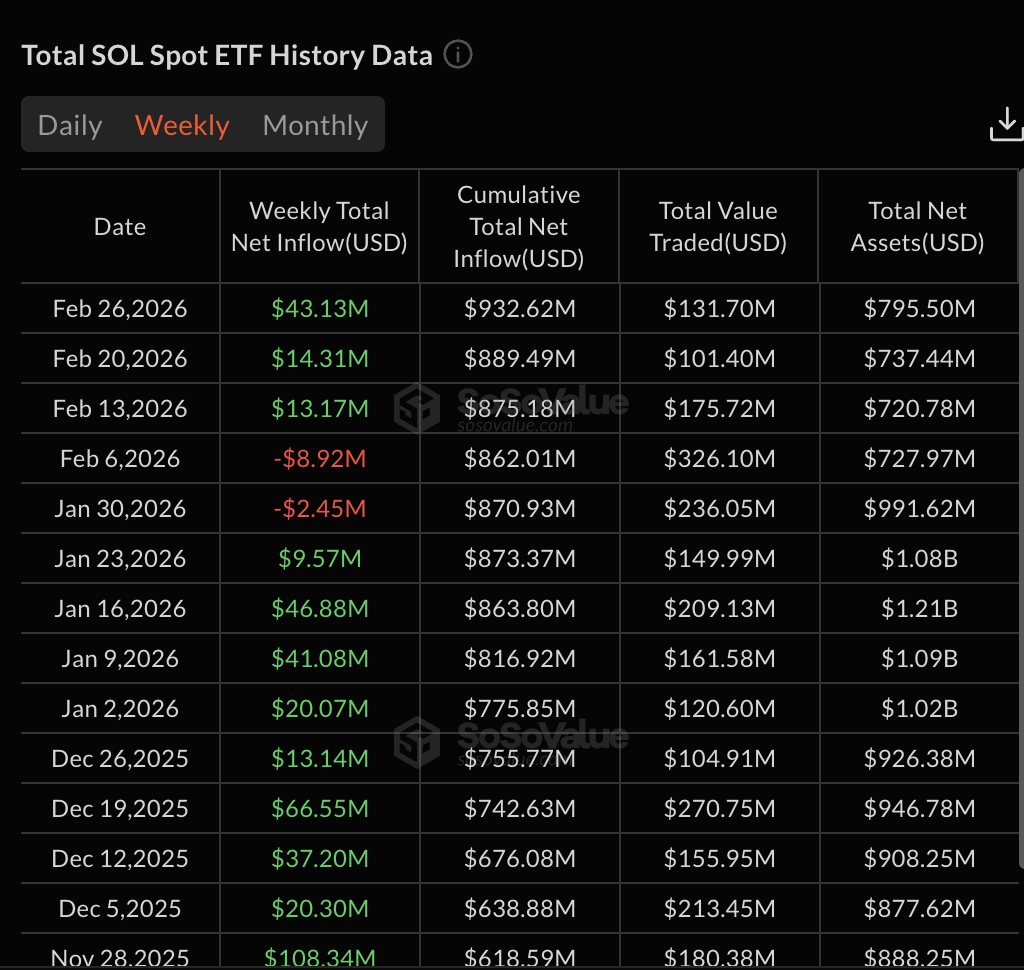
Cumulative SOL ETF inflows have now surpassed $900 million since launch, with 12+ consecutive days of net inflows recorded in February.
The ETF bid is real. It suggests a floor will form at some point, and intermittent bounces should be expected. But it has not been enough. SOL dropped 17% in February despite almost uninterrupted institutional buying. The scale of on-chain selling, even on the sentimental side, currently outweighs ETF demand.
Key Solana Price Levels For March
The $80 zone has absorbed the most price action during this sell-off — multiple tests have occurred, making it the most significant near-term support. However, repeated retests tend to weaken a level, not strengthen it. A decisive break below $80 opens continuation toward $64, and then the head and shoulders target near $59.
On the upside, strength does not return unless SOL reclaims $96, followed by $116 — the January fail-safe that now serves as the gateway to structural recovery. If $59 breaks, the next significant level on the 3-day chart sits near $41.
One catalyst could interrupt the bearish path. The Alpenglow upgrade — Solana’s most ambitious consensus overhaul targeting sub-second finality — is aiming for Q1 2026 mainnet deployment.
If details come in March, it could shift the narrative from memecoin chain to institutional-grade infrastructure.
March will likely be defined by whether $80 holds. Above it, expect choppy consolidation with ETF-driven bounces. Below it, the measured move toward $59–64 becomes the base case. Until holder behavior reverses, DEX activity stabilizes, and Alpenglow delivers, the path of least resistance stays down.

Bitcoin Cash price has recently dipped, triggering concerns of a broader bearish reversal. BCH slipped lower alongside the wider crypto market, testing short-term support zones. However, a broader macro view suggests the pullback may resemble a previous consolidation phase.
Historical patterns show similar volatility between October and November 2025. At that time, Bitcoin Cash formed a compression structure before staging a 28% rally. Current price behavior, combined with accumulation trends, indicates a comparable setup may be forming again.
Bitcoin Cash Holders Stick To Buying
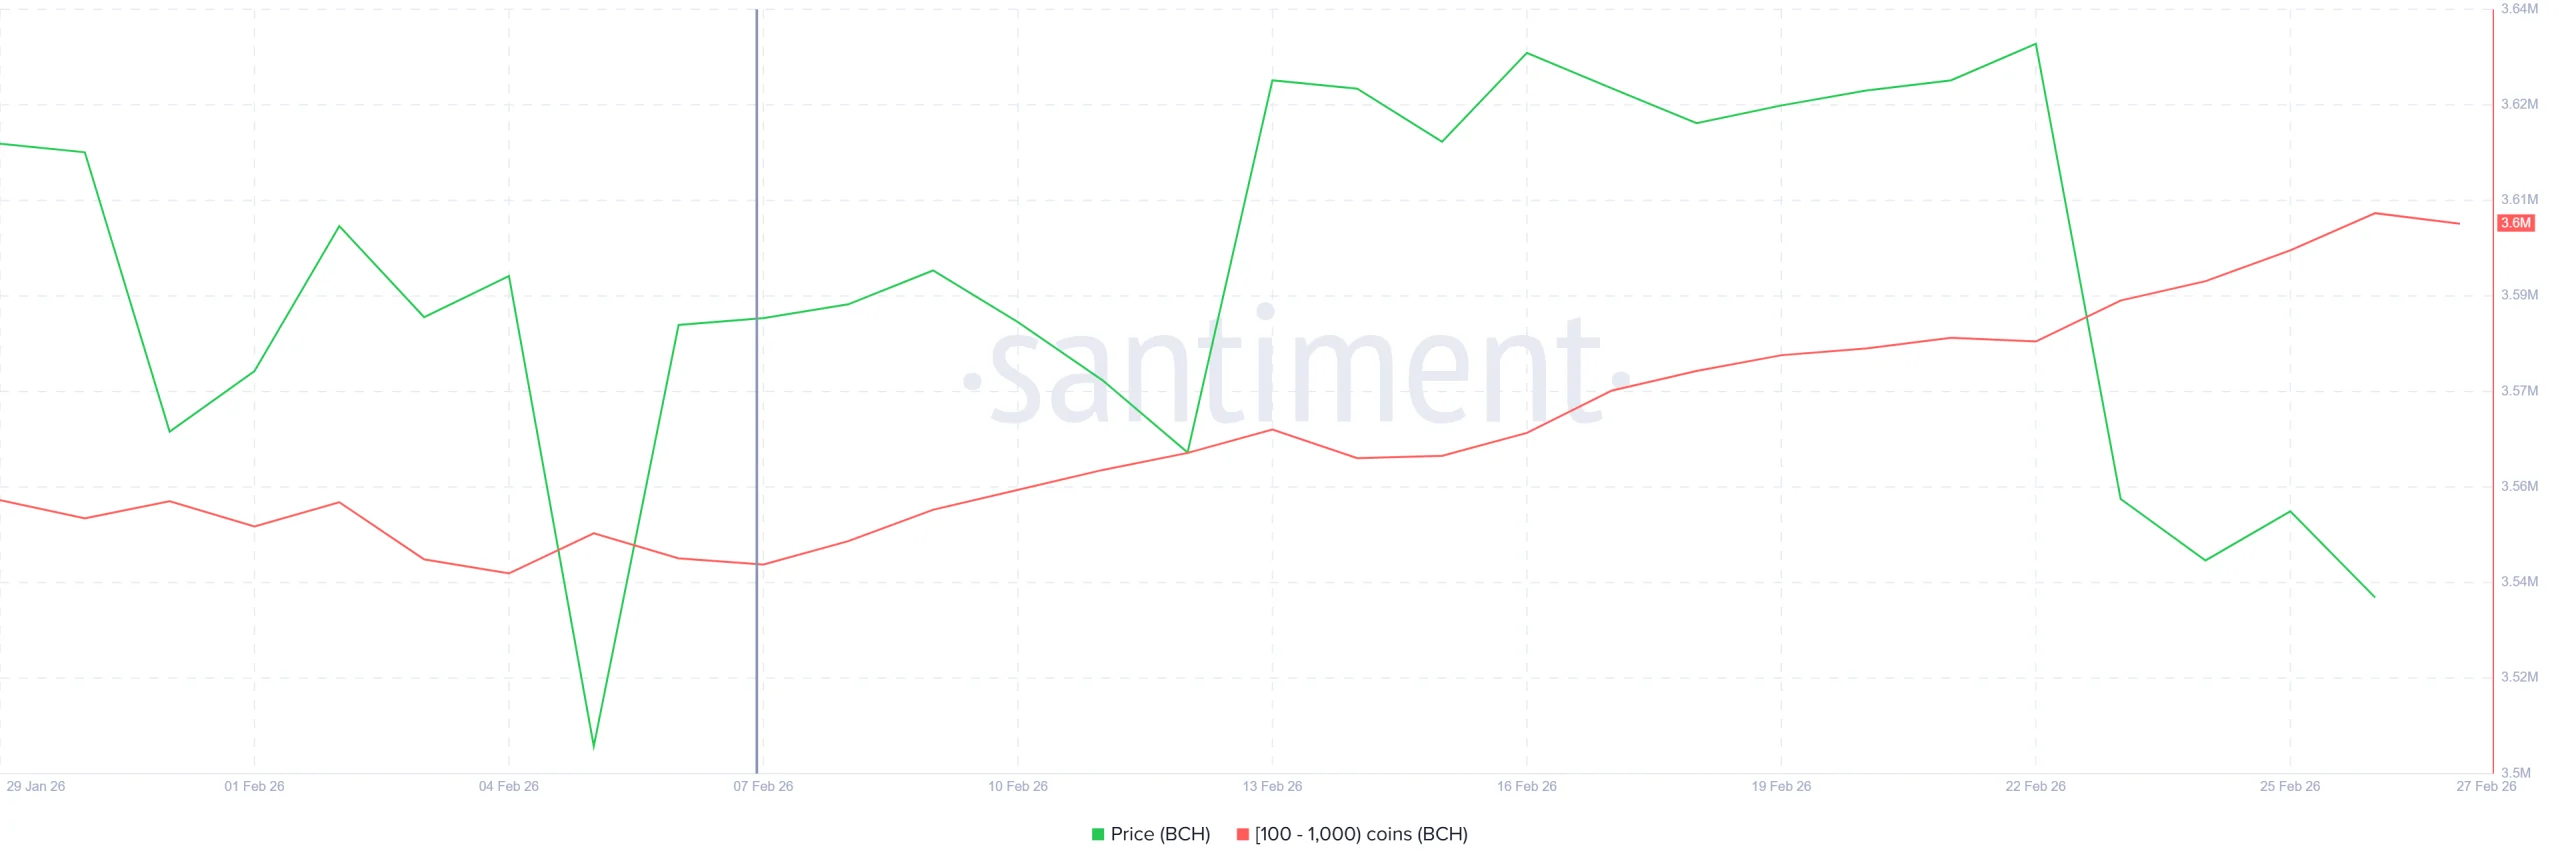
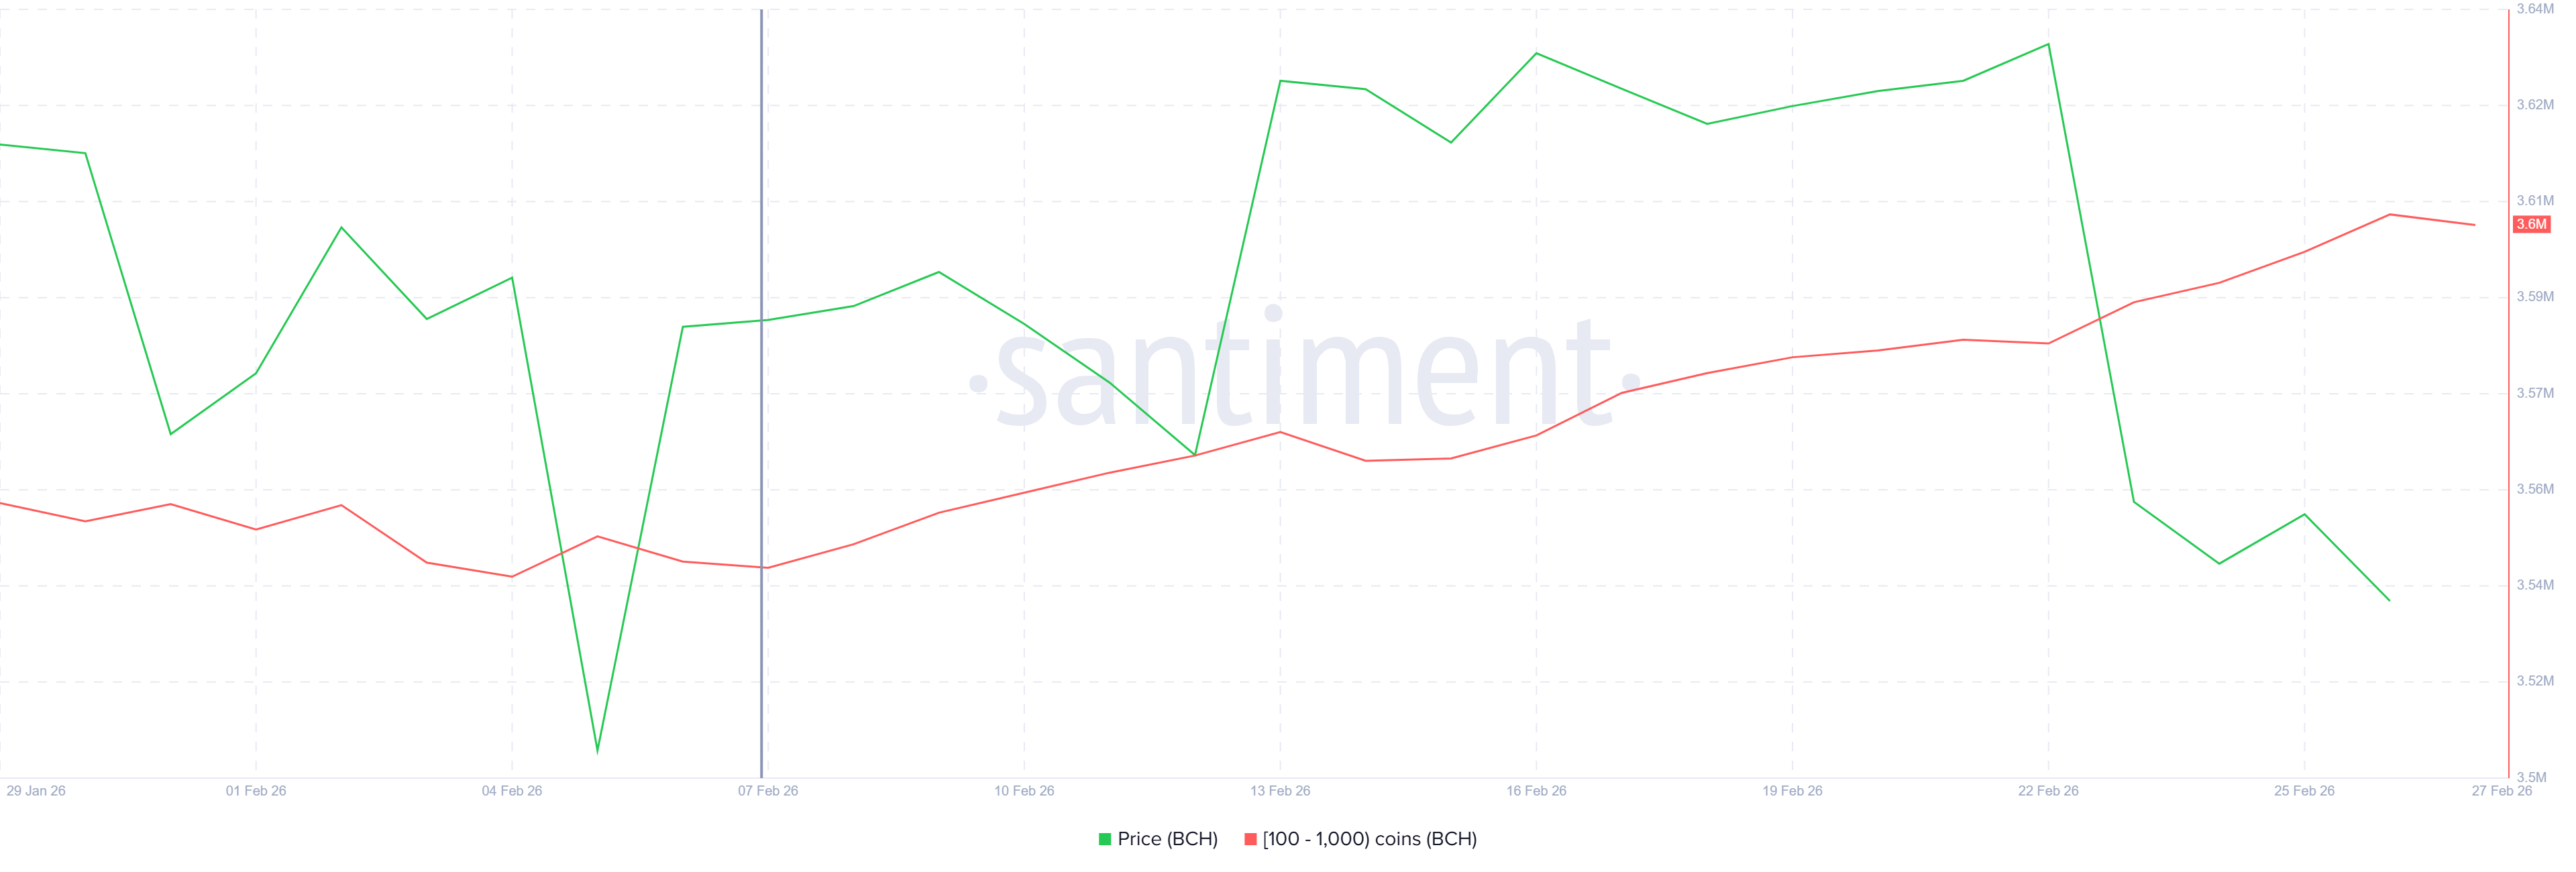
On-chain data shows steady accumulation among mid-sized holders. Over the past 20 days, addresses holding between 100 and 1,000 BCH accumulated approximately 60,000 BCH. At current prices, this equates to roughly $28.6 million in value.
These holders represent non-whale participants who often signal organic demand. Their accumulation during recent price weakness reflects resilience. Unlike speculative traders, this group tends to build positions gradually. Sustained buying from this cohort can provide structural support beneath the Bitcoin Cash price.
Want more token insights like this? Sign up for Editor Harsh Notariya’s Daily Crypto Newsletter here.
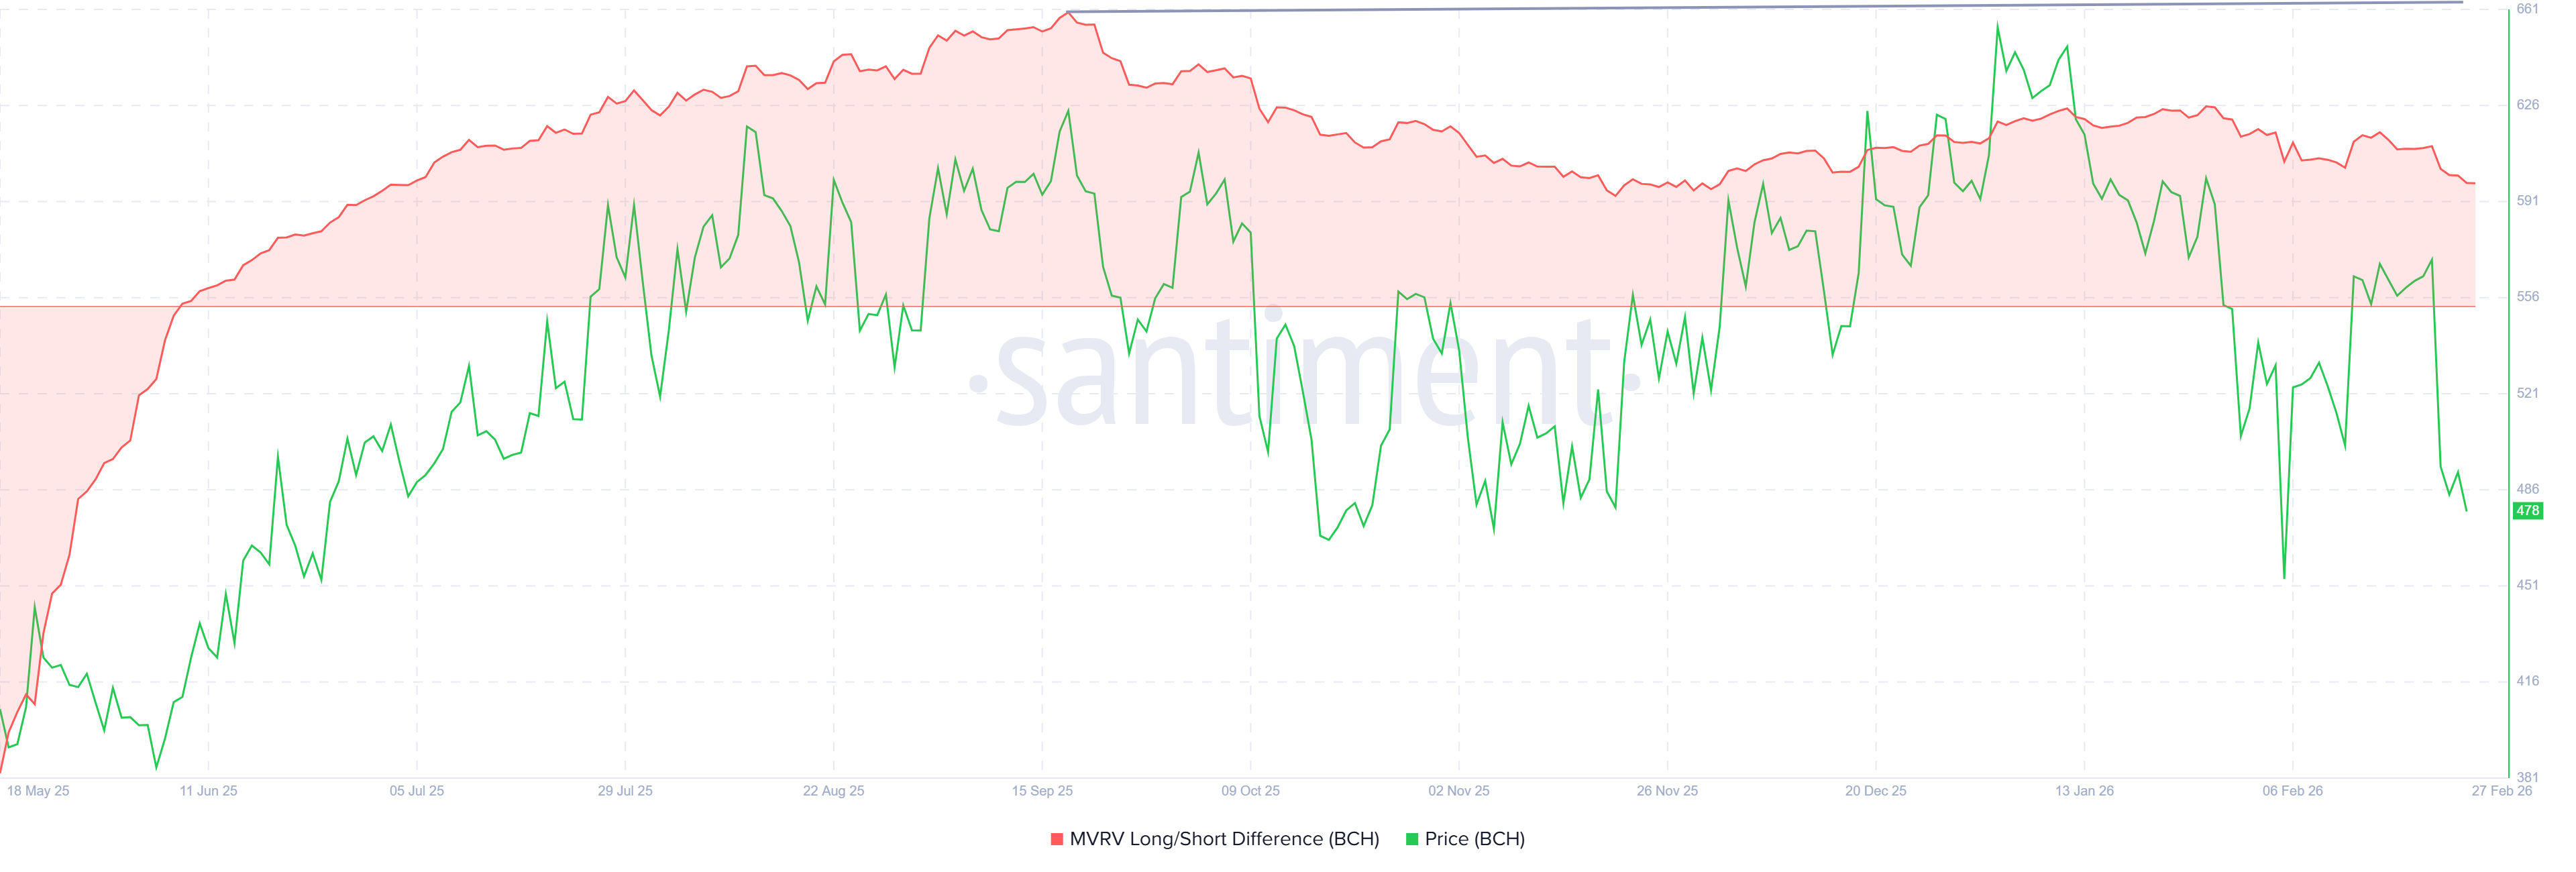
The MVRV Long/Short Difference metric adds further insight. The indicator currently sits in positive territory. Positive readings signal that long-term holders are more profitable than short-term holders.
This dynamic benefits Bitcoin Cash’s stability. Short-term holders often sell quickly at modest gains. Long-term holders typically retain positions during volatility. Their dominance can reduce immediate selling pressure and strengthen the foundation for a potential recovery phase.
BCH Price Is Copying Its Past
Bitcoin Cash is trading at $478 at the time of writing, consolidating within an asymmetrical triangle pattern. A similar structure formed between October and November 2025 before a significant rally. That breakout produced a 28% price increase after prolonged compression.
For BCH to replicate that move, the $479 support must hold. The 15% decline this week has strengthened the triangle pattern. A confirmed breakout above $540 would signal renewed bullish momentum. Such a move could mirror the previous rally setup.
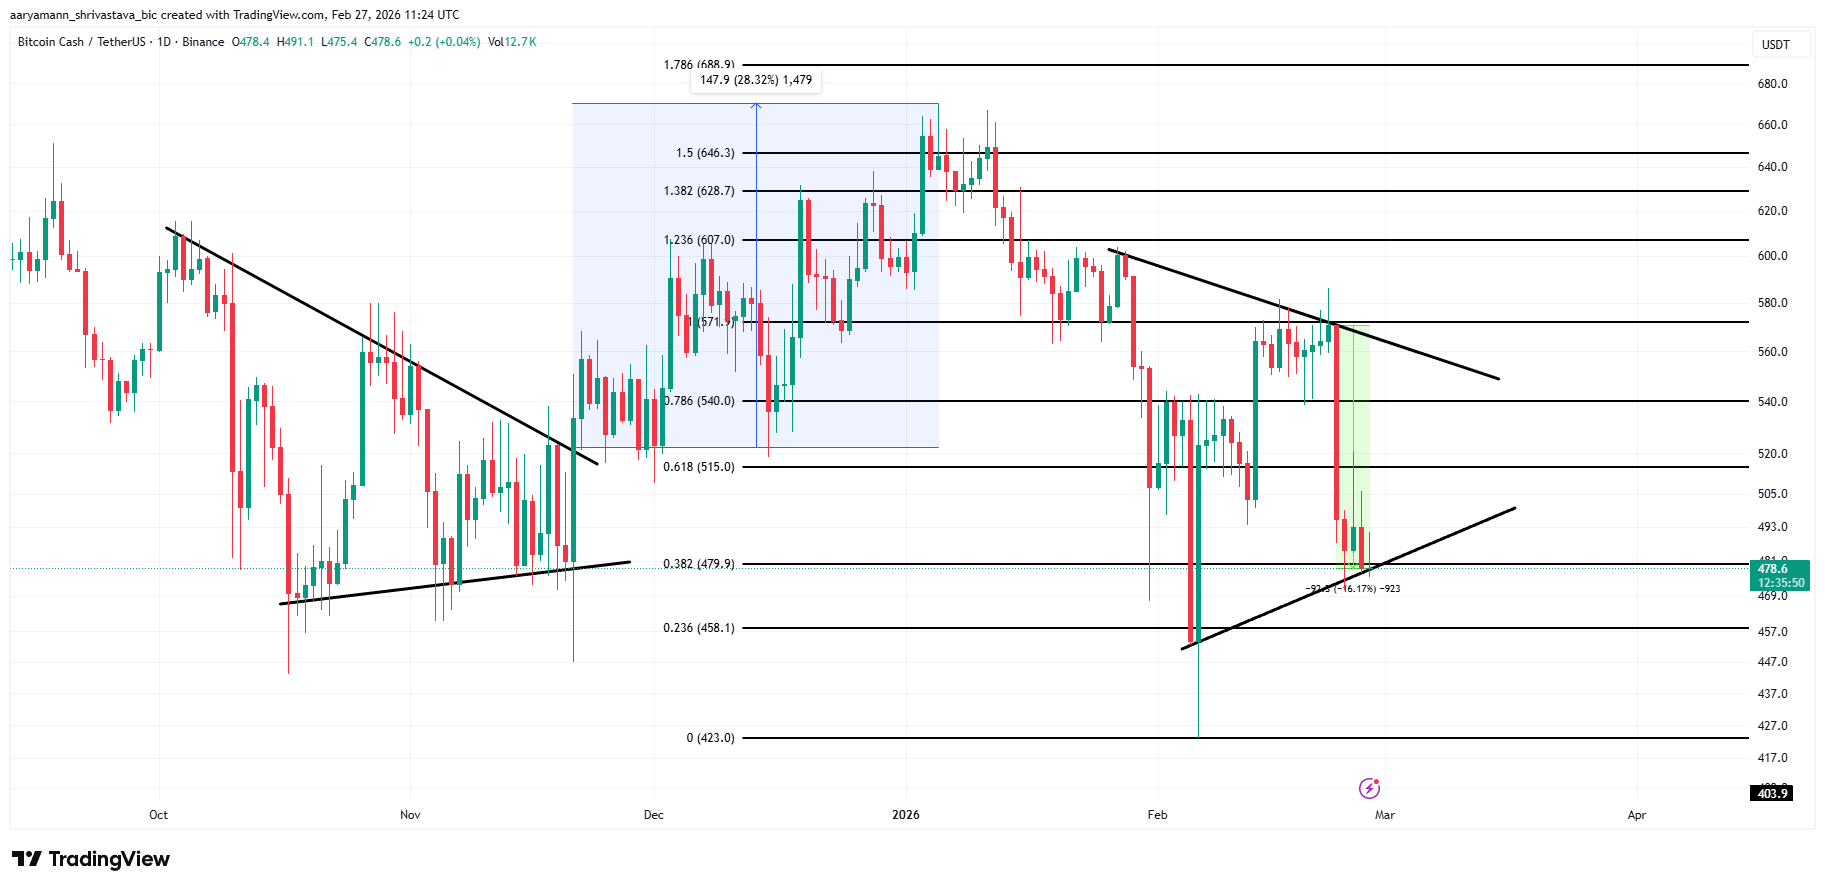
However, downside risk remains present. If sudden selling emerges, BCH could decline toward $458 support. Losing that level would weaken the bullish case. A sustained breakdown could push Bitcoin Cash toward $423, invalidating the recovery thesis and reinforcing bearish momentum.
Ethereum price is down about 1.4% over the past 24 hours, extending its broader weakness. At first glance, this looks like a routine pullback inside a consolidation phase. But this decline did not appear randomly. It came right after a warning signal flashed on the daily chart, suggesting the recent recovery may already be losing steam.
What makes this moment unusual is the reaction from traders. Instead of reducing risk, leveraged long positions have surged past $1 billion. This creates a dangerous contradiction. The same conditions that are warning of a deeper drop are also attracting aggressive bullish bets. This disconnect could now decide Ethereum’s next major move.
Bearish Divergence And Supply Cluster Are Now Pointing To The Same Risk
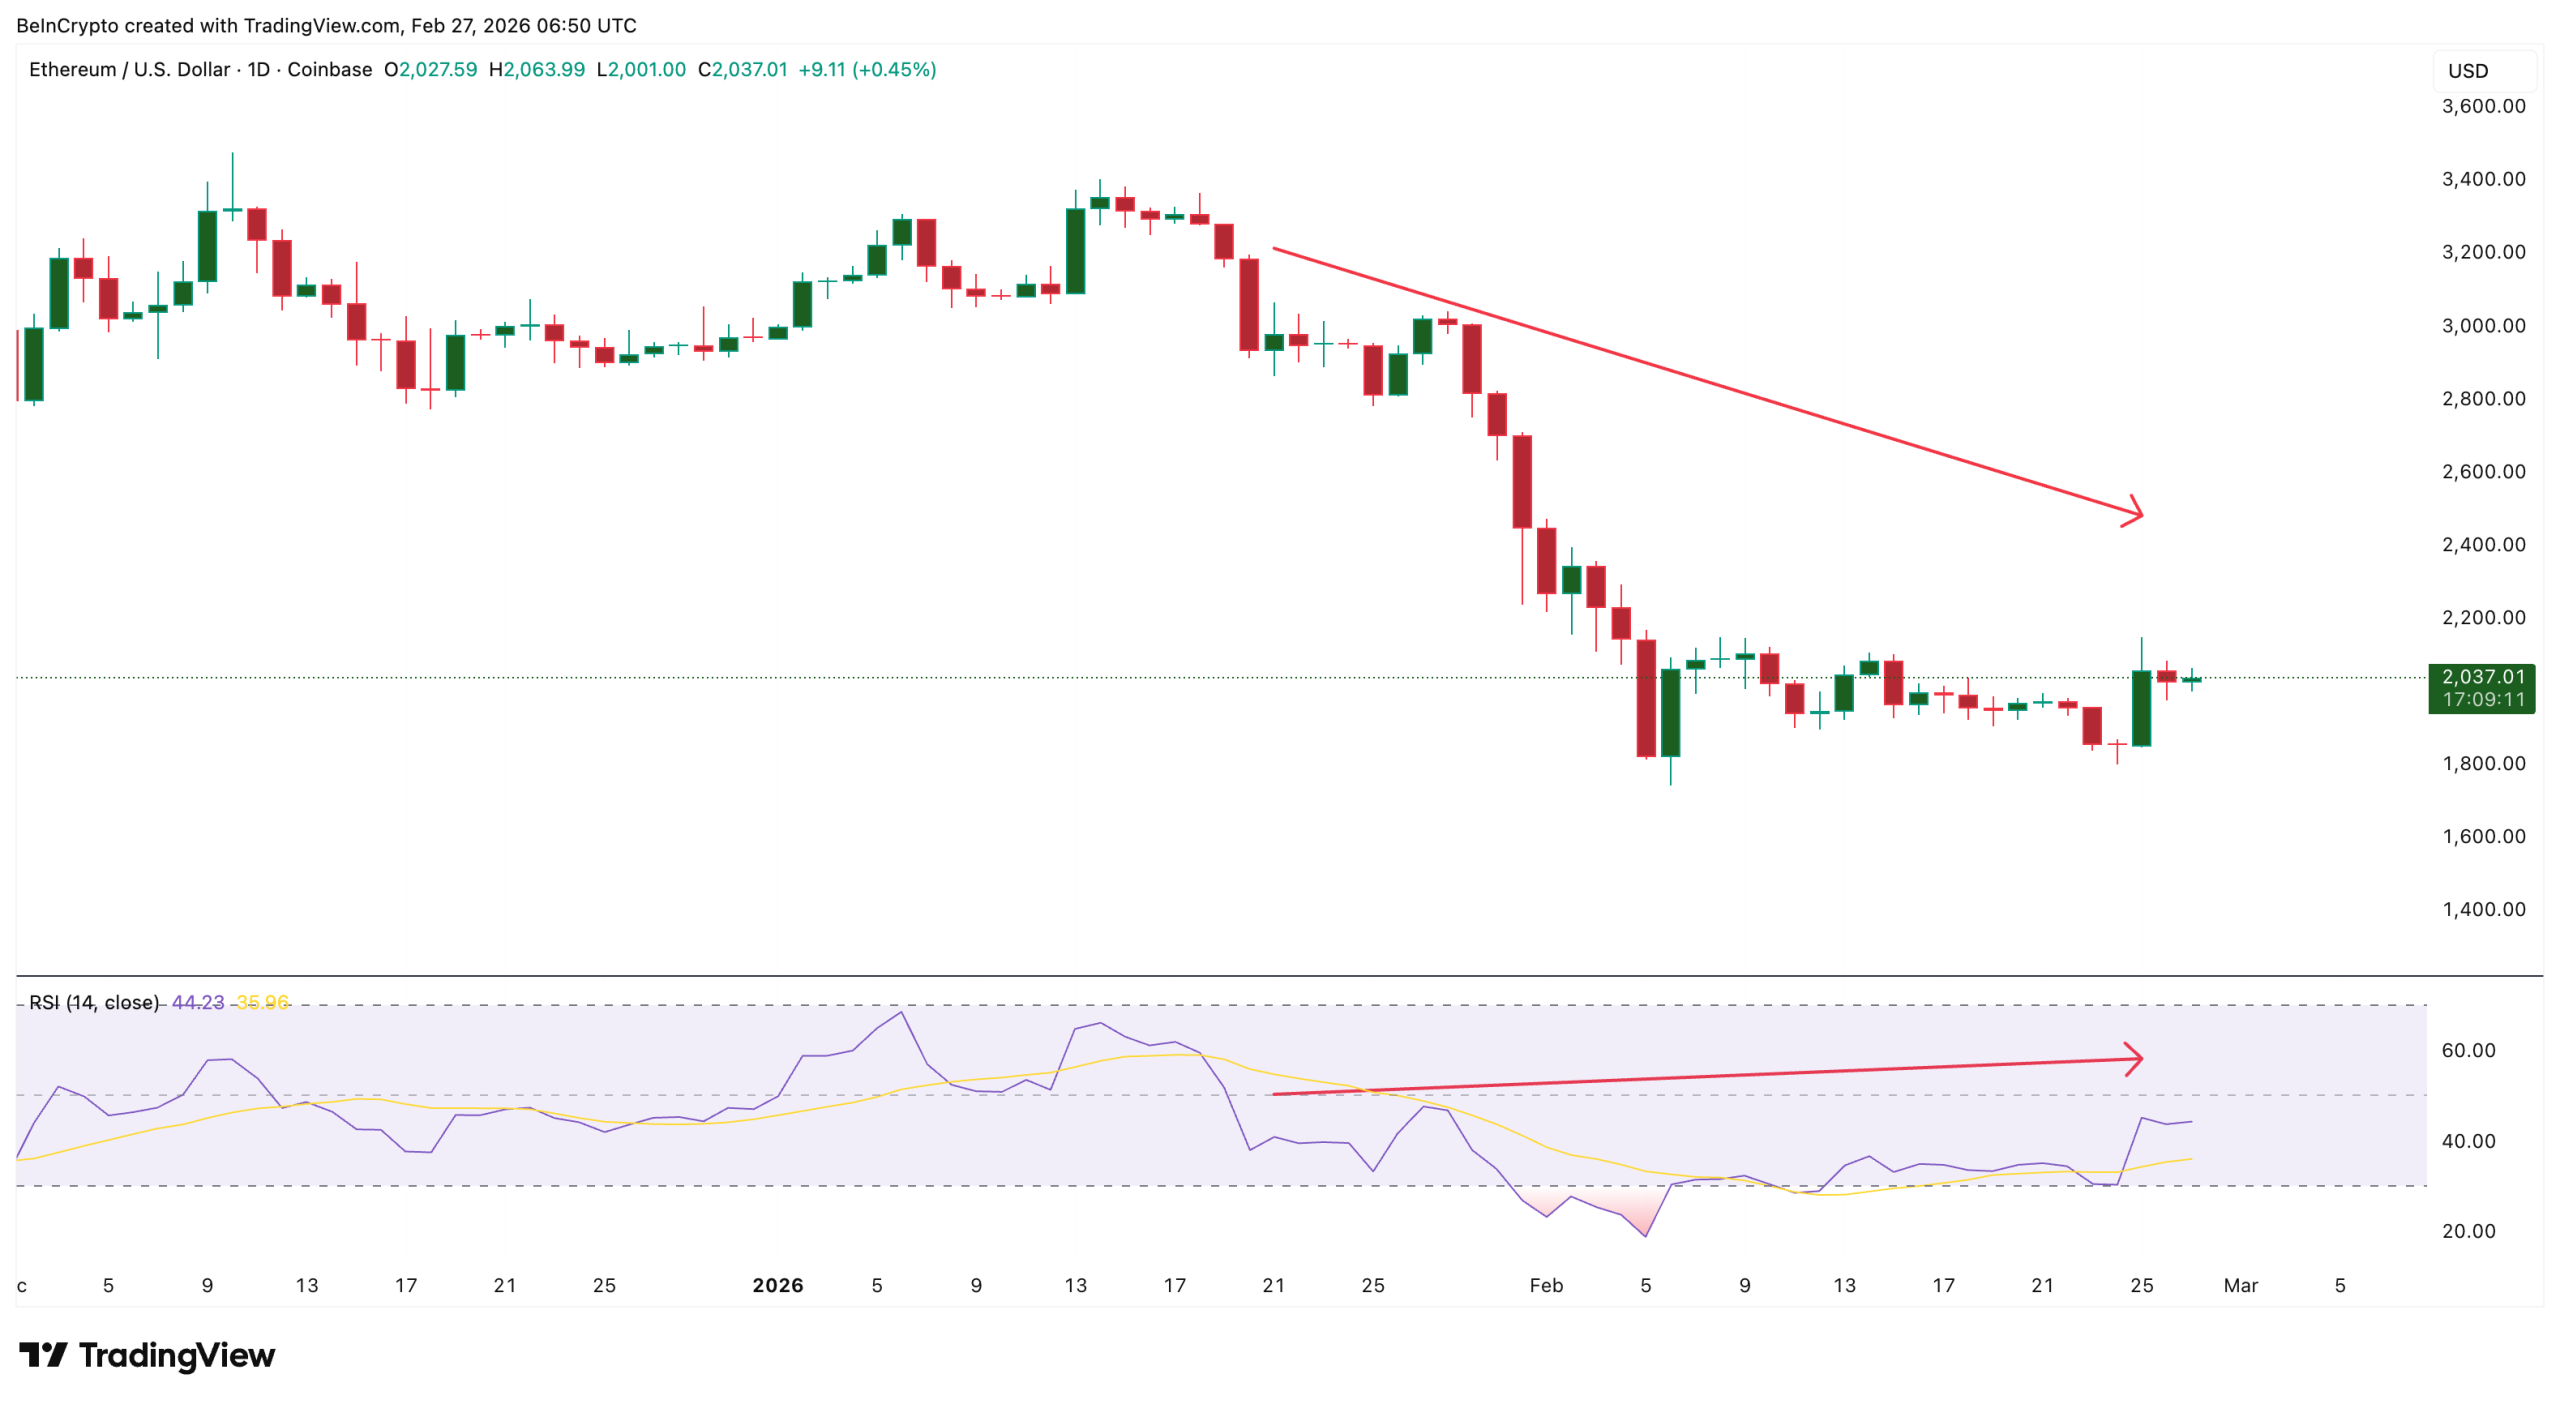
The first warning sign appeared through a hidden bearish divergence on the daily chart. Between January 21 and February 25, the Ethereum price formed a lower high. This means the recent recovery was weaker than the previous rally, confirming the broader downtrend remains intact.
At the same time, the Relative Strength Index (RSI), which measures momentum strength, formed a higher high. This creates a hidden bearish divergence. This pattern usually appears during downtrends and signals that the recovery is only temporary, with the larger decline likely to continue.

Want more token insights like this? Sign up for Editor Harsh Notariya’s Daily Crypto Newsletter here.
This signal becomes more important because Ethereum is already down about 32% over the past 30 days. That confirms the broader structure remains bearish. Now, on-chain data shows where this pullback could accelerate.
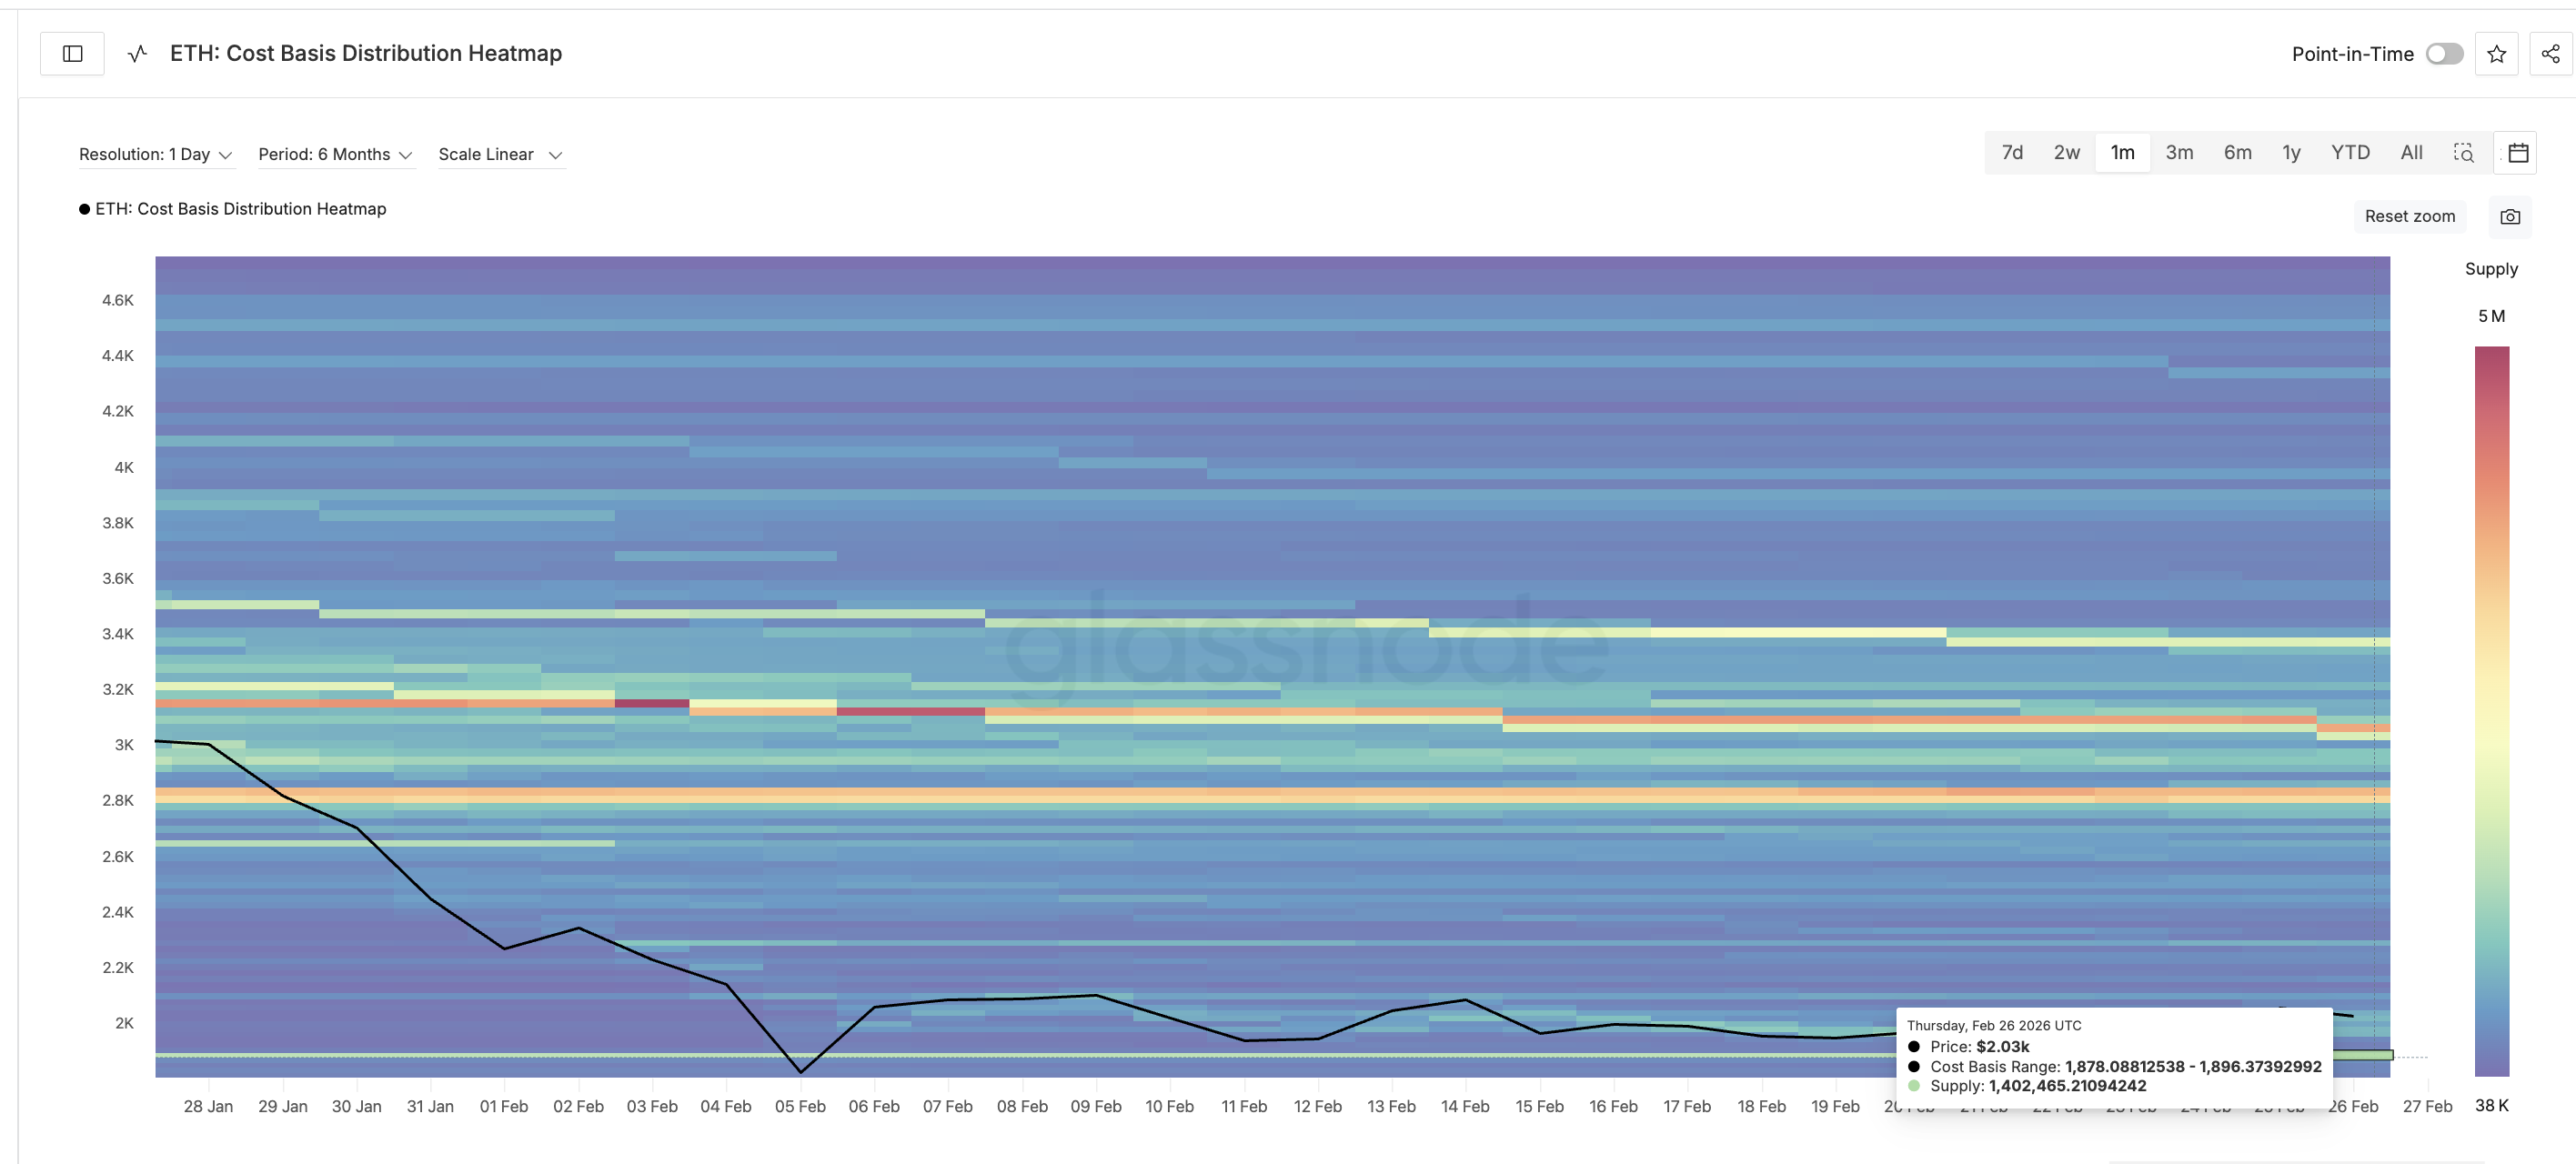
The Ethereum cost basis heatmap reveals a major support cluster between $1,870 and $1,890. Around 1.40 million ETH was accumulated in this range. This level is important because it represents the average buying zone for a large group of holders.
These holders are still in profit at current prices. But if Ethereum falls into this zone while fear increases, many may sell to protect their gains. This could weaken support and allow the pullback to deepen.
This makes the divergence warning more dangerous as a key support lies nearby.
Whale Selling And $1 Billion Long Exposure Create A Dangerous Conflict
At the same time, large holders are starting to show caution.
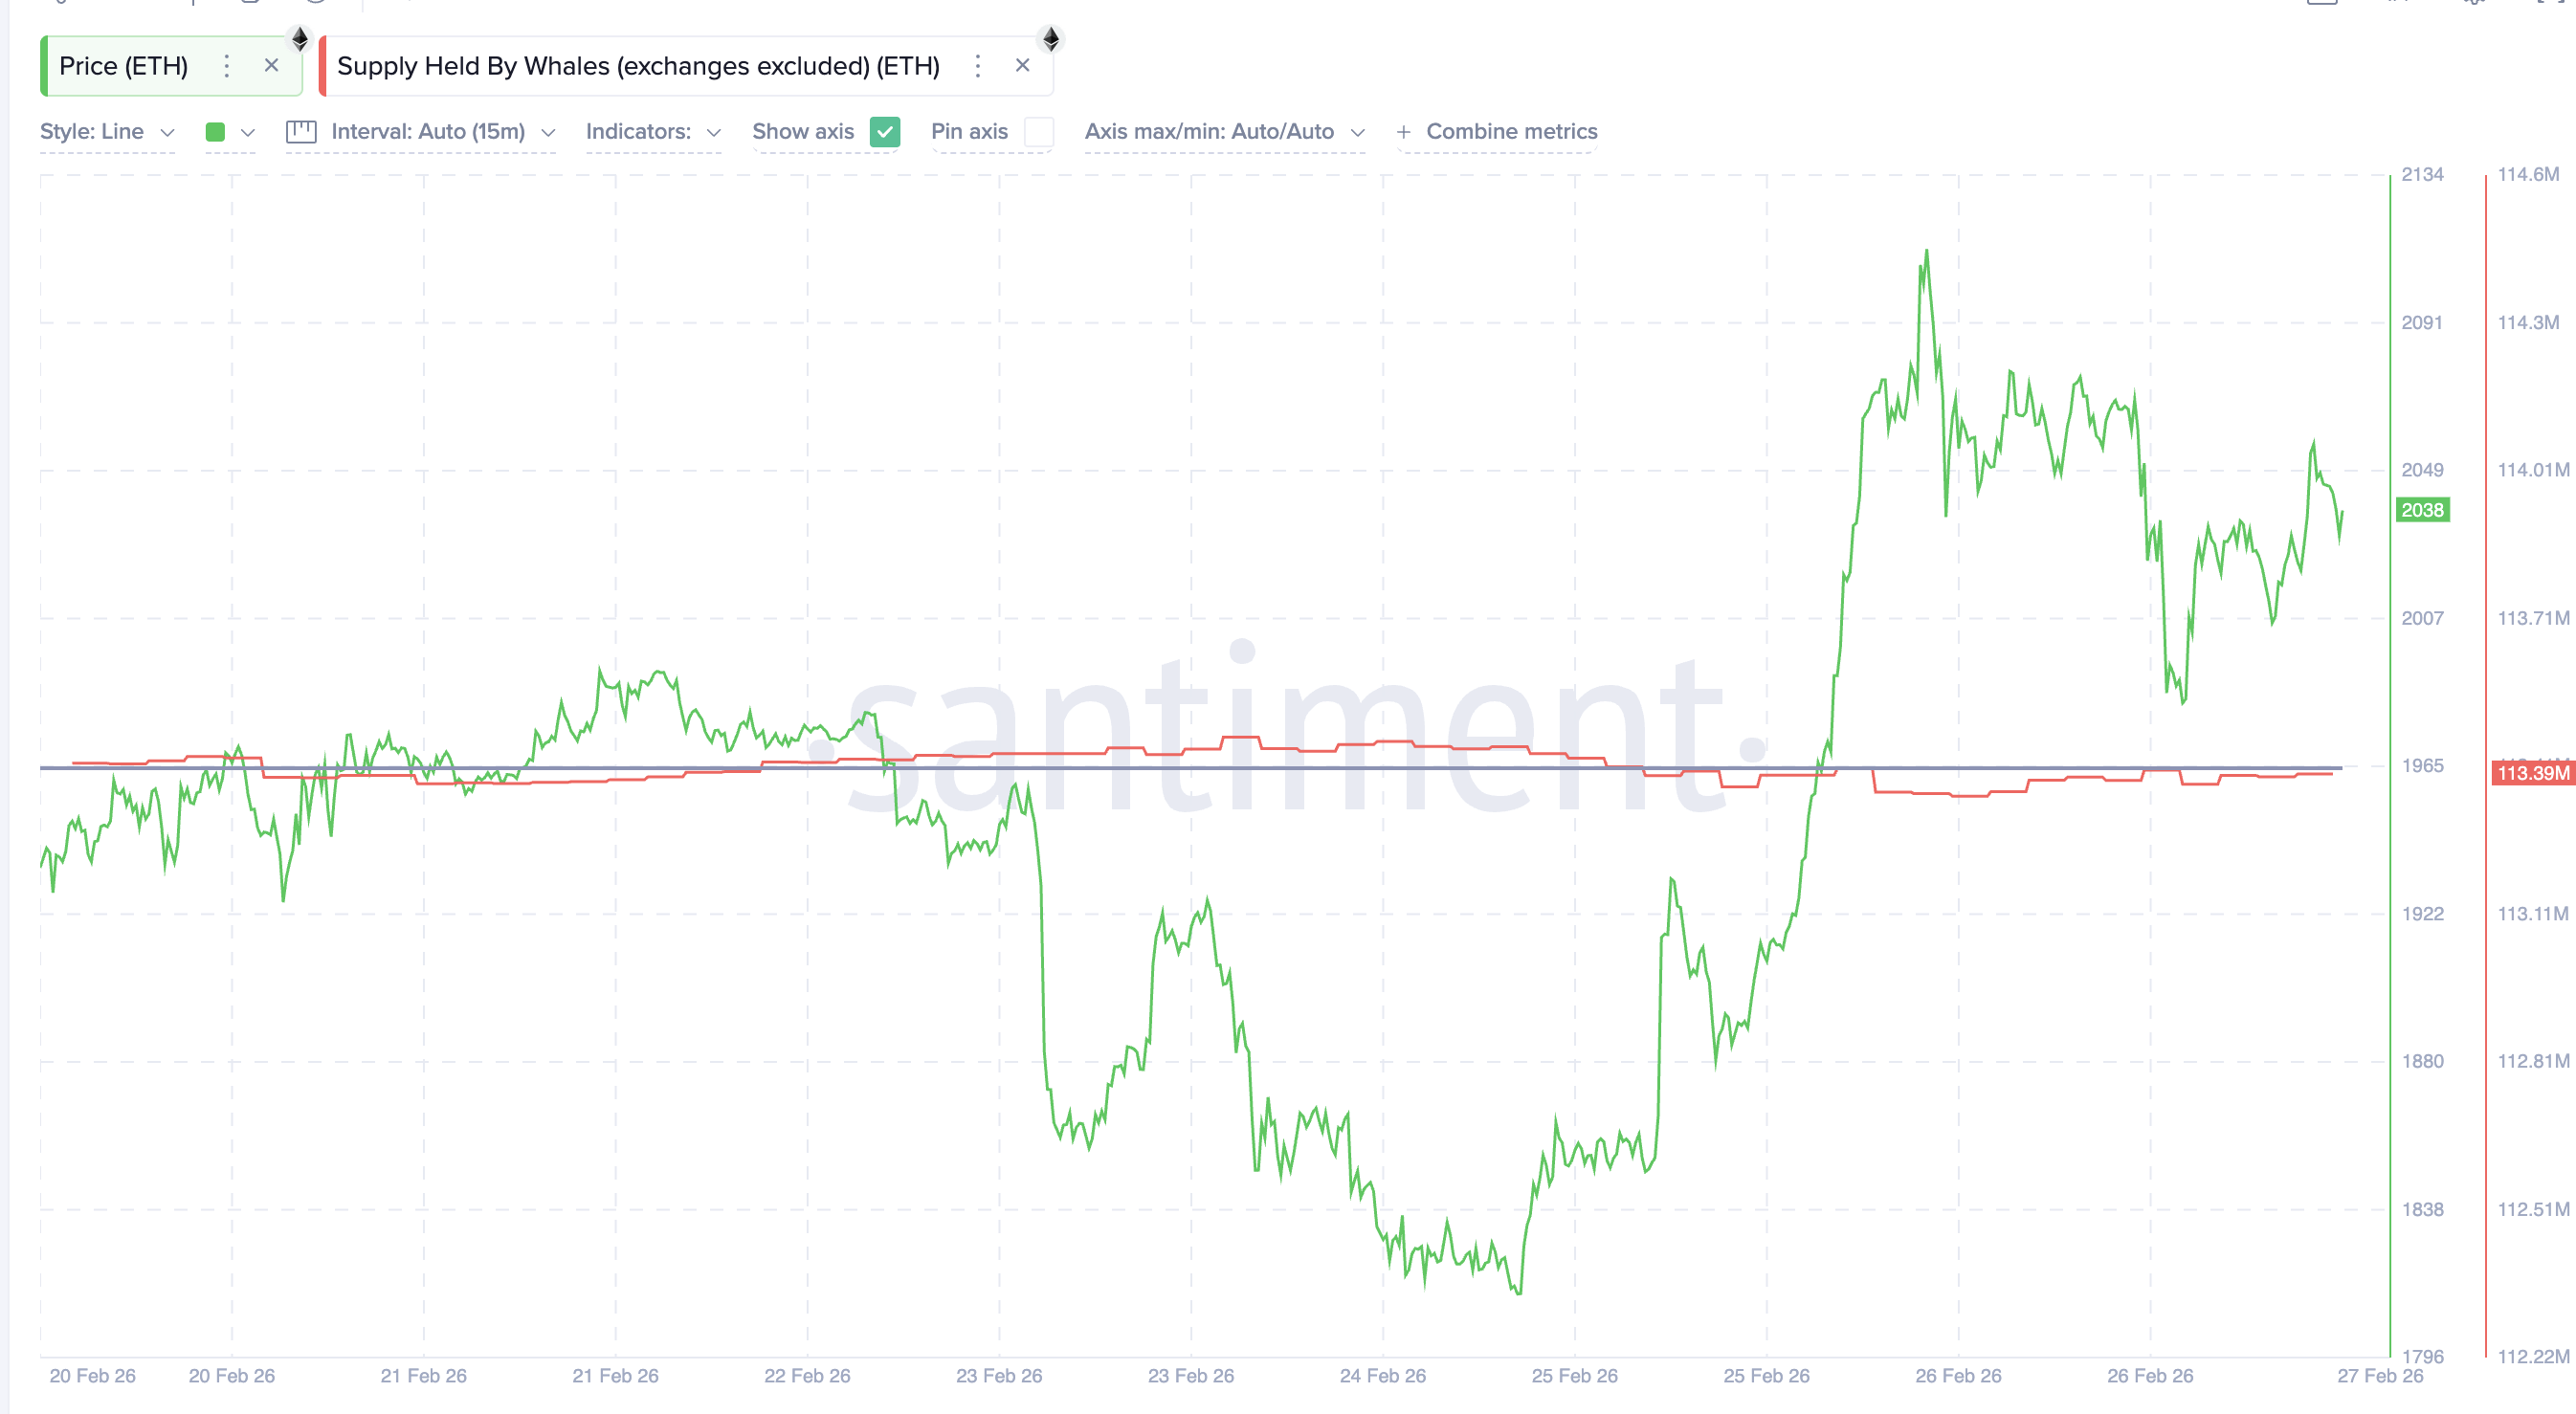
Ethereum supply held by whales has dropped slightly from 113.41 million ETH on February 25 to 113.39 million ETH now. This is not a large drop, somewhere in the $40 million range, but it confirms that whales are no longer aggressively accumulating.
This matters because whale activity often signals future price direction. When whales stop buying or begin selling, it weakens market confidence. But derivatives traders are reacting in the opposite way.
Binance liquidation data shows cumulative long leverage has crossed $1 billion. Short leverage, in comparison, sits near $382 million. This means long exposure is nearly three times higher. Even more importantly, nearly $697 million of long leverage is concentrated near $1,870. Per the map, the risk starts developing if the ETH price drops under $2,015.
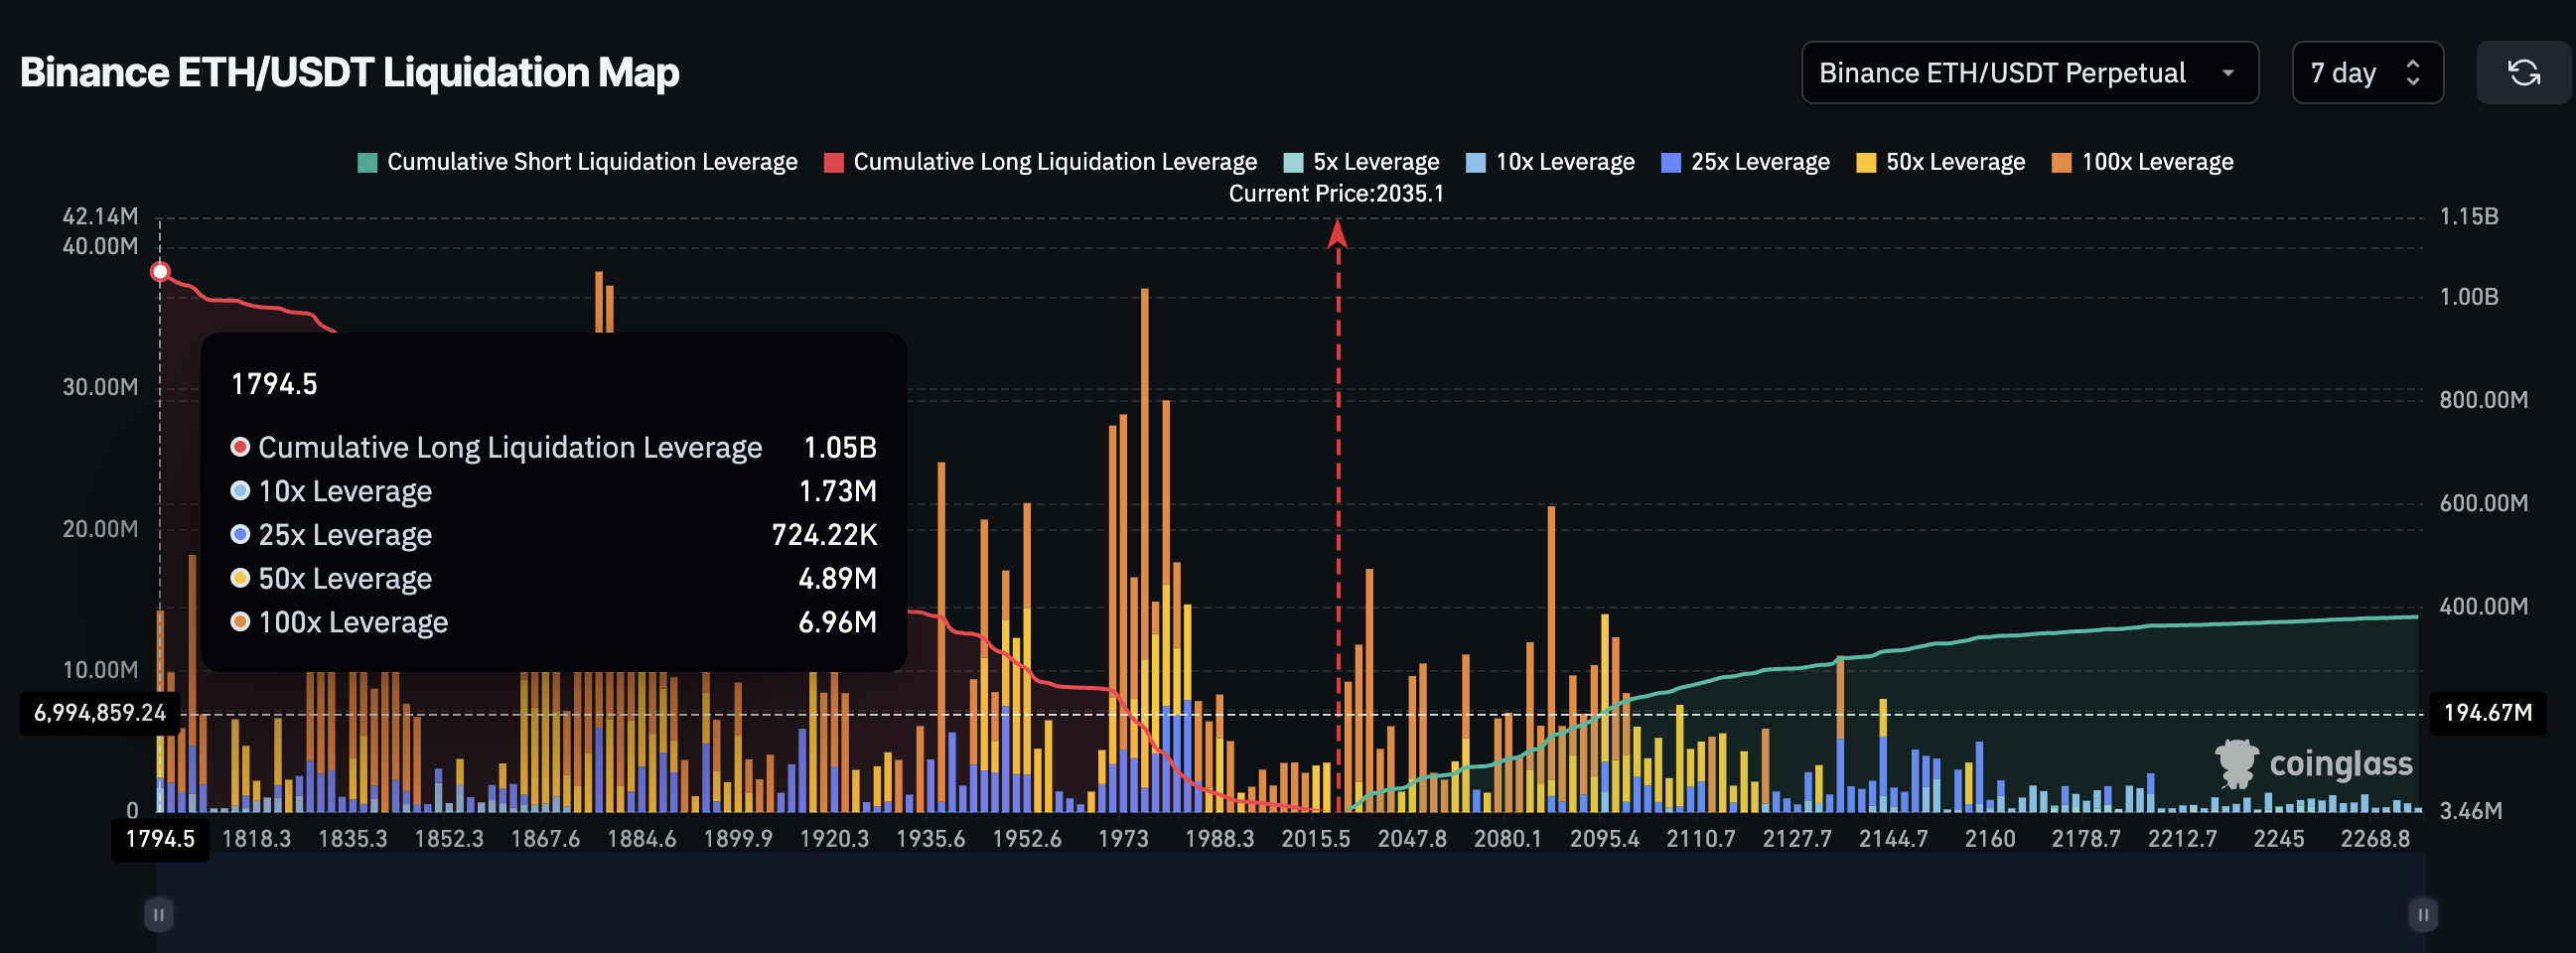
This level aligns almost perfectly with the cost basis cluster starting near $1,870. This creates a high-risk situation.
If Ethereum falls into this zone, holders may begin selling while leveraged long positions are forced to close. These forced liquidations would push the price even lower and accelerate the correction. That risk could be the reason why whales have stepped back, for now.
But despite these risks, traders are still betting on a breakout. The reason becomes clear in Ethereum’s price structure itself.
Ethereum Price Structure Explains Both The $2,600 Hope And The Breakdown Risk
Ethereum’s recent price structure is creating the optimism that derivatives traders are betting on. On the 8-hour chart, Ethereum is forming a cup and handle pattern. This is a bullish structure that often appears before upward breakouts.
The handle is forming now as a consolidation phase, something that the traders might be considering as a lull before the breakout.
The neckline of this pattern is sloping upward. An upward-sloping neckline strengthens breakout expectations, provided the price can break past key resistance levels. The critical ones are now revealed by the technical projections.
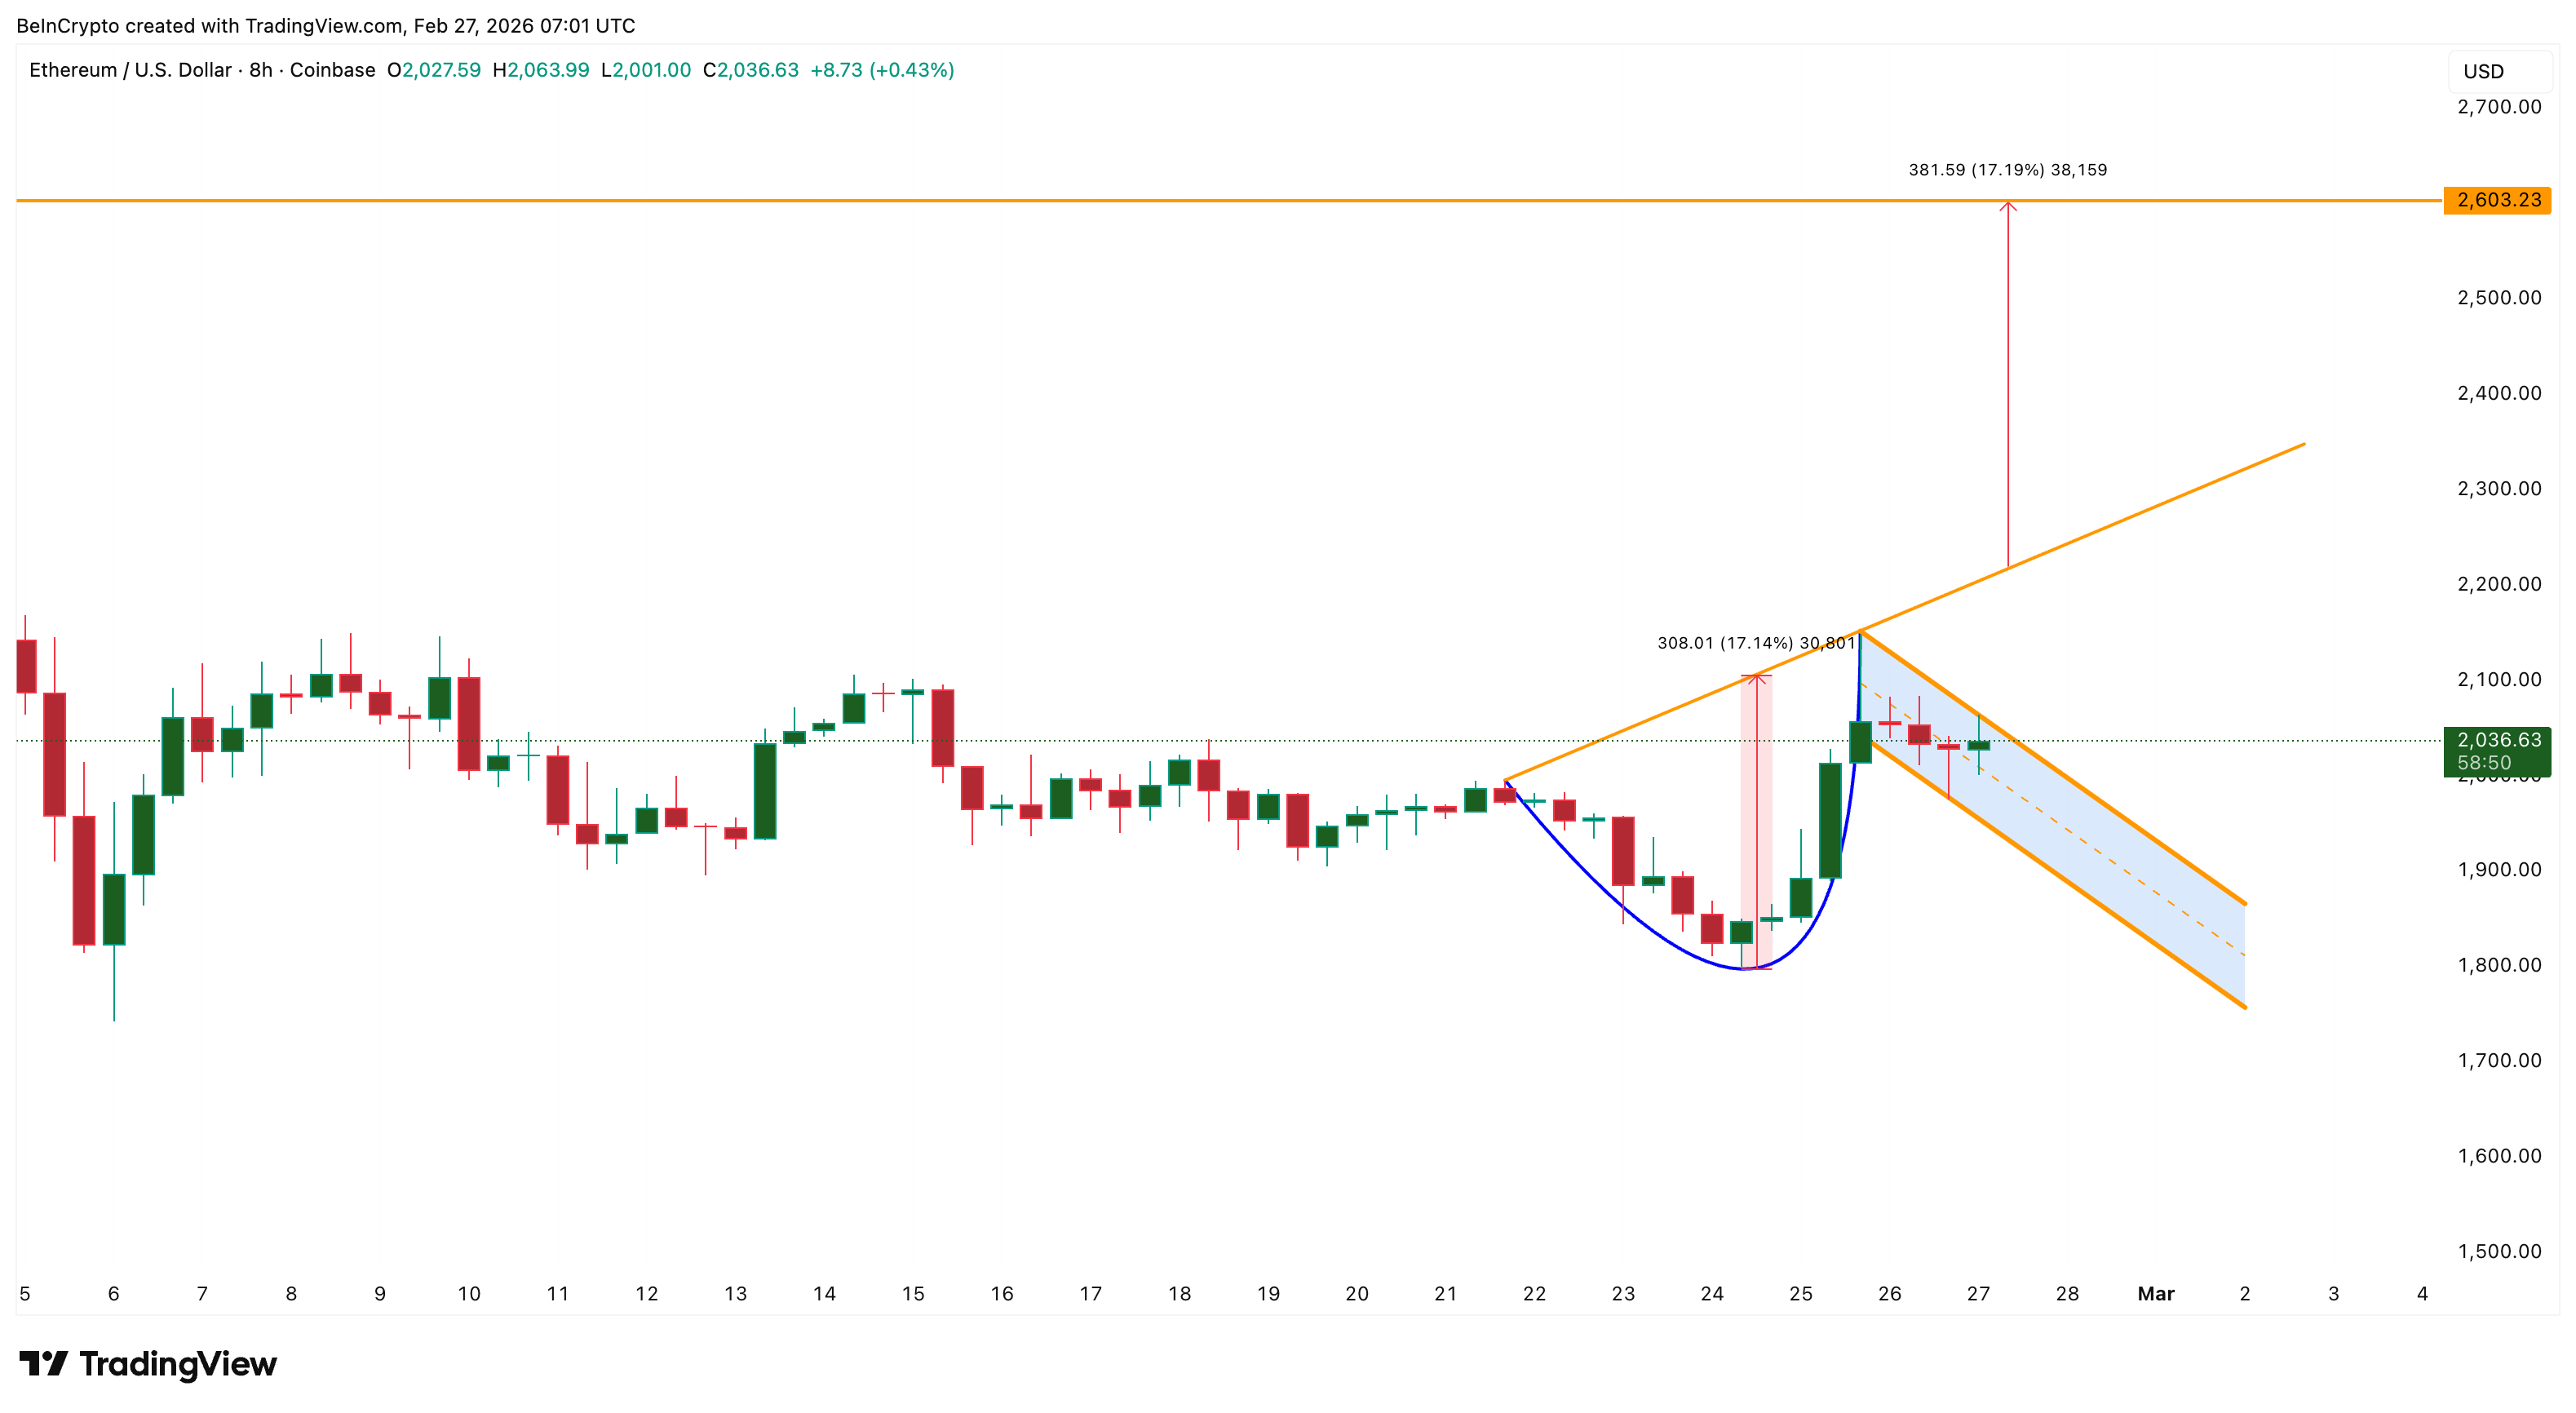
If Ethereum breaks above $2,140, the pattern breakout hopes rise. While the neckline will still be at a distance, the hopes of a 17% rally toward $2,600 would surface. This upside potential possibly explains why traders continue opening long positions despite growing warning signs.
But this optimism depends entirely on Ethereum holding its support levels. If Ethereum falls below $1,990, weakness begins increasing, although the pattern still survives.
A drop below $1,890 would become much more serious. This level sits directly at the top of the cost basis cluster between $1,870 and $1,890. Losing this zone would weaken holder confidence and expose Ethereum to a deeper decline.
Below $1,820, the bullish structure would begin failing. If Ethereum falls below $1,790, the cup and handle pattern would be invalidated completely. This would remove the bullish setup and could trigger large-scale long liquidations.
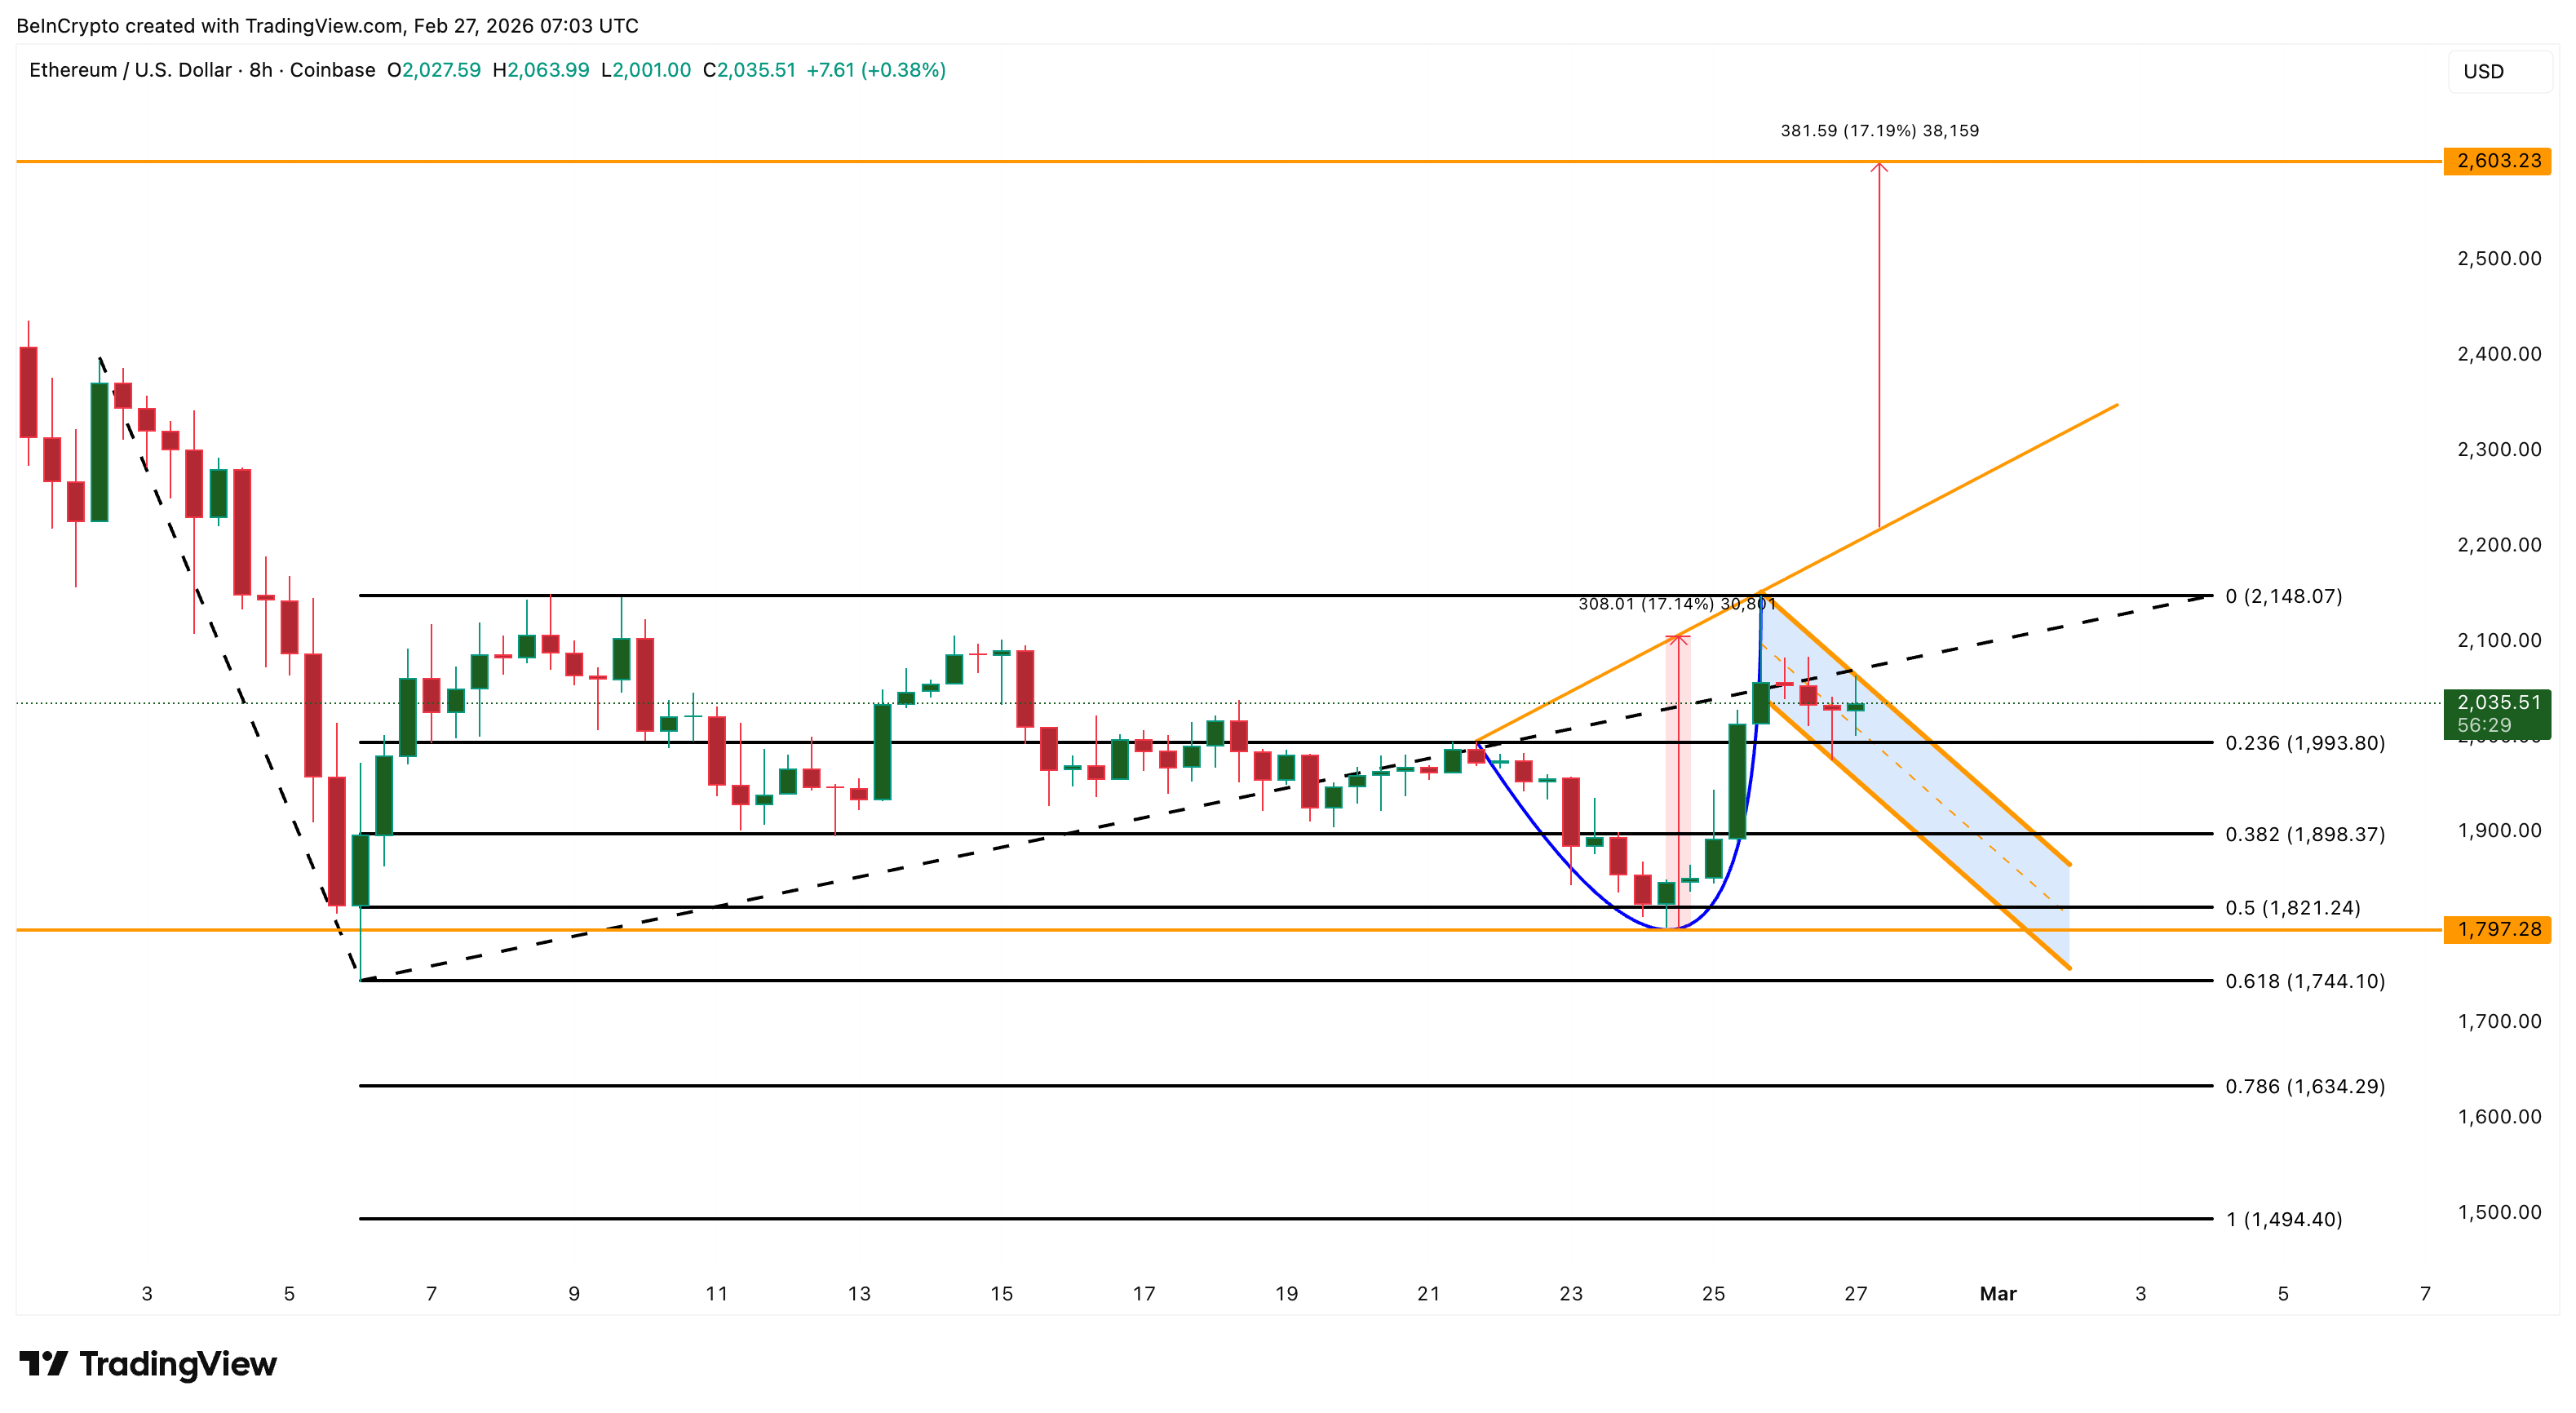
That is why the same price structure attracting $1 billion in bullish bets is also sitting directly above the most dangerous breakdown zone. Recovery is still possible. But Ethereum must break above $2,140 first. Until then, Ethereum remains stuck between breakout hope and breakdown risk.


January’s PPI (Producer Price Index) printed +2.9% year-over-year (YoY) against a +2.6% forecast, with core PPI surging +3.6% versus +3.0% expected, sending US equities lower and reviving stagflation talk across crypto and macro communities.
The Producer Price Index measures wholesale-level inflation. This is what businesses pay before costs pass through to consumers, making it a leading signal for Federal Reserve (Fed) policy decisions.
Why it matters:
- Services prices drove the core beat, with month-over-month core PPI rising +0.8% against a +0.3% forecast, more than double expectations.
- The S&P 500 fell -0.87%, the Dow Jones dropped -1.38%, and the Nasdaq slid -1.09% following the release, reflecting immediate repricing of rate-cut expectations.
- A hotter-than-expected PPI reduces the probability of near-term Fed cuts, lifting yields and pressuring risk assets, including Bitcoin (BTC) and altcoins.
- Rising producer costs alongside slowing GDP growth creates a stagflation scenario where the Fed cannot cut without reigniting inflation or hold without slowing the economy further.
The details:
- Headline PPI came in at +2.9% YoY (prior: +3.0%); core PPI at +3.6% YoY (prior: +3.3%), per data released February 27 at 8:30 AM ET.
- Month-over-month: headline +0.5% (exp. +0.3%), core +0.8% (exp. +0.3%), driven by a services component surge.
- Trade services margins climbed +2.5% as a primary driver of the core beat.
- S&P 500 futures were already down 57 points before the data hit, signaling broader stress beyond the PPI print alone.
- The upside came from trade-services normalization, not from broad input-cost acceleration.
The big picture:
- Analysts like Crypto Rover and Max Crypto flag a stagflation signal: core PPI rising while GDP cools. This combination often limits central bank flexibility.
- The Fed’s rate-cut timeline faces further pressure as back-to-back inflation beats challenge the disinflation trend heading into March.

Terra Luna Classic (LUNC) price lacked clear direction for weeks before staging a sharp three-day rally. The sudden surge pushed the token up nearly 30% at its intraday peak. However, technical and on-chain signals suggest the breakout may struggle to sustain momentum.
The broader crypto market has experienced periodic bursts of volatility. LUNC’s recent move stands out due to its speed rather than structural strength. While price action turned briefly bullish, underlying metrics indicate caution is warranted.
Bitcoin – The Cause Of LUNC’s Rise
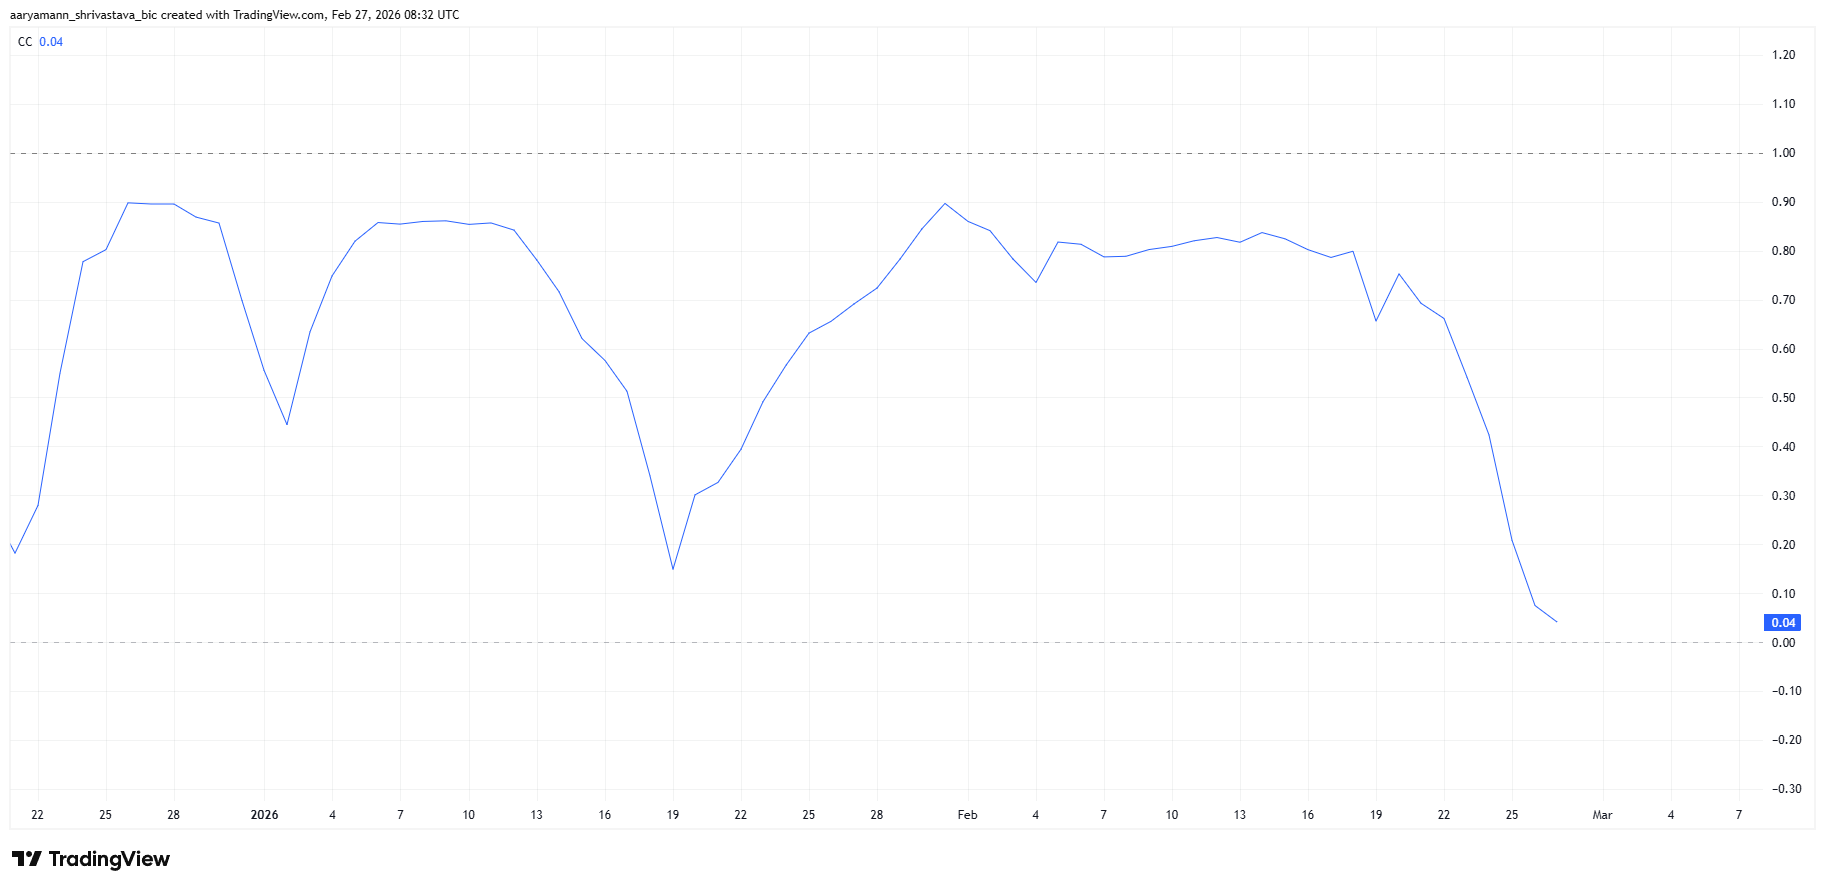
The primary catalyst behind LUNC’s rally was a surge in trading volume. Increased speculative activity drove short-term price acceleration. At the same time, LUNC’s correlation with Bitcoin dropped to 0.04, signaling near-complete decoupling.
Such low correlation suggests the token temporarily moved independently of BTC. Decoupling phases can attract traders seeking isolated momentum plays. However, similar patterns have appeared across several altcoins recently. These shifts often reflect short-lived speculative rotations rather than lasting structural change.
Want more token insights like this? Sign up for Editor Harsh Notariya’s Daily Crypto Newsletter here.
LUNC Is Trapped Under Bearish Pressure
The Chaikin Money Flow indicator reveals a concerning divergence. Despite rising prices over the past three days, CMF did not confirm sustained inflows. Capital entering the market remained subdued relative to price movement.
A bearish divergence formed as price climbed while CMF weakened. This pattern indicates that buying pressure failed to match the rally’s strength. Outflows continued quietly beneath the surface.
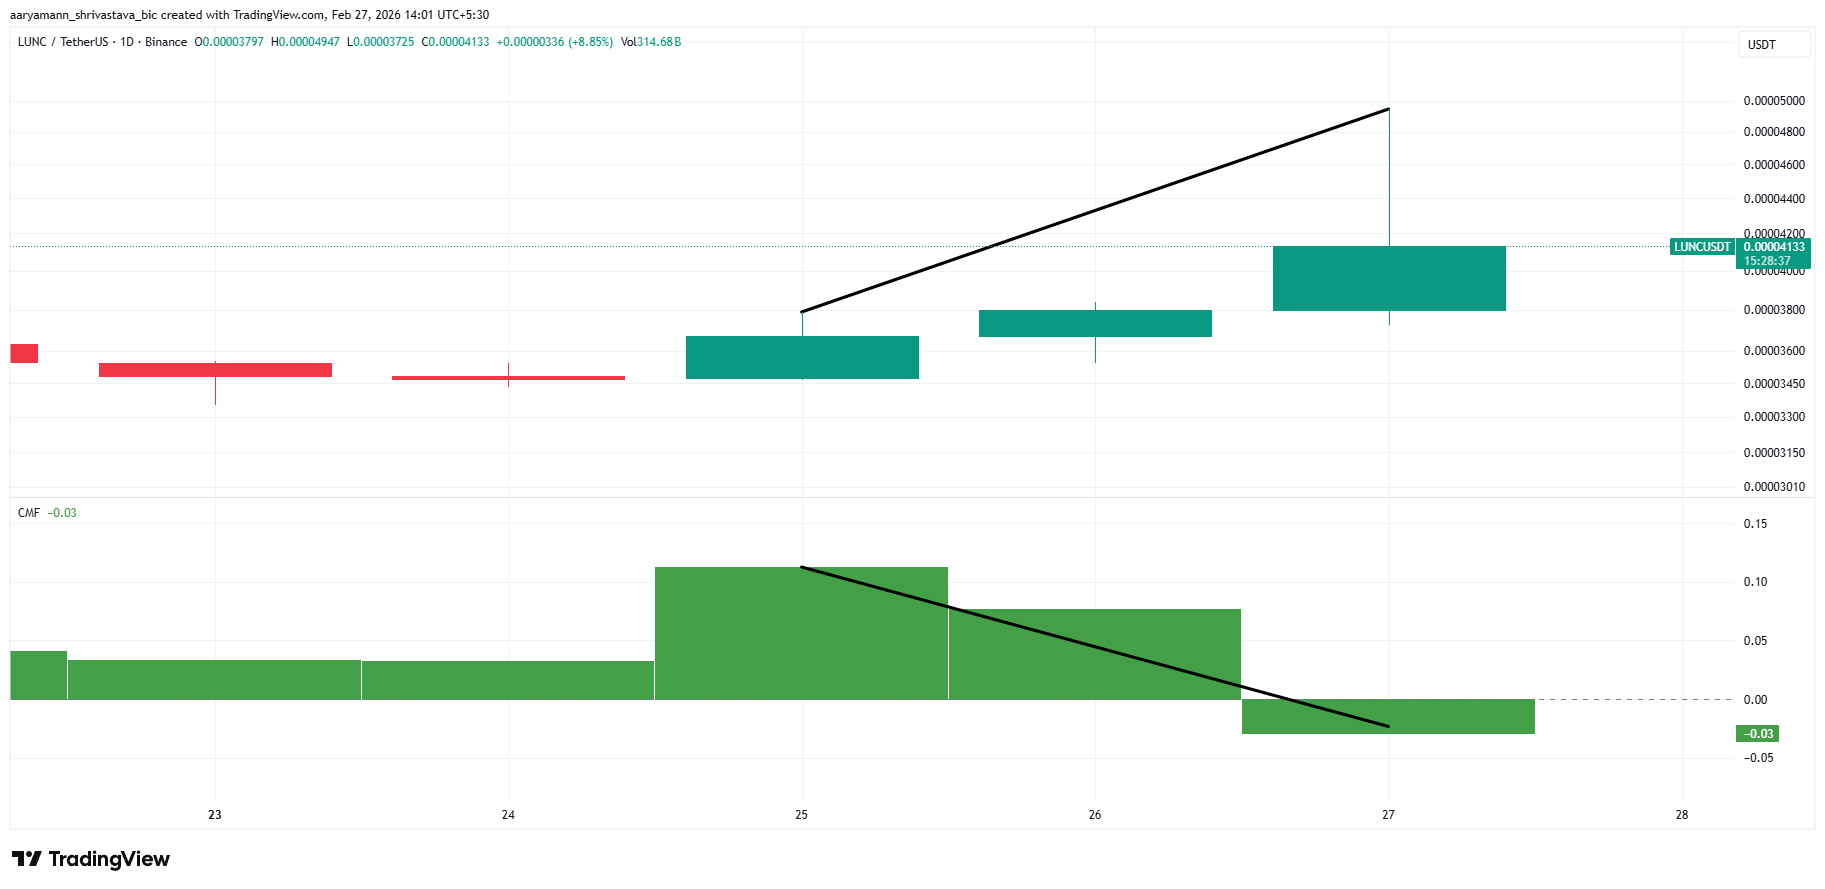
Weak inflow confirmation raises questions about durability. Without consistent capital accumulation, rallies risk reversal. Price movements unsupported by strong liquidity often correct once speculative interest fades.
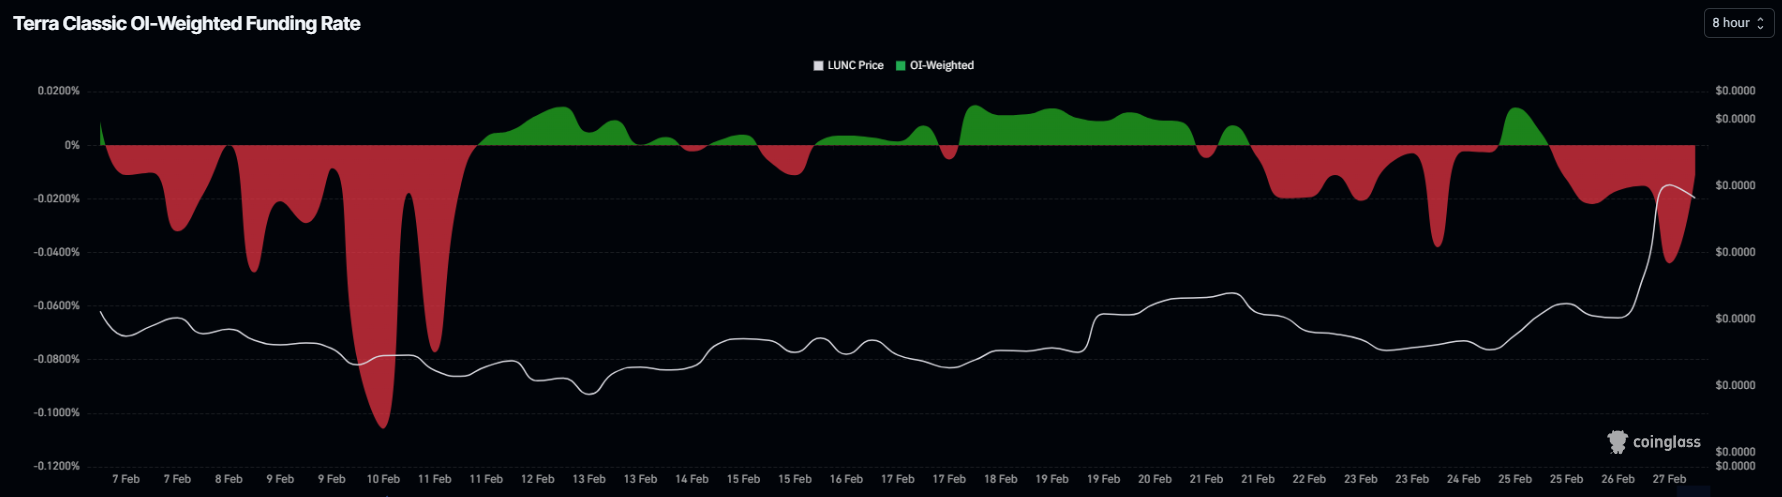
Derivatives data adds to the cautious outlook. LUNC’s funding rate currently sits in negative territory. Negative funding signals dominance of short positions over longs.
Aggregate funding metrics show traders are positioning for downside risk. Elevated short interest can cap upward momentum. If short bias persists, LUNC may continue consolidating unless forced liquidations trigger a squeeze.
LUNC Price May Not See Much Growth
LUNC rose roughly 20% over the past three days and surged 30% at its recent intraday high before retreating to $0.00004136. The long upper wick on the chart signals rapid profit-taking. Quick distribution at higher levels limited further upside continuation.
Current technical conditions present a bearish bias. If selling pressure resumes, LUNC could decline toward $0.00003459. This level aligns with the 23.6% Fibonacci retracement. A breakdown below $0.00003459 may expose the next support near $0.00003236, invalidating the bullish recovery narrative.
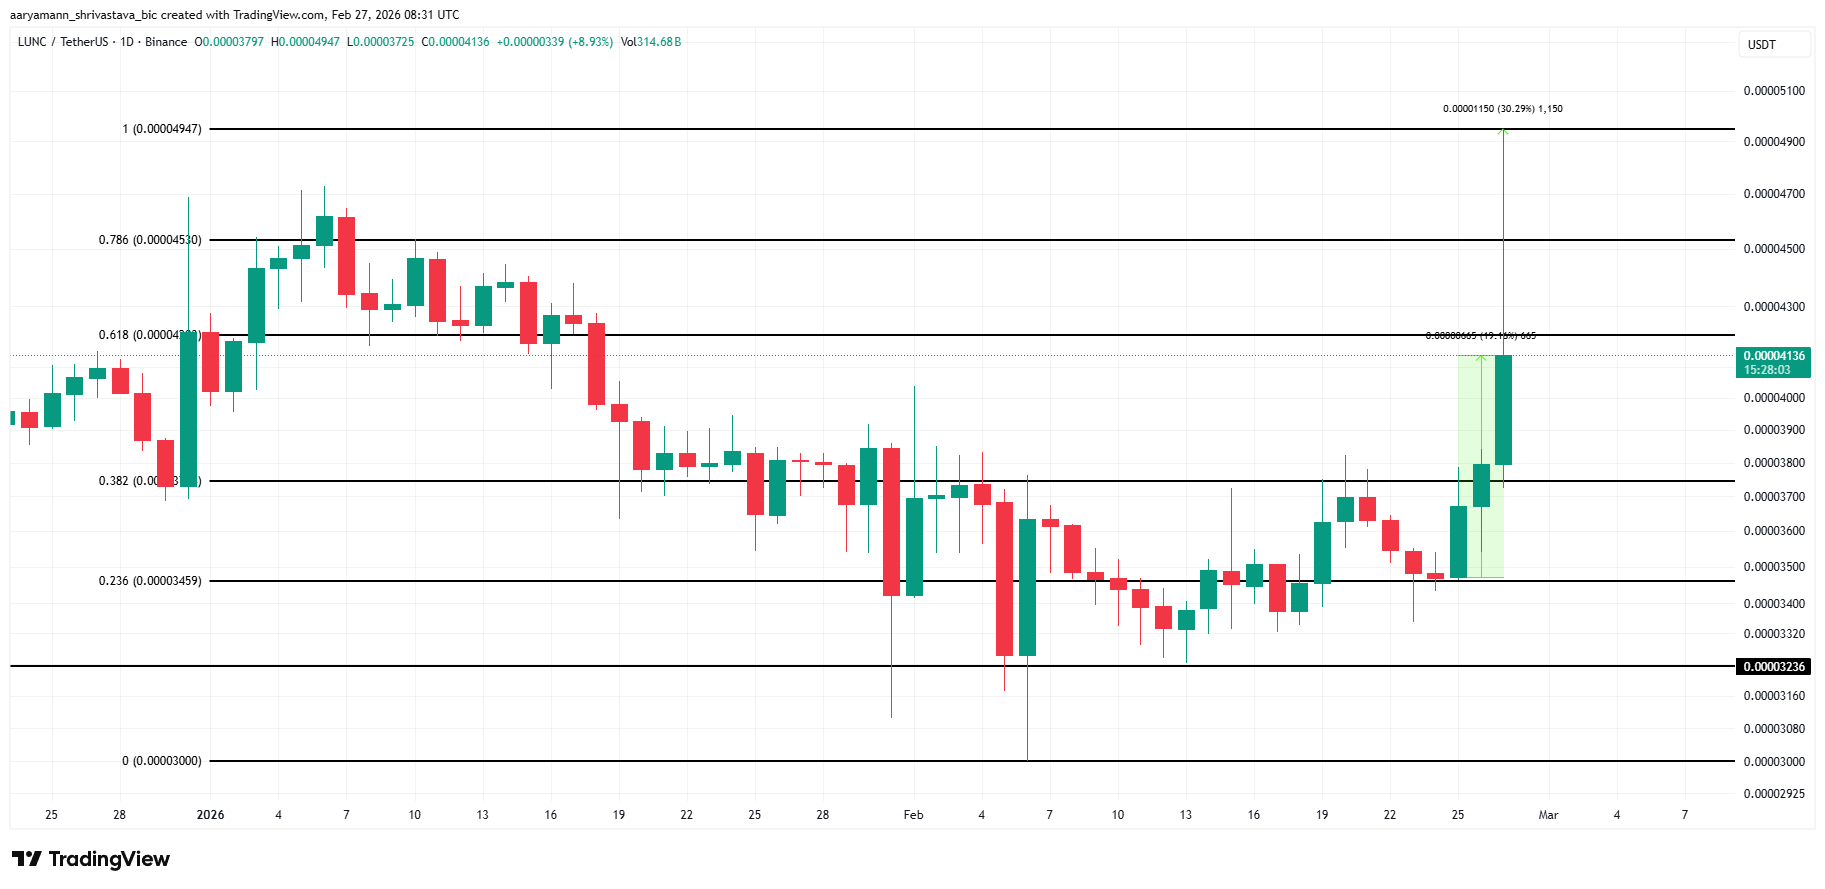
On the upside, LUNC remains capped beneath the $0.00004203 resistance, marked by the 61.8% Fibonacci level. A decisive breakout above this barrier would shift short-term momentum. Flipping $0.00004203 into support could push the token toward $0.00004530 and potentially higher, invalidating the immediate bearish thesis.
A Minnesota lawmaker has introduced a bill that could ban virtual currency kiosks statewide after reports of scams tied to crypto ATMs. Bitcoin ATMs (CRYPTO: BTC) have emerged as a focal point in law-enforcement briefings, where operators have been accused of enabling irreversible transactions that are hard to trace. Rep. Erin Koegel unveiled House File 3642 during a Thursday session of the Commerce Finance and Policy Committee, arguing the technology behind crypto kiosks remains novel and minimally regulated. Minnesota voters have already seen a 2024 law intended to curb kiosk abuse by capping new-user deposits at $2,000 and requiring refunds to fraud victims, but Koegel’s measure would push toward a full ban if enacted. Supporters say it would shield residents from irreversible financial crimes, while opponents caution it could restrict access to legitimate crypto services and push activity underground. Koegel cited committee remarks and testimony during the session.
Key takeaways
- House File 3642 would ban crypto kiosks across Minnesota if enacted, expanding beyond the state’s 2024 safeguards.
- The 2024 law introduced a $2,000 deposit limit for new kiosk users and required refunds for fraud, signaling a trend toward consumer protections.
- Law enforcement officials described cryptocurrency kiosks as a common scam vector, with aging populations identified as particularly vulnerable groups.
- There are about 350 licensed crypto kiosks in Minnesota, operated by firms including Bitcoin Depot and Coinflip, according to the state’s findings.
- Industry responses emphasize a broader regulatory debate about crypto ATMs, privacy, and access versus fraud risk, with related moves like ID-verification policies signaling a shifting risk profile.
Tickers mentioned: $BTC
Sentiment: Neutral
Market context: The Minnesota proposal sits within a broader regulatory moment as lawmakers and regulators reassess crypto kiosks amid ongoing fraud concerns. Across the U.S., states are weighing standardized protections for crypto ATM users, while operators consider compliance measures to balance customer access with risk controls. The trend toward enhanced identity checks and clearer fraud warnings reflects a shift in how the market perceives the balance between innovation and consumer protection.
Why it matters
The bill’s momentum highlights a policy question at the intersection of financial technology and consumer protection. Crypto kiosks offer convenient access points for the public to buy and sell digital assets, but their relative lack of traditional safeguards has made them attractive targets for scammers. Minnesota’s current framework—enacted in 2024—was designed to curb abuse by imposing a deposit cap and mandating refunds for fraud victims. Yet the proposed HF 3642 would push the state toward a more restrictive approach, potentially banning the devices altogether. The stakes are not merely about kiosks; they reflect a broader debate about how to regulate rapidly evolving crypto infrastructure without stifling legitimate use cases or hindering access to digital assets for ordinary residents.
Industry responses point to a practical tension: operators argue that well-defined rules can reduce abuse while preserving access. Bitcoin Depot, one of the largest operators in the U.S., has already begun a phased rollout of ID verification for all transactions at its machines, a policy aimed at curbing misuse while maintaining user convenience. The move signals a willingness among some players to embrace stronger controls in the name of compliance and consumer protection; it also foreshadows a regulatory environment in which basic access could be contingent on identity verification and heightened disclosures. The pressurized policy backdrop is further amplified by consumer advocacy groups that emphasize protections, such as fraud warnings and transaction-limits, as essential to preserving trust in mainstream crypto usage.
For the market, these developments touch on liquidity, risk sentiment, and the perceived legitimacy of on-ramp infrastructure. When a state with tens (and potentially hundreds) of kiosks contemplates a ban, it underscores the fragility and scrutiny surrounding crypto-on-ramp channels. While the debates unfold, observers watch for how other states respond to similar concerns and whether broader federal or regulatory moves could harmonize or clash with state-level approaches. The tension between enabling convenient access to digital assets and preventing harms linked to fraudulent activity remains a defining feature of the current regulatory landscape.
In parallel, consumer protection narratives continue to gain traction. The American Association of Retired Persons (AARP) has highlighted ongoing fraud protections in several states, urging operators to implement practical safeguards such as transaction limits and clear fraud warnings. As lawmakers weigh HF 3642 against the potential benefits of accessible crypto tools for everyday users, the interplay between policy, technology, and consumer trust will likely shape the contours of Minnesota’s crypto kiosk ecosystem in the months ahead. The discussion also echoes broader policy conversations about how to regulate novel financial technologies while preserving opportunities for legitimate innovation.
“Because of the nature of cryptocurrency, these fraudulent transactions are often irreversible and incredibly hard to track,” Koegel said, emphasizing the need for a coordinated, cross-partisan response to protect citizens from irreversible financial crimes.
The current environment therefore blends caution with pragmatism: protect vulnerable users and deter fraud, while acknowledging that kiosks can provide a straightforward entry point to digital assets for some residents. The outcome of HF 3642 remains uncertain, but the policy debate is unlikely to fade anytime soon as Minnesota and other states evaluate how to balance accessibility and security in an evolving crypto economy.
What to watch next
- Progress of House File 3642 in the Minnesota House of Representatives, including committee votes and potential floor action.
- Any Senate companion or changes in the legislative process that could influence the bill’s trajectory.
- Updates to kiosk regulations and enforcement actions stemming from the 2024 deposit-limit law, and any new operator compliance measures.
- Industry responses from crypto ATM operators regarding verification policies and fraud-prevention efforts, and how these may influence state debates.
Sources & verification
- House File 3642 and committee materials from the Minnesota House of Representatives (HF 3642 – Commerce Finance and Policy Committee materials).
- Committee hearing coverage and remarks, including Rep. Koegel’s statements and the discussion on the 2024 law, captured in the committee video (YouTube: https://www.youtube.com/watch?v=w6hc8OkvaZE).
- State data on licensed crypto kiosks in Minnesota (approximately 350 kiosks operated by Bitcoin Depot, Coinflip, and others).
- Bitcoin Depot policy update requiring ID verification for all crypto ATM transactions (Cointelegraph: https://cointelegraph.com/news/bitcoin-depot-mandatory-id-verification-crypto-atms).
- AARP’s guidance on crypto ATM fraud protections and related protections in multiple states (https://www.aarp.org/advocacy/crypto-atm-fraud-protections/).
A Minnesota lawmaker has introduced a bill that could ban virtual currency kiosks across the state after reports of incidents involving crypto-related scams.
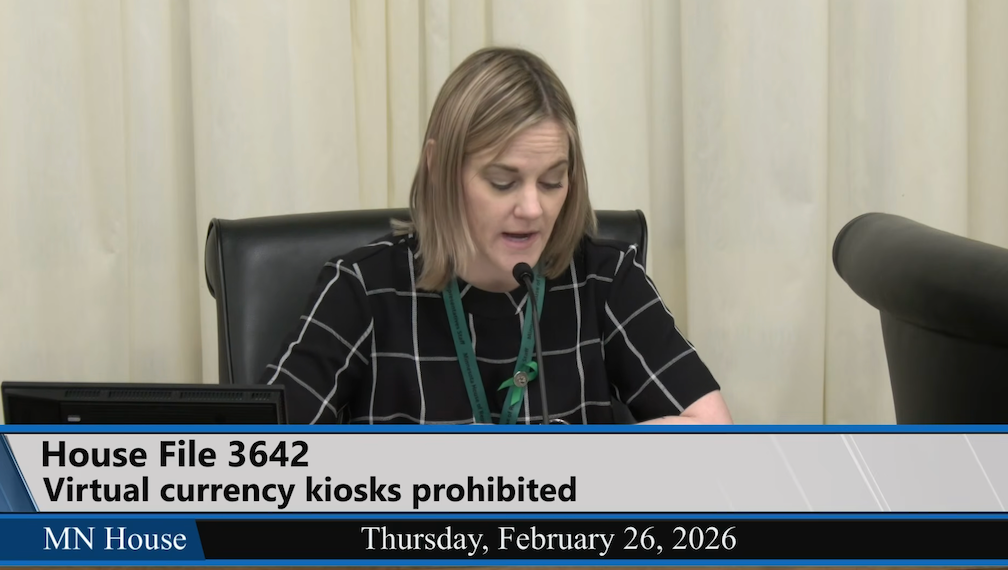
In a Thursday session of the Minnesota House of Representatives Commerce Finance and Policy Committee, Representative Erin Koegel said the bill, House File 3642, would address the “novel” and “minimally regulated” technology of crypto kiosks.
Koegel said she had heard from state law enforcement agencies that many scammers used the kiosks to trick residents into sending crypto, while legitimate traders tended to use centralized exchanges.
“Because of the nature of cryptocurrency, these fraudulent transactions are often irreversible and incredibly hard to track,” said Koegel, adding:
“This bill gives us an opportunity to work across party lines to protect the people of Minnesota from irreversible financial crimes.”

Minnesota’s government already passed a law in 2024 attempting to fight scammers using the state’s virtual currency kiosks. The law set a $2,000 deposit limit for new kiosk users and required companies to issue full refunds for fraud victims. However, Koegel’s bill, if passed, could fully ban the technology in Minnesota.
“Within the past couple of years, we’ve definitely identified an issue with these Bitcoin ATMs, specifically in our jurisdiction,” said Sergeant Jake Lanz of the St. Cloud Police Department at the Thursday committee meeting. “[…] it also is notable for us that it is definitely a target of our aging population.”
Related: US senators to weigh CFTC, other amendments to crypto market structure bill
According to the House, Minnesota has about 350 licensed crypto kiosks operated by several companies, including Bitcoin Depot and Coinflip. The American Association of Retired Persons reported in February that 17 states had laws on the books requiring crypto ATM operators to implement protections against fraudsters, such as setting daily transaction limits and requiring fraud warning signs.
Bitcoin ATM operator to require IDs for all transactions
On Tuesday, Bitcoin Depot, one of the largest crypto ATM operators in the US, announced that it would implement a policy requiring ID verification for users with every transaction at one of its machines. The phased rollout, which began in February, was in response to “potential misuse,” though the company did not specifically mention state-level crackdowns on scammers.
Magazine: Would Bitcoin really be at $200K if not for Jane Street? Trade Secrets

Multinational bank Barclays (BARC) is exploring the creation of a blockchain platform for payments and other processes, Bloomberg reported on Friday.
The London-based financial services giant is consulting with prospective technology providers on the development of such a platform that would see it rival JPMorgan (JPM) and others in using decentralized technology for banking services.
Barclays’ blockchain-based plans could include stablecoins and tokenization, according to the report, citing people familiar with the matter.
JPMorgan first allowed tokenized deposits — deposits represented as digital tokens on a decentralized ledger — through its dollar-denominated JPM Coin all the way back in 2019.
More recently, HSBC has also enabled tokenized deposits to expand its own push into blockchain-based payments.
Such institutions are exploring how blockchain technology can make existing financial processes more transparent and more efficient by carrying them out on decentralized networks that lack some of the input of intermediaries and allow faster settlement.
Barclays did not respond to CoinDesk’s request for comment.
Read More: JPMorgan expands blockchain goals, plans to build ‘interoperable digital money’
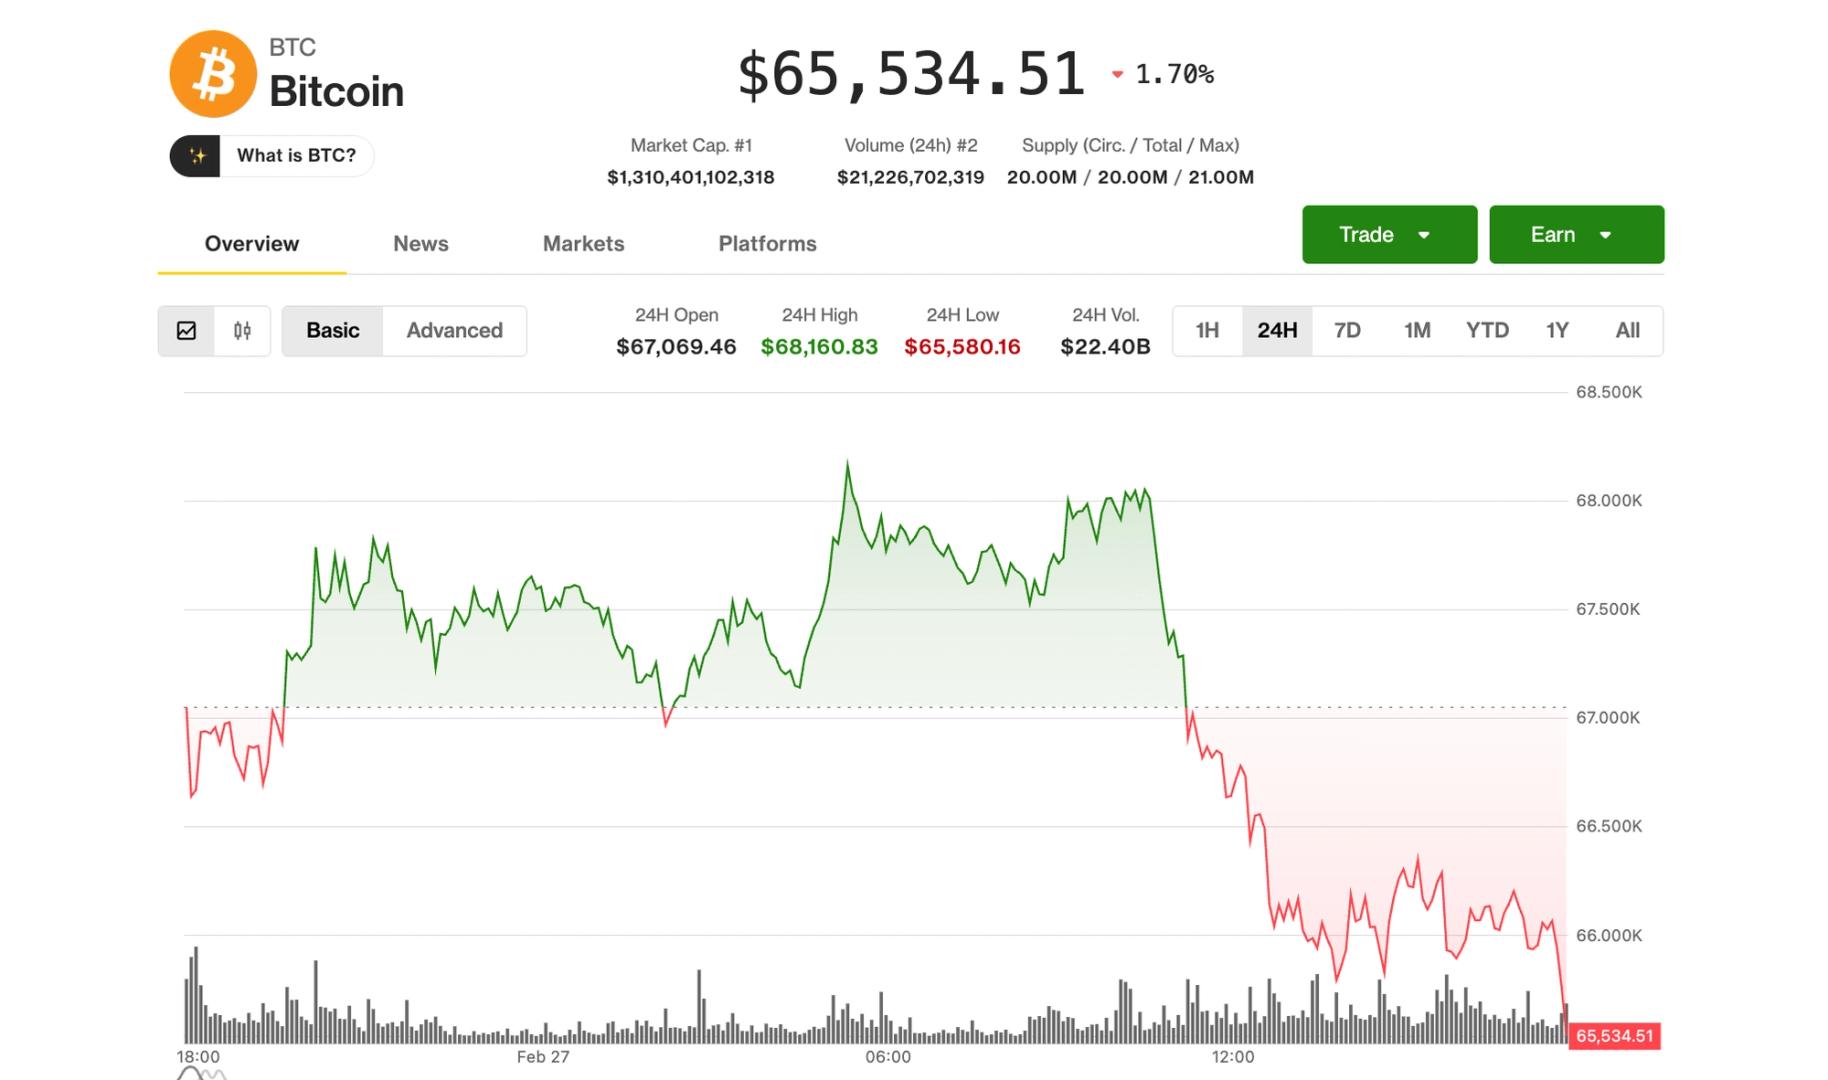

Bitcoin fell back below $66,000 Friday in the early U.S. session as mounting macro risks are spooking investors away from risky assets.
The largest crypto now has erased most of Wednesday’s surge, plunging 3% from around $68,000 in the past few hours to $65,600 in the morning hours. The braod-market CoinDesk 20 Index was 2.3% lower in the past 24 hours, with ether (ETH), XRP (XRP) and solana (SOL) down similar amounts.
Crypto-related stocks also followed the move, giving up part of the gains earlier this week. Strategy (MSTR), the largest corporate bitcoin holder, slipped 3%, while Coinbase (COIN) was more than 2% lower. Stablecoin issuer Circle (CRCL), declined almost 5%%, snapping its rebound that saw the stock gaining nearly 50% in a couple of sessions.
Miners, increasingly linked to AI infrastructure buildout, performed even worse, with IREN (IREN), Cipher Mining (CIFR), Core Scientific (CORZ) and TeraWulf (WULF) losing 6%-8%.
The action occurred as U.S. equity indexes fell, with the Nasdaq down 0.8% and the S&P 500 lower by 0.6%.
In the backdrop, there was a mix of risks for investors to get concerned about.
A hotter-than-expected Producer Price Index (PPI) inflation reading for last month spooked those who hoped for a continuation in the cooling inflation trend. In January, core PPI rose 3.6% year over year, above the 3.0% estimate, and up from 3.3% previously. Markets are now pricing in a 96% chance of no rate cut for the March 18 Federal Reserve meeting.
Concerns about stress in the credit markets also linger, with credit spreads at their widest in four months. Private equity firms KKR (KKR), Ares (ARES) and Apollo Global Management (APO) plunged 6%-7% to fresh lows during the session.
On top of that, prediction market odds of U.S. strikes against Iran rose this morning after the U.S. has begun evacuating embassy staff from Israel.
Money flows to safe-havens
In fixed income, the U.S. 10-year Treasury yield has slipped below 4% for the first time since November 2024. Precious metals continue to rally, with gold up 1% to above $5,230 an ounce, while silver has surged 4% to trade back above $92. Meanwhile, crude oil jumped 2.3% to above $67 a barrel.
Read more: The worst may lie ahead. Bitcoin chart revisits historic pattern

OpenAI on Thursday confirmed a $110 billion valuation, fueling expectations that it could stage the largest IPO in US tech history if it moves forward with a public listing.
The company has not yet filed for an IPO. However, the valuation announced on February 27 positions OpenAI above several landmark Silicon Valley debuts and signals strong backing from major technology investors.
Who are the Big Tech Going All-In on OpenAI?
OpenAI has raised billions in private funding over the past few years. Its most significant backer remains Microsoft, which committed multi-year investments reportedly totaling around $13 billion through structured equity and cloud partnerships.
The new funding includes $30 billion from SoftBank, $30 billion from NVIDIA, and $50 billion from Amazon. Additional financial investors are expected to join as the round progresses.
Other major investors include Thrive Capital, Khosla Ventures, Sequoia Capital, and Andreessen Horowitz. These firms participated in earlier funding rounds as OpenAI scaled ChatGPT and enterprise AI infrastructure.
OpenAI Could be the Biggest IPO in US History
If OpenAI proceeds at this valuation, it would rank among the largest US tech IPOs ever. The scale of this funding dwarfs most historic IPO valuations.
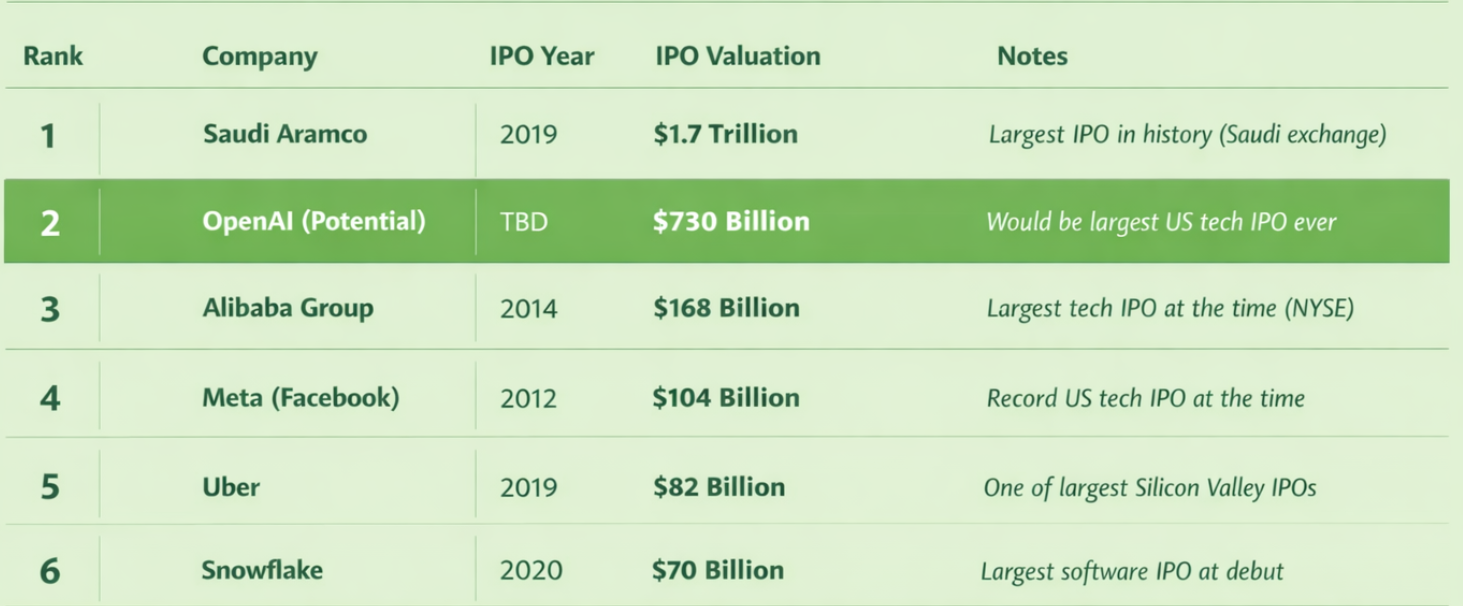
For comparison, Meta Platforms (Facebook) went public in 2012 at about $104 billion. Snowflake debuted in 2020 at roughly $70 billion. Alibaba Group was listed at around $168 billion in 2014.
Globally, Saudi Aramco still holds the overall IPO record at $1.7 trillion.
At a $730 billion valuation, OpenAI now stands in a different category.
If it proceeds to a public offering, it would likely rank as the largest US tech IPO ever, reflecting the scale of investor conviction behind frontier AI.
The company has not disclosed a potential listing date or share price range. Those details would emerge in a formal IPO filing.


- Kaspa price currently mirrors the broader market, with Bitcoin struggling.
- The KAS token recently bounced off $0.028 and is holding $0.03.
- If a decisive breakout materializes amid likely catalysts, bulls could target $0.10 in the coming months.
Kaspa (KAS) price has declined by 22% over the past month and by over 64% since its peak above $0.13 in May 2025.
The token trades near $0.03, but remains in an extended downtrend amid prevailing weakness across the crypto market. Friday’s session saw Bitcoin retest lows of $65,600, and Ethereum dip to near $1,900, a move that pinned most altcoins lower, including Kaspa.
Why Kaspa bulls may hold the upper hand
Despite the potential for a retest of recent lows, bullish catalysts are on the horizon. Combined with current strength, these possible upside triggers suggest the advantage in the coming months lies with the buyers. What KAS needs is for bulls to navigate the broader crypto market headwinds while holding $0.03 as support.
Among key milestones is Kaspa’s network notching over 600 million total transactions.
Details on the Kaspa Explorer show that total transactions have surpassed 604 million. According to market observers, this proves that the BlockDAG protocol delivers real-world throughput with sub-second confirmations.
Also notable is Kaspa’s pivotal hard fork expected in May. Implementation will introduce programmable covenants, native assets like KRC20 tokens, and SilverScript for easier Layer 1 development.
Meanwhile, nearly 95% of its 28.7 billion max supply is already mined, and a move to the limit can only slash new coin emissions further. If broader catalysts align, the KAS price will benefit.
Kaspa price analysis
While bulls have the upper hand in terms of what’s upcoming, current price action hints at a potential battle for dominance by both buyers and sellers.
KAS has remained in a downtrend since late 2025, with lows of $0.028 in February. The daily chart highlights a key supply zone at the falling 50-day and 100-day simple moving averages, with bulls hitting a supply wall around these levels multiple times.

If the price fails to break out decisively, a combination of negative market conditions could deepen the downtrend. Support could be at $0.025
On the upside, immediate hurdles are at the 50-day and 100-day SMAs near $0.036 and $0.041.
The key level for bulls will be $0.050-$0.055, a zone that marks a previous supply wall and above which KAS could run to $0.10 or higher.
It’s notable that the Kaspa price jumped to near $0.05 in mid-December 2025 amid excitement around KAS listing on HTX.

Afghanistan sets tougher penalties for animal fights than domestic violence, UN high commissioner says | World News

Tyrrells plans to give vegetable crisps the chop

Is Bitcoin Cash Price Mirroring Its 28% Rally Setup From 2025?

Smart energy pays enters the US market, targeting scalable financial infrastructure

Why Israel is blocking foreign journalists from entering

Bitcoin: We’re Entering The Most Dangerous Phase

Altseason Starting? Bull Trap or Relief Rally Explained | Crypto Market Update | Bitcoin Update?

Bitcoin Accumulation ERUPTS As The Financial System Cracks! Supply Shock Incoming?

Financial Planning in Your 40s | #ytshorts #shorts #financialplanning #personalfinance #moneygoals
-

 Politics5 days ago
Baftas 2026: Awards Nominations, Presenters And Performers
-

 Fashion7 days ago
Weekend Open Thread: Boden – Corporette.com
-

 Sports4 days ago
Women’s college basketball rankings: Iowa reenters top 10, Auriemma makes history
-

 Politics4 days ago
Nick Reiner Enters Plea In Deaths Of Parents Rob And Michele
-

 Business3 days ago
True Citrus debuts functional drink mix collection
-

 Politics18 hours ago
ITV enters Gaza with IDF amid ongoing genocide
-

 Crypto World3 days ago
XRP price enters “dead zone” as Binance leverage hits lows
-

 Business5 days ago
Mattel’s American Girl brand turns 40, dolls enter a new era
-

 Business5 days ago
Law enforcement kills armed man seeking to enter Trump’s Mar-a-Lago resort, officials say
-

 NewsBeat2 days ago
Cuba says its forces have killed four on US-registered speedboat | World News
-
 NewsBeat2 days ago
Manchester Central Mosque issues statement as it imposes new measures ‘with immediate effect’ after armed men enter
-

 Tech3 days ago
Unsurprisingly, Apple's board gets what it wants in 2026 shareholder meeting
-
 NewsBeat4 days ago
‘Hourly’ method from gastroenterologist ‘helps reduce air travel bloating’
-

 Tech5 days ago
Anthropic-Backed Group Enters NY-12 AI PAC Fight
-

 NewsBeat5 days ago
Armed man killed after entering secure perimeter of Mar-a-Lago, Secret Service says
-

 Politics5 days ago
Maine has a long track record of electing moderates. Enter Graham Platner.
-

 Business2 days ago
Discord Pushes Implementation of Global Age Checks to Second Half of 2026
-
 NewsBeat3 days ago
Police latest as search for missing woman enters day nine
-
 Sports4 days ago
2026 NFL mock draft: WRs fly off the board in first round entering combine week
-

 Crypto World3 days ago
Entering new markets without increasing payment costs