

Crypto World
Why LUNC Price Soared 30%

Terra Luna Classic (LUNC) price lacked clear direction for weeks before staging a sharp three-day rally. The sudden surge pushed the token up nearly 30% at its intraday peak. However, technical and on-chain signals suggest the breakout may struggle to sustain momentum.
The broader crypto market has experienced periodic bursts of volatility. LUNC’s recent move stands out due to its speed rather than structural strength. While price action turned briefly bullish, underlying metrics indicate caution is warranted.
Bitcoin – The Cause Of LUNC’s Rise
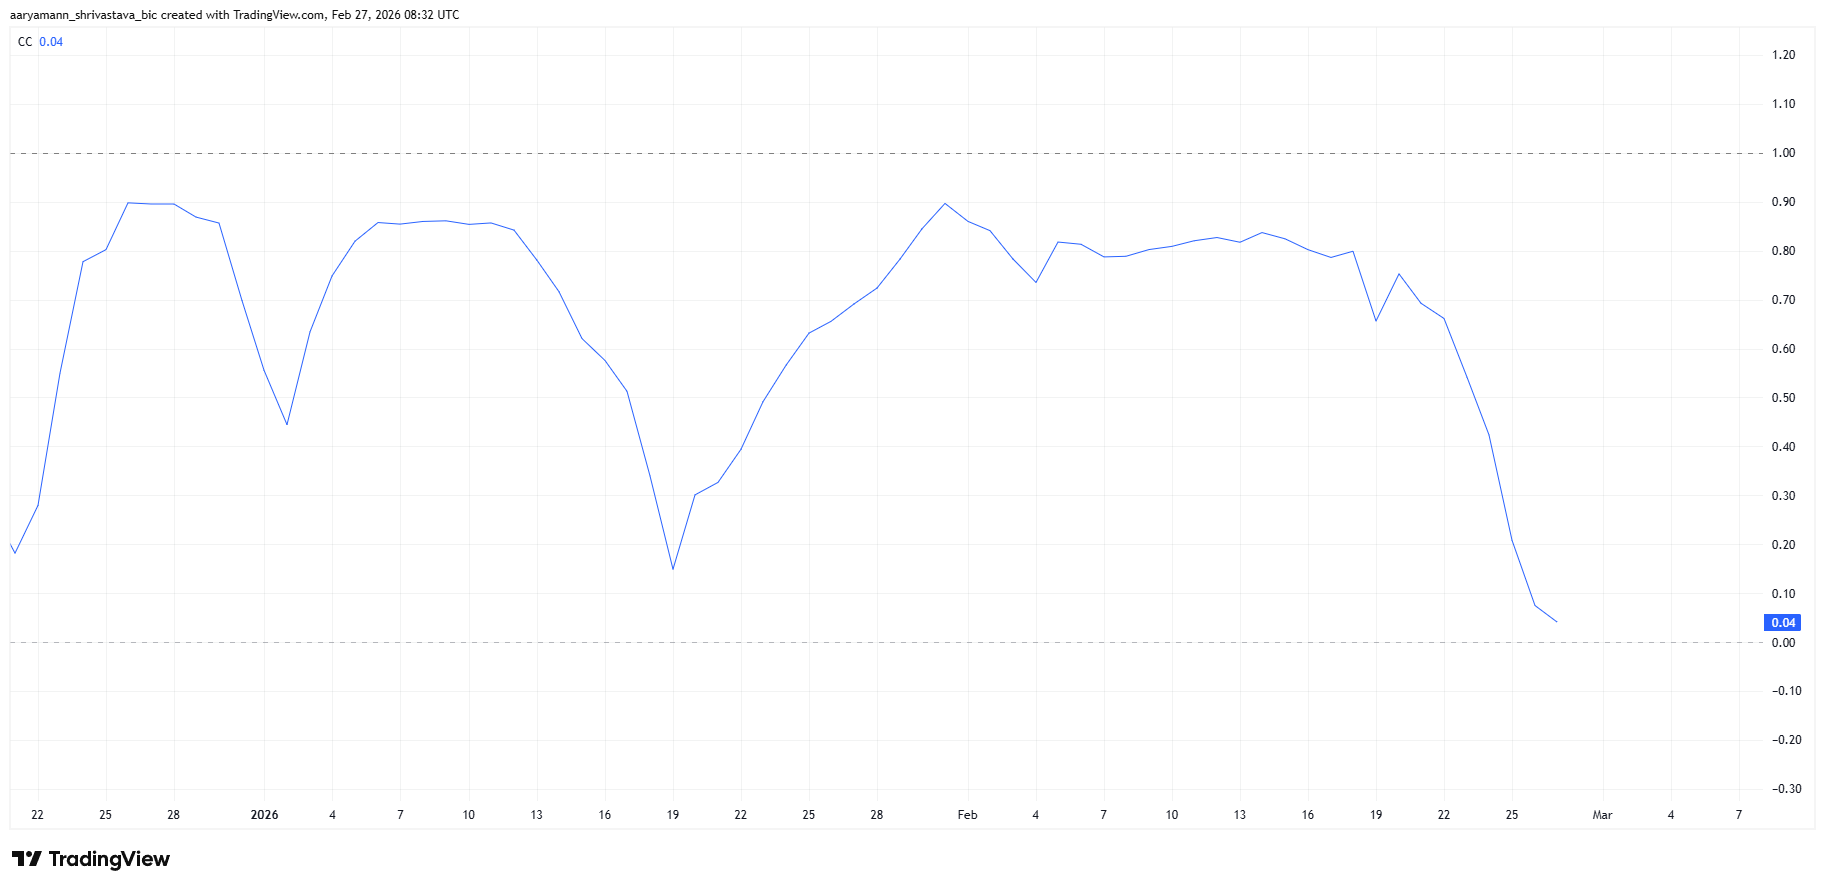
The primary catalyst behind LUNC’s rally was a surge in trading volume. Increased speculative activity drove short-term price acceleration. At the same time, LUNC’s correlation with Bitcoin dropped to 0.04, signaling near-complete decoupling.
Such low correlation suggests the token temporarily moved independently of BTC. Decoupling phases can attract traders seeking isolated momentum plays. However, similar patterns have appeared across several altcoins recently. These shifts often reflect short-lived speculative rotations rather than lasting structural change.
Want more token insights like this? Sign up for Editor Harsh Notariya’s Daily Crypto Newsletter here.
LUNC Is Trapped Under Bearish Pressure
The Chaikin Money Flow indicator reveals a concerning divergence. Despite rising prices over the past three days, CMF did not confirm sustained inflows. Capital entering the market remained subdued relative to price movement.
A bearish divergence formed as price climbed while CMF weakened. This pattern indicates that buying pressure failed to match the rally’s strength. Outflows continued quietly beneath the surface.
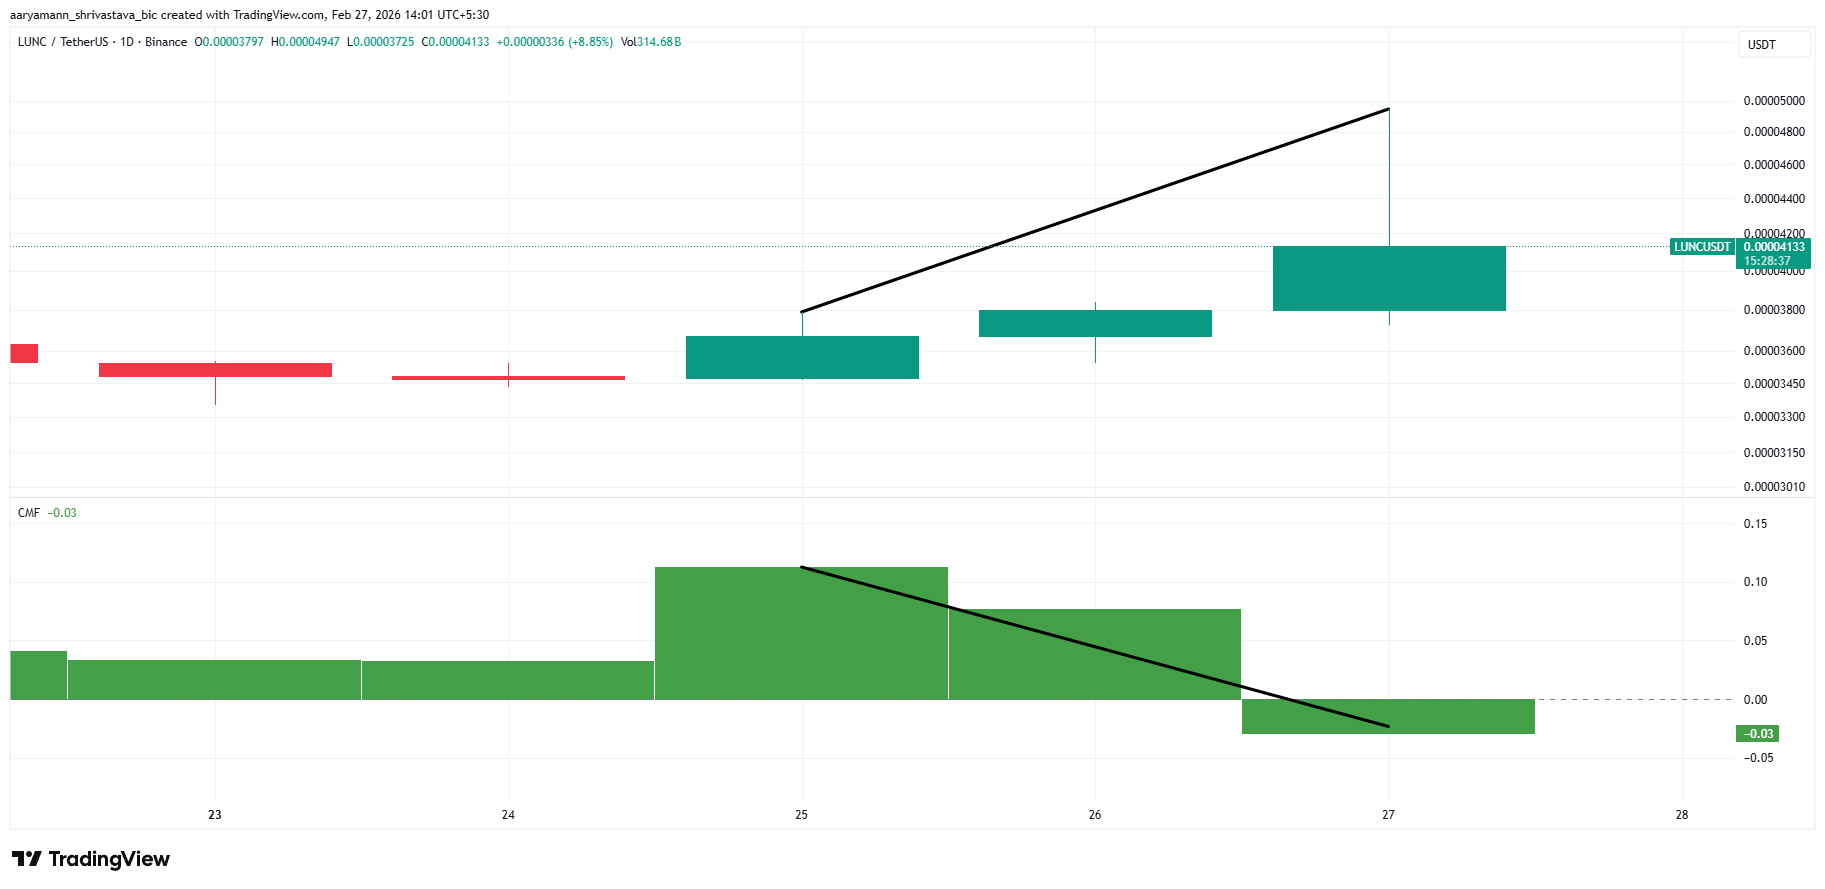
Weak inflow confirmation raises questions about durability. Without consistent capital accumulation, rallies risk reversal. Price movements unsupported by strong liquidity often correct once speculative interest fades.
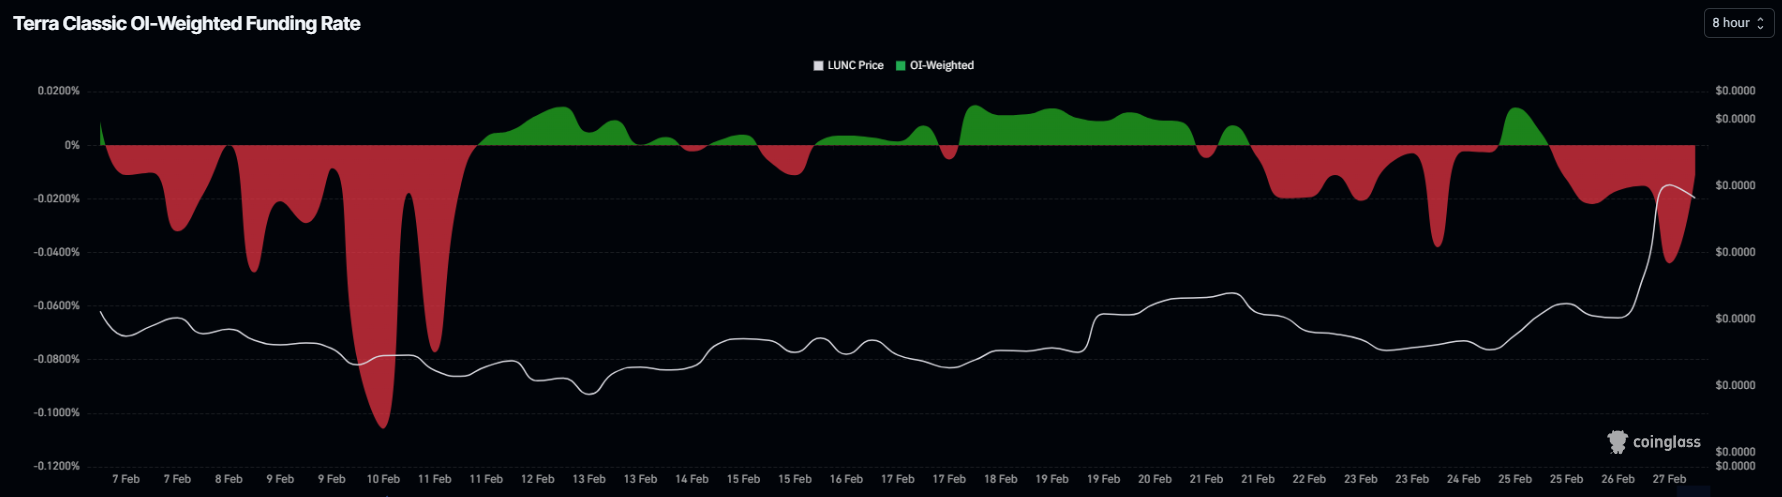
Derivatives data adds to the cautious outlook. LUNC’s funding rate currently sits in negative territory. Negative funding signals dominance of short positions over longs.
Aggregate funding metrics show traders are positioning for downside risk. Elevated short interest can cap upward momentum. If short bias persists, LUNC may continue consolidating unless forced liquidations trigger a squeeze.
LUNC Price May Not See Much Growth
LUNC rose roughly 20% over the past three days and surged 30% at its recent intraday high before retreating to $0.00004136. The long upper wick on the chart signals rapid profit-taking. Quick distribution at higher levels limited further upside continuation.
Current technical conditions present a bearish bias. If selling pressure resumes, LUNC could decline toward $0.00003459. This level aligns with the 23.6% Fibonacci retracement. A breakdown below $0.00003459 may expose the next support near $0.00003236, invalidating the bullish recovery narrative.
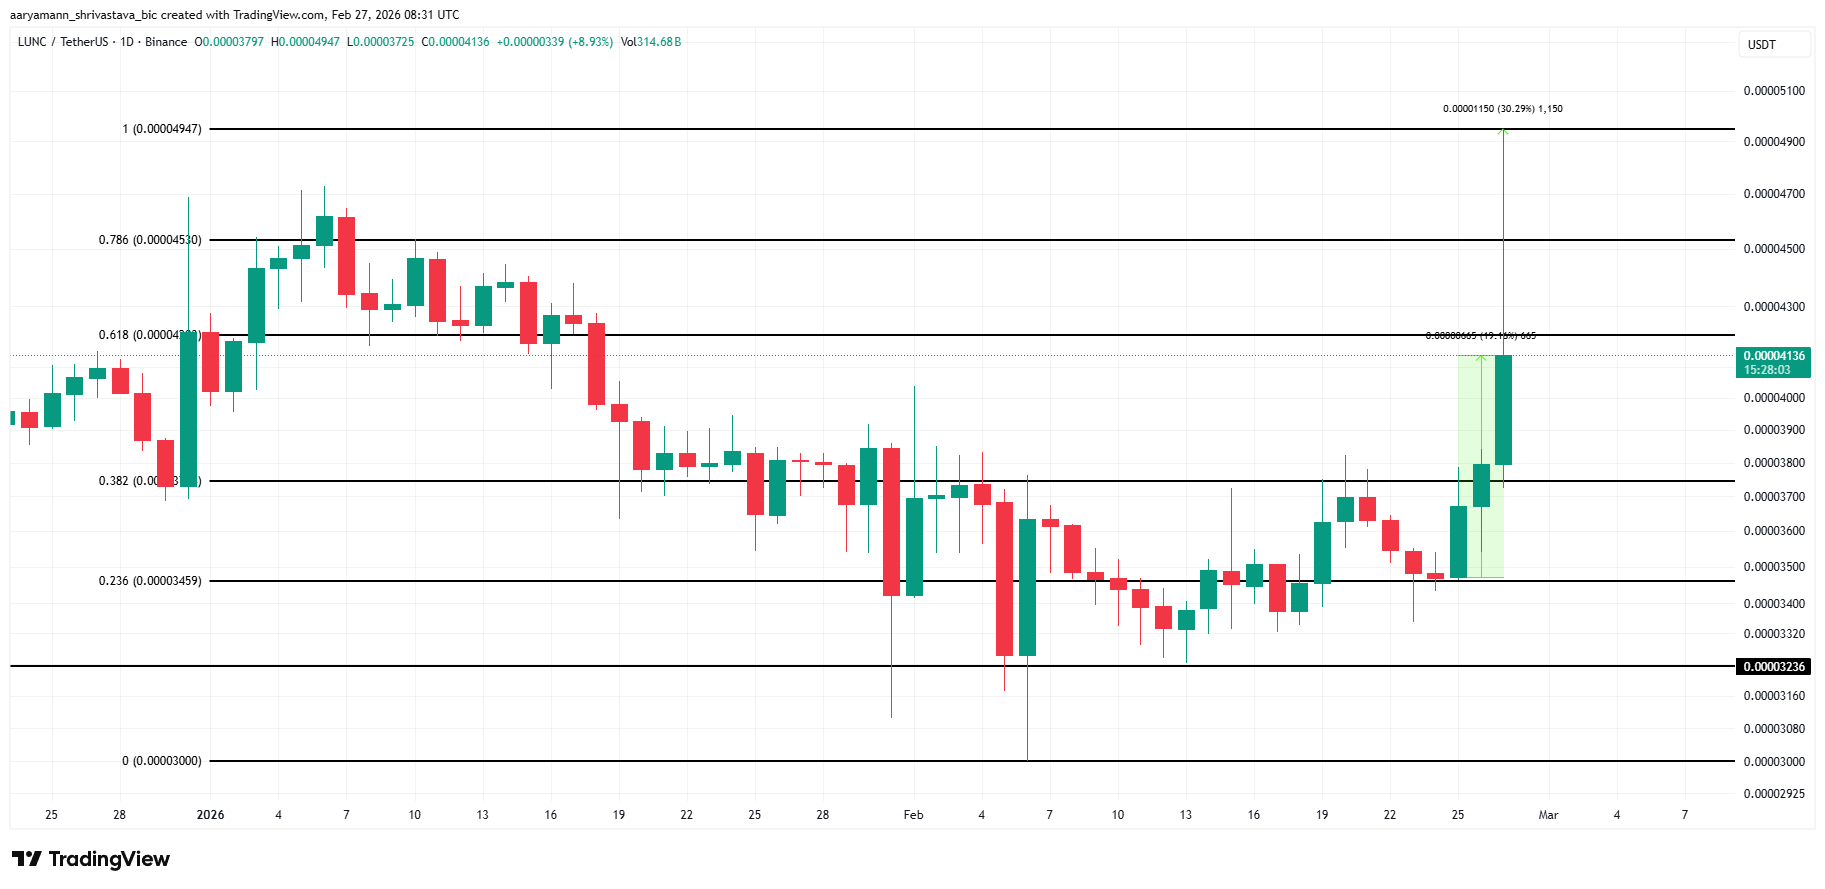
On the upside, LUNC remains capped beneath the $0.00004203 resistance, marked by the 61.8% Fibonacci level. A decisive breakout above this barrier would shift short-term momentum. Flipping $0.00004203 into support could push the token toward $0.00004530 and potentially higher, invalidating the immediate bearish thesis.

Key takeaways:
-
Analysts downgraded US stocks due to high valuations, a weak dollar and policy risks despite AI-driven earnings growth.
-
Limited S&P 500 upside may shift capital toward Bitcoin, especially if major sovereign funds announce BTC reserves.
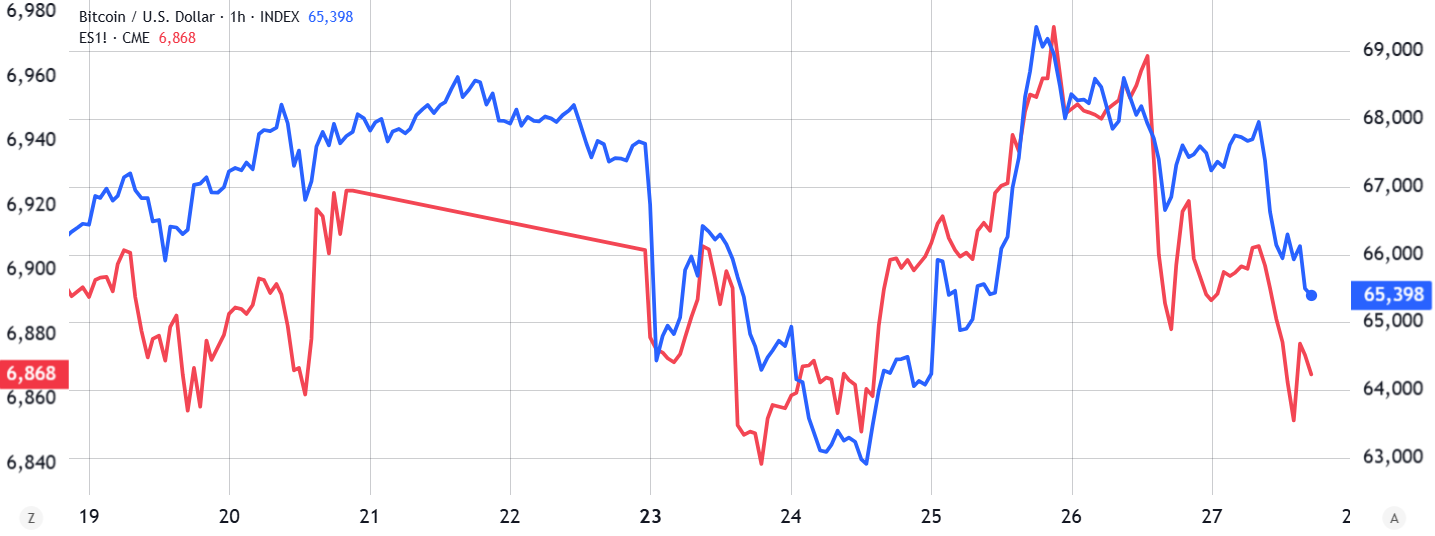
Bitcoin (BTC) price plunged below $65,500 on Friday, effectively erasing gains established on Wednesday. This correction closely tracked intraday S&P 500 movements after wholesale inflation data in the US triggered increased risk aversion. A report from investment bank UBS downgrading US stocks to neutral likely accelerated the surge in demand for the safety of fixed-income assets.

Investors fear that a potential doomsday scenario for the US equities market could drive Bitcoin to new yearly lows. While increased spending on artificial intelligence infrastructure remains a primary concern for some, Bitcoin’s long-term trajectory is unlikely to remain dependent on the technology sector.
Institutional Bitcoin adoption could improve market sentiment
According to the UBS global equity strategy team, valuations within the US equity market are no longer attractive compared to other global regions. Analysts cited mounting risks from a weakening dollar and US policy turbulence, which are creating asymmetric structural downside risks. Furthermore, corporate buybacks appear to be losing their effectiveness in sustaining price levels.
The relevance of the $70 trillion US market capitalization should not be overstated, even as it disturbs price trends on supposedly uncorrelated assets like Bitcoin. Still, the UBS report is far from a doomsday prediction, especially considering their year-end S&P 500 target remains at 7,500.
Part of the recent decline to $65,500 is explained by Friday’s US Producer Price Index jumping 0.5% in January from the previous month. When inflation metrics surprise to the upside, traders often become less certain regarding interest rate cuts from the US Federal Reserve. A restrictive monetary policy negatively impacts the economy as credit remains expensive and companies have fewer incentives to expand production.

The US Treasury yield serves as a proxy for investor risk assessment. During periods of uncertainty, traders seek shelter in government bonds, regardless of current inflationary trends. The unusual decline in the US 10-year Treasury yield to 3.97% from 4.21% just three weeks prior signals a shift toward risk-averse sentiment. This is particularly notable as the S&P 500 exhibited signs of weakness despite positive surprises in corporate earnings.
The UBS global equity strategy report says US stocks are trading 35% above global peers, versus an average premium of 4% since 2010. Analysts mentioned volatility added by US policy proposals to cap credit card interest rates, implement additional import tariffs and place potential limits on private equity investment in housing. However, the bank expects AI adoption in the US to help sustain earnings growth across key industries, according to CNBC.

If the S&P 500 upside proves limited, Bitcoin could benefit from eventual capital rotation as gold, the absolute leader store of value, has already soared to a $36.5 trillion market capitalization. To put things in perspective, the 10 largest tech companies have a combined market capitalization of $24.2 trillion. Even if Bitcoin price rallies by 52% to $100,000, its market capitalization would be $2 trillion. Thus, unless fixed income or real estate markets benefit from the potential capital rotation, Bitcoin remains a valid candidate.
Related: Spot Bitcoin ETFs take in $1B in three days as investors buy the dip
Sentiment toward Bitcoin could shift favorably as soon as new major companies or sovereign funds announce strategic BTC reserves, even if formed through exchange-traded fund (ETF) exposure. There is no way to predict when those events could happen, but history has proven how trader risk perception can shift favorably when a company such as Tesla (TSLA US) announced a relevant Bitcoin position. But until then, the odds of an onchain decoupling from the US stock market remain low.
This article does not contain investment advice or recommendations. Every investment and trading move involves risk, and readers should conduct their own research when making a decision. While we strive to provide accurate and timely information, Cointelegraph does not guarantee the accuracy, completeness, or reliability of any information in this article. This article may contain forward-looking statements that are subject to risks and uncertainties. Cointelegraph will not be liable for any loss or damage arising from your reliance on this information.
Crypto World
Buterin Offloads ETH, Bitcoin Unable to Push Past $70K, XRP Spot Buying Increases: This Week’s Crypto Recap
Bitcoin played a trick on us this week, making us believe that a recovery is inbound but the positivity was for not.
It’s been a relatively dynamic week within the cryptocurrency industry. The total market capitalization currently stands at around $2.36 trillion, which is more or less where it was last Friday when we did the previous weekly recap, but this doesn’t paint the whole picture.
You see, BTC started the week as anyone would expect – chopping to the downside, which inevitably led to an abrupt crash on Monday, when it dropped from above $67K to around $64K. This was followed by an intraday dead cat bounce and an immediate continuation to below $63,000. Sentiment was down bad, as was most of Crypto Twitter, but what followed raised a few eyebrows.
Bitcoin actually started recovering… notably. It soared from $63K to $70K in less than two days. And then came yet another sign that we are amidst the depths of crypto winter – the recovery was put to a halt, and the bears once again took control, pushing the price down to where we currently sit at slightly above $66K. In case you are wondering, we are still in a state of “extreme fear,” according to the popular Crypto Fear and Greed index, meaning that the masses are definitely not convinced that the worst is behind us. In fact, the most recent bounce did very little to improve the overall sentiment.
Meanwhile, the co-founder of Ethereum, Vitalik Buterin, continues selling ETH. So far, his total disposals reached around 18,700 ETH, even though he previously stated that he plans to sell 16,384 ETH to fund open-source software and hardware development, privacy tools, and security-critical infrastructure projects.
Elsewhere, we have some light at the end of the tunnel for XRP holders, with spot buying seemingly on the rise. While it has done little for the price so far, this could be a sign of a structural shift in XRP’s market dynamics. Bitrue reported a 212% surge in spot buying on February 26th, most of which was linked to ETF inflows, suggesting steady demand from funds.
All in all, the week started off as depressing, turned bullish, and then went back exactly to where it was in the beginning. Strength is being dissolved quickly as negative sentiment prevails, which is incredibly indicative of bear markets. That also makes it quite exciting to see what the next seven days have in store for us.
Market Data
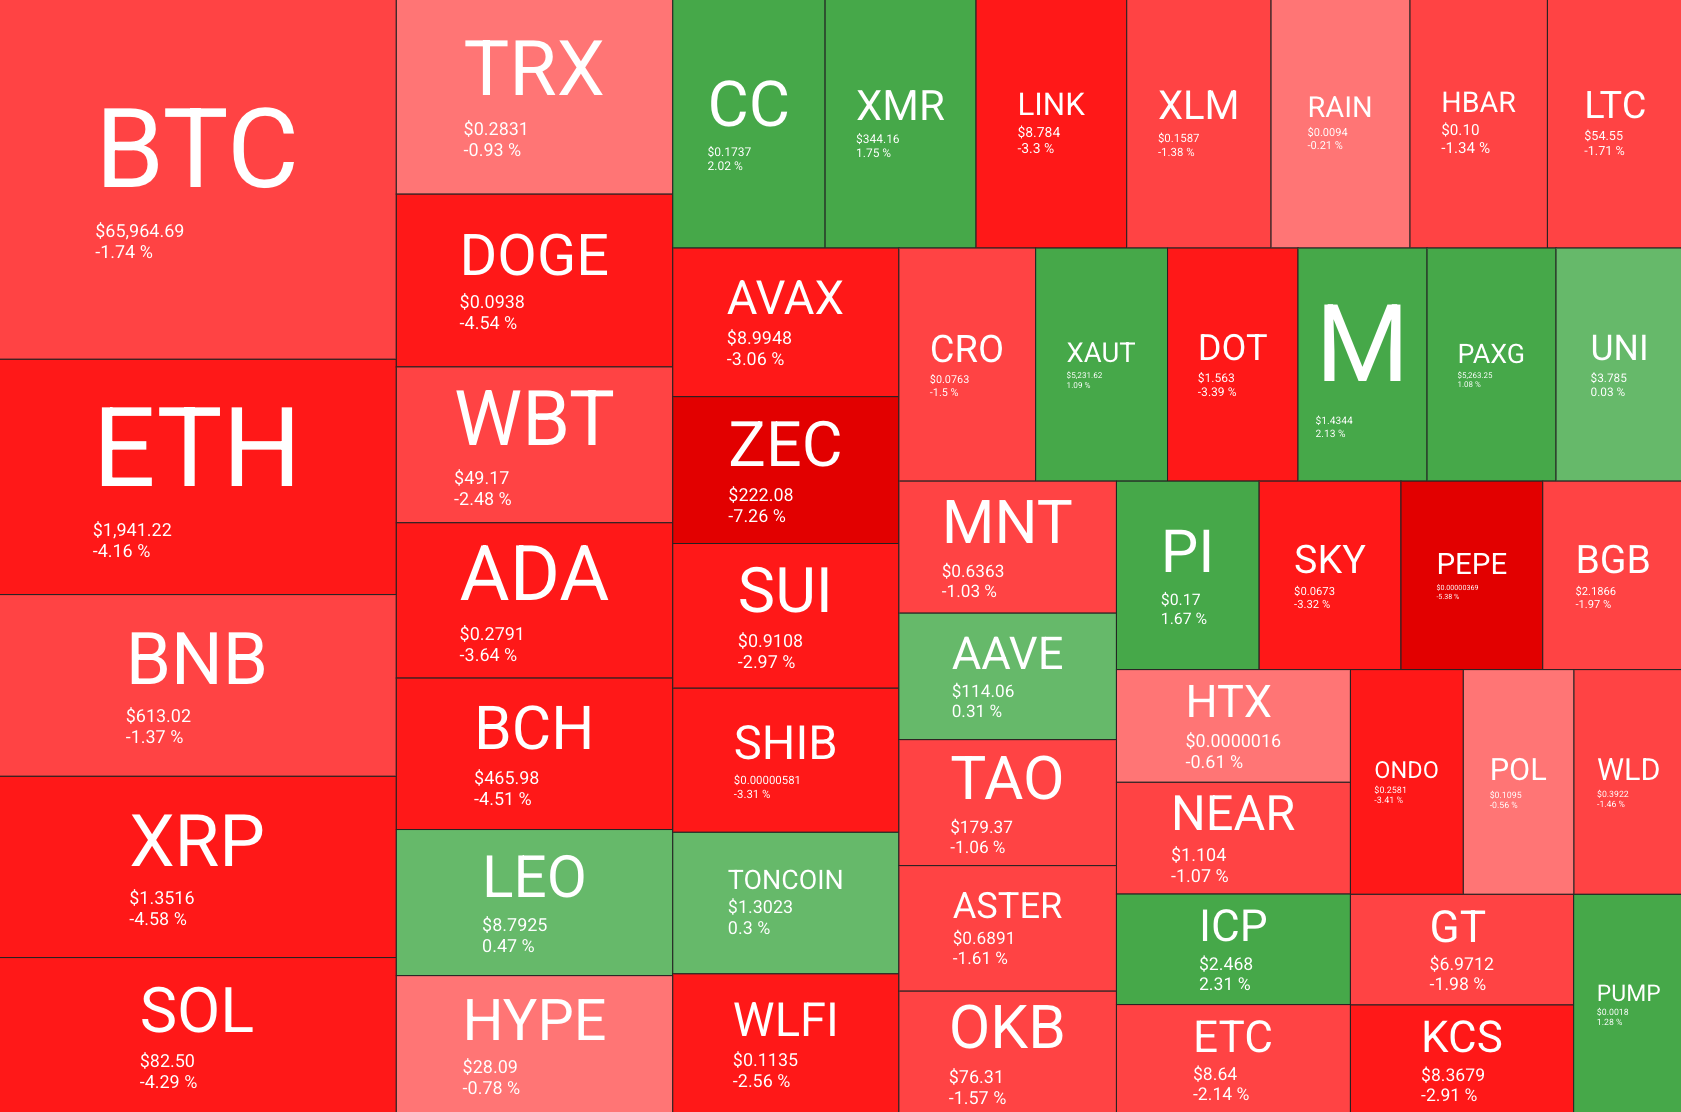
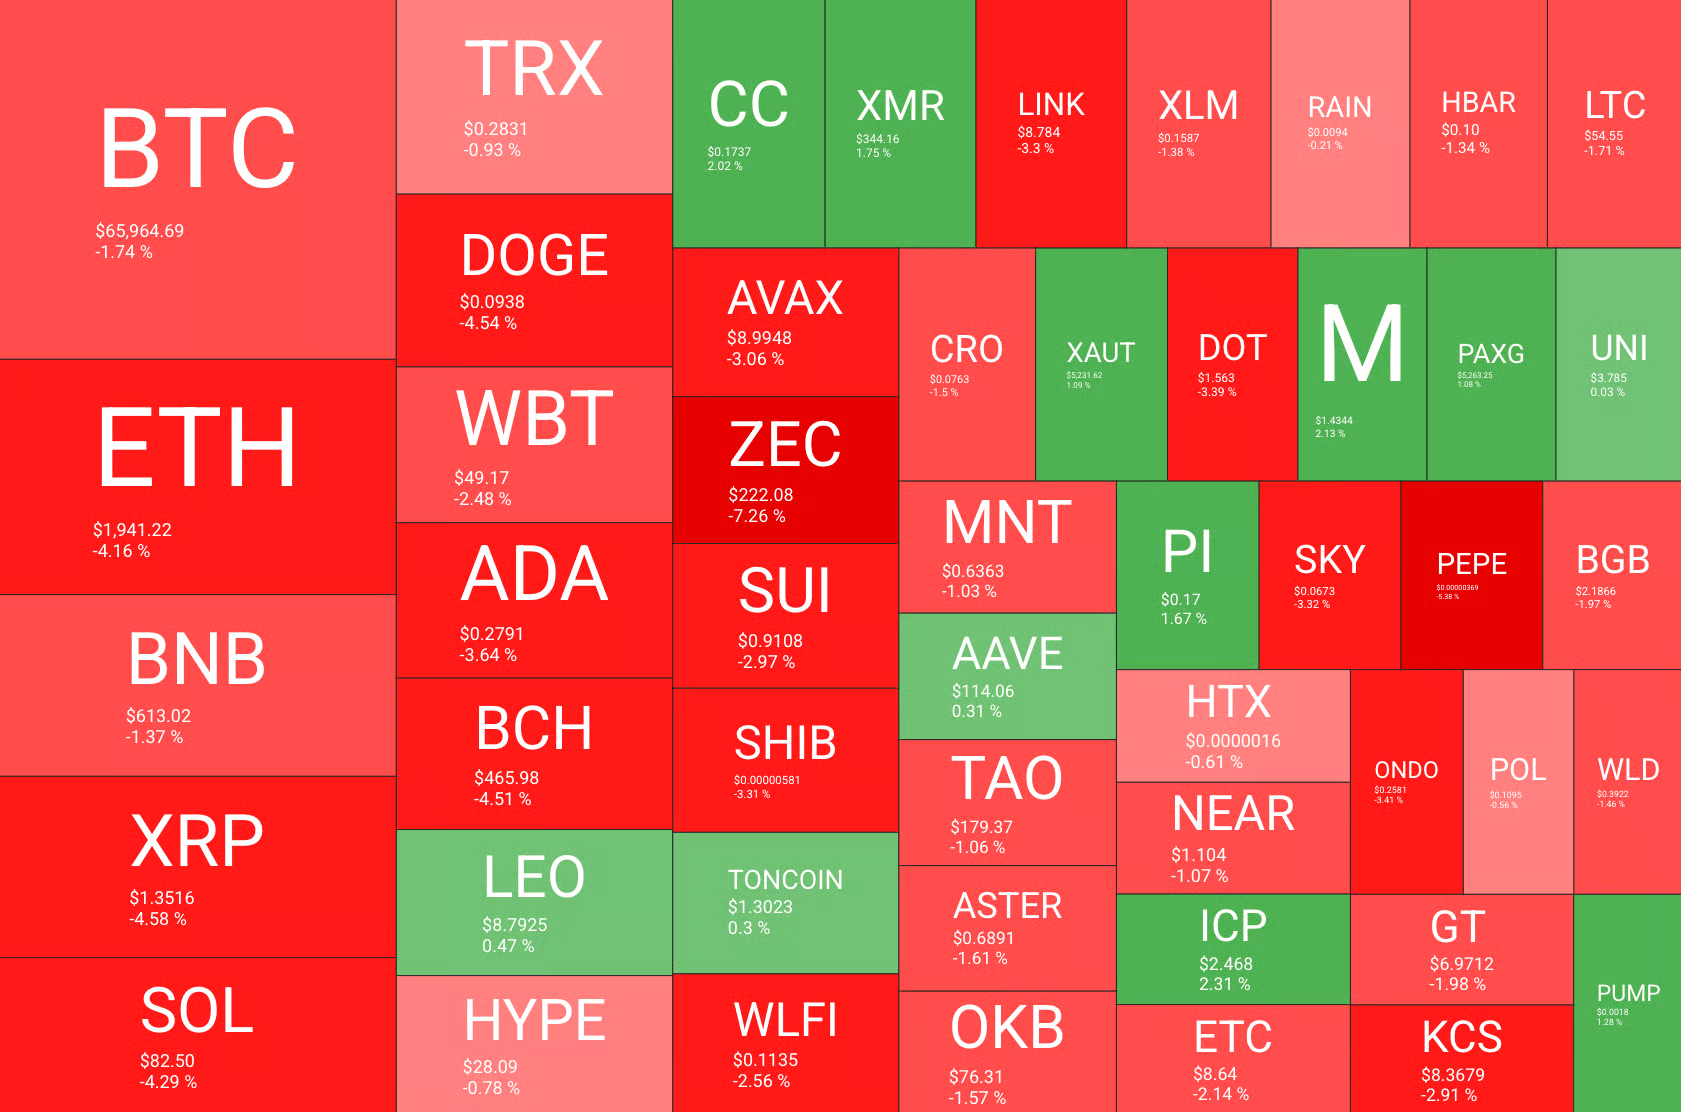
Market Cap: $2.35T | 24H Vol: $113B | BTC Dominance: 56.1%
You may also like:
BTC: $66,097 (-1.5%) | ETH: $1,947 (+0.2%) | XRP: $1.35 (-3.2%)
This Week’s Crypto Headlines You Can’t Miss
Bitwise CIO Matt Hougan Rejects Jane Street Blame for Bitcoin Dip. Matt Hougan, the chief investment officer at Bitwise, has dismissed claims that Jane Street is orchestrating Bitcoin’s ongoing downturn. Instead, he said that the current price action is typical of a “classic crypto winter.” Read more.
BSC Fees Hit Multi-Month Lows as History Signals Bitcoin Rebound Ahead. The Binance Smart Chain (BSC) saw its total fees paid drop to $593,000, which pretty much marks the network’s lowest usage cost since at least August 2025. Read more.
2026 US Midterms Emerge as Potential Turning Point for Crypto Markets. The 2026 US midterm elections are closing in. Many view them as a potential catalyst that’s tied to liquidity cycles in traditional financial markets, as well as a recovery in the broader cryptocurrency market. Read more.
Bitcoin’s Recovery Isn’t Here Yet – Here’s What Still Needs to Flip. Data shows that BTC remains trapped in a structurally defensive consolidation. This happens as the price oscillates between $60K and $90K. Therefore, for a recovery to start shaping, the price needs to push above the upper boundary. Read more.
Vitalik Buterin Exceeds 16,384 ETH Selling Target with $38M in Total Disposals. The co-founder of Ethereum (and likely the most prominent person behind it), Vitalik Buterin, is dumping ETH. In fact, he has exceeded his previously stated plan to sell 16,384 ETH by almost 20%. Read more.
Wall Street Is Going On-Chain, And Investors Still Don’t Get It, Says Bitwise CIO. According to the CIO of Bitwise, investors often misinterpret what is truly happening in the market due to behavioural biases and think that Wall Street is already going on-chain. Read more.
Charts
This week, we have a chart analysis of Ethereum, Ripple, Cardano, Binance Coin, and Hyperliquid – click here for the complete price analysis.
Binance Free $600 (CryptoPotato Exclusive): Use this link to register a new account and receive $600 exclusive welcome offer on Binance (full details).
LIMITED OFFER for CryptoPotato readers at Bybit: Use this link to register and open a $500 FREE position on any coin!

Major US Bank SoFi now supports Solana network deposits. This means 13.7 million users of the bank can send SOL directly to their SoFi crypto accounts from external wallets.
The US-chartered bank announced the update on X, stating users can buy, sell and hold SOL inside the SoFi app.
Major Solana Access For US Banking Customers
In practice, SoFi is enabling direct on-chain deposits for a major public blockchain within a regulated national bank. Users can manage balances alongside checking, savings and other financial products in a single interface.
The move expands SoFi’s digital asset offering beyond simple brokerage-style exposure. It connects a traditional bank charter with a live blockchain network, which remains rare among nationally chartered US banks.
An Important US Access for Solana
SoFi began as a student loan refinancing platform in 2011 and later secured a national bank charter. It has grown into a mid-sized US bank with more than $50 billion in assets and tens of billions in deposits.
While far smaller than Wall Street giants, it ranks among the larger digital-first banks in the country.
The company’s brand extends beyond finance. SoFi holds naming rights to SoFi Stadium in Inglewood, California.
The venue hosted Super Bowl LVI in 2022 and WrestleMania 39 in 2023. It is also scheduled to host multiple matches during the 2026 FIFA World Cup and will play a central role in the 2028 Los Angeles Olympics.

Against that backdrop, adding Solana deposits signals deeper integration between US banking infrastructure and public blockchains.
It allows regulated bank customers to move assets directly on-chain while staying inside a traditional banking framework.

XRP price has fallen nearly 40% since January 5, dropping from $2.35 to around $1.40. Moves of this size usually trigger panic selling and long-term damage to market structure. But this time, something very different happened.
Instead of accelerating the decline, one holder group stayed calm, while another, less enterprising, group quietly left. At the same time, leverage remained balanced and institutional flows stayed positive. Together, these signals suggest XRP’s crash may have strengthened its foundation rather than broken it.
Speculative Holders Collapsed — Removing the Biggest Source of Selling Pressure
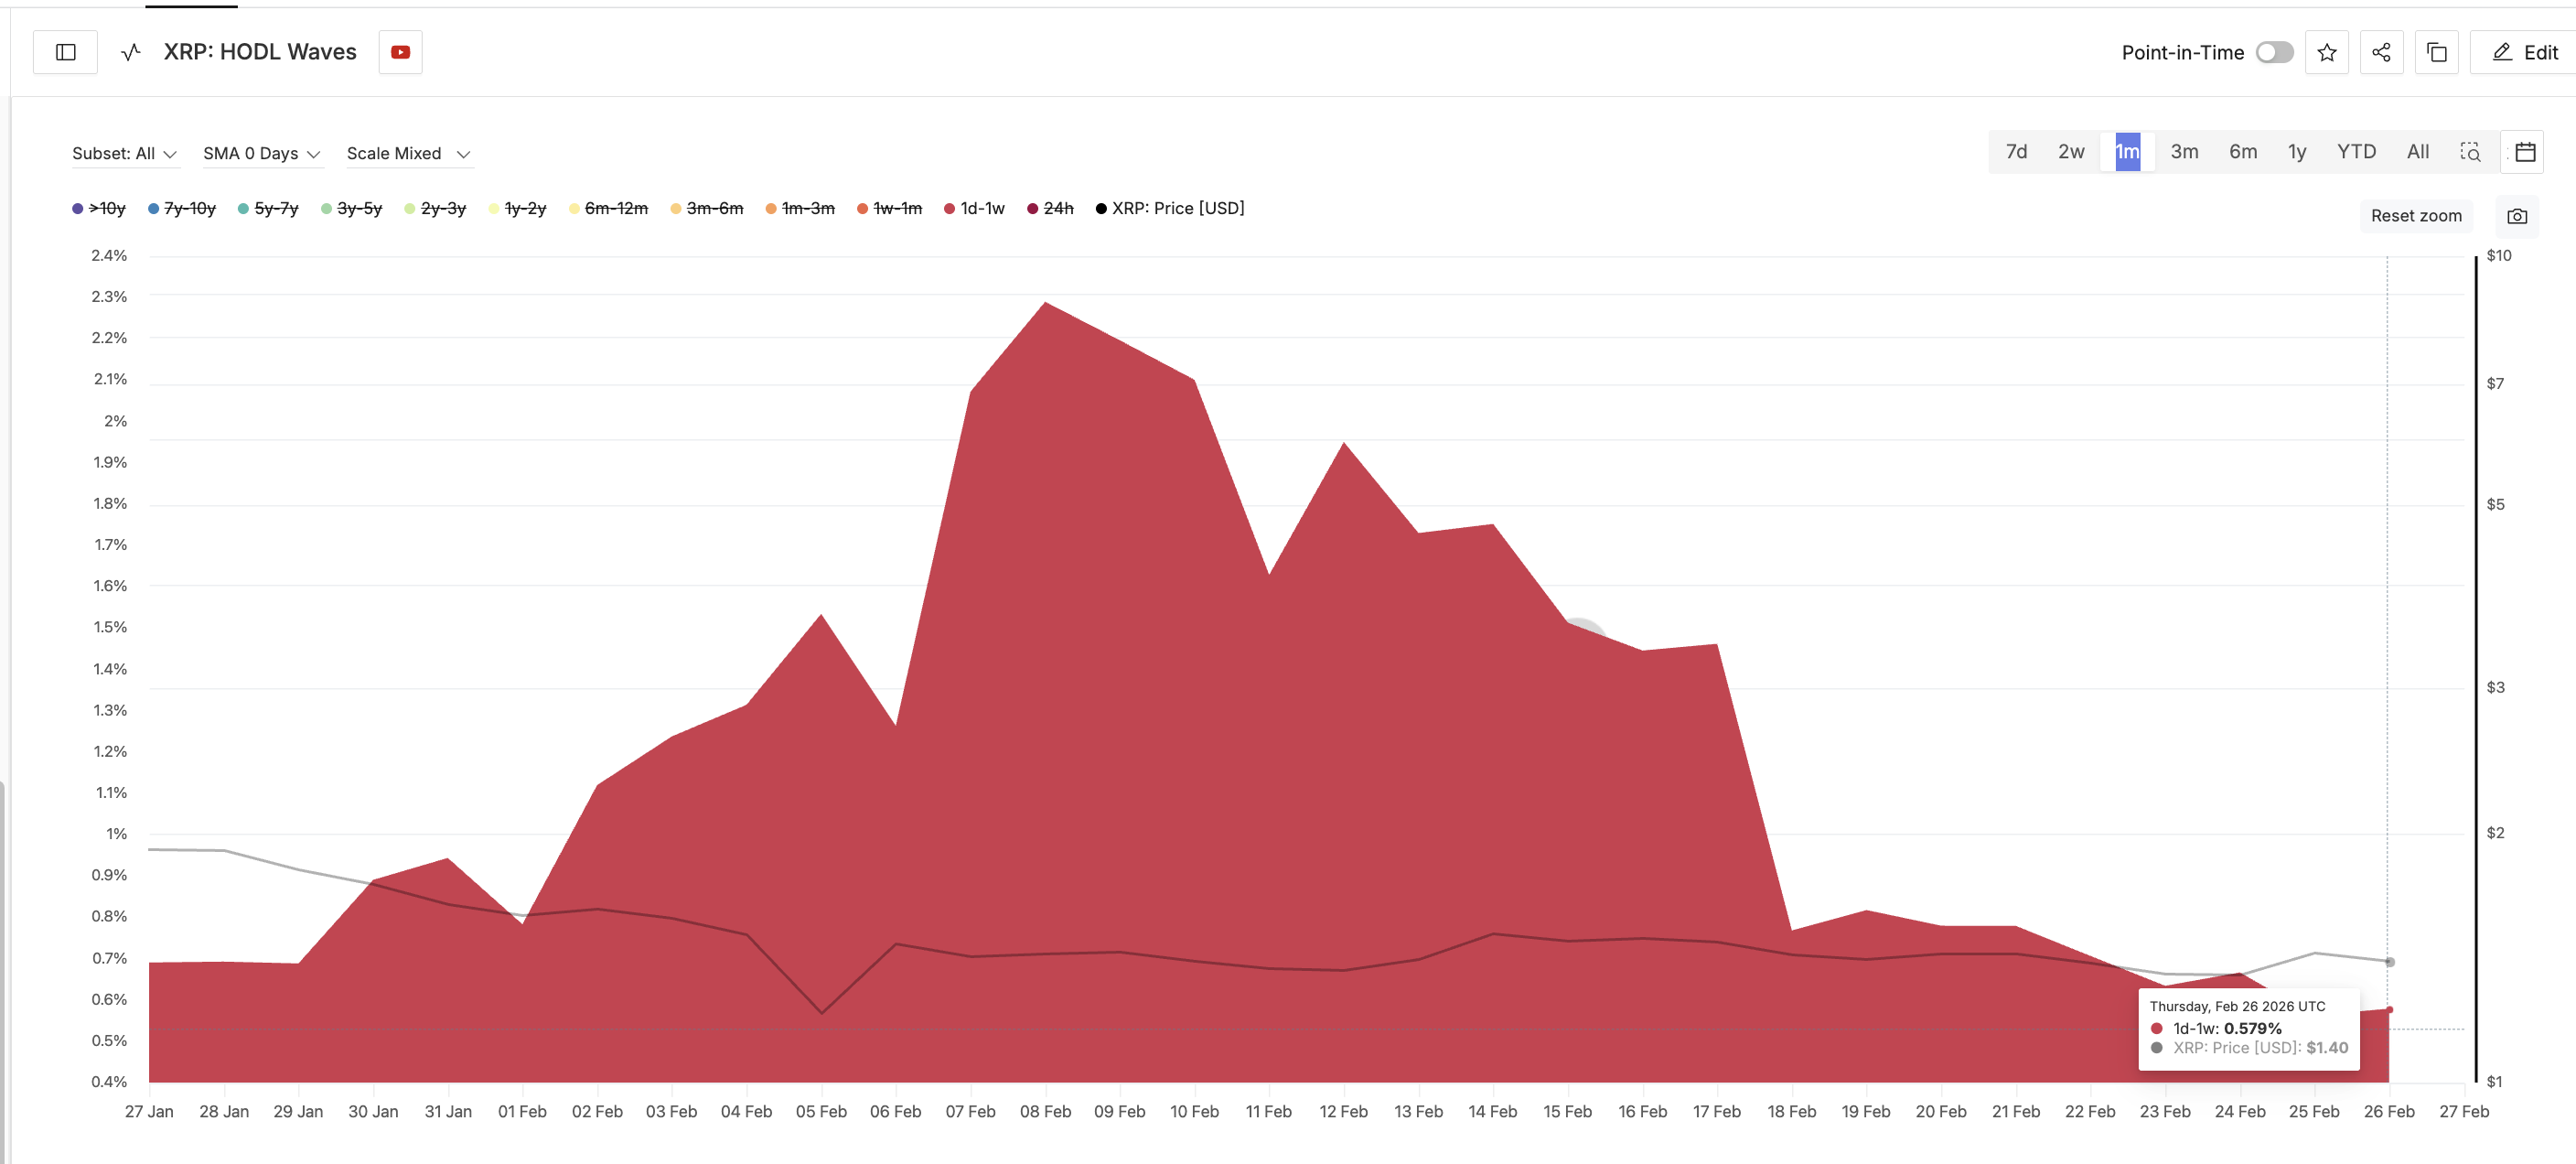
One of the most important changes during XRP’s decline was the exit of speculative holders, as measured by the HODL Waves metric, which segments cohorts by time. These are short-term traders who typically hold for one day to one week and tend to sell quickly during volatility.
On February 8, these short-term holders controlled 2.29% of XRP’s total supply. By February 26, that figure had fallen sharply to just 0.579%. This represents a 74.7% decline in speculative supply share in less than three weeks. All while the price declined.
Want more token insights like this? Sign up for Editor Harsh Notariya’s Daily Crypto Newsletter here.
This kind of flush is important because speculative holders often create continuous selling pressure during rebounds. Their exit removes an unstable supply, allowing the price to stabilize. In simple terms, weak hands have already left. This reduces the risk of panic-driven crashes during future pullbacks.
But removing weak holders alone does not create strength. The more important question is whether strong holders also stayed.
Long-Term Holders Held Firm, Even as XRP Price Lost 40%
While XRP price collapsed, long-term holders behaved very differently.
The Hodler Net Position Change metric tracks whether investors holding for at least 155 days are buying or selling over a 30-day period. These holders are often considered the most informed participants because they typically accumulate during weak markets.
On January 5, when XRP traded near $2.35, long-term holders had added around 47.3 million XRP on a rolling monthly basis. By February 26, after XRP had dropped to around $1.40 (a 40% dip), their net position change had risen dramatically to approximately 145.45 million XRP, a 200% rise.
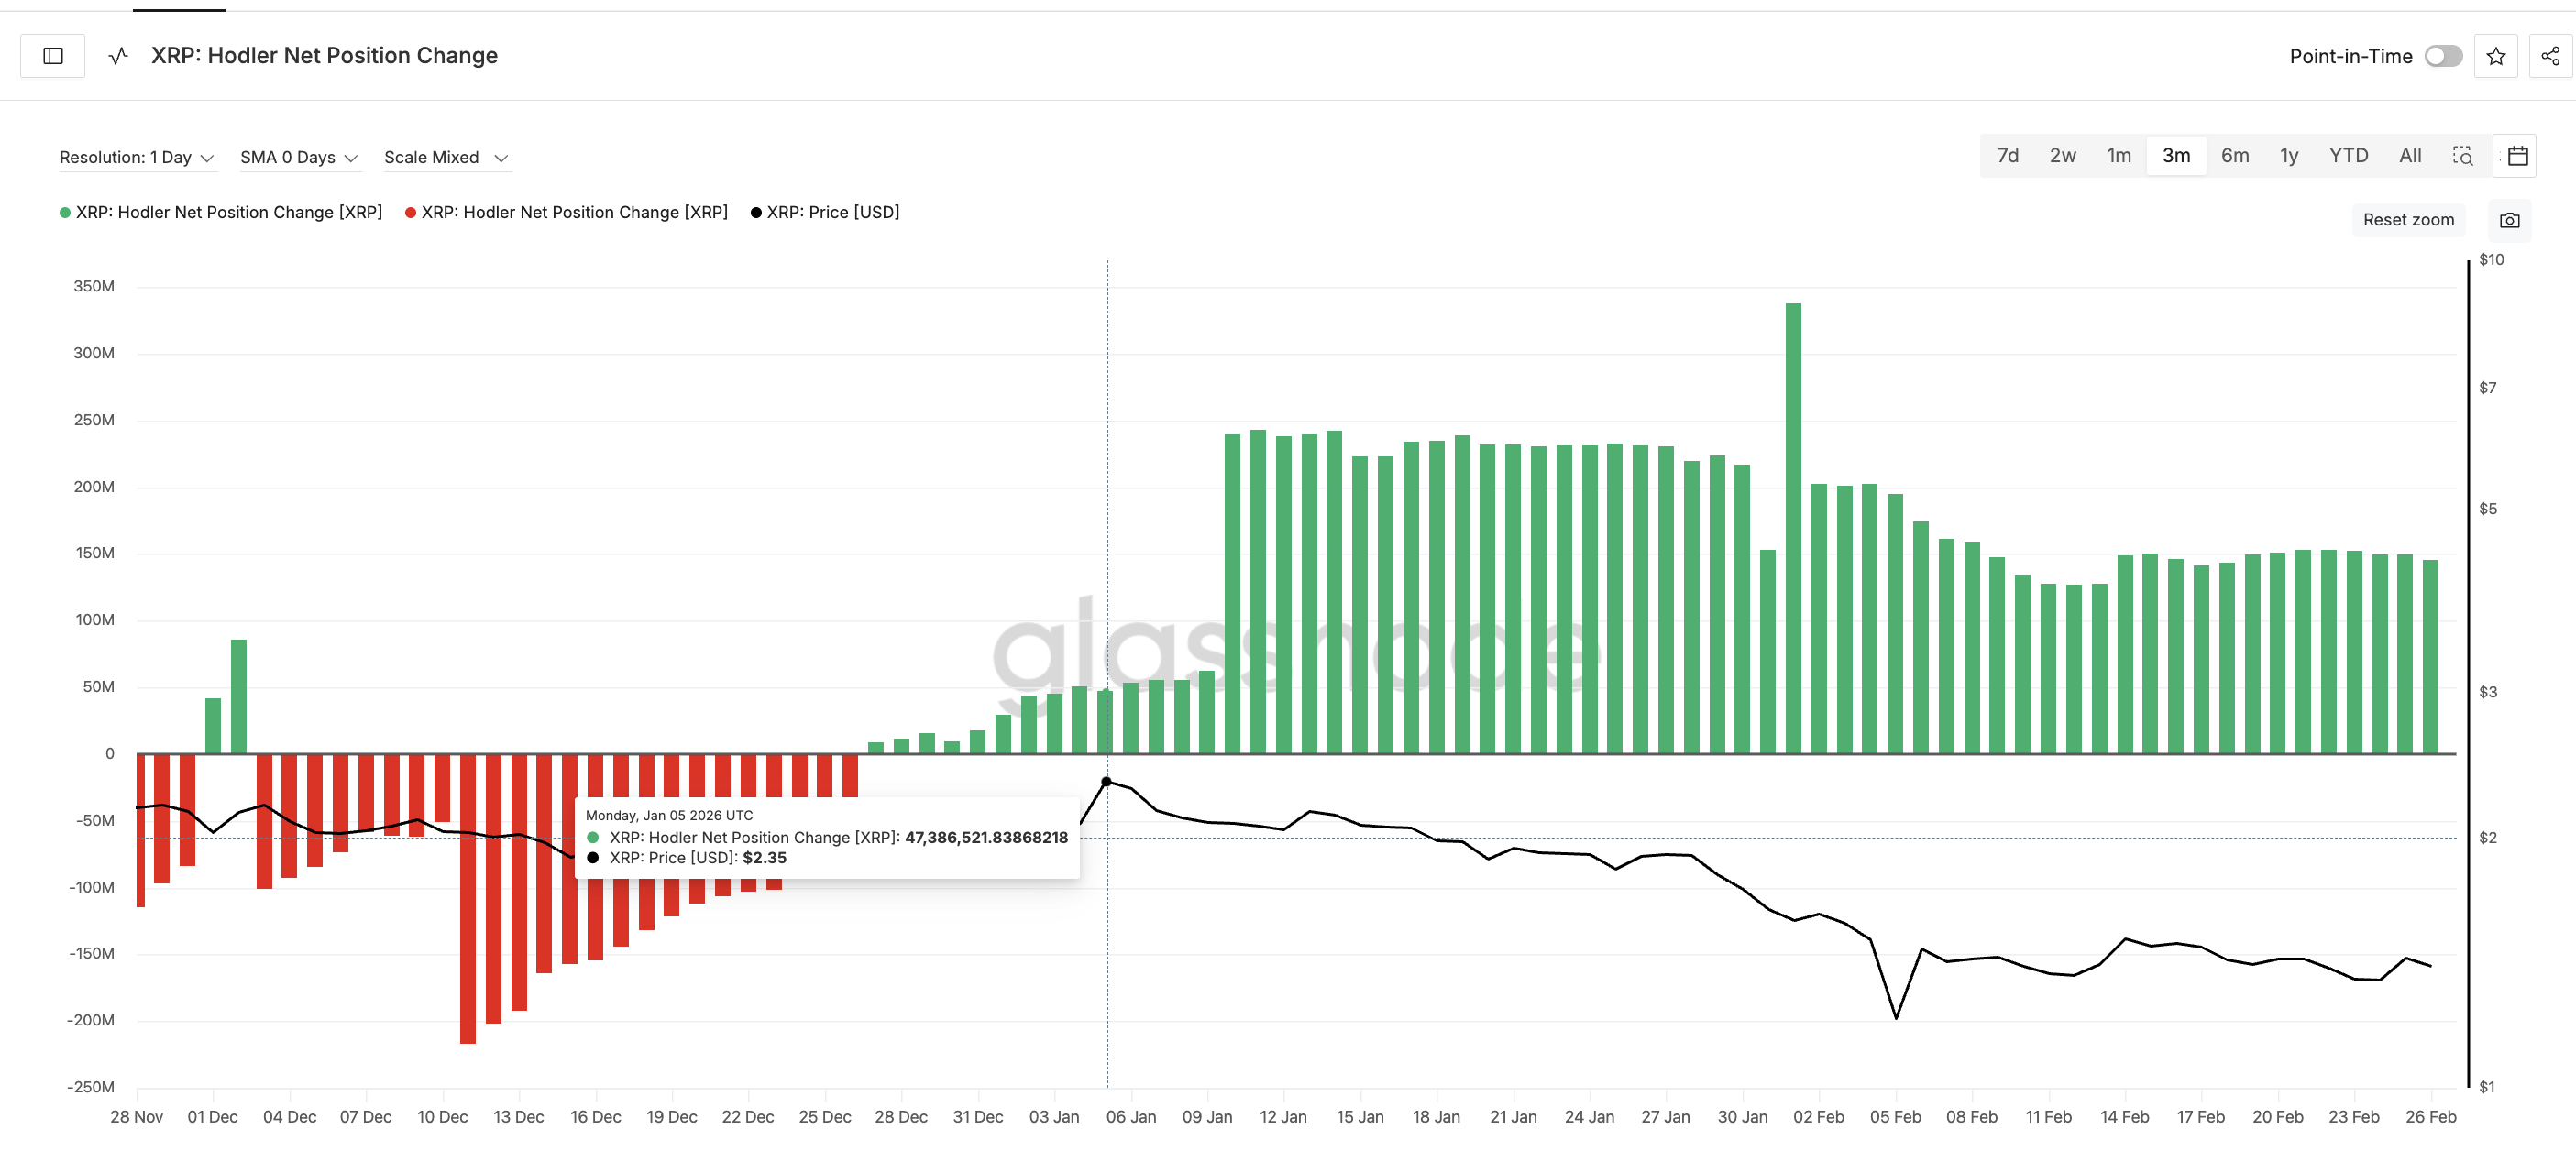
This means the largest and most patient holders increased exposure while price collapsed — the exact opposite of panic behavior.
More importantly, since mid-February, their holdings have remained steady even as XRP fluctuated between $1.21 and $1.52. They did not reduce exposure during volatility. This stability sends a strong signal. It suggests that the investors with the highest conviction are not treating the crash as a reason to exit. Instead, they appear to be positioning for future recovery.
This creates a stronger holder base. But price stability also depends heavily on derivatives positioning.
XRP’s Balanced Leverage Weakens The Biggest Crash Risk
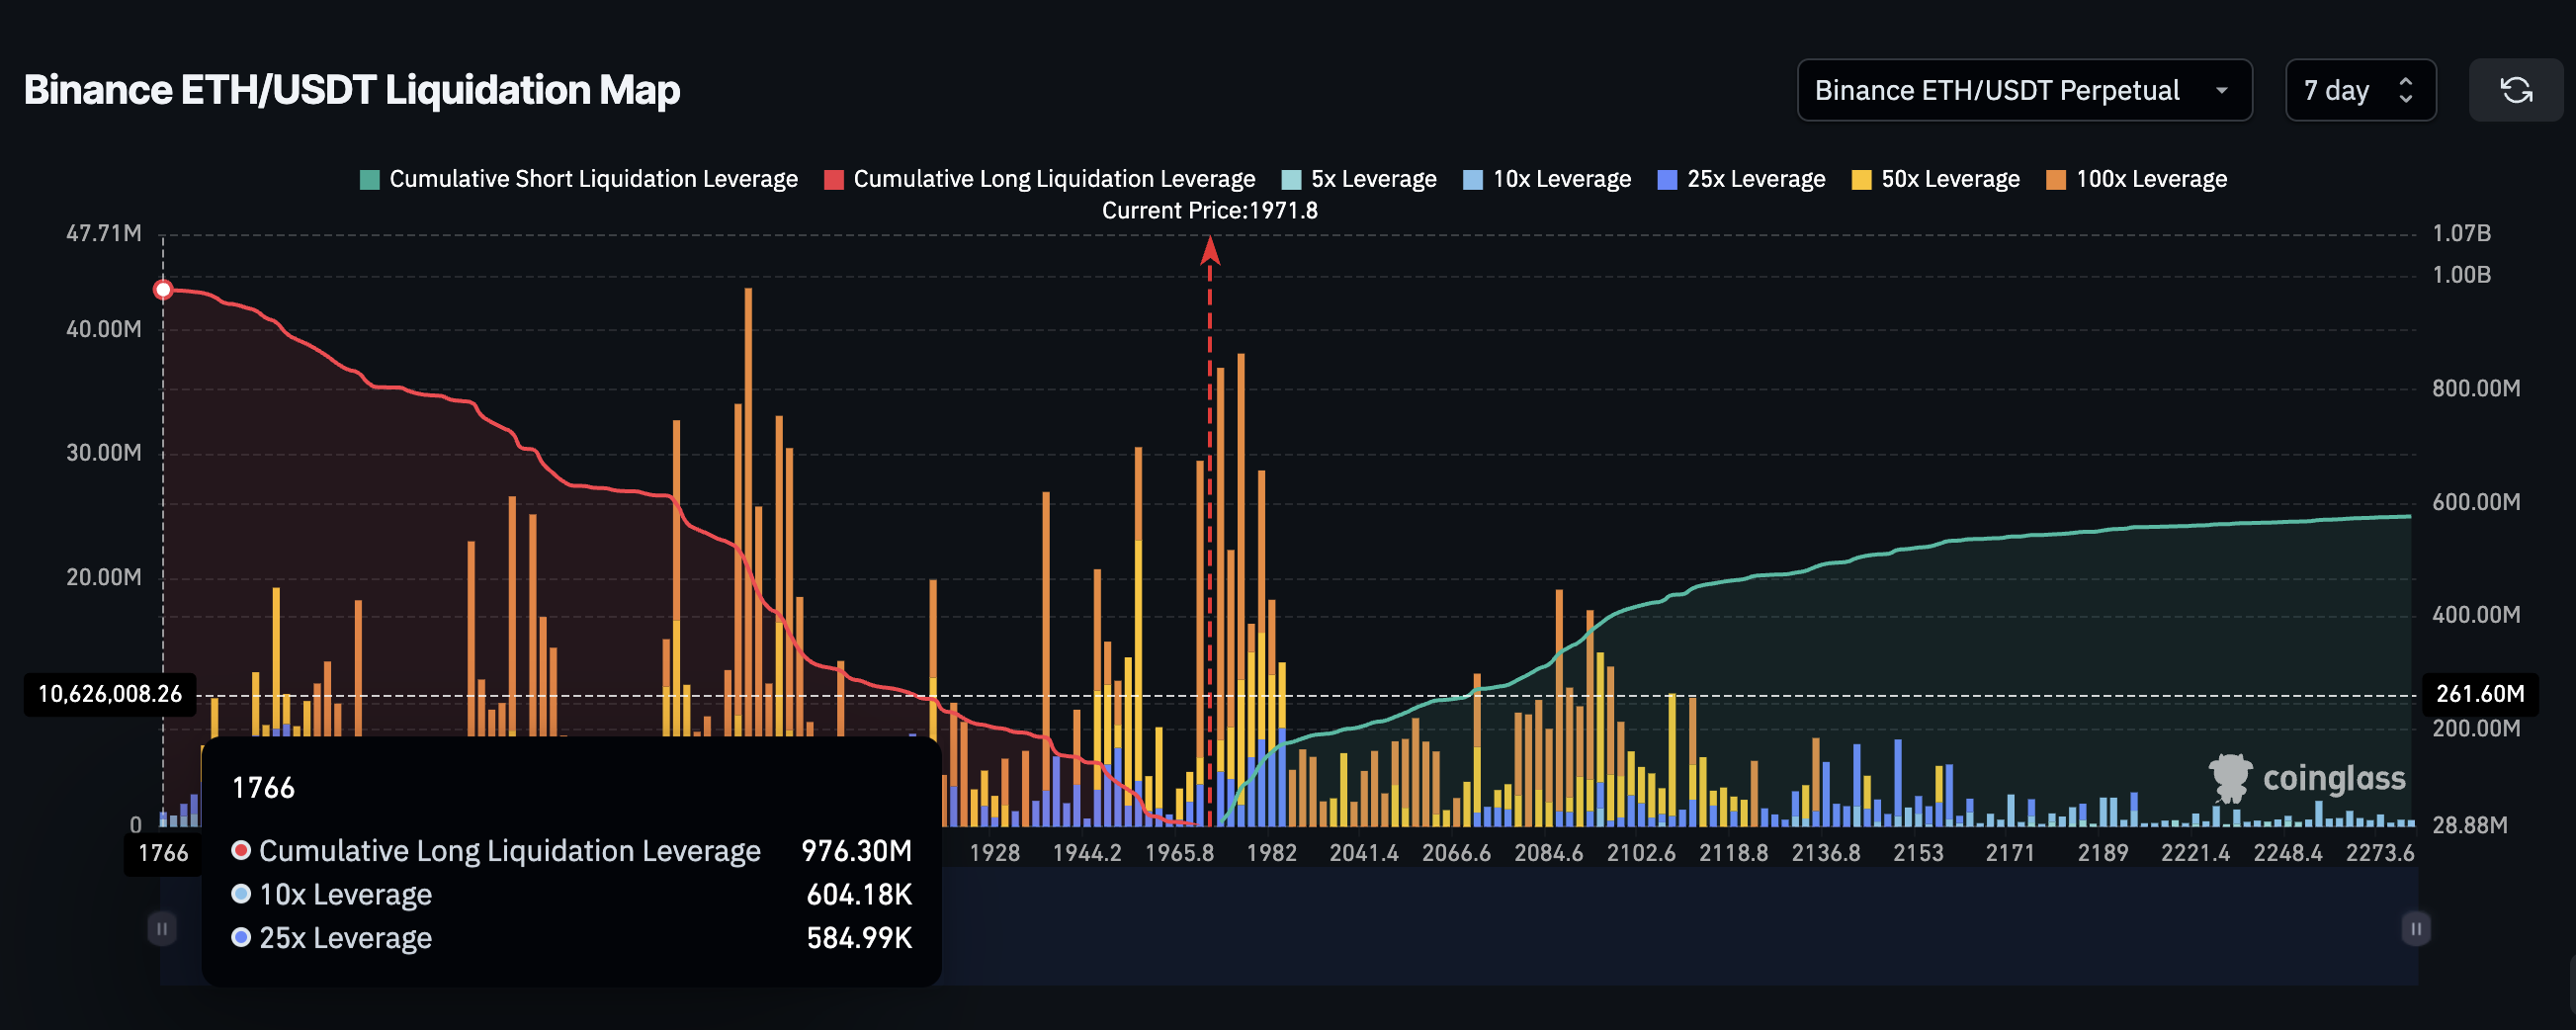
One of the main reasons crypto crashes accelerate is excessive leverage imbalance. When too many traders take the same position, forced liquidations amplify price moves.
Ethereum currently shows this risk clearly. On Binance’s ETH/USDT perpetual contracts, long leverage stands near $976 million compared to $576 million in shorts. This creates heavy downside liquidation risk if the price falls.
XRP’s positioning looks very different.
On Binance, XRP’s perpetual contracts show approximately $74.93 million in long leverage and $69.14 million in short leverage. This is almost perfectly balanced, in the same timeframe as ETH.
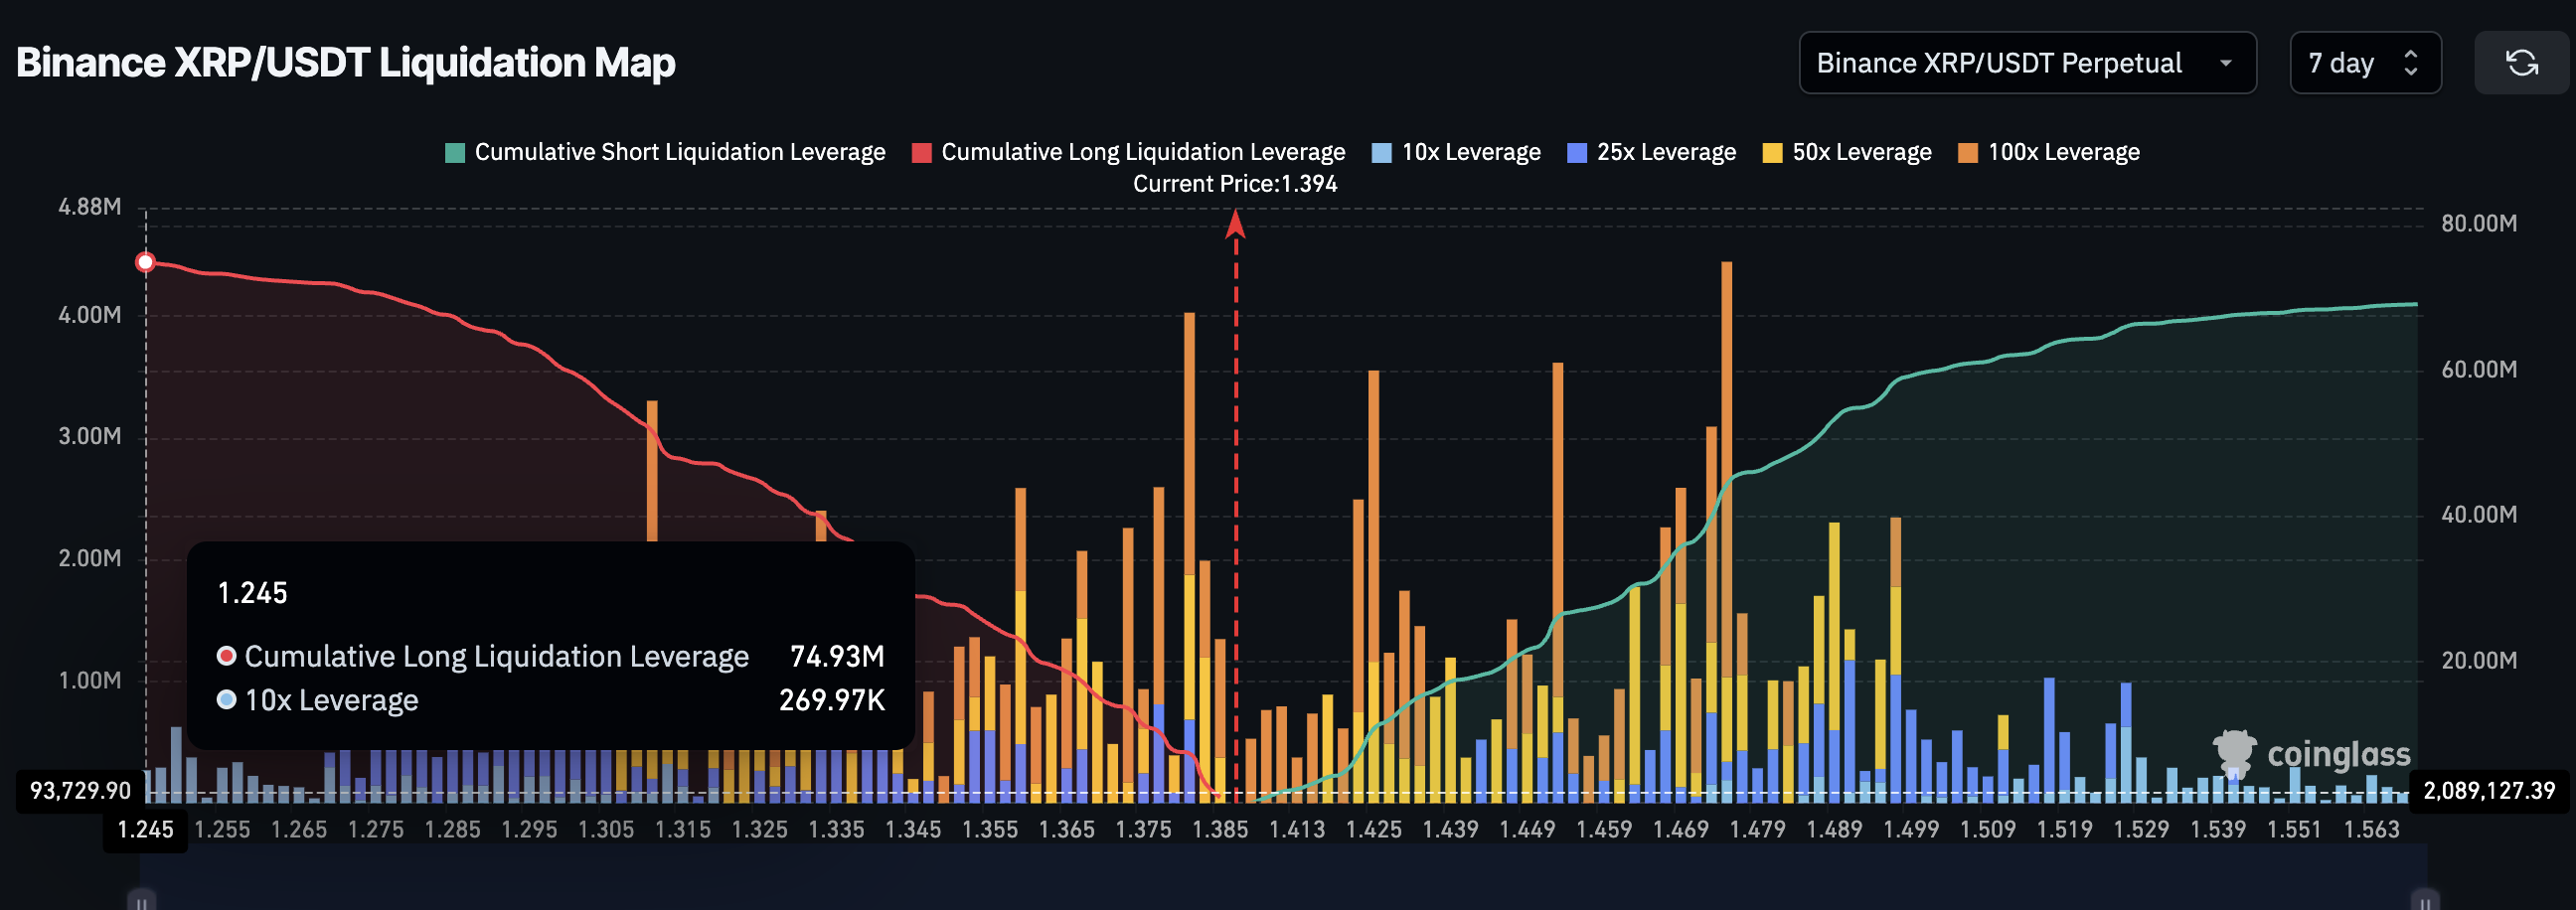
This balance is important. It means XRP does not have a large cluster of overleveraged buyers that could be wiped out during a drop. At the same time, it also avoids overcrowded short positioning that could destabilize the price.
Balanced leverage creates a healthier structure. It allows price to move based more on real demand instead of forced liquidations. This healthier positioning is also appearing in institutional flows and technical structure.
Institutional Flows and XRP Price Structure Now Open the Path Toward $1.70
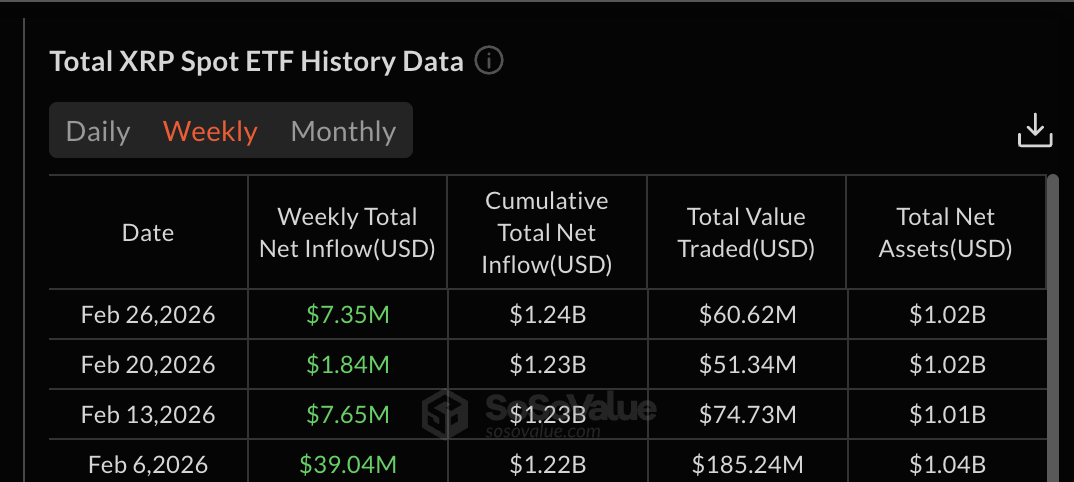
While many major crypto assets experienced weak ETF demand in February, XRP-related investment products continued attracting steady inflows. This shows institutional participation did not collapse during XRP’s decline. There were no major net outflow weeks recorded in XRP-linked investment products
Institutional inflows are important because they represent longer-term capital. Unlike speculative traders, institutions do not usually react to short-term volatility. Their steady participation helps stabilize markets during uncertain periods.
Combined with strong holder behavior and balanced leverage, this strengthens XRP’s recovery foundation. These structural improvements are now aligning with a key technical setup.
On the 8-hour chart, XRP appears to be forming a cup-and-handle pattern. This is a bullish continuation structure that often appears before upward breakouts. The handle formed after XRP corrected about 7% from its recent February 25 high, creating a consolidation zone.
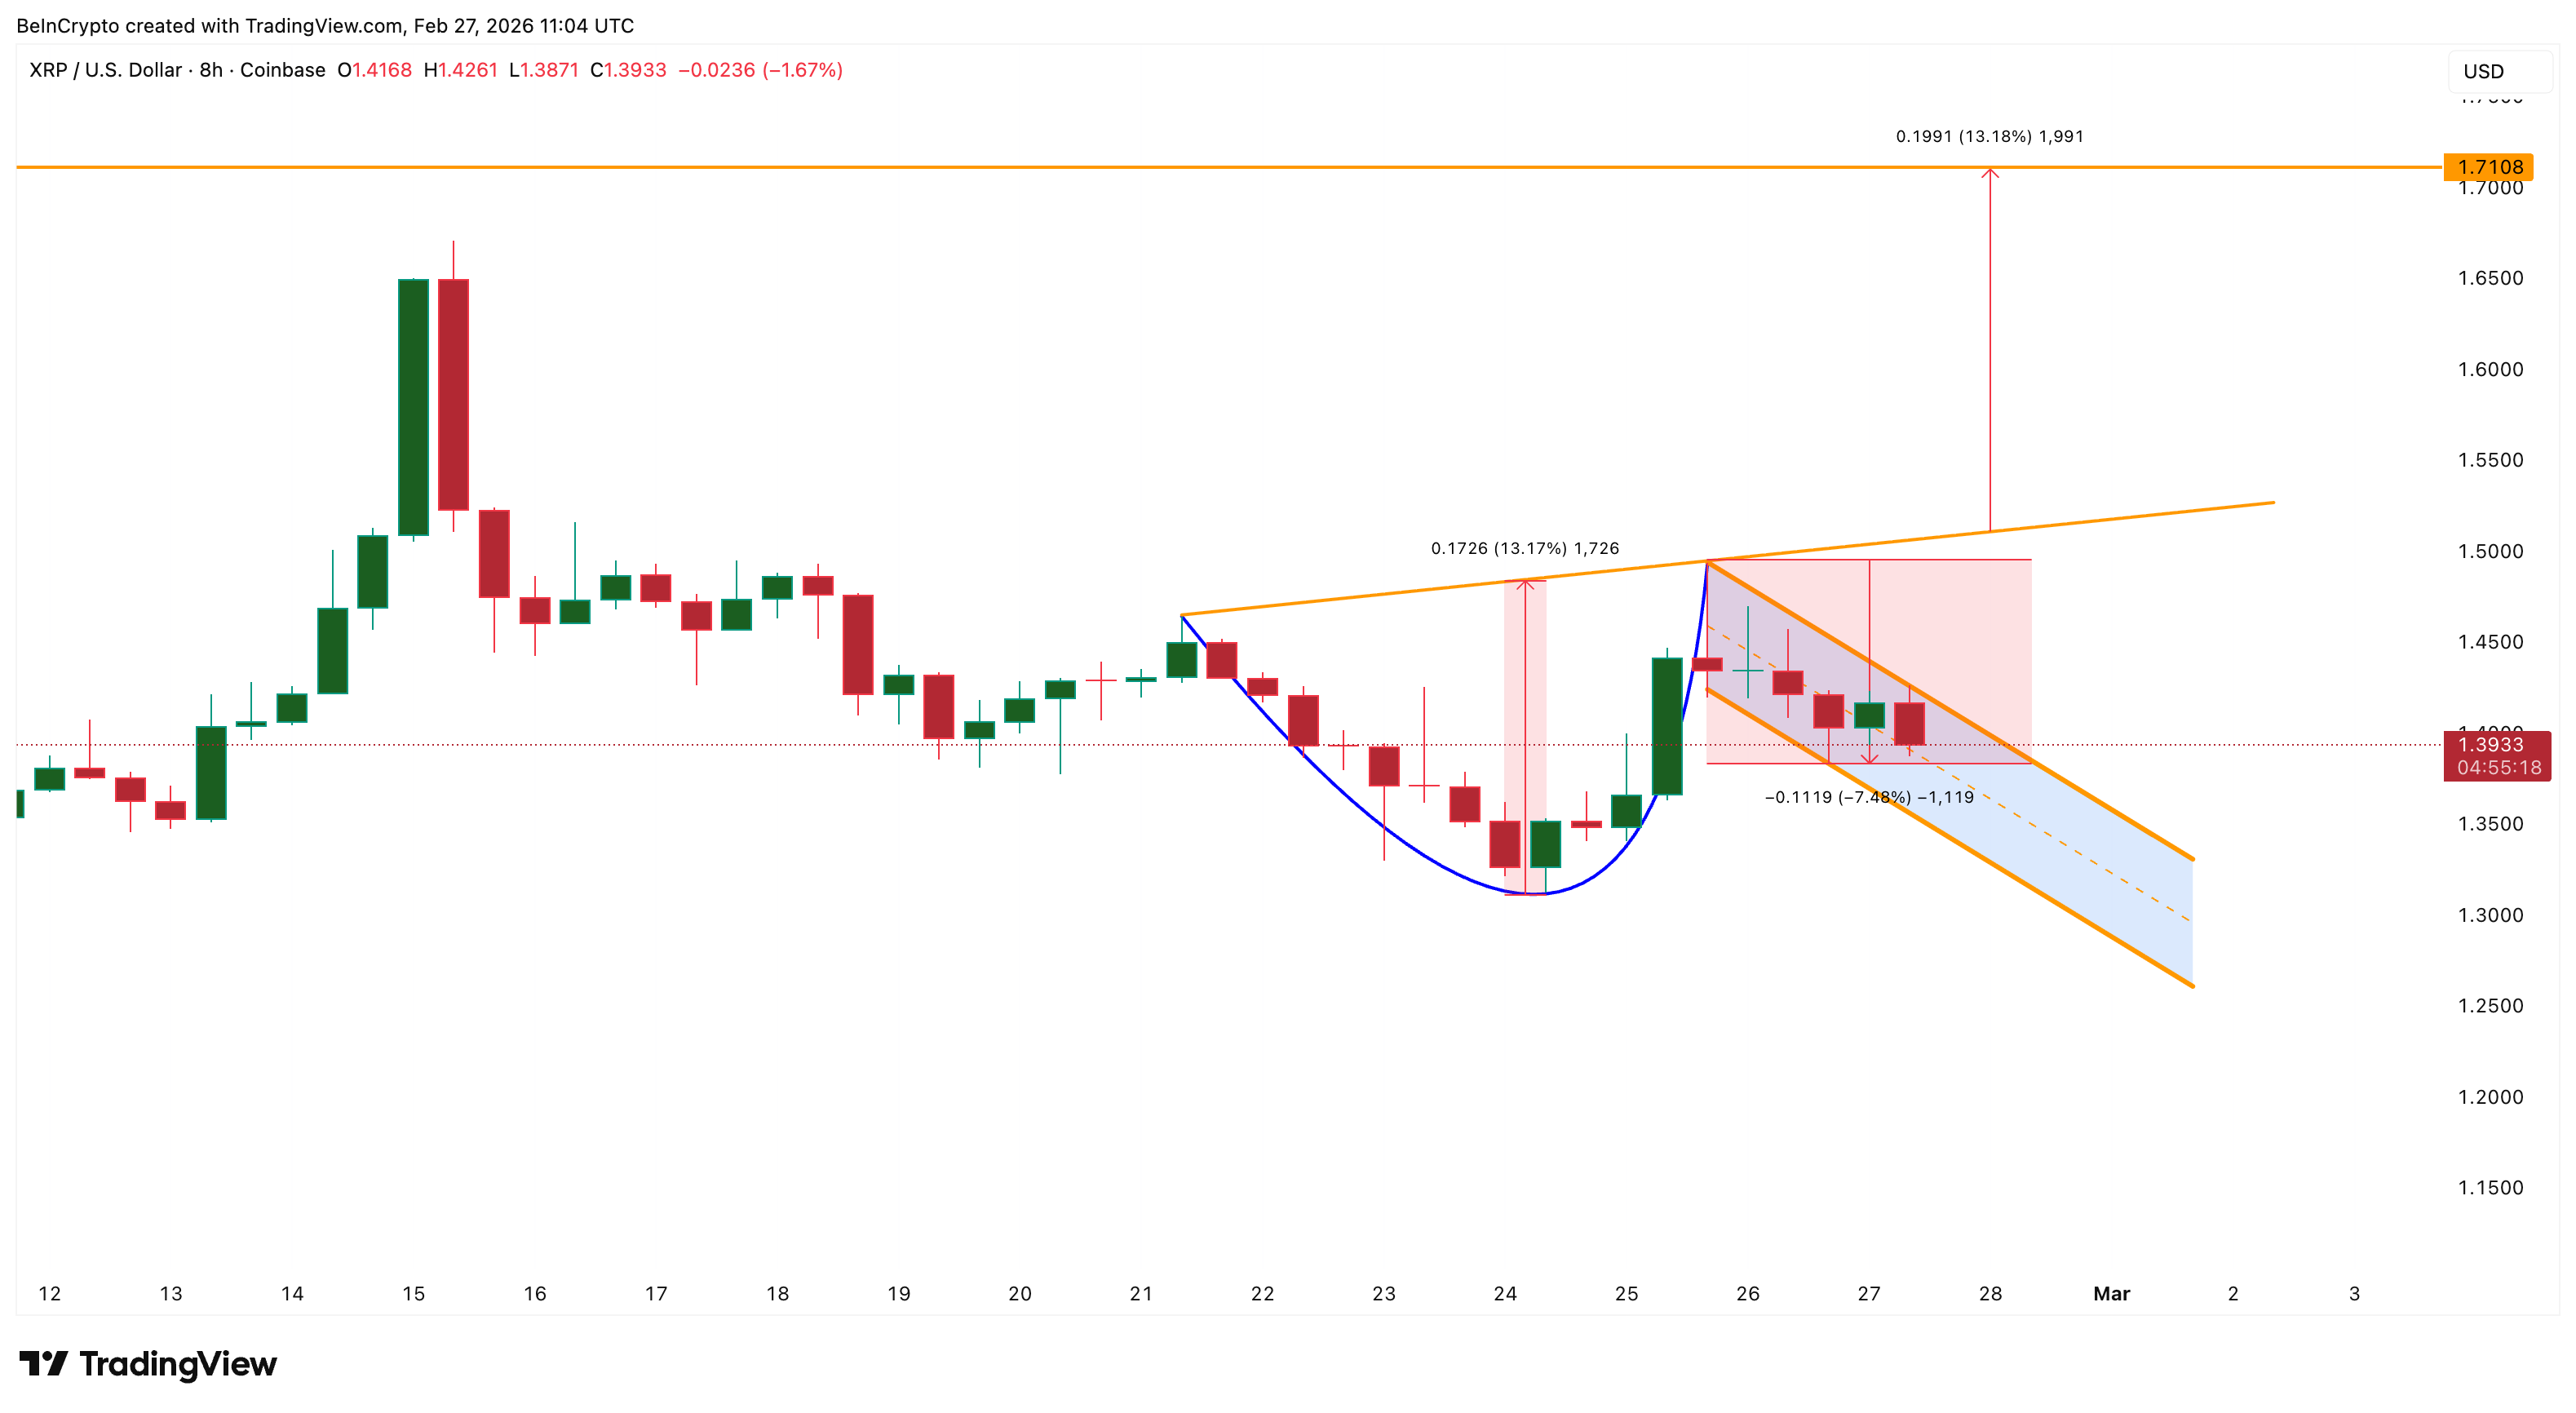
This structure now defines the key levels ahead. If XRP holds above $1.38, the bullish structure remains intact. A drop below this level would weaken momentum.
A move below $1.31 would invalidate the bullish pattern completely. On the upside, XRP must first break above $1.42 to confirm the handle breakout. The more important breakout level sits at $1.52, which sits near the neckline of the cup-and-handle pattern.
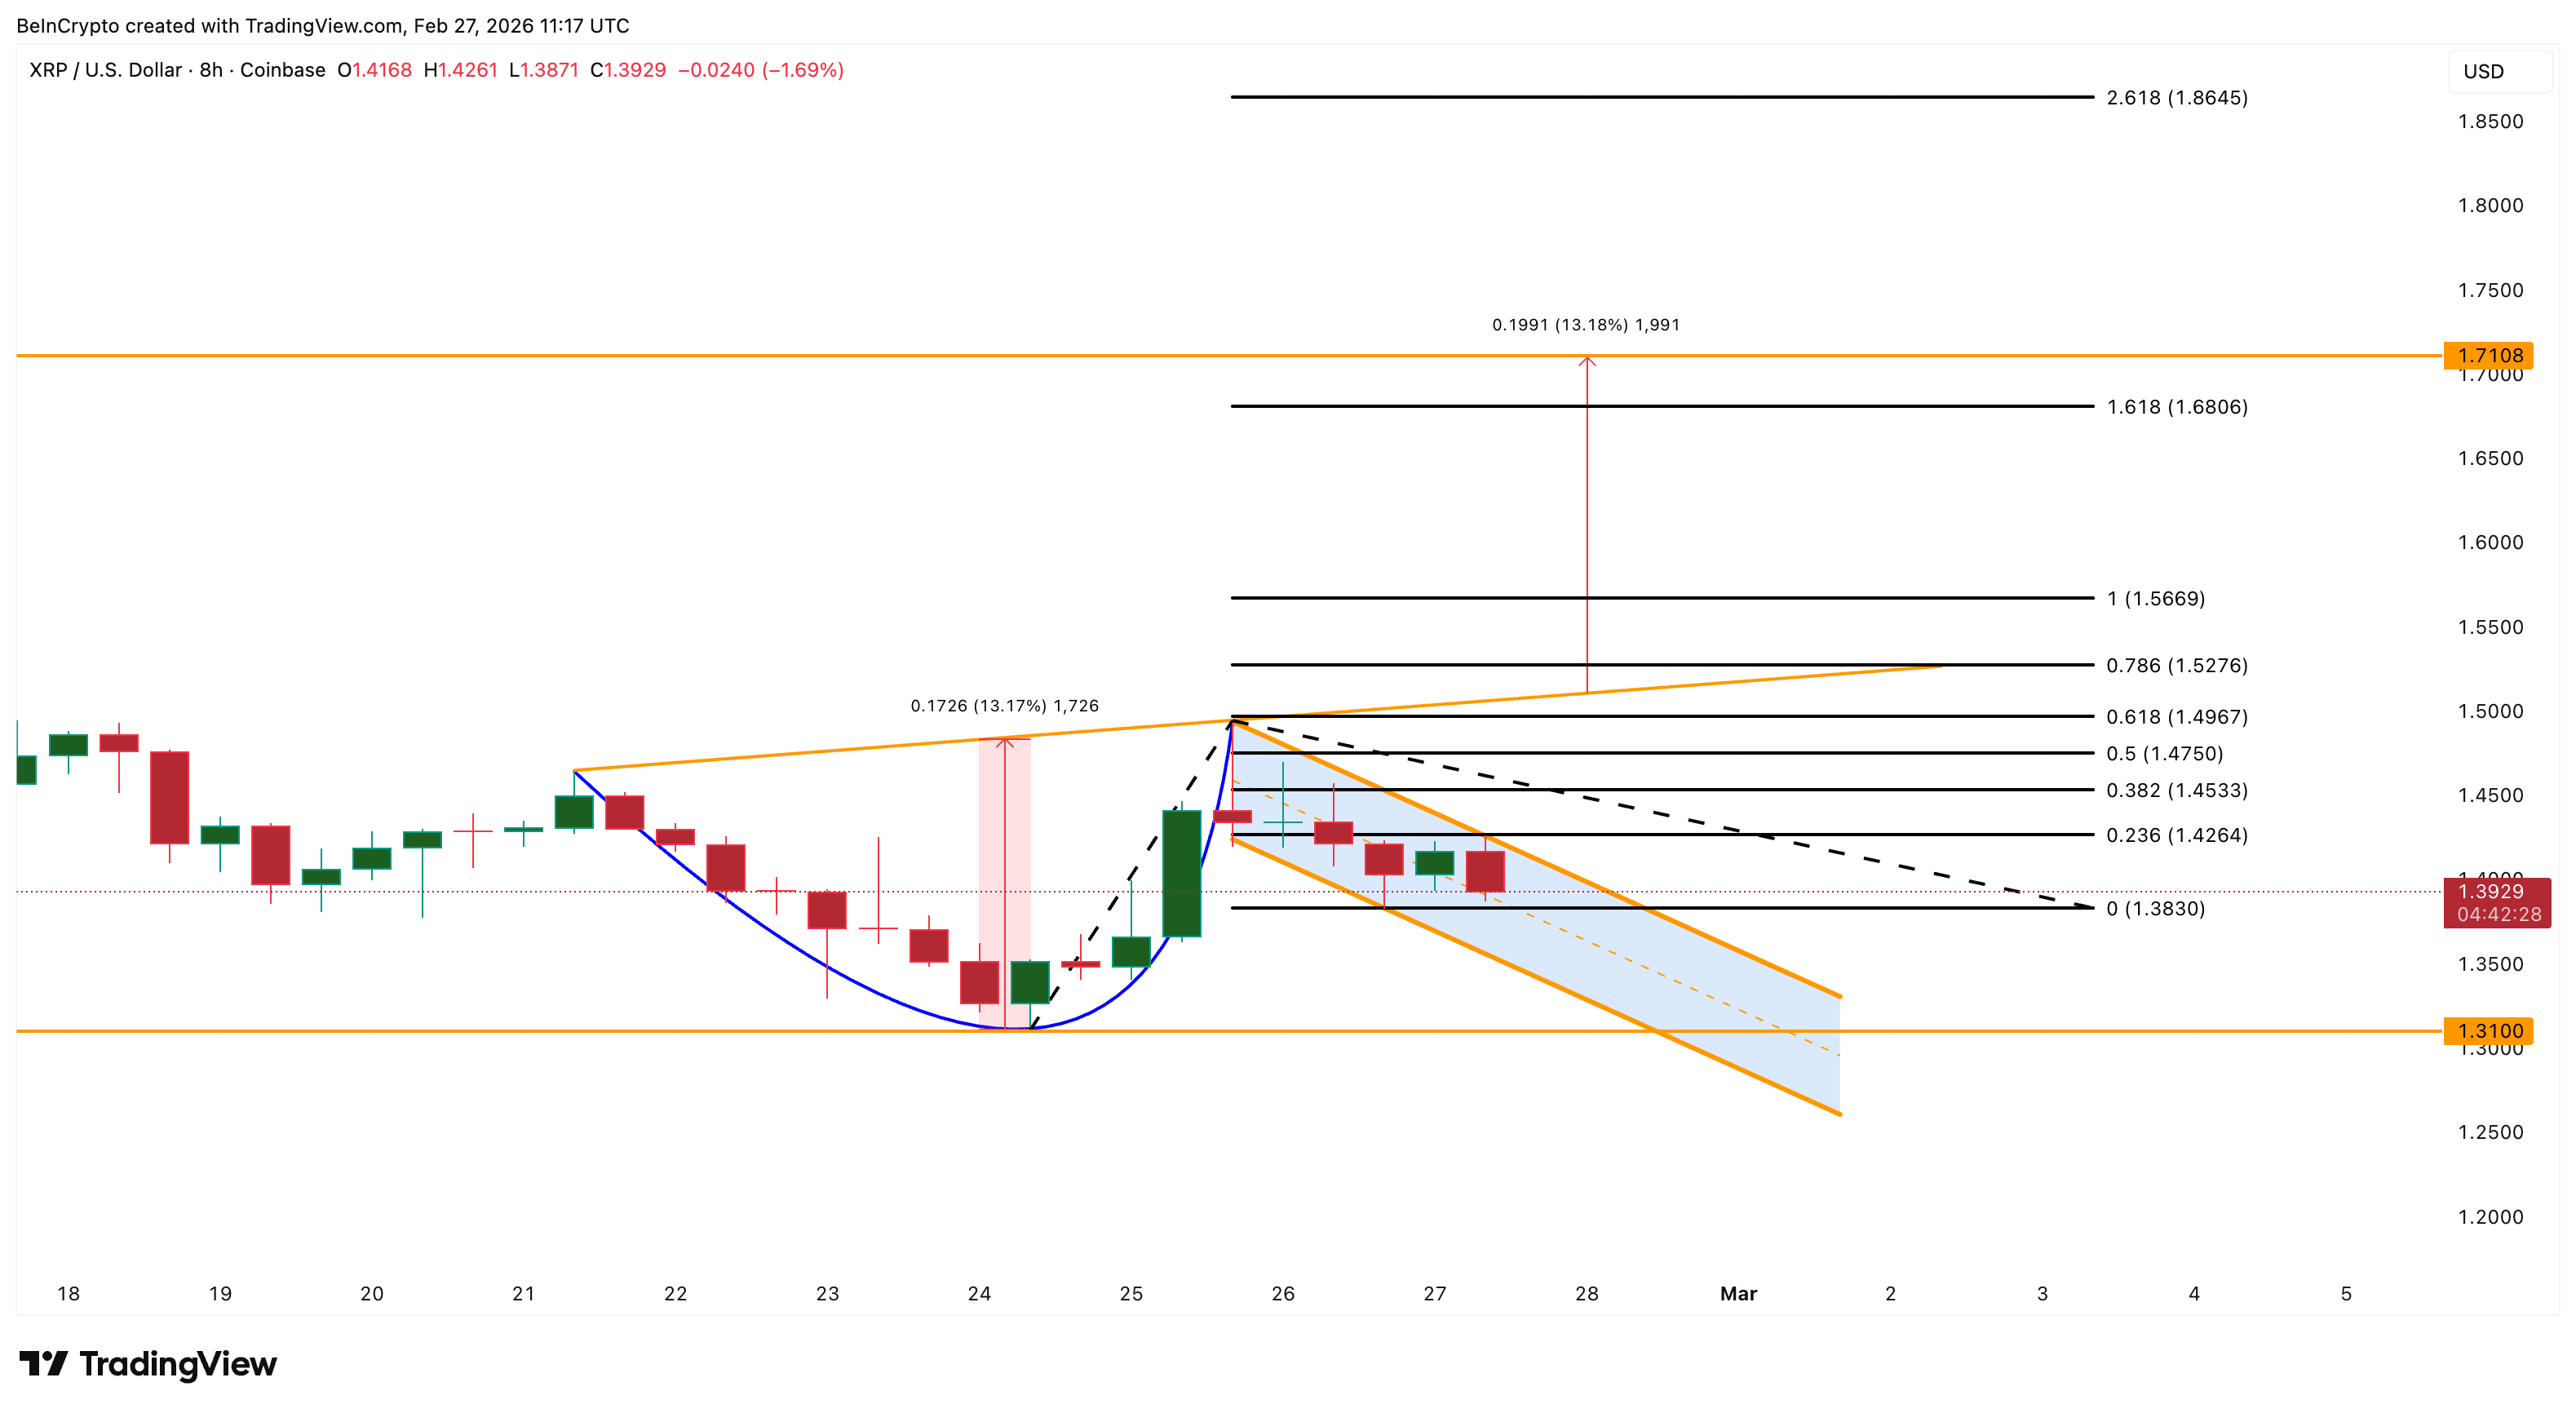
If XRP breaks above $1.52, the technical projection points toward approximately $1.71 (the $1.70 zone). In stronger breakout scenarios, the move could extend toward $1.86 depending on breakout strength and where the neckline gets breached.
For now, XRP’s crash may have done something unexpected. It may have made the asset structurally stronger rather than weaker.

TLDR
- XRP surged 647% from $0.49 to $3.66 after its late 2024 breakout.
- The token now trades near $1.38 following a 70% pullback from its peak.
- Analyst Javon Marks said the $15 measured move target remains unchanged.
- A move to $15 would represent more than 900% upside from current levels.
- XForceGlobal said the current price action reflects compression rather than weakness.
XRP price has returned to focus after its late 2024 breakout triggered a 647% rally to $3.66 by mid 2025. The asset now trades near $1.38 following a 70% pullback from its peak. Analysts state that the original breakout structure still supports a larger upside move.
XRP Price Structure Keeps $15 Measured Move in Play
Javon Marks stated on X that the “$15 measured move target goes unchanged” despite recent volatility. He based his view on the multi-year triangle breakout that occurred in November 2024.
The XRP price surged from $0.49 to $3.66 after the breakout was confirmed. Marks calculated the target by extending the triangle height from the breakout point. He said the structure still supports a 10x move from current levels. From $1.38, a rise to $15 would mark a gain above 1,000%.
Meanwhile, the XRP price has declined by over 38% on a yearly basis. The token also slipped 4.3% in the past 24 hours. However, Marks maintained that price swings do not invalidate the broader breakout setup.
Measured move analysis uses the full height of consolidation patterns. Analysts apply this method after confirmed breakouts. In this case, the late 2024 move remains the reference point.
Analysts Cite Compression Phase After 70% Pullback
Korean Elliott Wave analyst XForceGlobal said, “it’s all coming together” for XRP from a structural view. He pointed to the rally that revisited the prior all-time high zone near $3.66.
He also referenced the retracement back toward the $1 region. According to him, this reset completed two major milestones within the broader wave count. He described the current sideways movement as “compression, not weakness.”
XForceGlobal earlier projected $6 as a conservative Fibonacci extension level. He later referenced $5 and $10 as possible targets within the same wave structure. He stated that short-term volatility does not disrupt the impulsive expansion outlook.
At the same time, XRP has printed five consecutive red monthly candles. This pattern last appeared during the 2016 to 2017 consolidation period.
That earlier stretch preceded a sharp rally in 2017. Current market data also showed over $900 million in realized losses within one week.
Community commentator Archie projected a long-term chart target near $83. He based this outlook on historical breakout extensions and long cycle projections.
An $83 price would imply a multi-trillion-dollar market capitalization. Meanwhile, XRP continues to trade around $1.38 at the time of reporting.


The crypto market is facing new pressure after fresh U.S. inflation data showed that price growth is still stubbornly high, raising concerns about tighter financial conditions.
Summary
- January PPI beat forecasts, signaling persistent inflation pressures.
- Bitcoin fell toward $66,000 as rate-cut hopes weakened.
- Analysts warn of more downside if macro data stays hot.
The January 2026 Producer Price Index report from the Bureau of Labor Statistics was released today, Feb. 27. It showed that wholesale inflation was higher than expected, supporting predictions that the Federal Reserve might keep interest rates high for a longer period.
The data arrived at 8:30 a.m. ET and was followed by immediate weakness in equities and digital assets. Bitcoin (BTC) slipped toward the $66,000, while Ethereum (ETH) and major altcoins posted similar declines.
Hot PPI data raises rate fears
The January report showed headline producer prices rising 0.5% month over month, above the 0.3% forecast. On a yearly basis, PPI climbed 2.9%, also exceeding expectations.
Core PPI, which excludes food and energy, rose 0.8% on the month and 3.6% year over year, marking its highest reading in around 10 months. A narrower “super-core” measure increased 0.3% for the third straight month.
Services prices were the main driver. Final demand services jumped 0.8%, the largest gain since July. Trade services margins surged 2.5%, while professional and commercial equipment wholesaling rose 14.4%, a move widely linked to higher import costs tied to tariffs.
In contrast, goods prices fell 0.3%, led by declines in energy and food. Goods outside of those categories did, however, rise by 0.7%, indicating that underlying cost pressures are still very much present.
It was a clear message for investors. Policymakers are finding it more difficult to defend short-term rate cuts as a result of the services sector’s inflation.
Markets have already reduced expectations for easing in early 2026, pushing real yields and the U.S. dollar higher. These conditions typically weigh on risk assets, including cryptocurrencies.
Crypto market reaction and short-term outlook
Financial markets responded quickly to the data. Dow futures dropped more than 400 points at one stage, while Nasdaq futures fell over 1%. Crypto followed the same risk-off pattern.
Within hours of the release, Bitcoin declined about 2% to 3% from pre-report levels. Ethereum and major altcoins tracked the move. At the same time, gold moved higher, reflecting renewed demand for traditional safe havens.
Analysts say the report strengthens the case for “higher-for-longer” interest rates. If producer price pressures continue feeding into consumer inflation, liquidity conditions could tighten further, limiting upside for digital assets.
Some strategists warn that a sustained break below key support near $64,000–$66,000 could open the door to deeper losses. Others say that until the next significant data release, such as the February CPI in mid-March, volatility is probably going to stay high.
There is also a longer-term counterview. Interest in Bitcoin as a hedge may eventually resurface due to ongoing inflation, trade pressures, and fiscal constraints. For now, however, short-term macro signals remain dominant.
Crypto World
Did L2 Fragment Ethereum? – With Yuval Rooz, CEO of Digital Asset, Co-Founder of Canton


TLDR
- The UK Gambling Commission is reviewing whether licensed casinos can accept cryptocurrency payments.
- Tim Miller said the regulator will examine a clear path for crypto use in online betting.
- Companies offering regulated crypto services must obtain FCA authorization under the Financial Services and Markets Act 2000.
- The commission asked its Industry Forum to study how crypto payments could work within current gambling rules.
- Research shows crypto searches often direct British gamblers to illegal gambling websites.
The United Kingdom’s Gambling Commission has started formal talks on allowing cryptocurrency payments at licensed online casinos. The regulator confirmed it will assess how digital assets could fit within existing gambling rules. Officials said the review aligns with the country’s incoming crypto regulatory framework led by the Financial Conduct Authority.
UK Gambling Commission Studies Crypto Payment Framework
Tim Miller addressed the Betting and Gaming Council’s annual meeting in London on Thursday. He said the commission wants to examine “the potential path forward” for cryptoasset payments. He explained that the regulator aims to allow crypto as a consumer payment option for licensed gambling in Great Britain. He linked this move to rising consumer interest and regulatory changes. He also confirmed that companies conducting regulated crypto activities must secure FCA authorization under the Financial Services and Markets Act 2000.
He stated that growing appetite from punters prompted the review. He said, “We do now want to start looking at what the potential path forward would be.” He added that crypto could become a consumer payment option for licensed operators. However, he clarified that accepting crypto would not change casino licensing standards. He noted that operators must still pass customer suitability checks under existing rules.
FCA Sets Timeline as UK Gambling Sector Reviews Digital Assets
Miller said he asked the Industry Forum to explore the best route for crypto payments. The advisory group represents workers across the gambling sector. He did not provide a deadline for the review. He said illegal markets research shows crypto searches often lead British gamblers to unlawful websites. He added, “Crypto is one of the two biggest searches that lead British gamblers to illegal sites.”
He explained that allowing regulated crypto payments could help protect consumers. He stated that the commission wants to reduce exposure to illegal platforms. Meanwhile, the Financial Conduct Authority released a final consultation outlining ten proposals for crypto markets. The FCA plans to complete the process in March. It targets full implementation of the new regime by October 2027.
The FCA confirmed that companies must obtain full authorization before October 25, 2027. It stated that the application window will open in September 2026. Crypto asset service providers that miss the deadline will enter transitional rules. Those rules will allow existing products but restrict new offerings. The regulator published the timeline in a document dated January 8.
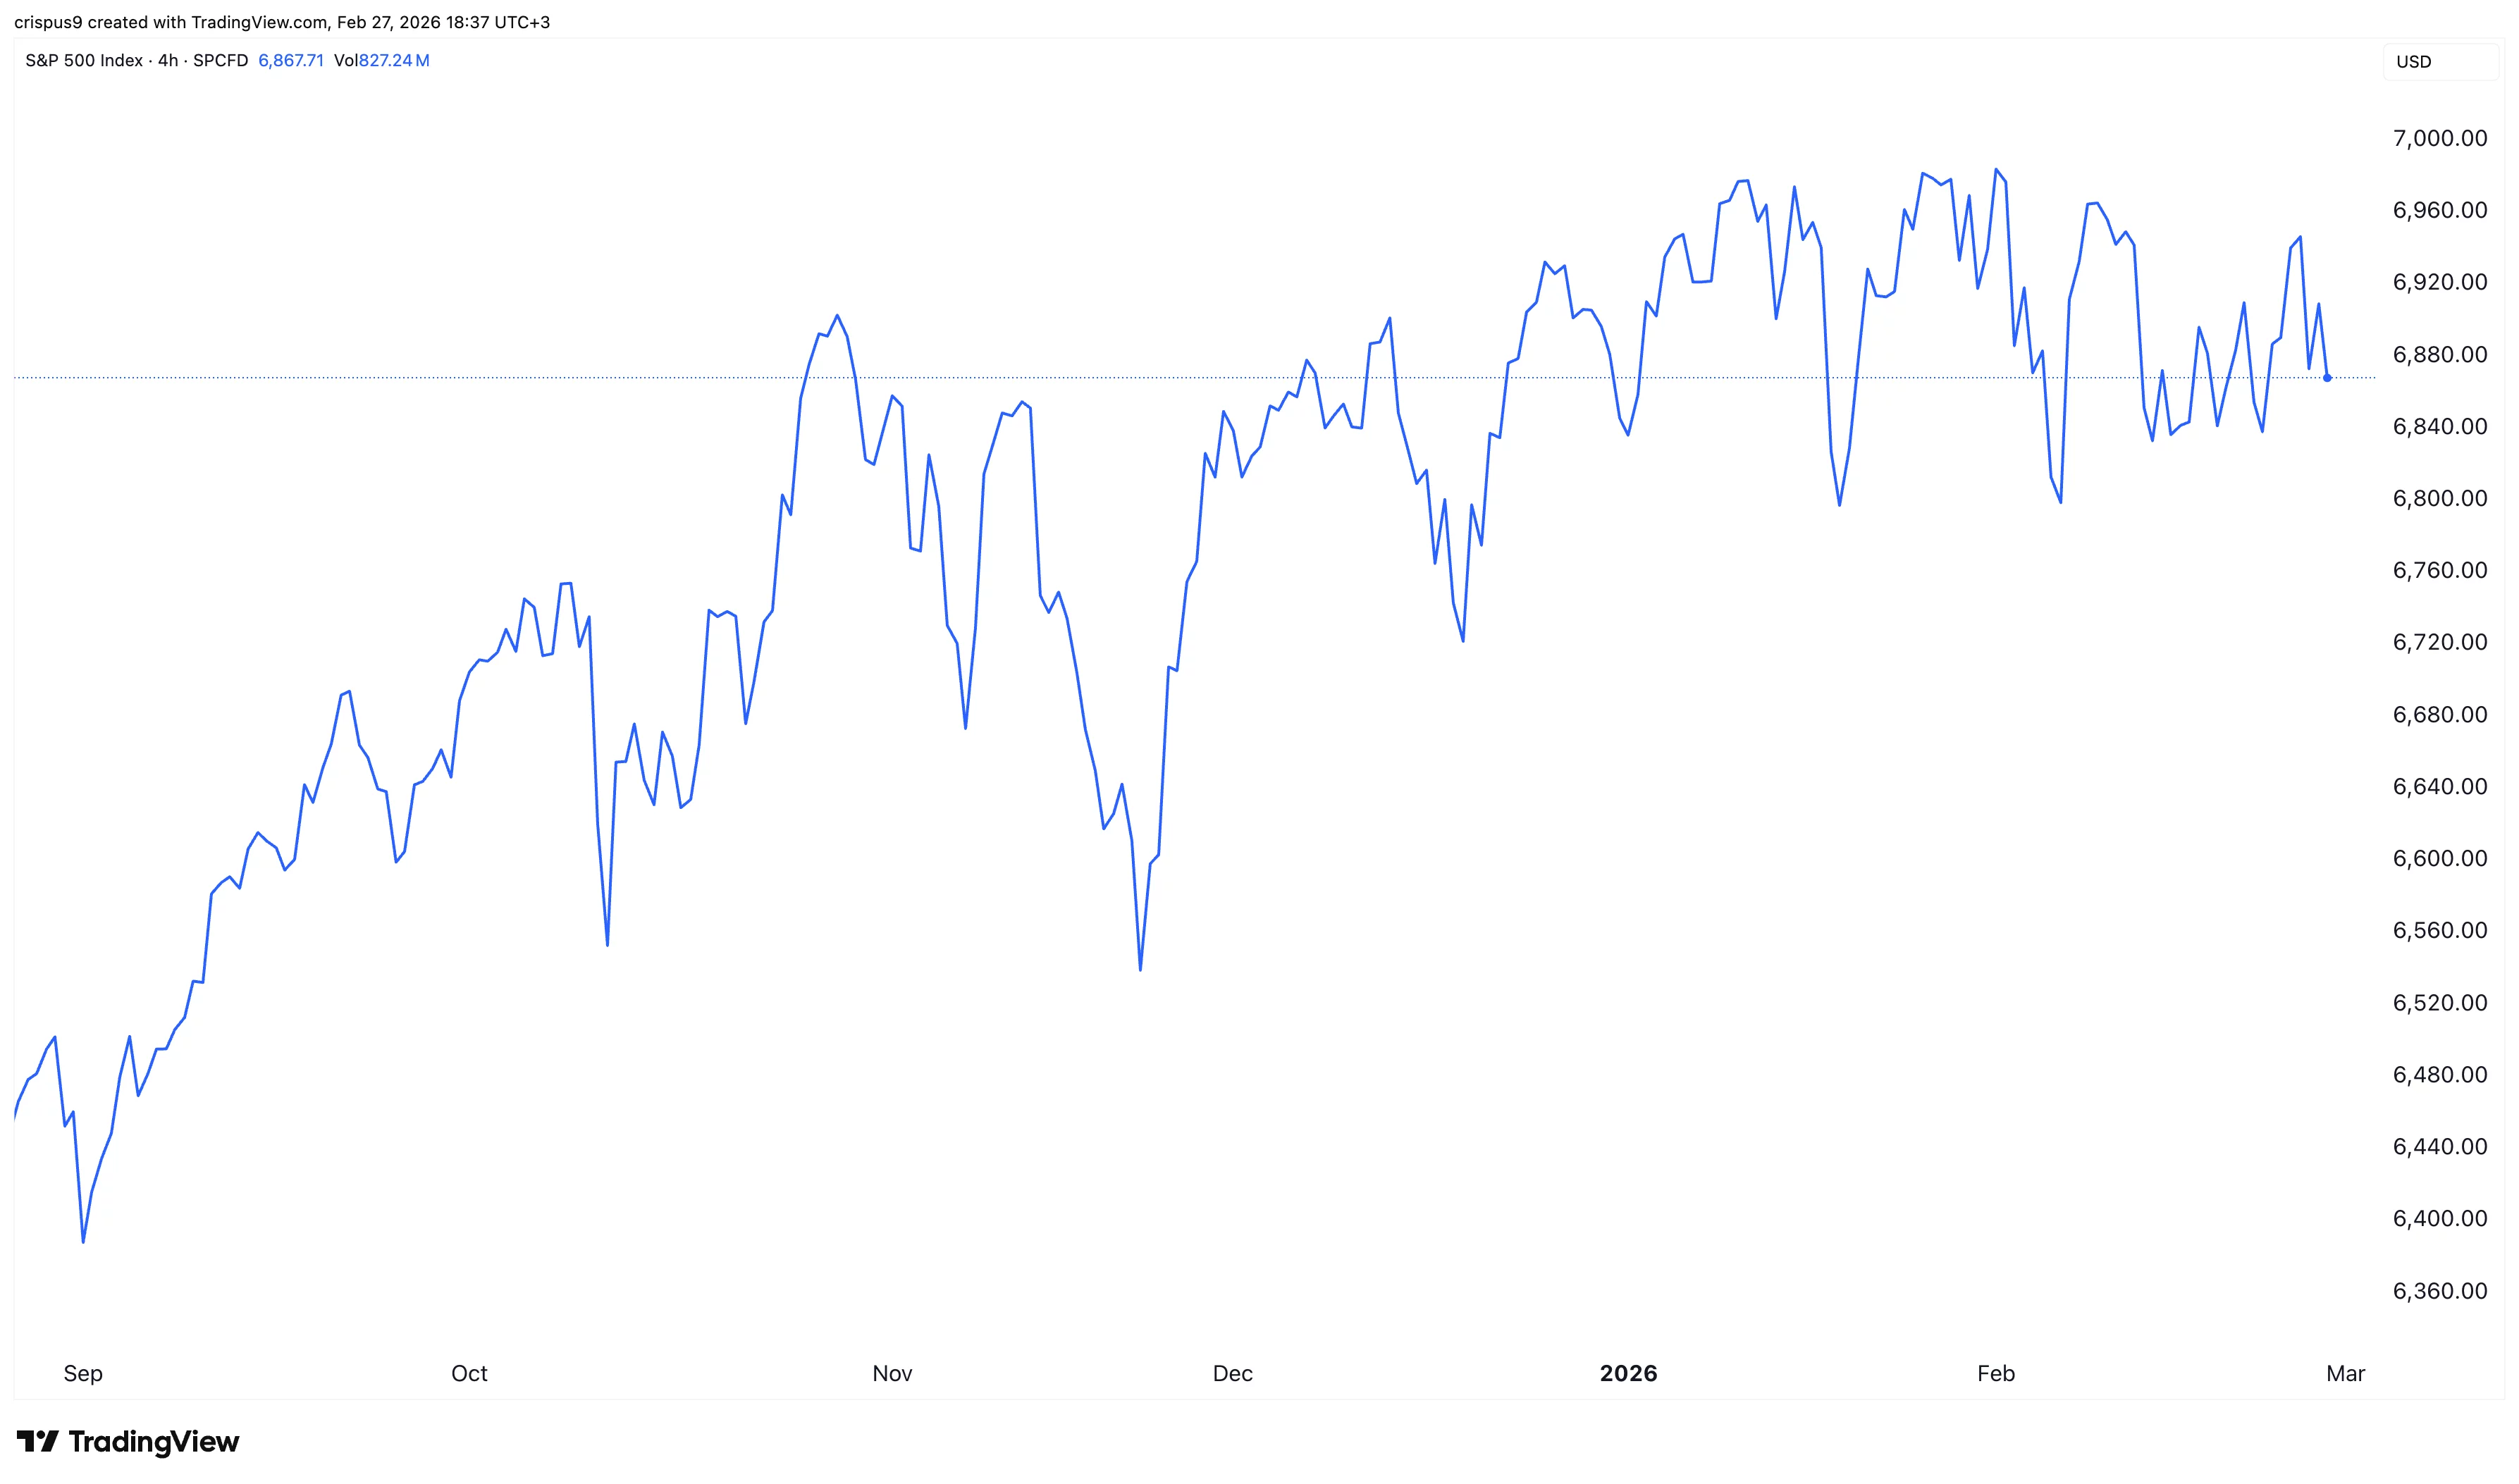
The S&P 500 Index retreated by over 0.6% on Friday, continuing a retreat that started on Thursday as market participants reacted to the latest NVIDIA earnings.
Summary
- The S&P 500 Index retreated by over 0.50% on Friday.
- Jitters in the booming private credit industry accelerated.
- The US published a strong producer price index report.
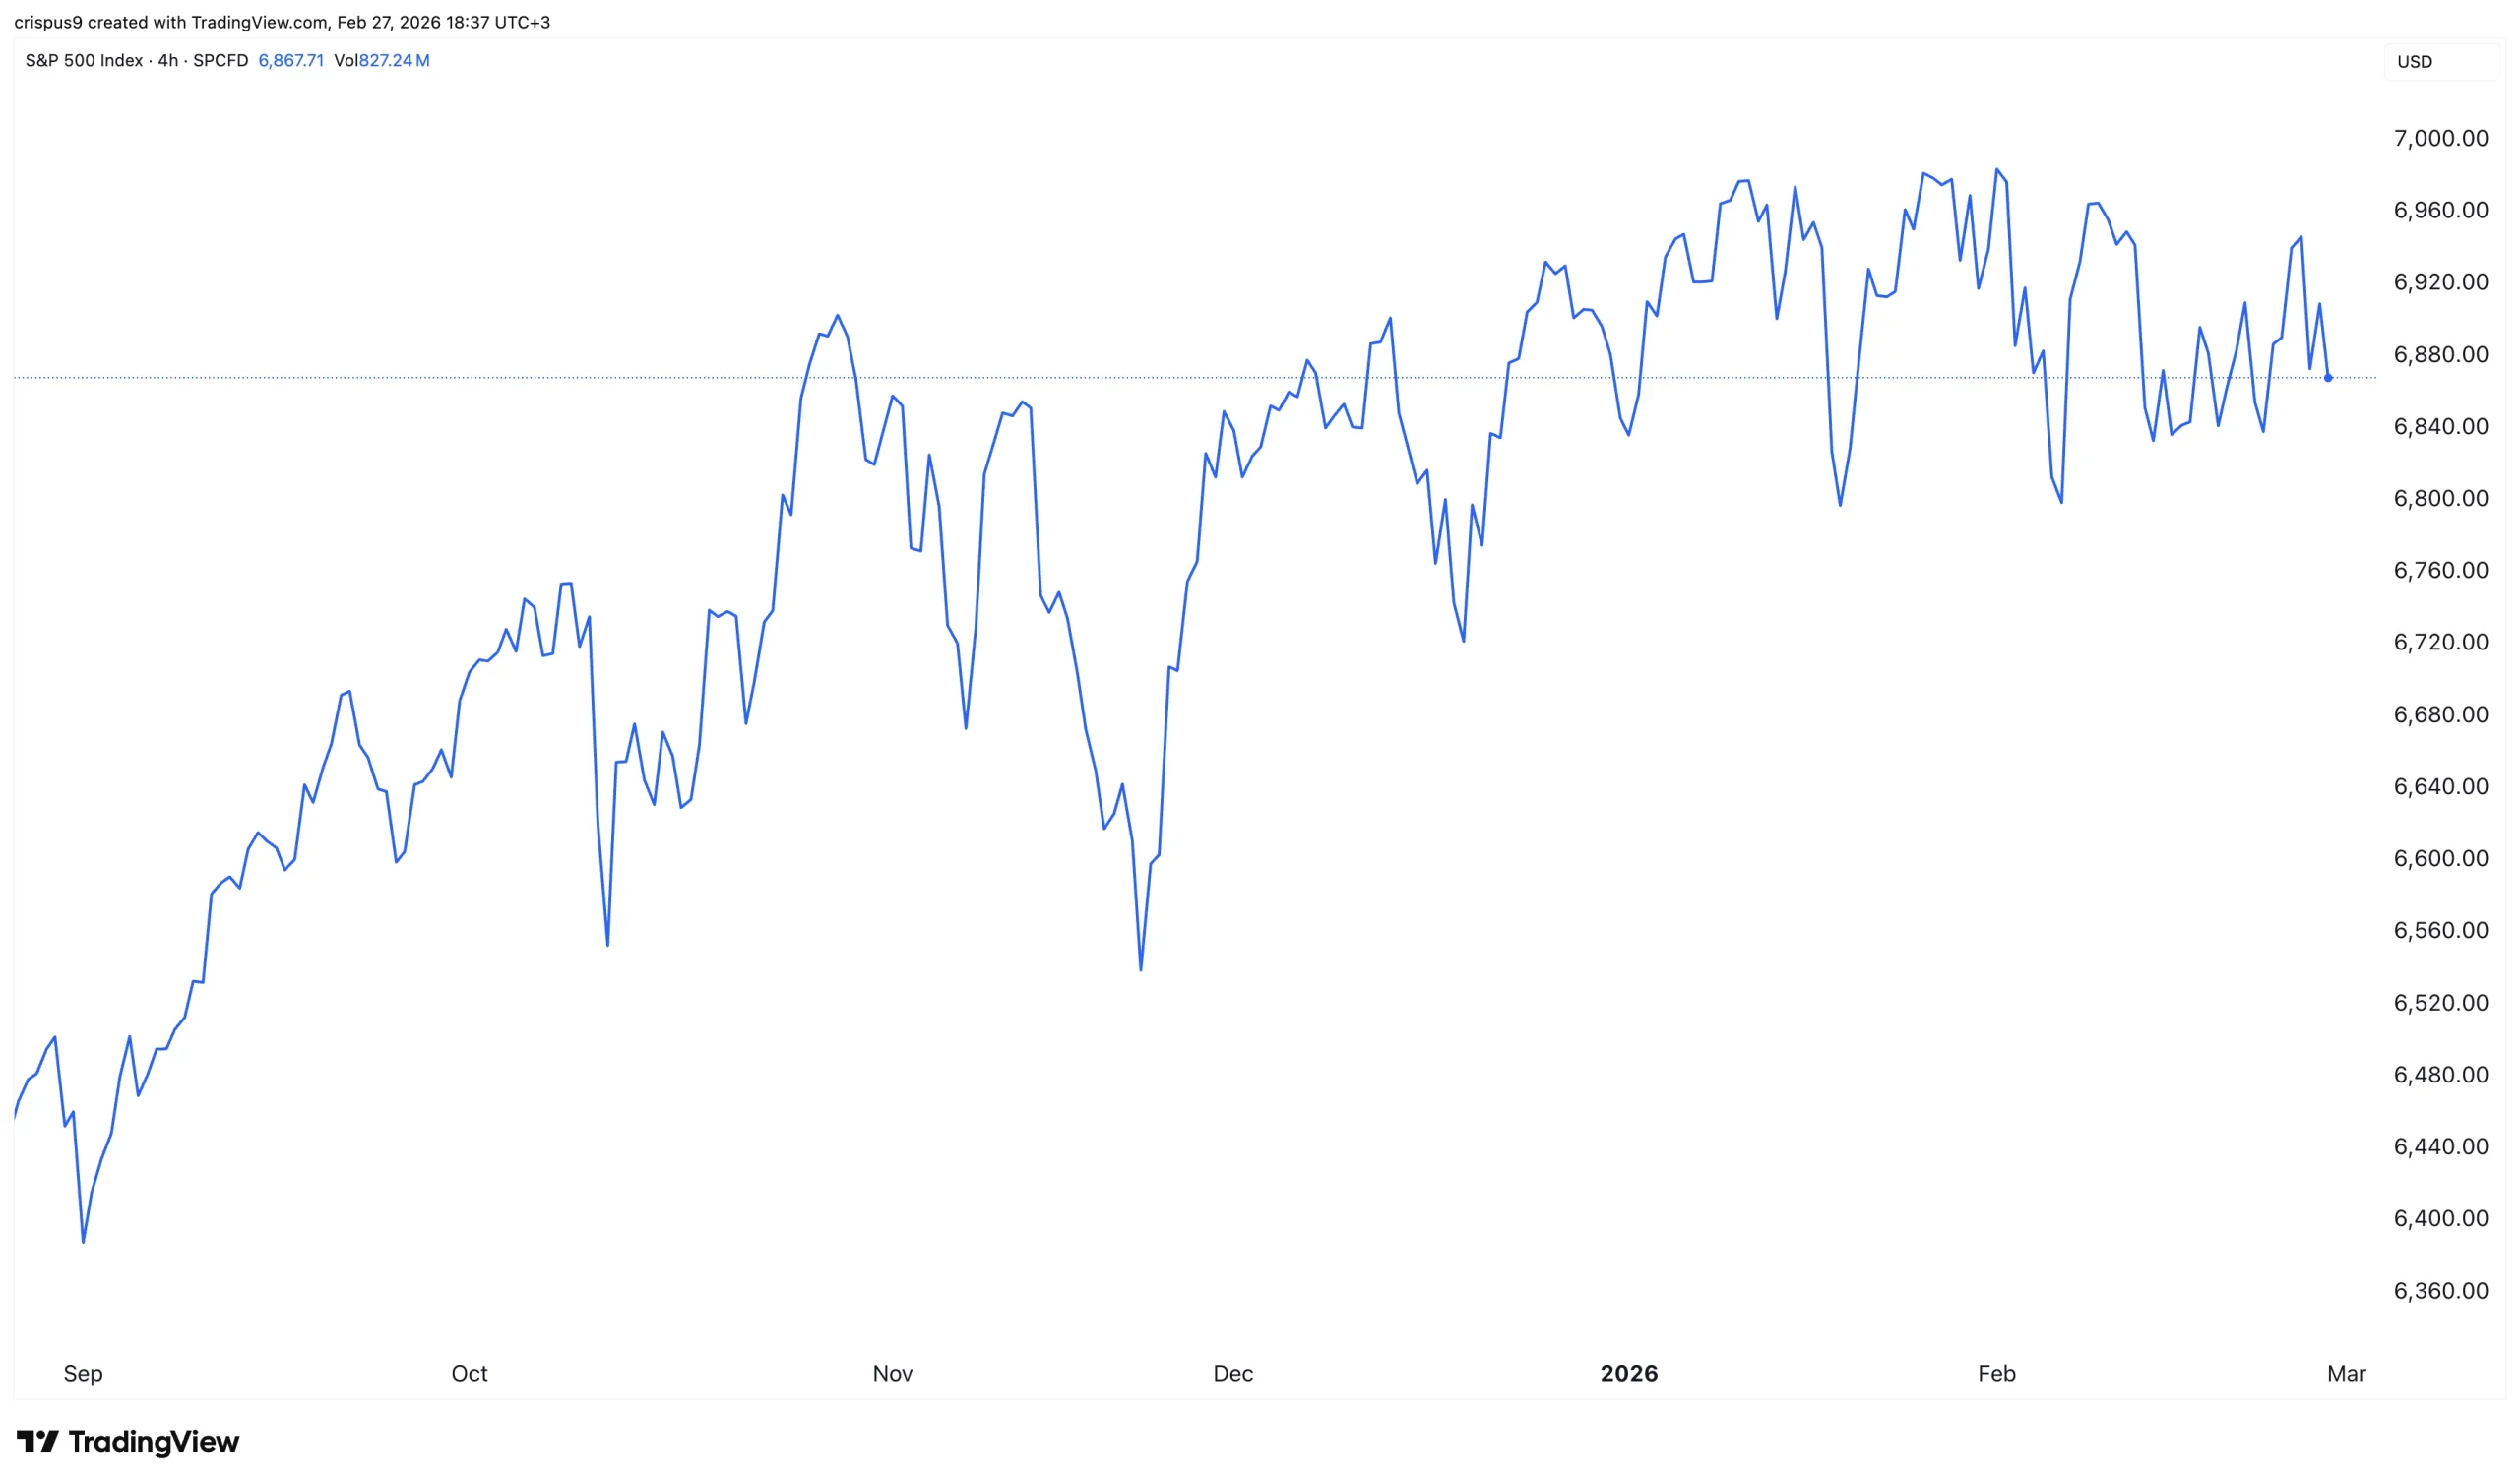
The blue-chip index, which tracks the biggest companies in the United States, dropped to $6,857, down substantially from the year-to-date high of $7,010.
Other stock indices like the Nasdaq 100, Dow Jones, and the Russell 2000 declined by over 1%.
The decline happened as concerns about the $1.8 trillion private credit industry escalated. These concerns started earlier this month after Blue Owl, a company with over $300 billion in assets under management, sent shockwaves in the broader market.
Blue Owl sold a private credit portfolio and announced measures to limit redemption by its investors. This move was an escalation to what happened last year when the company attempted to merge a private and public fund.
The crisis escalated this week after a fund managed by Apollo Asset Management slashed its dividend in a bid to preserve cash as defaults rose.
As a result, top private credit and equity companies like Blue Owl, Apollo, Ares, and Blackstone continued falling. Blue Owl stock dropped by over 4.3%, bringing its three-month decline to 25%.
Apollo Global Management’s stock dropped by over 7%, while Ares fell by over 6%. Blackstone and KKR stocks also continued falling.
The S&P 500 Index also dropped as odds of a US attack on Iran jumped after Israel’s embassy asked non-essential staff to leave. As a result, airline stocks like United Airlines, Delta Airlines, and American Airlines were among the top laggards in the S&P 500 Index.
Additionally, the index retreated after the US published strong producer price index (PPI) data.
The report showed that the headline PPI rose by 2.9% in January, while the core PPI moved to 3.6%. These numbers mean that the Federal Reserve may find it difficult to cut interest rates in the coming meetings.
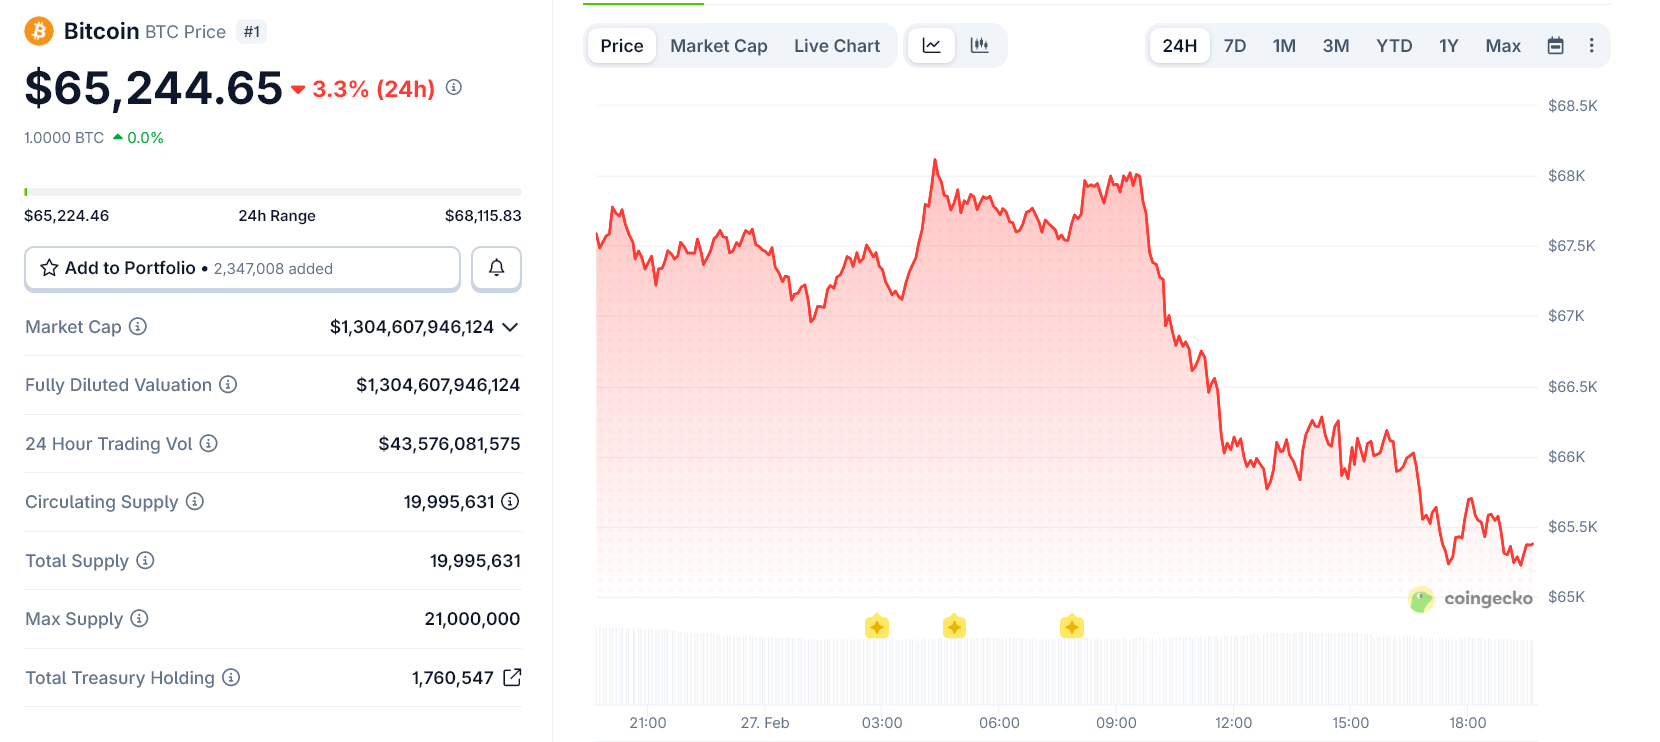
Bitcoin fell sharply on February 27 as geopolitical tensions intensified, pulling the price back to around $65,200 after several days of attempts to recover toward $70,000. The drop came as US President Donald Trump suggested the possibility of a “friendly takeover” of Cuba, while Washington simultaneously increased its military posture in Israel.
The combined headlines injected fresh uncertainty into global markets. Crypto, which had been stabilizing, reacted quickly.
Trump on Cuba: “Maybe We Will Do a Friendly Takeover”
Speaking earlier today, Trump said the Cuban government is “in big trouble” and “talking with us,” adding that the US could pursue a “friendly takeover.” He framed Cuba as financially desperate and open to negotiation.
The comment follows weeks of mounting pressure. Since returning to office in January 2025, Trump reinstated and expanded maximum pressure policies against Havana.
In late January 2026, he signed an executive order declaring a national emergency related to Cuba and threatening tariffs on any country supplying oil to the island.
That move effectively created an oil blockade. Cuba relies heavily on Venezuelan and Mexican fuel. When shipments were halted under US pressure, the island faced rolling blackouts, airport fuel shortages, and widespread economic strain.
How the Cuba Crisis Escalated
Tensions intensified further this week after a deadly maritime incident. Cuban forces intercepted a US-registered speedboat near their territorial waters. Four people were killed in the exchange.
Havana described the group as armed infiltrators. Washington denied involvement but launched investigations.
Meanwhile, Trump’s administration briefly allowed limited humanitarian oil flows through private channels.
However, the broader economic pressure remains in place.
Against this backdrop, the phrase “friendly takeover” carries weight. It likely implies a negotiated political transition under US leverage, not a military invasion.
Still, the language is sensitive. Cuba has built its identity around resisting US influence for over six decades.
US Military Build-Up in Israel
At the same time, the United States has increased its military presence in Israel amid rising tensions with Iran.
Advanced fighter jets and additional assets have been positioned in the region. The State Department also authorized the departure of non-essential diplomatic staff.
Although officials describe the posture as deterrence, markets see rising geopolitical risk. The Middle East and the Caribbean now sit under simultaneous US pressure campaigns.
Bitcoin Reacts to Global Risk
Bitcoin had been attempting to reclaim $70,000 in recent sessions. Instead, it reversed sharply, falling more than 3% in 24 hours. The move suggests traders are reducing risk exposure.
Crypto often reacts to macro uncertainty in two phases. Initially, liquidity tightens and prices drop. Later, if instability persists, some investors rotate into Bitcoin as a hedge.

For now, markets appear to be in the first phase.
With geopolitical tensions expanding on multiple fronts, volatility may remain elevated. Bitcoin’s next move will likely depend on whether diplomatic channels calm the situation — or whether escalation continues.

Met Police to pilot facial recognition identity checks with handheld devices, Sadiq Khan reveals

Burger King gives Whopper new bun and box after customer feedback

Will Bitcoin Boom Or Bust?


-

 Politics6 days ago
Baftas 2026: Awards Nominations, Presenters And Performers
-

 Sports4 days ago
Women’s college basketball rankings: Iowa reenters top 10, Auriemma makes history
-

 Politics4 days ago
Nick Reiner Enters Plea In Deaths Of Parents Rob And Michele
-

 Business3 days ago
True Citrus debuts functional drink mix collection
-

 Politics21 hours ago
ITV enters Gaza with IDF amid ongoing genocide
-

 Crypto World4 days ago
XRP price enters “dead zone” as Binance leverage hits lows
-

 Business5 days ago
Mattel’s American Girl brand turns 40, dolls enter a new era
-

 Business5 days ago
Law enforcement kills armed man seeking to enter Trump’s Mar-a-Lago resort, officials say
-
 NewsBeat2 days ago
Manchester Central Mosque issues statement as it imposes new measures ‘with immediate effect’ after armed men enter
-

 NewsBeat2 days ago
Cuba says its forces have killed four on US-registered speedboat | World News
-

 Tech3 days ago
Unsurprisingly, Apple's board gets what it wants in 2026 shareholder meeting
-
 NewsBeat4 days ago
‘Hourly’ method from gastroenterologist ‘helps reduce air travel bloating’
-

 Tech5 days ago
Anthropic-Backed Group Enters NY-12 AI PAC Fight
-

 NewsBeat5 days ago
Armed man killed after entering secure perimeter of Mar-a-Lago, Secret Service says
-

 Politics5 days ago
Maine has a long track record of electing moderates. Enter Graham Platner.
-

 Business2 days ago
Discord Pushes Implementation of Global Age Checks to Second Half of 2026
-
 NewsBeat3 days ago
Police latest as search for missing woman enters day nine
-
 Sports4 days ago
2026 NFL mock draft: WRs fly off the board in first round entering combine week
-

 Business1 day ago
Only 4% of women globally reside in countries that offer almost complete legal equality
-

 Crypto World3 days ago
Entering new markets without increasing payment costs