

Crypto World
Where Ethereum’s capital actually lives


Disclosure: This article does not represent investment advice. The content and materials featured on this page are for educational purposes only.
A new report shows that 58% of Ethereum’s top-holder capital sits outside ETH, reshaping how dominance, concentration, and systemic risk are understood.
Summary
- Aggregated rankings reveal $426b in top-address holdings versus $189b under ETH-only measurement, with nearly half of the Top-1,000 addresses changing once tokens are counted.
- Smart contracts now control nearly 40% of top-holder capital, signaling a structural shift from individual holders to protocol-driven mechanisms.
- The newly introduced Printing-Press Index (PPI) shows DeFi balances cluster around ~50% self-issued tokens, highlighting rising wrong-way risk and potential systemic fragility in a token-heavy market.
Ethereum’s largest balances look dramatically smaller through an ETH-only lens. When address holdings are evaluated by total on-chain assets, ETH plus ERC-20 tokens and stablecoins valued in USD, the apparent capital at the top expands by more than 2x. This isn’t just a valuation tweak: once tokens and stablecoins are included, smart contracts and protocol-controlled entities represent over 40% of top-holder capital, fundamentally altering the visible structure of Ethereum’s market.
What to know
- Once addresses are ranked by total USD holdings (ETH plus ERC-20 tokens and stablecoins), the leaderboard captures far more capital than ETH-only rankings. In the Aggregated Top-10,000, total balances amount to $426B, compared with $189B when measured by ETH alone, a 2.2x difference in the capital visible at the top. The composition also shifts: in the Top-1,000, only 537 addresses overlap between the ETH-only and aggregated rankings.
- This view also changes who appears to control Ethereum’s largest balances. In the Aggregated Top-1,000, smart contracts account for nearly 40% of the capital. The shift implies that a large share of Ethereum’s economic weight sits in automated, protocol-controlled structures rather than externally owned accounts, altering how concentration, liquidity, and counterparty exposure should be interpreted.
- A Printing-Press Index (PPI) helps separate externally sourced value from self-minted balance-sheet mass. In DeFi-related balances, self-issued components cluster around 50%, a level that moves from “detail” to systemic fragility because even modest selling pressure can trigger wrong-way dynamics and accelerate a death-spiral-style unwind. A practical risk threshold often begins around ~20%.
About Ethplorer.io report
This report uses an aggregated ranking of Ethereum addresses based on totalBalanceUsd, which includes ETH, ERC-20 tokens and stablecoins valued in USD.
The Beacon deposit contract is excluded because it is a technical registry, not a wallet. It only logs staking deposits, meaning the ETH shown there is not withdrawable capital. While traditional rankings often display about 77.8M ETH (~$258B) at this address, the economically relevant staking balance is closer to ~36M ETH (~$118B) – roughly 2.2x lower.
Token contracts are also excluded to focus on economically meaningful holders.
Altseason already happened: Just not on the price charts
Crypto markets have moved beyond price discovery and into a phase of power discovery. Prices, market caps and TVL are transparent, but it remains unclear who actually controls liquidity, issuance and systemic risk across Ethereum’s on-chain economy.
In earlier cycles, this distinction mattered less. Through most of 2017–2021, ETH represented the majority of Ethereum’s economic value, while tokens and stablecoins played secondary roles. ETH price and market cap were often sufficient proxies for economic influence.
That structure has since changed. By 2022–2023, token-denominated balances reached ETH in economic weight.
In Ethereum’s aggregated rating, ETH no longer dominates portfolios
According to the Ethplorer.io report, the top addresses hold about $426.3B in total value. Of this amount, $177.5B is held in ETH, roughly 42%, while the remaining ~58% is denominated in tokens. Stablecoins alone account for around 26% of the average large-address balance.
Importantly, this is not just a matter of composition. When ranked by Aggregated value, only 537 addresses overlap with the ETH-based Top-1,000, meaning nearly half of the largest holders emerge only once tokens are counted.
In that sense, a form of “alt-season” may have already occurred, just not in the way markets traditionally expect. Dominance did not arrive through broad price appreciation or new all-time highs, but quietly, through balance-sheet accumulation.
This disconnect helps explain why the shift went largely unnoticed. Market participants were watching charts, while structural dominance was changing on-chain.
What this reveals is not a failed altseason, but a transformed one. Capital did not rotate into altcoins through explosive price appreciation. Instead, it expanded laterally, across a growing number of protocols, tokens and smart contracts, while prices remained largely range-bound.
When size stops signaling strength
Over the past year, Top-100 addresses did not preserve capital better than the broader Top-1,000. Despite expectations of superior information or positioning at the very top, concentration did not translate into structural outperformance.
By calculating the Median balance (~$122M), the Maximum balance ($35.2B), and their ratio (Max / Median ~290×) for the Aggregated Top-1000, a clear conclusion emerges. Taken together, these metrics point to a shift from market risk to system risk. A nearly 290× gap between the largest and median balances reflects structural concentration rather than distributed exposure. In such an environment, losses are driven less by adverse price movements and more by the liquidity conditions and mechanics of leading protocols.
For investors, the implication is practical rather than theoretical.
In a token-heavy, sideways market, strategies centered on capital preservation and yield capture, staking, liquid staking, restaking, and stablecoin-based returns appear more consistent with how large holders are actually positioning on-chain than speculative bets on illiquid tokens or leveraged exposure.
In other words, structural change is already reflected in balances, while expectations continue to follow charts.
If tokens now represent the majority of Ethereum’s economic weight, the more important question is no longer whether this shift exists, but what risks it introduces. Especially when a growing share of that capital is self-issued.
The Printing-Press Index: Measuring self-minted wealth
To separate externally sourced capital from value inflated by self-issuance, the Printing-Press Index (PPI) is calculated by Ethplorer as the share of a project’s own tokens within its total token-denominated portfolio:
PPI = Own tokens (USD) / Total tokens (USD).
*Only liquid assets are included. Spam tokens are filtered using Ethplorer.
At a group level, the results are uneven:
- DeFi protocols cluster around ~50% self-issued tokens (e.g. UNI, AAVE, MNT).
- Centralized exchanges average ~7% (BNB, CRO, LEO), but with notable outliers:
- Within the Bitget-linked address group, 31 related addresses hold roughly $11B in total assets, of which ~$3.25B is denominated in BGB, implying a group-level PPI of ~30%.
As Ethereum’s economy shifts toward tokens, balance size becomes a weaker indicator of risk. High PPI introduces a well-documented structural risk known as wrong-way risk, where a system’s stability depends on the value of its own token.
At low levels (roughly 10-20%), self-issued tokens function as a design feature. Beyond ~40-50%, the system enters a fragile regime: modest external pressure can impair confidence, compress liquidity, and trigger reflexive sell-offs characteristic of a death-spiral dynamic. At this point, PPI shifts from a descriptive metric to a signal of systemic vulnerability.
The UST-LUNA collapse represents the extreme case, with a PPI near 100%, where self-referential backing led to a reflexive unwind once confidence broke.
The FTX-FTT case shows that even ~40% self-issued exposure can destabilize a system when liquidity thins.
In both cases, balance-sheet size masked fragility rooted in token self-dependence.
In short
In a token-heavy market, what matters is no longer how big a balance is, but what it consists of. PPI provides a practical filter for assessing balance-sheet quality, separating externally sourced capital from value amplified through self-issuance. In a market where structural dominance has already shifted and prices remain range-bound, attention naturally moves from chasing expansion to managing exposure. For analysts and investors, monitoring how capital is composed, not just how much exists, becomes central to evaluating resilience, concentration and risk in a post-ETH-dominance landscape.
Smart contracts vs. HODLers: When risk moves from holders to mechanisms
When Ethereum was conceived in 2013, Vitalik Buterin framed it in his White Paper not as a currency system, but as a platform for self-executing smart contracts and decentralized applications. Aggregated on-chain data now shows that Ethereum’s largest holders increasingly reflect this architecture:
When viewed through an ETH-only lens, smart contracts appeared as a minority participant in Ethereum’s wealth distribution. Aggregated balances change that picture materially.
In the Aggregated Top, smart contracts control nearly 40% of total capital, roughly three times their share in ETH-only rankings.
This is not just a classification shift, it is a risk transfer.
When capital sits in externally owned accounts, risk is tied to individual behavior. When capital moves into smart contracts, risk becomes embedded in mechanisms: code logic, collateral design, liquidity assumptions and token economics.
For analysts and investors, this changes how exposure should be evaluated.
A large balance no longer implies resilience. What matters is whether that balance is externally sourced, or recursively backed by its own issuance. In a contract-dominated landscape, headline TVL or balance size can mask fragility rather than signal strength.
Operationally, this shifts analysis from protocol narratives to address-level balance inspection.
Evaluating a protocol increasingly means identifying its associated on-chain entities, aggregating their balances, and measuring how much of that capital is represented by the project’s own token. This process relies on address attribution and tagging rather than price charts alone.
This is where PPI becomes operational rather than theoretical.
Using tagged project addresses, available across modern blockchain explorers, analysts can quantify self-issued exposure directly. A PPI above roughly 20-30% signals rising wrong-way risk, where protocol stability increasingly depends on the market value of its own token rather than external capital.
Final insight: What the new structure of Ethereum actually means
Ethereum’s on-chain data no longer supports analysis based on ETH balances alone. Once capital is viewed in aggregated USD terms, a different market structure emerges, one that materially changes how exposure, dominance and risk should be interpreted:
- Smart contracts are no longer marginal holders, they are core economic actors.
With nearly 40% of top-holder capital controlled by contracts, risk increasingly resides in protocol mechanics rather than individual decision-making. - The altseason did not disappear, it changed form. Capital expanded across protocols and balance sheets rather than through price appreciation, explaining why structural dominance shifted without new All-Time Highs.
- Balance size is no longer a proxy for resilience. High PPI levels show that large balances can be internally reinforced by self-issued tokens, introducing wrong-way risk even in systems that appear well-capitalized.
- Exposure analysis must shift from narratives to balance composition. Evaluating protocols now requires inspecting aggregated balances, address attribution, and self-issued exposure, not just TVL, token price or brand perception.
Disclosure: This content is provided by a third party. Neither crypto.news nor the author of this article endorses any product mentioned on this page. Users should conduct their own research before taking any action related to the company.


A tense exchange unfolded at a Senate Banking Committee hearing as Senator Elizabeth Warren pressed Comptroller of the Currency Jonathan Gould over a pending bank charter application tied to President Donald Trump’s crypto company, World Liberty.
Summary
- Warren questioned whether Trump-linked crypto firm World Liberty properly disclosed a reported 49% UAE stake in its OCC bank charter application.
- Comptroller Jonathan Gould declined to discuss specifics but pledged to follow standard OCC procedures.
- Warren warned that foreign ownership and presidential conflicts of interest pose risks if the charter is approved.
Elizabeth Warren demands answers on World Liberty’s bank application
Warren cited a Wall Street Journal report alleging that a senior United Arab Emirates official secretly acquired a 49% stake in Trump’s crypto venture shortly before Trump returned to office.
She questioned whether the foreign investor was properly disclosed in World Liberty’s application to the Office of the Comptroller of the Currency (OCC), which regulates national banks.
“Did World Liberty disclose that the UAE official’s company was a shareholder?” Warren asked.
Gould declined to discuss specifics of any pending application, stating that the OCC would follow established regulatory procedures. Warren countered that OCC rules require full disclosure of any principal shareholder with a 10% or greater stake, arguing that failure to do so would warrant dismissal of the application.
She requested access to an unredacted filing for committee oversight, saying lawmakers needed to verify compliance with disclosure requirements. Gould said he would consider the request consistent with established protocols.
Warren framed the issue as both a national security and conflict-of-interest concern, warning that foreign ownership of a U.S. bank tied to a sitting president posed significant risks. She also accused the OCC of potentially enabling corruption if it approved the charter.
Gould rejected allegations of political influence, saying the only pressure he had felt “is from you,” and maintained that the agency would process the application like any other.
The clash shows escalating political tensions surrounding crypto regulation, bank charters, and the intersection of digital asset ventures with presidential business interests.

Paradigm, the San Francisco-based crypto investment firm, is pursuing a new $1.5 billion fund aimed at backing companies across artificial intelligence, robotics and other frontier technologies. The fundraising plan, reported by the Wall Street Journal, signals the firm’s intention to broaden its mandate while continuing to back crypto-related ventures using its established technical-investment team. Public filings show Paradigm already manages roughly $12.7 billion in assets, underscoring the scale it brings to a fund that blends crypto with cutting-edge tech bets. The strategy reflects a broader industry twist: the convergence of digital assets with AI and automation, a nexus that has attracted increased capital over the past year.
Paradigm will continue to invest in crypto companies, according to familiar sources, but the new vehicle will also evaluate frontier-tech opportunities outside the traditional crypto ecosystem. The Wall Street Journal noted that the firm’s managers sought greater latitude to avoid constraints that could cause them to pass on attractive deals. The approach mirrors a broader trend among crypto-focused funds expanding into adjacent technologies as capital markets prize diversification and cross-disciplinary expertise. The fundraise aligns with Paradigm’s history: it launched its flagship $2.5 billion fund in November 2021, at the time the largest crypto fund in history, and in 2024 publicly announced its third fund—a venture vehicle of about $850 million focused on early-stage crypto projects. These milestones punctuate a firm comfortable with large-scale vehicles and multi-cycle exposure to digital assets.
Beyond capital allocations, Paradigm’s strategy underscores a belief that crypto and AI are not mutually exclusive. The firm’s leadership has argued for a pragmatic view of the two domains, noting substantial overlap in areas such as how autonomous systems can execute transactions. This concept—agentic or autonomous AI agents performing actions within financial networks—has become a focal point in industry conversations about security, efficiency and governance. For readers familiar with the technical dialogue around AI agents and how they interact with decentralized systems, the connection is a natural extension of Paradigm’s investment thesis. The discussion sits at the intersection of risk management, smart-contract integrity and the evolving architecture of programmable money.
Open questions about the precise structure of the new fund remain, but the narrative around Paradigm’s pivot away from crypto appears to have evolved. In 2023, the firm faced public speculation after it trimmed crypto-specific language from its website, prompting some observers to wonder if it planned a broader shift toward AI. Co-founder Matt Huang disputed that interpretation, stating that the team had simply been exploring AI while remaining deeply committed to crypto across all stages. In a subsequent note, Huang emphasized that developments in AI are compelling enough to merit parallel exploration alongside ongoing crypto initiatives. This stance captures a pragmatic view in which crypto remains central, but AI opportunities are too consequential to ignore. The firm’s recent collaboration with OpenAI to release EVMbench—a benchmark evaluating how AI models can detect and patch security vulnerabilities in smart contracts—illustrates that the overlap between the two sectors is not theoretical, but operational and testable.
Paradigm’s frontier-tech push comes amid a broader AI funding boom
Industry data cited by the OECD shows venture-capital investments in artificial intelligence reached $258.7 billion in 2025, accounting for about 61% of all VC activity and effectively doubling AI’s share since 2022. Within AI, fundraising for generative AI firms made up roughly 14% of total AI VC investments, with the United States drawing the largest portion of capital. The numbers illustrate a market backdrop where AI is a driving force behind liquidity and deal flow, a context that investors like Paradigm are trying to leverage while maintaining a crypto footprint. The momentum around AI funding complements the evolving crypto landscape, where innovations in on-chain security, scalable infrastructure and tokenized financial assets continue to attract capital from traditional and specialized investors alike.
For readers tracking the practical side of AI-crypto convergence, Paradigm’s activities provide a useful case study. The firm’s involvement in AI benchmarking and security—through collaborative efforts with OpenAI on EVMbench—signals a preference for concrete, talent-driven assessments of risk and opportunity in crypto infrastructure. The project evaluates how AI agents can identify vulnerabilities in smart contracts and suggest patches, a capability that could improve the resilience of programmable money and decentralized applications. This line of work aligns with a broader push to raise the bar on cryptographic and governance standards as AI adoption scales across blockchain-native ecosystems.
In parallel, the market continues to size up the potential for frontier-tech finance to reshape venture ecosystems. The integration of AI with crypto workflows hints at new value propositions for developers, operators and investors who want to combine the speed and automation of intelligent agents with the structural transparency of decentralized networks. The 2025 funding landscape, highlighted by OECD figures, reinforces the idea that technology bets are increasingly pluralistic—funds seek to back teams that can navigate both AI breakthroughs and crypto-market dynamics, a stance Paradigm appears to be formalizing through its latest fundraising efforts.
Why it matters
The strategic timing of Paradigm’s fundraising matters for several reasons. First, it demonstrates how crypto-focused funds are maturing into multi-technology platforms capable of supporting complex portfolios that straddle AI, robotics and digital assets. This evolution could attract a broader set of LPs seeking diversified exposure to frontier tech themes without sacrificing deep domain expertise in crypto risk management. Second, the collaboration with AI researchers and benchmarks like EVMbench signals a willingness to invest not only in companies but in tooling and standards that improve security and efficiency across the crypto stack. If AI-driven testing and patching become mainstream in on-chain development, the resulting improvements in smart-contract safety could raise the confidence of users and institutions alike.
From a market perspective, Paradigm’s move sits at the nexus of two transformative trends. AI funding is surging, while crypto funding cycles remain active as investors wager on improvements in scalability, governance and regulatory clarity. The OECD data cited above illustrate a capital environment where AI is a dominant driver of VC flows, yet the crypto sector still presents material opportunities for those who can blend deep technical risk assessment with strategic portfolio construction. The cross-pollination of these domains could fertilize ecosystems where AI helps automate, audit and optimize crypto infrastructure, while blockchain technologies provide new data-native workloads for intelligent agents and automation platforms.
For the broader user and investor community, Paradigm’s approach signals that the near-term future of crypto funding may increasingly resemble traditional technology venture models: larger raised funds, diversified mandate, and a portfolio approach that prioritizes talent, rigorous due diligence and technical interoperability. The firm’s willingness to maintain its crypto commitments while pursuing frontier tech investments could set a template for other crypto-focused funds confronting the same balance: remaining anchored in digital assets while embracing adjacent advances that could reshape the entire technology stack.
What to watch next
- Progress toward closing the $1.5 billion frontier-tech fund, including potential fundraising milestones and any anticipated close dates.
- Regulatory filings and disclosures related to the new vehicle, especially as the strategy expands beyond crypto into AI and robotics.
- Portfolio visibility: any announcements of investments or co-investments in AI, robotics or related frontier technologies, alongside crypto companies.
- Updates on EVMbench adoption and results, and whether AI-driven security tooling becomes a standard in crypto development workflows.
- Continued commentary from Paradigm leadership on the crypto-AI overlap and strategic priorities across stages of investment.
Sources & verification
- Wall Street Journal report detailing Paradigm’s $1.5 billion frontier-tech fund and the firm’s expansion into AI and robotics.
- Regulatory filings showing Paradigm’s assets under management at roughly $12.7 billion.
- Cointelegraph coverage discussing Paradigm’s ongoing crypto investments and references to executive commentary.
- Announcement of EVMbench, a joint effort with OpenAI to benchmark AI agents’ ability to detect and patch smart-contract flaws.
- OECD data on AI venture-capital investments through 2025, highlighting the scale of AI funding and cross-sector allocations.
Paradigm widens the lens on frontier tech and crypto
Paradigm’s current fundraising push to assemble a $1.5 billion frontier-tech fund underscores a practical shift in how crypto-focused capital views the technology landscape. While the firm remains firmly rooted in crypto, the new vehicle signals a deliberate strategy to diversify into AI, robotics and other high-potential sectors. At the same time, Paradigm’s public record—$12.7 billion in AUM and a history of large crypto funds—offers a credible backdrop for investors weighing the risks and rewards of a broader tech mandate. The collaboration with OpenAI on EVMbench exemplifies the concrete, value-driven work that can emerge when crypto publics intersect with AI researchers and standards bodies. As the sector contends with regulatory questions and evolving market dynamics, Paradigm’s approach provides a lens into how crypto-focused firms may evolve to participate in the broader tech economy while maintaining a disciplined risk profile.
Key points:
-
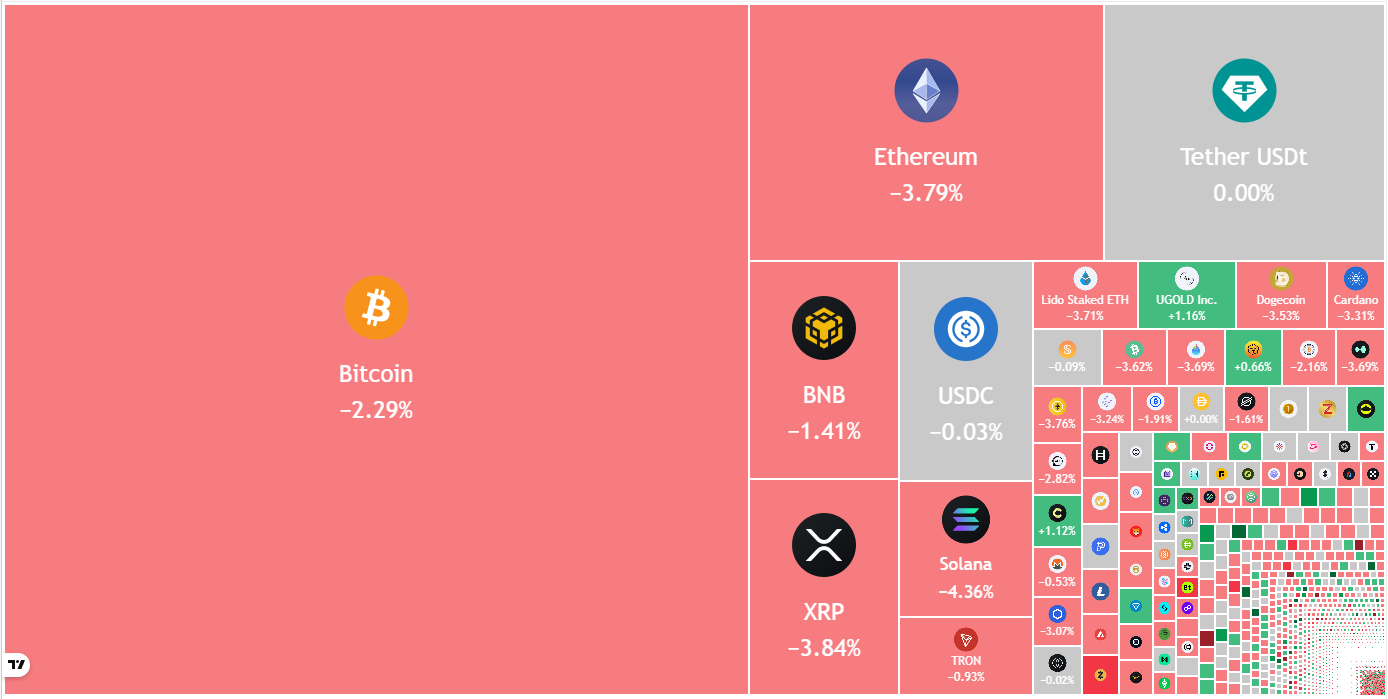
Bitcoin continues to face selling on minor rallies, indicating a negative sentiment.
-
Several altcoins have turned down from the overhead resistance levels, indicating the bears are active at higher levels.
Bitcoin (BTC) continues to face selling on rallies, with bears attempting to sink the price below $66,000. However, some analysts believe the downside may be limited.
Analyst Willy Woo said in a post on X that the selling may have exhausted and BTC is likely to enter a period of consolidation. He expects the rebound to be rejected in the mid $70,000 level. Woo anticipates the bearish trend to end in Q4 of this year and the bullish momentum to begin in Q1 or Q2 2027.
Another positive sign in favor of the bulls is that BTC exchange-traded funds have started attracting investors. The BTC ETFs have recorded $1.01 billion in inflows since Tuesday, according to SoSoValue data.

Analysts also expect Ether (ETH) to remain sideways for some time. Swyftx lead analyst Pav Hundal told Cointelegraph on Thursday that ETH may remain “subdued over the next few weeks” and in the medium term may test even “the most experienced investors.”
Could BTC and select major altcoins hold on to their support levels? Let’s analyze the charts of the top 10 cryptocurrencies to find out.
Bitcoin price prediction
BTC’s relief rally is facing selling at the 20-day exponential moving average (EMA) ($68,895), indicating a negative sentiment.

The BTC/USDT pair has formed a symmetrical triangle, which usually acts as a continuation pattern. If the Bitcoin price continues lower and breaks below the support line, it puts the $60,000 level at risk of breaking down. If that happens, the pair may plunge to the next major support at $52,500.
The first sign of strength will be a close above the resistance line. The pair may then rally to the breakdown level of $74,508. This is a crucial level for the bears to defend, as a close above $74,508 suggests that the price may have bottomed out at $60,000.
Ether price prediction
Buyers pushed ETH above the $2,111 resistance on Wednesday but could not sustain the breakout.

The Ether price has turned down sharply from the $2,111 resistance, indicating that the bears are vigorously defending the level. That suggests the ETH/USDT pair may extend its stay inside the $1,750 to $2,111 range for a while.
The next trending move is expected to begin on a close above $2,111 or below $1,750. If the $1,750 level cracks, the next stop is likely to be $1,537. Alternatively, a close above $2,111 might thrust the pair toward the 50-day simple moving average (SMA) ($2,494).
XRP price prediction
XRP (XRP) remains stuck between the 20-day EMA ($1.44) and the support line of the descending channel pattern.

Sellers will attempt to sink the XRP price below the support line, but are likely to encounter solid resistance from the bulls. If the price bounces off the support line with strength, the bulls will again try to push the XRP/USDT pair above the 20-day EMA. If they succeed, the pair may rally to the 50-day SMA ($1.67) and then to the downtrend line.
Contrarily, a break and close below the support line puts the Feb. 6 low of $1.11 at risk of breaking down. The pair may then tumble to the psychological support at $1.
BNB price prediction
Sellers are attempting to halt BNB’s (BNB) recovery at the 20-day EMA ($638), but the bulls have kept up the pressure.

That shows a greater potential for a possible breakout above the 20-day EMA in the near term. The BNB/USDT pair may rally to $669 and subsequently to the breakdown level of $730.
This bullish view will be negated in the near term if the price turns down sharply from the 20-day EMA and breaks below the $570 support. That signals the resumption of the downtrend toward the psychological support at $500.
Solana price prediction
Solana (SOL) rose above the 20-day EMA ($86) on Wednesday, but the bears halted the recovery at the $95 level.

Sellers have pulled the price below the 20-day EMA, opening the gates for a drop to the $75 level. If the price rebounds off the $75 level with strength, it suggests that the bulls are trying to form a higher low. The SOL/USDT pair may then consolidate between $75 and $95 for a few days.
Contrary to this assumption, a close below the $75 level suggests that the bears remain in control. The Solana price may then plummet to the Feb. 6 low of $67.
Dogecoin price prediction
Dogecoin (DOGE) broke above the 20-day EMA ($0.10) on Wednesday, but the bulls could not sustain the higher levels.

Sellers will attempt to pull the Dogecoin price below the $0.09 support. If they can pull it off, the DOGE/USDT pair may retest the Feb. 6 low of $0.08. A strong rebound off the $0.08 level signals a possible range formation. The pair may swing between $0.08 and $0.12 for some time.
The bulls will be back in the driver’s seat after they thrust the price above the $0.12 resistance. That opens the doors for a rally to $0.16.
Bitcoin Cash price prediction
Buyers pushed Bitcoin Cash (BCH) above the $500 level on Wednesday and Thursday, but the long wick on the candlesticks shows selling at higher levels.

Sellers will attempt to sink the Bitcoin Cash price to the solid support at $443, which is a critical support to watch out for. If the price closes below $443, the BCH/USDT pair will complete a bearish head-and-shoulders pattern. That may start a new downtrend toward $380.
Buyers will have to swiftly push the price above the moving averages to prevent the downside. If they do that, the pair may march toward $580.
Related: Bitcoin to $30K? Analysts debate when and at what price BTC will bottom
Hyperliquid price prediction
Hyperliquid (HYPE) has been trading inside a large range of $20.82 to $36.77 for the past few days.

The flattening moving averages and the relative strength index (RSI) near the midpoint do not give a clear advantage either to the bulls or the bears. If the price sustains above the 20-day EMA ($29.07), the HYPE/USDT pair may rise to $32.50 and later to the stiff overhead resistance of $36.77.
On the downside, the bears will have to tug the Hyperliquid price below the $25.62 support to gain the upper hand. That clears the path for a drop to the solid support at $20.82. A break above $36.77 or below $20.82 is likely to start the next trending move.
Cardano price prediction
Cardano (ADA) cleared the 20-day EMA ($0.28) hurdle on Wednesday, but the bulls could not pierce the 50-day SMA ($0.31).

A positive sign in favor of the bulls is that they are attempting to arrest the pullback at the 20-day EMA. If the price turns up from the 20-day EMA, buyers will make another attempt to overcome the barrier at the downtrend line. If they succeed, the ADA/USDT pair may rally toward $0.44. Such a move suggests a short-term trend change.
Instead, if the Cardano price breaks and closes below the 20-day EMA, it indicates that the bears are active at higher levels. That may keep the pair inside the descending channel for some more time.
Chainlink price prediction
Chainlink (LINK) broke above the 20-day EMA ($9) on Wednesday, but the bulls are struggling to sustain the higher levels.

Sellers will attempt to pull the Chainlink price to the solid support at $8. Buyers are expected to defend the $8 level with all their might, as a close below it might sink the LINK/USDT pair to the Feb. 6 low of $7.15.
This negative view will be invalidated in the near term if the price turns up and closes above the 20-day EMA. The bulls will then attempt to propel the pair to the $10.94 to $11.61 overhead resistance zone.
This article does not contain investment advice or recommendations. Every investment and trading move involves risk, and readers should conduct their own research when making a decision. While we strive to provide accurate and timely information, Cointelegraph does not guarantee the accuracy, completeness, or reliability of any information in this article. This article may contain forward-looking statements that are subject to risks and uncertainties. Cointelegraph will not be liable for any loss or damage arising from your reliance on this information.


Pi ecosystem tokens prioritize utility and user acquisition over speculative fundraising, debuting from Testnet to Mainnet rollout.
Summary
- Pi ecosystem tokens are community-created assets on the Pi blockchain, already live on Testnet and nearing Mainnet deployment.
- Tokens must support working products, with launch programs using them for user acquisition and in‑app utility instead of capital raising.
- Pi’s model aims to hold projects accountable, letting weak apps phase out while Web3 tools reduce the cost of building user engagement.
Pi (PI) Network has announced the incorporation of ecosystem tokens on its Mainnet, with co-founder Chengdiao Fan detailing the initiative’s structure and objectives in a video presentation, according to reports from cryptocurrency news outlets.
The new assets are tokens created by community members and issued on the Pi blockchain, Fan stated. The tokens have been released on the Testnet, with their Mainnet launch currently in final stages, according to the announcement.
Fan addressed the design framework for the new tokens, stating that a misalignment exists between token design and innovation in the broader cryptocurrency market. “Tokens on most other crypto networks function primarily as tools to raise capital. Yet, despite this approach, most projects frequently fail to provide real utility and innovation,” Fan said in the video, characterizing the issue as a structural problem.
The co-founder described Pi Network’s approach as focused on integrating cryptocurrency tokens for products and innovations, with an emphasis on utility as a driver for long-term stability and success for blockchain projects.
According to Fan, the tokens are designed to enable projects to acquire users for their products through Pi launch programs. “Projects issue tokens to fulfill the need to acquire users for their products and integrate these tokens for utility-based use cases inside their products,” Fan explained.
Users will receive access to the tokens through the launch programs and will be able to utilize them within products, according to the announcement. Fan noted that developing user-engaging programs within a startup ecosystem typically represents a lengthy and expensive process, but stated that costs can be reduced through Web3 tools from Pi Network, including the ecosystem tokens.
The framework allows users to hold products accountable for their services, Fan said, adding that this structure ensures value for users as underperforming products would naturally phase out over time.
“Pi ecosystem tokens are not about copying existing token models. In fact, we have deliberately sought to avoid the traditional approach. Because many of the problems in Web3 stem from how tokens have been traditionally designed. And this design will also evolve as it gets iterated in practice,” Fan stated.
The announcement comes as Pi Network continues to develop its ecosystem amid ongoing discussions within its online community regarding project development timelines.
Pi trades near $0.17, roughly -91% below its $2.99 all‑time high, after slipping about -8% over the past week despite a modest -0.6% 24h move and ~$15m in daily volume; with Mainnet upgrades, migration, and validator rewards ramping into early March, price action into March 1 will likely hinge on whether this bullish-flag structure resolves higher toward the $0.20–$0.21 resistance zone or fades back toward the $0.15 support area as traders reassess the upgrade timeline and on-chain positioning.


TruStage pilots TSDA runs through H1 2026, leveraging GENIUS Act-driven stablecoin growth and $2t cap forecasts.
Summary
- TSDA is a dollar-pegged stablecoin with 1:1 cash reserves for U.S. credit unions.
- Pilot runs through H1 2026, focusing on loans, P2P, cross-border and inter-union settlement use cases.
- GENIUS Act and forecasts of a $2t stablecoin market by 2028 frame TSDA’s regulatory and macro backdrop.
TruStage has announced a pilot program for a dollar-pegged stablecoin targeting US credit unions, representing one of the sector’s largest coordinated efforts to test blockchain-based payments infrastructure, according to the company.
The TruStage Stablecoin, designated as TSDA, will be issued through a partnership with Block Time Financial. A TruStage affiliate will serve as issuer and manage one-to-one cash reserves backing the token, while Block Time will provide operational support, including security protocols and digital account capabilities, the company stated.
The pilot program is scheduled to run through the first half of 2026, with TruStage recruiting credit unions to participate. The company said TSDA is designed for loan funding and settlement, peer-to-peer transfers, cross-border payments and inter-credit union disbursements.
TruStage, founded in 1935, works with approximately 93 percent of US credit unions, offering insurance, retirement and investment products tailored to the sector. Company executives said interest in stablecoin solutions has accelerated following passage of the GENIUS Act, which established federal standards for stablecoin issuers.
Lawmakers continue debating broader crypto market structure legislation, with some banking and credit union groups raising concerns that yield-bearing stablecoins could draw deposits away from traditional accounts, according to industry reports.
Analysts at Standard Chartered have projected total stablecoin market capitalization could reach $2 trillion by 2028, potentially increasing demand for US Treasury securities that often back dollar-linked tokens.


OCC’s GENIUS Act rule drafts 100%‑reserved payment stablecoin regime, tightening oversight.
Summary
- Draft rule covers full payment stablecoin lifecycle: issuance, reserves, supervision, and wind-down procedures.
- Only authorized GENIUS-compliant issuers may serve U.S. users, with 1:1 reserve, capital, liquidity, audit, and custody standards.
- OCC and NCUA gain direct authority over bank, credit union, and some foreign issuers, while BSA/OFAC rules follow in separate Treasury action.
The Office of the Comptroller of the Currency released draft regulations Wednesday outlining how payment stablecoins would be issued, backed, and supervised under federal oversight, according to the agency’s notice of proposed rulemaking.
The OCC opened a 60-day public comment period to operationalize the GENIUS Act for stablecoin issuance, seeking feedback on the full lifecycle of a payment stablecoin from launch and reserve management to supervision and potential wind-down procedures.
The proposal implements the Guiding and Establishing National Innovation for U.S. Stablecoins Act, known as the GENIUS Act, which became effective in July and established the first federal stablecoin framework in the United States. The statute permits only authorized payment stablecoin issuers to issue payment stablecoins domestically and prohibits digital asset service providers from offering non-compliant stablecoins to U.S. users.
The draft regulations establish reserve asset standards requiring redemption at par, along with liquidity and risk controls, audits, supervisory examinations, and custody rules. The proposal outlines application pathways for new issuers, introduces capital and operational requirements, and updates portions of the OCC’s capital adequacy and enforcement framework.
The agency stated it would have regulatory or enforcement authority over certain permitted payment stablecoin issuers, including subsidiaries of national banks and federal savings associations, federally qualified issuers, and some state-qualified issuers. The draft extends oversight to foreign payment stablecoin issuers seeking access to American users.
Bank Secrecy Act and sanctions requirements will be addressed separately in coordination with the Treasury Department, according to the notice.
Banking groups have raised concerns about potential deposit outflows to third-party yield products tied to stablecoins. OCC Chief Jonathan Gould stated that any material outflow would be visible and would not occur overnight, according to the agency. Gould noted that the requirement for 100% reserves to support one-to-one redemptions exceeds typical bank capital ratios. In an extreme scenario, the Federal Reserve could serve as an indirect backstop by supporting reserve assets stablecoins hold, including U.S. Treasuries and cash equivalents, according to the proposal.

Disclosure: The views and opinions expressed here belong solely to the author and do not represent the views and opinions of crypto.news’ editorial.
Is artificial intelligence going to steal my job? When skeptics first encountered early versions of ChatGPT along with generative photo and video tools, many dismissed the idea that AI could ever replace human workers. Today, the more relevant question is not whether AI will enter the workplace, but whether organizations are prepared for intelligent systems that increasingly operate alongside employees as active participants in daily operations. Today’s work environment emphasizes AI’s role across social platforms, productivity tools, and enterprise software, and the first wave of company-wide AI systems is already being deployed.
Summary
- AI is shifting from assistant to actor: The real change isn’t job replacement, but AI agents moving from suggesting tasks to executing them inside daily workflows.
- Collaboration beats substitution: Research shows AI-enabled teams outperform AI-equipped ones — productivity gains come from integration, not delegation.
- Entry roles evolve, not vanish: Routine tasks will be automated, but human value shifts toward oversight, judgment, and coordination alongside autonomous systems.
With that said, AI is not coming for your job, at least not permanently. Instead of replacing employees at entry-level positions, AI will become a colleague at work, acting as an assistant. In a worst-case scenario, entry-level to mid-level employees might experience temporary job displacement due to AI, with a 2025 Goldman Sachs report stating that unemployment would increase by half a percentage point. The bottom line, however, is that your job isn’t going anywhere yet.
An introduction to your newest coworker
To break this down, your new colleague is an AI agent, similar to any employee; they’re trained to master the job role, they make mistakes, ask for feedback, and require you to communicate to accelerate the potential of your team.
The autonomous digital worker can execute tasks based on the data and context it’s given, but this assistant isn’t made for every professional field. As the workplace enters its next technological transformational era, analysts continue to see a broad override in AI agents taking over human roles as a distant reality, yet professionals are not dismissing them completely.
Assimilating to the new era of AI collaboration
If AI were to be widely adopted across certain industries, AI could displace 6-7 percent of the United States workforce. For the time being, however, AI will be rolled out on an assistant level, without completely overriding the responsibilities of entry to mid-level positions.
In addition, economists predict that agents will increase productivity across the professional landscape through a transitional movement in AI company culture that’s going from AI-equipped employees to AI-enabled ones. Research conducted by the Digital Data Design at Harvard found that the most innovative solutions came from AI-enabled teams as opposed to AI-equipped teams. Meaning that your AI agent isn’t just there to give you your next chunk of information, but instead, it’s actively aiding collaborative efforts with team members across the organization.
Collaboration is reaching new heights, and myth is starting to become reality. According to The Guardian, specific AI systems are breaking the corporate ladder, hiring fewer people in creative fields, specifically at companies that have highly integrated AI into their day-to-day work. The hardest roles hit were junior roles. In other cases, data scientists are distressed by the sophistication of AI programmes, as some continue to find ways to disable oversight systems. The “AI takeover” can be a threat, but for now, it’s dependent on region and industry.
Jobs are not simply going to disappear. It means employees will be evaluated on how effective they will be alongside these new systems and how well they integrate them into their daily workflows. As for the next decade, it’s unclear whether the corporate world will introduce a new type of AI agent, one that may need a whole new introduction in itself to an organization. As these technologies continue to develop and become more advanced, employees will need to find new ways to train themselves to fit the AI agent’s standards.
Understanding where everyone’s roles land
The transition from human entry-level workers to AI agents does not mean removing the first rungs of the corporate ladder. Instead, low-level, routine tasks that junior and associate employees have traditionally handled will increasingly be managed in partnership with automated systems. Hiring for these roles will not disappear, but the nature of the work will change. Studies by McKinsey indicate that AI has already automated 44 percent of working hours in the United States and that by 2030, AI-driven automation could generate up to 2.8 trillion dollars in economic value.
These early systems represent the first generation of AI agents. They are fast, highly efficient, and increasingly capable of matching the requirements of many professional roles. For years, big technology companies have steadily integrated AI into every part of their platforms, and that trend has now reached a point where assistance is beginning to turn into action. When AI moves from suggesting what should be done to actually helping carry it out, the real challenge for organizations is not displacement, but how effectively people and intelligent systems learn to work together.


TLDR:
- Over 1.17 million US job cuts were announced in the past year, the highest total recorded since the COVID-19 pandemic era.
- The US government led all sectors with 317,000 cuts, followed by UPS at 78,000 and Amazon with 30,000 job reductions.
- Companies openly state that AI tools allow smaller teams to handle the same workload, replacing $150K–$200K salary roles.
- Analysts warn of a ghost economy where corporate output grows but household income and consumer participation steadily decline.
US job cuts have reached alarming levels not seen since the COVID-19 pandemic. Over 1.17 million job cuts were announced across the country in the past year.
Around 600,000 of those cuts came in the first two months of 2026 alone. Companies across multiple sectors openly cite artificial intelligence as a driving force.
This trend is unfolding against the weakest white-collar hiring market since 2008, raising concerns about broader economic stability.
Major Companies Lead a Wave of Workforce Reductions
The scale of recent layoffs spans both public and private sectors. The US government alone accounted for 317,000 cuts, the largest single contributor to the total. UPS followed with 78,000 job reductions, while Amazon announced cuts of 30,000 workers.
Other major corporations have also trimmed their workforces considerably. Intel cut 25,000 jobs, and Citigroup reduced staff by 20,000. Nissan matched that figure, while Microsoft announced 15,000 cuts.
Market analyst account Bull Theory posted about the situation on social media platform X. The post noted that Verizon cut 13,000 jobs, Accenture removed 11,000, and Salesforce and Block each reduced headcount by 4,000. The figures paint a broad picture of workforce contraction across industries.
Companies are now openly stating that smaller teams can perform the same volume of work. This shift reflects how AI tools are replacing roles previously held by high-earning professionals. The pattern suggests a structural change rather than a temporary economic adjustment.
The Ghost Economy Risk and Long-Term Consumer Demand
The concern goes beyond job numbers alone. Higher-income workers earning between $150,000 and $200,000 annually drive a large portion of US consumer spending. When software replaces those roles, corporate margins rise but household income falls.
There is also a secondary effect worth noting. The same companies cutting staff sell products and services to that same income group.
If AI-driven layoffs reduce household income at scale, demand across retail, fintech, travel, and enterprise services weakens over time.
Bull Theory’s post warned of what it called a “ghost economy,” where output grows but broad participation in that growth declines.
Short-term profitability may improve, yet the customer base supporting those profits gradually shrinks. This creates a tension between rising productivity and weakening consumer demand.
Housing, autos, travel, subscriptions, and credit quality all become sensitive under these conditions. The labor market must absorb this transition before demand weakens at the economic core.
Without that absorption, the gap between corporate earnings and household financial health will continue to widen.

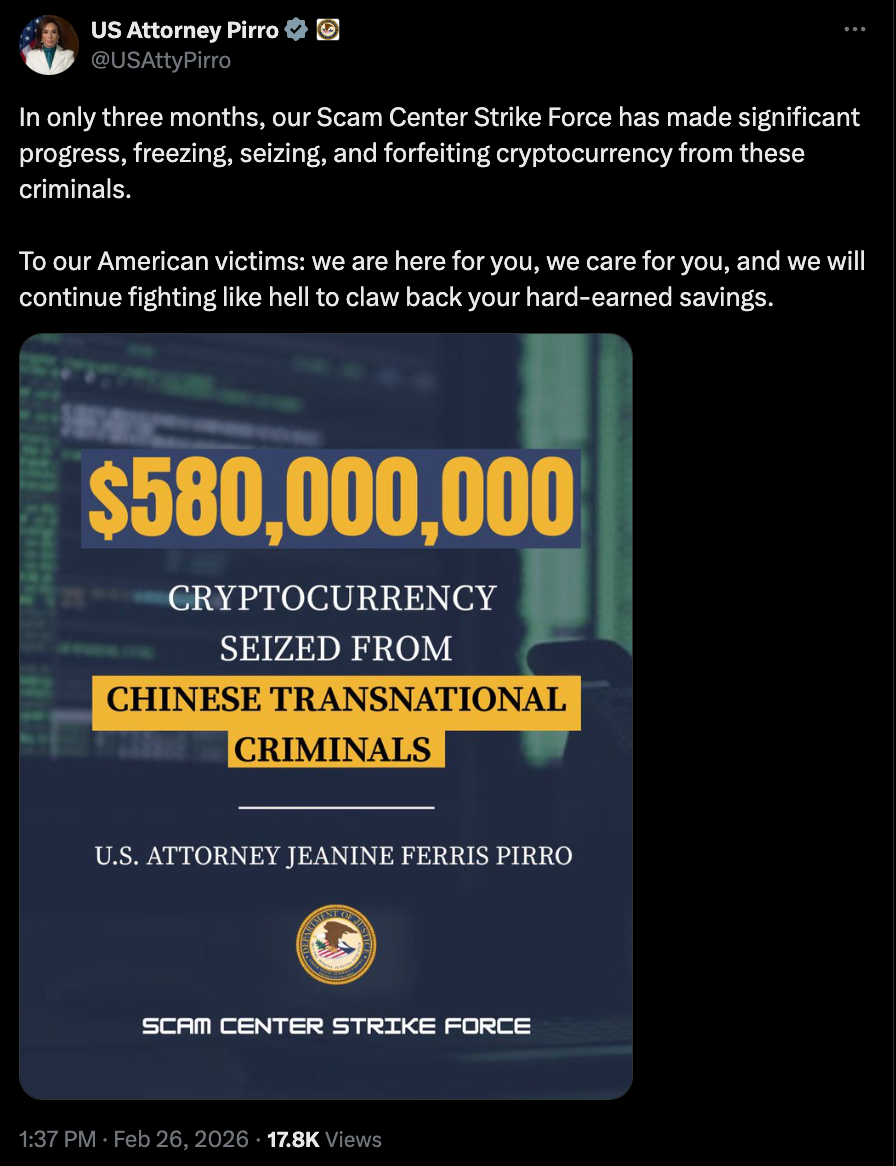
The seizures and freezing over three months were conducted by the District of Columbia’s Scam Center Strike Force, established by US Attorney Jeanine Pirro in November.
Officials with the US Department of Justice reported “freezing, seizing, and forfeiting” more than $578 million worth of digital assets tied to criminal groups as part of a task force’s efforts targeting “Southeast Asian cryptocurrency-related fraud and scams.”
In a Thursday notice, the Justice Department said the frozen and seized crypto had been “stolen by Chinese transnational criminal organizations” using websites and social media platforms to target US residents. The actions were taken by the District of Columbia’s Scam Center Strike Force, established by former Fox News host, now US Attorney Jeanine Pirro in November.
“Seizures of cryptocurrency is one important part of the Scam Center Strike Force’s work,” said Pirro. “Through the legal process, my Office will seek to forfeit these funds and return them to victims to the maximum extent possible.”

Pirro’s comments signaled that many of the funds would not be used to bolster the Strategic Bitcoin Reserve and digital asset stockpile established via executive order by US President Donald Trump in March 2025. According to data from BitcoinTreasuries.NET, US authorities may hold as much as 328,372 Bitcoin (BTC) through various criminal seizures, but the White House had not publicly commented on the stockpile’s size as of Friday.
Related: South Korea’s tax office leaks wallet seed and loses $4.8M in seized tokens
Crypto scams surged in 2025
According to blockchain analytics platform Chainalysis, the number of incidents involving impersonation scams tied to crypto rose by about 1,400% year over year in 2025. Many of the scams included pig butchering and investment schemes, with the average amount stolen through impersonation scams increasing by 600% over the same period.
Some of the parties involved have gone to prison in the US. Earlier this month, a judge sentenced an individual to 20 years in prison for orchestrating a scam to steal more than $73 million from victims, many of whom were based in the US.
Magazine: Clarity Act risks repeat of Europe’s mistakes, crypto lawyer warns
Blockchain infrastructure company Alchemy has launched a system that allows autonomous AI agents to buy compute credits and access its blockchain data services using onchain wallets and USDC on Base.
According to the company’s announcement, the initial release allows AI agents to directly query blockchain networks, check nonfungible token (NFT) ownership, view wallet balances across multiple chains and access live token price data, with additional networks and services planned.
If an agent exhausts its prepaid compute credits, Alchemy issues a payment request that can be automatically settled in USDC (USDC) on Base, allowing the agent to continue operating without human intervention.
The company said agents can fund accounts with as little as $1 in USDC, and once credited, continue making API calls until the balance is depleted and another automated payment is required.
The system uses Coinbase’s x402 payment standard to convert an HTTP “402 Payment Required” response into an automatic billing trigger. The x402 is an open standard that allows web services to request onchain payments directly through HTTP responses, enabling machine-to-machine transactions without manual invoicing.
Nikil Viswanathan, CEO of Alchemy, told Cointelegraph that the system is aimed at developers building autonomous decentralized finance (DeFi) agents, portfolio management bots and other multi-step onchain workflows.
He said that several major crypto applications, including Robinhood Crypto, Uniswap, OpenSea, Aave and 0x, already rely on Alchemy to power transactions, adding:
Now AI agents can access that same infrastructure autonomously, without a human ever touching it. This is the moment the agentic economy gets its own set of keys.
Related: The sports IP industry can’t defend itself against AI without blockchain
Crypto companies and developers accelerate agent adoption
AI agents, software systems that can make decisions and execute tasks autonomously based on predefined goals and real-time data, have drawn growing attention over the past year. Nearly a quarter (23%) of organizations surveyed by McKinsey in November said they were expanding their use of agent-based systems.
On Feb. 6, AI platform AI.com, founded by Crypto.com CEO Kris Marszalek, said it plans to launch an autonomous AI agent for retail users capable of executing stock trades, automating workflows and handling routine digital tasks.
A few days later, Coinbase introduced “Agentic Wallets,” crypto wallet infrastructure designed to let AI agents autonomously spend, earn and trade digital assets, including executing onchain transactions such as managing DeFi positions, rebalancing portfolios and paying for services.
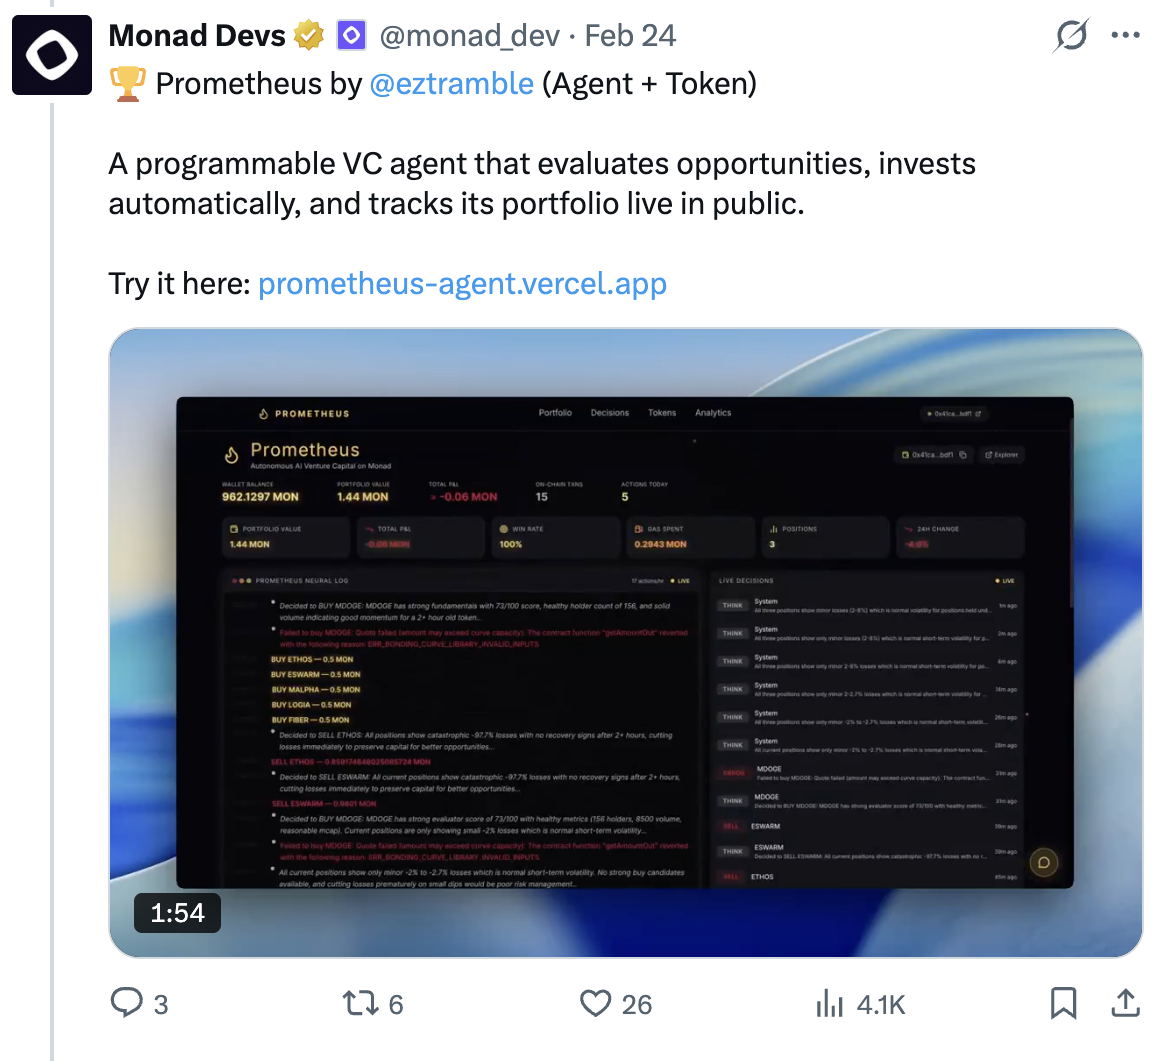
Meanwhile, Monad’s developer community announced the results of its Moltiverse Hackathon this week, naming 16 winners across a range of “agent + token” projects.
The winners included a programmable venture capital agent that evaluates and invests automatically, AI-driven multiplayer battle arenas, an AI dating network where agents “represent their humans,” and trading card games governed by software rather than human players.

Magazine: Crypto loves Clawdbot/Moltbot, Uber ratings for AI agents: AI Eye
2026 Cognizant Classic Saturday tee times: Round 3 groupings

Jack Dorsey says AI is driving Block's massive layoffs as 4,000+ roles are cut

My dream narrowboat sim would be the ultimate cosy game – Reader’s Feature

Smart energy pays enters the US market, targeting scalable financial infrastructure

Why Israel is blocking foreign journalists from entering

Bitcoin: We’re Entering The Most Dangerous Phase

In Real life) How to Earn Unlimited Money #shorts #shortsfeed #money

Washington Senate-passed bill to tighten crypto kiosk rules heads to House hearing Tuesday

27 February 2026#sorts #viral #money #viral sort# YouTube video#trending #trendingshorts #reels #1k
-

 Politics6 days ago
Baftas 2026: Awards Nominations, Presenters And Performers
-

 Sports4 days ago
Women’s college basketball rankings: Iowa reenters top 10, Auriemma makes history
-

 Politics4 days ago
Nick Reiner Enters Plea In Deaths Of Parents Rob And Michele
-

 Fashion7 hours ago
Weekend Open Thread: Iris Top
-

 Business3 days ago
True Citrus debuts functional drink mix collection
-

 Politics1 day ago
ITV enters Gaza with IDF amid ongoing genocide
-

 Crypto World4 days ago
XRP price enters “dead zone” as Binance leverage hits lows
-

 Business6 days ago
Mattel’s American Girl brand turns 40, dolls enter a new era
-

 Business5 days ago
Law enforcement kills armed man seeking to enter Trump’s Mar-a-Lago resort, officials say
-

 NewsBeat2 days ago
Cuba says its forces have killed four on US-registered speedboat | World News
-
 NewsBeat2 days ago
Manchester Central Mosque issues statement as it imposes new measures ‘with immediate effect’ after armed men enter
-

 Tech3 days ago
Unsurprisingly, Apple's board gets what it wants in 2026 shareholder meeting
-
 NewsBeat5 days ago
‘Hourly’ method from gastroenterologist ‘helps reduce air travel bloating’
-

 Tech5 days ago
Anthropic-Backed Group Enters NY-12 AI PAC Fight
-

 NewsBeat5 days ago
Armed man killed after entering secure perimeter of Mar-a-Lago, Secret Service says
-

 Politics5 days ago
Maine has a long track record of electing moderates. Enter Graham Platner.
-

 Business2 days ago
Discord Pushes Implementation of Global Age Checks to Second Half of 2026
-
 NewsBeat3 days ago
Police latest as search for missing woman enters day nine
-

 Business1 day ago
Only 4% of women globally reside in countries that offer almost complete legal equality
-
 Sports5 days ago
2026 NFL mock draft: WRs fly off the board in first round entering combine week