

Crypto World
Is the Ripple ETF Hype Over? Inflows Disappoint as XRP Fights for $1.40

XRP went through intense volatility on Saturday, but it had nothing to do with the ETFs.
Although they have ended the underwhelming zero-inflow-day streak, the spot XRP ETFs are still far away from their initial glory in terms of net inflows.
At the same time, the underlying asset continues to fight with BNB for the fourth spot in the cryptocurrency market cap ranking, but it sits inches below a crucial resistance.
Ripple ETF Inflows Still Missing
CryptoPotato has reported on several occasions on the diminishing activity on the XRP ETF front. The financial vehicles saw under $8 million in net inflows during the trading week that ended on February 13, and less than $2 million in the following one. Moreover, it had three days with zero inflows during this time, a streak that extended to February 23.
However, investors finally picked up the pace in the next four trading days, albeit in a very modest manner. The net inflows stood at $3.04 million on Tuesday, $3.09 million on Wednesday, $1.22 million on Thursday, and $2.21 million on Friday. Overall, the week ended in the green, with $9.55 million entering the funds.
This modest amount is in stark contrast to the initial boom. After the first XRP-focused ETF went live for trading in mid-November, investors were rushing to pour funds into it and the four more such products that followed. Consequently, the cumulative net inflows skyrocketed to the $1 billion mark within a month since Canary Capital’s XRPC saw the light of day.
Since then, though, the trend has seemingly changed. The total net inflows stand at $1.24 billion now, which means that only $240 million has entered the funds in over two months.
XRP Fights BNB
Saturday was an eventful day in the crypto markets due to the strikes against Iran and the subsequent retaliation. XRP was not immune as it dumped from $1.43 to $1.27 before it rebounded to its starting point after reports that Iran’s Supreme Leader was killed during the attacks.
You may also like:
Popular crypto analyst CryptoWZRD noted that the asset had closed with a “dragonfly doji candle and respected the $1.30 daily support.” They believe XRP could continue higher only if it manages to close weekly above $1.3820. As of press time, the asset trades inches below that line. However, it has retaken its fourth place in terms of market cap from BNB after a quick flip on Saturday.
XRP Daily Technical Outlook:$XRP closed with a dragonfly doji candle and respected the $1.3000 Daily support. However, anything is possible due to geopolitics. Tomorrow is the Weekly transition. Above the $1.3820 resistance it can push higher if the breakout remains stable 😈 pic.twitter.com/YJaJyp0DTt
— CRYPTOWZRD (@cryptoWZRD_) March 1, 2026
Binance Free $600 (CryptoPotato Exclusive): Use this link to register a new account and receive $600 exclusive welcome offer on Binance (full details).
LIMITED OFFER for CryptoPotato readers at Bybit: Use this link to register and open a $500 FREE position on any coin!

Crypto World
PENDLE Targets $30 After 86% Crash: Is DeFi’s Only Yield Protocol Set for a 5,000% Comeback?

TLDR:
- PENDLE has corrected 86% from its 2024 high of $7.53, with price now compressing near a key weekly demand zone.
- Analyst CryptoPatel projects targets of $3, $5, $15, and $30, citing a potential 5,330% move from accumulation range.
- The sPENDLE upgrade redirects 80% of protocol revenue to buybacks, creating roughly $32 million in annual buying pressure.
- New products Boros and Citadels target funding rate derivatives and a $4.5 trillion Islamic finance market in 2026.
PENDLE, currently trading around $1.27, has drawn attention from crypto analysts after an 86% correction from its 2024 cycle high near $7.53.
The token operates as DeFi’s only yield tokenization protocol, splitting yield-bearing assets into Principal Tokens and Yield Tokens.
With a market cap of roughly $214 million against $3.44 billion in total value locked, some traders see an asymmetric setup forming on higher timeframe charts.
Technical Structure Points to Accumulation Phase
Price action on the weekly chart shows PENDLE compressing inside a multi-year descending channel since its 2024 peak.
The 0.786 Fibonacci retracement sits near $0.844, aligning with what analysts describe as a high-probability accumulation zone.
Sell-side liquidity sweeps into this area have been absorbed, suggesting reduced selling pressure at current levels.
Crypto analyst CryptoPatel noted the setup on social media, pointing to a demand block between $0.84 and $0.60 as a key zone.
The analyst stated targets at $3, $5, $15, and $30, projecting a potential 1,684% to 5,330% move from the lower accumulation range.
The bullish structure holds as long as PENDLE stays above $0.60 on the weekly timeframe, with invalidation below $0.46.
Volatility contraction on the weekly chart is another factor analysts are watching. Historically, extended compression periods in crypto assets have preceded sharp directional moves.
A fractal comparison to a prior cycle shows PENDLE previously rallied 1,521% from a similar structure, though past performance does not guarantee future results.
Institutional activity adds context to the setup. Arthur Hayes reportedly accumulated $973,000 worth of PENDLE, while Binance Labs and Spartan Group are listed as investors in the project.
Fundamentals and New Products Support Long-Term Case
PENDLE generates over $40 million in annual revenue from real trading activity, giving it a price-to-earnings ratio below 20x at current prices.
The protocol’s MC/TVL ratio stands at 0.06x, which analysts consider low relative to comparable DeFi infrastructure projects.
An 80% revenue buyback mechanism through sPENDLE creates roughly $32 million in annual buying pressure at current revenue levels.
The protocol is live on more than eight chains, with planned integration across Solana, TON, and Hyperliquid. Its new product, Boros, targets the funding rate derivatives market, which sees over $150 billion in daily volume.
Early testing of Boros recorded $5.5 billion in notional volume and $730,000 in early revenue.
Another product, Citadels, targets institutional and Shariah-compliant users, opening access to a $4.5 trillion Islamic finance market.
As tokenized bonds and real-world asset treasuries expand on-chain, PENDLE’s yield trading infrastructure positions it within that growing sector.
The protocol also cut emissions by 30% alongside the sPENDLE upgrade, reducing token supply pressure going forward.

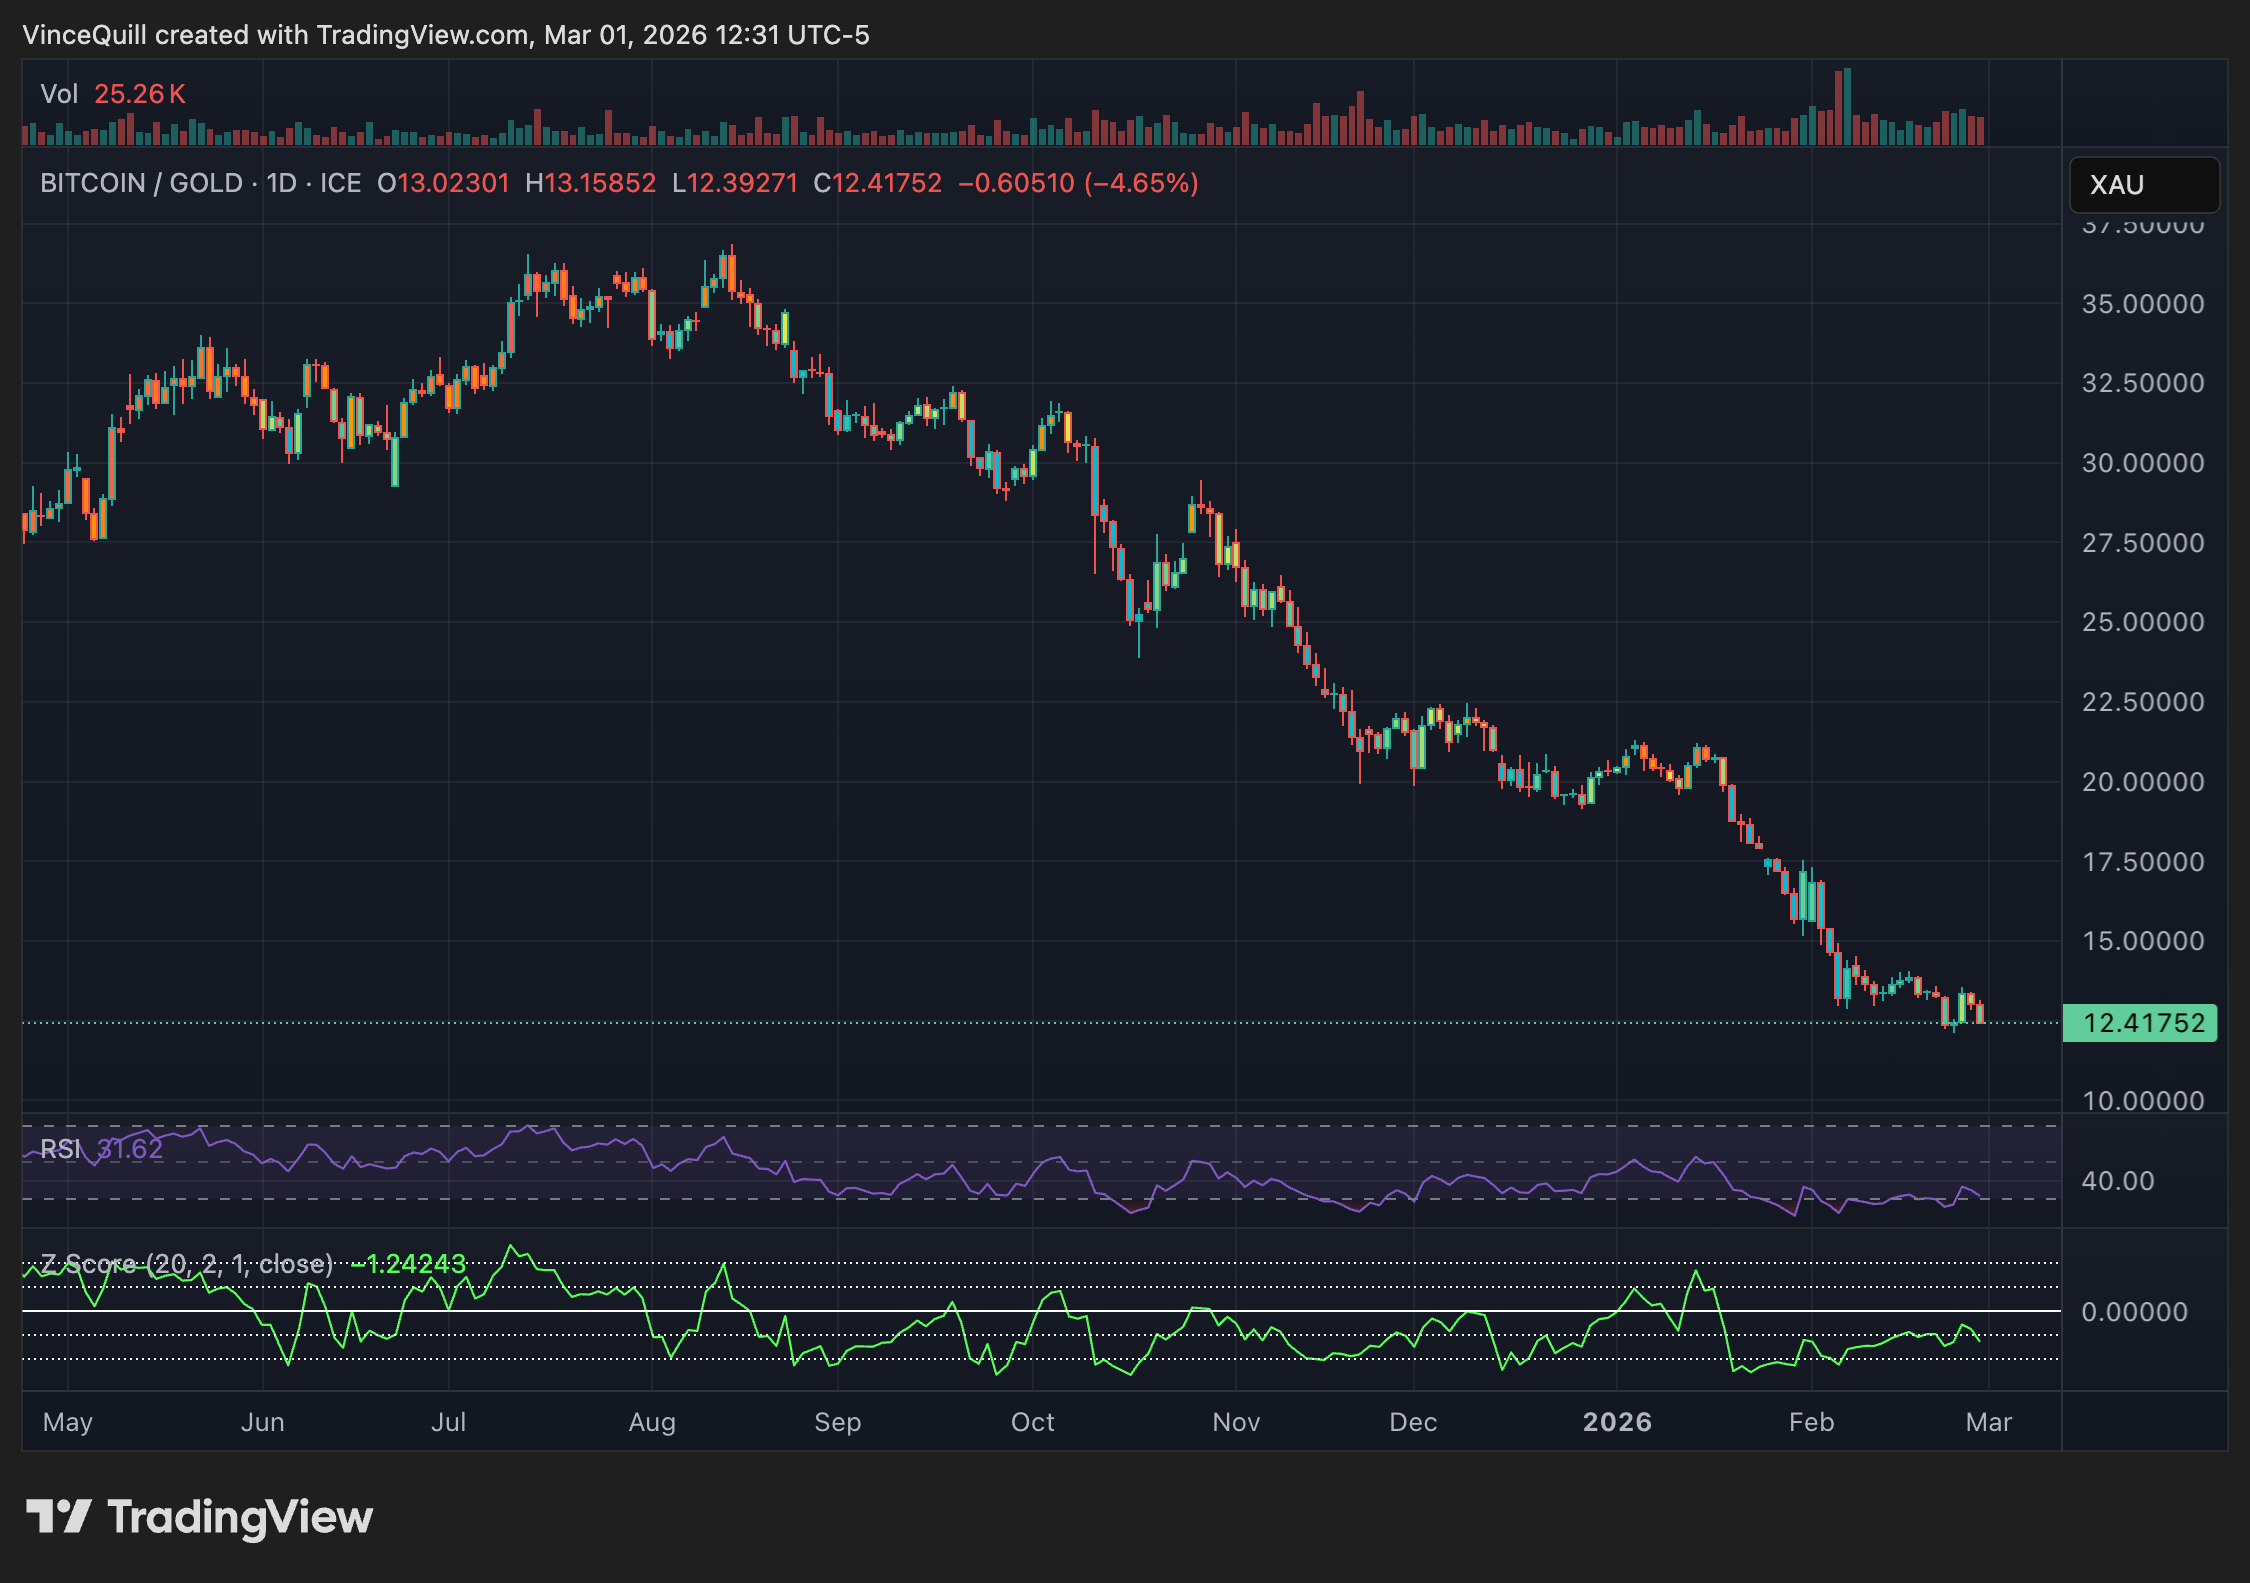
Bitcoin (BTC) is relatively undervalued compared to gold and the global money supply, which could signal a price reversal, according to Samson Mow, the CEO of Bitcoin technology company Jan3.
“Bitcoin is about 24%-66% below its trend relative to gold’s market cap or global money supply, while gold is overextended,” Mow said in a Saturday post on X.
Gold futures for April delivery closed Friday at $5,247.90; Tokenized gold PAX Gold USD was trading at the time of writing at $5,404.14.
Mow also cited Bitcoin’s Z-score, a metric that tracks how close the price of BTC is to its historic average. A Z-score of 0 indicates that the price is in line with the average, while a Z-score above 0 indicates that the price is moving above average levels.

A score below 0 signals that the price is trading below the average. When the Z score of the Bitcoin-to-gold ratio drops below -2, Bitcoin has experienced “major” price rallies, Mow said. The Z score of the BTC-to-gold ratio is about -1.24 at the time of writing.
Data from TradingView shows that the metric dropped below -3 in November 2022, amid the collapse of crypto exchange FTX and the price of BTC rallied by over 150% over the next 12 months.

Earlier, a similar pattern played out during the Covid crash in March 2020, when the metric fell below -2 and Bitcoin reached a low of about $3,717. Bitcoin surged by over 300% in the following 12 months, and by November 2021, BTC reached what was then the all-time high of about $69,000.
Related: Bitcoin traders eye Iran reactions as oil sparks US 5% inflation forecast
Bitcoin to crash to $50,000?
The analysis from Mow is a contrarian view to other analysts, who forecast more pain ahead for the crypto market and a further drop in Bitcoin prices due to investor uncertainty and geopolitical tensions.
The price of BTC may be headed toward $50,000, according to crypto market analysts, who say that price action may be mirroring the 2022 bear market.
Bitcoin fell by over 50% from peak to trough, to a low of $60,000, before staging a limited recovery to current levels of near $66,400 in the wake of this weekend’s developments in the Middle East.
Magazine: Bitcoin to see ‘one more big thrust’ to $150K, ETH pressure builds: Trade Secrets
TLDR:
- The US-Iran conflict has eliminated key Iranian figures, but no regime change has been confirmed yet.
- Iran continues launching missiles post-US strikes, signaling further escalation and rising market uncertainty.
- Oil tankers are reversing course at the Strait of Hormuz, triggering early signs of a global supply shock.
- Analysts warn oil could surpass $100 per barrel, pushing inflation higher and crushing crypto market gains.
The crypto market is bracing for extreme volatility over the next 24 to 48 hours. Escalating tensions between the United States and Iran have reached a critical turning point.
The US has conducted attacks on Iran, eliminating several key figures in the process. However, a full regime change has not yet taken place, and the situation remains fluid.
Iran continues to launch missiles, signaling possible further escalation ahead. Crypto analyst Crypto Rover has issued a major warning to global investors.
US Futures Open as Military Conflict Creates Financial Uncertainty
The opening of US futures markets comes directly after the US launched military strikes on Iran. Most key Iranian figures have been eliminated through coordinated US and Israeli operations.
Yet the conflict remains active, and regime change has not been achieved. This ongoing uncertainty is already creating nervousness among investors in global financial markets. Market participants are also watching closely for any diplomatic developments in the region.
Iran’s continued missile activity is a clear sign that the conflict is far from resolved. Financial markets have historically responded poorly to sustained and unresolved geopolitical crises.
Crypto Rover warned on X: “Iran is still launching missiles, which is a sign of more escalation, and the markets hate that.” Traders are already bracing for sharp price swings ahead.
A significant drop in US stock futures could push the crypto market into a steep decline. Risk assets like Bitcoin and Ethereum tend to closely mirror equity market moves during a crisis.
Analysts suggest that traders monitor overnight futures data carefully before making any moves. The opening sessions will likely determine the near-term financial direction for global markets.
Strait of Hormuz Crisis Adds Oil Supply and Inflation Pressure
The Strait of Hormuz has become a critical flashpoint in the ongoing US-Iran conflict. Around 20% of the world’s total oil supply passes through this narrow and strategic waterway daily.
Several oil tankers have already reversed course due to fears of missile strikes in the area. This early disruption has already produced visible signs of an oil supply shock across global markets.
Some market analysts predict oil prices could climb above $100 per barrel if hostilities continue. Rising oil prices push inflation higher across global economies, placing pressure on central banks to respond.
Higher inflation typically leads to tighter monetary policy, which weighs heavily on speculative assets. This kind of environment has historically been unfavorable for the broader crypto market.
Major economies, including China, Japan, and India, depend on this route for between 70% and 80% of their oil. A prolonged blockade would cause serious economic damage across Asia and beyond.
Crypto Rover noted that the market will not wait for a formal blockade to begin reacting. The crypto market is expected to move well before any official disruption is confirmed.
Crypto World
Vitalik Buterin Proposes Binary State Trees and RISC-V Upgrade to Overhaul Ethereum’s Execution Layer
TLDR:
- EIP-7864 proposes replacing Ethereum’s hexary keccak tree with a binary structure, cutting Merkle branch size by 75%.
- Blake3 and Poseidon hash functions could accelerate Ethereum’s proving efficiency by up to 100x over the current keccak setup.
- Replacing the EVM with RISC-V would reduce a ZK prover translation layer, cutting the protocol’s proving bottleneck by over 80%.
- A three-stage RISC-V rollout preserves full EVM backwards compatibility while retiring legacy infrastructure through a smart contract wrapper.
Ethereum execution layer improvements are at the center of a detailed proposal from Vitalik Buterin. The Ethereum co-founder recently shared a comprehensive breakdown of two major technical changes.
His post covers a transition to binary state trees and a long-term shift away from the EVM. Both changes target proving efficiency, client-side capabilities, and long-term protocol simplicity.
Together, they represent the most sweeping architectural rethink of Ethereum’s base layer in years.
Binary Trees: A Structural Overhaul of Ethereum’s State
The state tree change is among the most technically concrete proposals Buterin outlined. It centers on EIP-7864, which proposes replacing the current hexary keccak Merkle Patricia Tree with a binary tree structure.
The new design uses a more efficient hash function. Buterin noted on social X that this switch produces Merkle branches four times shorter than the existing setup.
Shorter branches make client-side verification cheaper. Tools like Helios and PIR would see a 4x reduction in data bandwidth costs.
On top of that, swapping out the hash function adds further efficiency gains. Blake3 could deliver roughly three times the speed over keccak, while a Poseidon variant could achieve 100 times the improvement, though more security review is needed there.
The binary design also groups storage slots into pages of 64 to 256 slots each. This allows storage to benefit from the same efficiency as code loading.
Many decentralized applications that frequently read from the first few storage slots could save over 10,000 gas per transaction as a result.
VM Changes: The Case for Replacing the EVM
Buterin made a pointed argument for replacing the EVM itself over the longer term. He pointed to a pattern where developers try to avoid the EVM whenever possible, treating it as an obstacle rather than a feature.
To him, this defeats the purpose of Ethereum’s generality. The fix, he argues, is building a better virtual machine rather than adding more workarounds.
His preferred candidate is RISC-V, the same architecture that most ZK provers already use. The reasoning is direct: if provers are already written in RISC-V, making the new VM be RISC-V removes an entire translation layer.
A RISC-V interpreter requires only a few hundred lines of code. Buterin described this as what a blockchain VM “should feel like.”
He proposed a three-stage rollout. The new VM would first handle precompiles, replacing roughly 80% of today’s precompiles with NewVM code. Users would then gain the ability to deploy NewVM contracts directly.
Finally, the EVM would retire and become a smart contract written in the new VM, preserving full backwards compatibility for existing users except for gas cost shifts.
What This Means for Ethereum’s Proving Infrastructure
Buterin was direct about why these changes matter beyond aesthetics. State trees and the VM together account for more than 80% of the proving bottleneck today.
Fixing both is essentially a prerequisite for any meaningful expansion of client-side proving. Without these changes, ZK applications that need to compose with Ethereum’s state must maintain their own separate trees, which adds complexity and cost.
The binary tree change allows Ethereum’s native state to become prover-friendly. That opens the door for ZK applications to work directly with Ethereum’s storage rather than building around it.
This would reduce the overhead that many privacy protocols and wallet applications currently carry.
Buterin acknowledged the VM changes remain more speculative and do not yet have broad consensus. However, he expressed confidence that once the state roadmap is in place, replacing the EVM will become the obvious choice.
His framing positions both changes as practical necessities rather than theoretical improvements, tied directly to the network’s ability to scale proving workloads across a wider range of use cases.

Rising tensions around the Strait of Hormuz are once again forcing crypto traders to look beyond blockchain fundamentals and toward global macro risk.
Roughly 20% of the world’s oil supply passes daily through the narrow maritime corridor between Iran and Oman. While no full closure has been confirmed, escalating military activity in the region has already pushed war-risk insurance premiums sharply higher.
Oil, Yields, and $2 Trillion in Liquidity: Why Crypto Could Be First to Crack
Premiums on oil tankers have surged more than 50%. At the same time, insurance costs for a $100 million vessel jumped from approximately $250,000 to $375,000 per voyage.
The spike in shipping risk alone, even without a formal blockade, has been enough to raise fears of supply disruption. Several analysts have suggested that crude oil could surge to $120–$130 per barrel under a prolonged disruption scenario.
“Estimates suggest crude could jump to $120–$130 per barrel,” wrote analyst 0xNobler in a post.
For crypto markets, the implications go far beyond energy.
The Inflation-to-Liquidity Transmission
An oil spike of that magnitude would likely reignite inflation expectations just as markets have been positioning for policy easing.
Higher crude prices feed directly into transportation, manufacturing, and consumer goods costs, putting upward pressure on CPI data globally.
“Wars are generally inflationary, driving up commodity prices and widening fiscal deficits, and despite an initial knee‑jerk selloff when the conflict began, it makes sense that we have subsequently seen Bitcoin prices recover over the weekend, given it also benefits from higher inflation expectations,” 21Shares Head of Macro Stephen Coltman told BeInCrypto in an email.
If inflation expectations rise, central banks, including the US Federal Reserve, may be forced to delay or scale back anticipated rate cuts. That repricing would likely push Treasury yields higher.
And yields are where crypto risk begins.
Rising yields tighten global liquidity conditions. When government bonds offer increasingly attractive returns, capital often rotates away from speculative assets. Trillions in rate-sensitive capital across bonds and equities could be repriced if yields rise materially amid renewed inflation fears.
Bitcoin has historically traded as a high-beta liquidity asset during tightening cycles. During prior periods of rising real yields, digital assets have tended to underperform as leverage unwinds and funding costs climb.
In other words, crypto does not need a geopolitical catastrophe to fall. It only needs liquidity to tighten.
Several prominent crypto commentators have warned of an imminent spike in volatility. Posts from accounts such as DeFiTracer and 0xNobler framed the Strait of Hormuz situation as a potential macro “turning point,” outlining a chain reaction:
“Higher oil → higher inflation → no rate cuts → rising yields → tightening liquidity.”

Meanwhile, Merlijn the Trader introduced a secondary risk. The analyst cites a potential hashrate shock if energy infrastructure in Iran, reportedly a hub for low-cost Bitcoin mining, were disrupted.
While speculative, such narratives add to broader uncertainty around supply dynamics and network stability.
Still, not all political voices share the alarm. President Donald Trump publicly commented that he is “not concerned” about the Strait of Hormuz situation.
Markets, however, tend to respond more directly to bond yields than to political reassurance.
Crypto’s Deleveraging Risk
The structure of crypto derivatives markets adds another layer of fragility. Leverage tends to build during periods of calm, and sudden macro shocks can trigger cascading liquidations.
If Treasury yields spike alongside oil, leveraged positions across Bitcoin and altcoins could unwind quickly.
High-risk assets, including small-cap equities, high-growth tech stocks, and cryptocurrencies, are typically the first to feel pressure when liquidity tightens.
Unlike traditional markets, crypto trades 24/7, meaning reactions can be immediate and amplified.
It explains why traders are already watching crude futures and bond markets as leading indicators. A temporary de-escalation could stabilize oil and restore risk appetite.
A sustained disruption, however, could transform what begins as an energy shock into a broader liquidity event.
The coming sessions, starting Monday, may determine whether this remains geopolitical noise or becomes crypto’s next macro-driven selloff.

Strategy chairman Michael Saylor used social media to announce a dividend adjustment at the Bitcoin treasury vehicle STRC. The company has raised the monthly distribution on STRC (EXCHANGE: STRC) to 11.50% for March 2026, up from 11.25%. STRC is a perpetual preferred stock with a variable yield that changes on a monthly basis, a design intended to balance income with trading dynamics around its $100 par value. The company’s update confirms that the payout remains monthly, with the next distribution scheduled for March 31 to shareholders of record. The move comes amid a broader pivot in Strategy’s financing approach and a continuing expansion of its Bitcoin (CRYPTO: BTC) holdings.
The STRC update, published on the company’s own site, explains that the dividend rate is adjusted monthly to encourage trading activity around the par value and to help dampen price volatility. This mechanism is part of a broader strategy to rely more on preferred stock than common equity for BTC-related funding. The social post from Saylor aligns with Strategy’s stated direction and adds color to a year in which the company has increasingly leaned on structured finance instruments to support its Bitcoin purchases.
On the same subject, February marked a notable shift in Strategy’s funding approach. CEO Phong Le described a transition away from issuing common stock to fund Bitcoin acquisitions toward issuing more preferred shares. The company has argued that the stretch and associated perpetual preferreds have proven effective at raising capital, citing last year’s fundraising results as a proof point.
Le has highlighted the scale of STRC and perpetual issues in the market, noting that last year these instruments raised about $7 billion, representing roughly a third of the entire domestic preferred market. The company’s leadership has signaled that 2026 could see more of a structural emphasis on preferred capital as a means to fund ongoing Bitcoin accumulation while managing shareholder dilution and equity risk. In this context, the market has watched Strategy continue to accumulate BTC, even as Bitcoin’s price has swung lower amid a broader risk-off environment.
In the meantime, Strategy has faced a tougher market backdrop. The price of Bitcoin itself has slipped significantly since October, and Strategy’s common stock has mirrored a broader downturn in crypto-related equities. The company’s stock, which tracks as a proxy for its Bitcoin holdings and management strategy, has retreated from the highs seen in late 2024 and has traded in a lower range in recent months. Data from Saylor Tracker shows Strategy’s aggregate Bitcoin purchases and the balance sheet moving forward, even as the stock’s price has come under pressure from a challenging macro and crypto market environment.
Looking at the larger picture,Bitcoin (CRYPTO: BTC) has fallen by more than a quarter year-to-date, a factor that has weighed on public companies with substantial corporate treasuries. In parallel, the Bitwise Bitcoin Standard Corporations ETF (EXCHANGE: OWNB) has also declined, underscoring the broader drag on equities tied to crypto balance sheets. The latest data shows Strategy’s BTC holdings continuing to accumulate, even as near-term price movements complicate capital planning. Strategy’s trackers and public disclosures show a continued cadence of purchases and a growing balance sheet despite market headwinds.
From a performance perspective, Strategy has faced a grim year in the stock market. The company reported a net loss of $12.4 billion for Q4 2025, released in February, even as revenue rose modestly to about $123 million for the quarter. The earnings backdrop has weighed on investor sentiment, contributing to a broader decline in Strategy’s share price, which fell sharply from the record highs reached in late 2024. The stock hovered around $129.50 at the end of the week, well below its peak levels, highlighting the contrast between the company’s aggressive BTC accumulation and the market’s appraisal of its profitability trajectory. Within this landscape, the price of BTC remains a critical driver of Strategy’s fortunes, underscoring the sensitivity of a BTC-focused treasury model to macro and crypto volatility. The company’s long-running accumulation strategy has included notable milestones, such as the 100th BTC purchase and the expansion of its balance sheet to 717,722 BTC, a testament to the scale of its framing of corporate treasury capacity around Bitcoin.
As the market contends with volatility, Strategy’s approach highlights a broader industry trend: corporate treasuries in the crypto space increasingly lean on structured finance and preferred equity to finance continued accumulation, balancing the goal of owning more BTC with managing equity risk and investor expectations. The broader market environment—characterized by price swings in BTC and a wave of related financial instruments—continues to challenge traditional capital-raising methods, pushing some issuers to rethink balance-sheet financing in favor of instruments like STRC and other perpetual preferreds. The company’s ongoing BTC purchases, including the relatively recent tranches, underscore a willingness to endure short-term price pressures for the longer-term objective of building a sizable Bitcoin reserve. The evolution of Strategy’s capital stack—moving from common equity toward preferred capital—also raises questions about how such a shift will influence liquidity, dividend policy, and the eventual realization of BTC gains in the face of market cycles. The narrative surrounding STRC’s yield adjustments and the related financing strategy paints a picture of a company that remains deeply committed to Bitcoin accumulation, even as it navigates a period of volatile prices and mixed financial results.
In a landscape where both crypto prices and the equities tied to corporate treasuries face headwinds, Strategy’s strategy remains closely watched by investors seeking exposure to Bitcoin through a corporate balance sheet. The company’s public communications, including updates to STRC’s dividend policy and its pivot toward preferred financing, signal a concerted effort to optimize capital structure while maintaining Bitcoin exposure. For market participants, the question remains how sustainable a perpetual preferred-based approach will be in delivering consistent returns to shareholders as BTC price and macro conditions evolve. The intersection of rising dividend yields, ongoing BTC purchases, and shifting financing sources will continue to shape the trajectory of Strategy and its peers in the crypto treasury space.
Why it matters
Strategy’s renewed emphasis on STRC’s elevated dividend rate and the ongoing shift toward preferred capital exposure matters because it reflects a practical adaptation to the realities of financing a BTC-heavy corporate treasury in a volatile market. By adjusting the monthly yield for STRC and maintaining a steady payout schedule, the company aims to offer income stability to investors while cycling through capital to acquire more BTC. This approach could influence the appetite for similar structures among other corporate treasuries seeking to scale Bitcoin holdings without diluting common equity, potentially shaping the broader landscape of crypto corporate finance.
For investors, the shift away from common stock toward preferred capital signals a potential change in risk and return profiles. Preferreds typically occupy a different position in the capital structure, often offering higher yields with a priority claim on assets and earnings relative to common shares. If Strategy can sustain its BTC accumulation while delivering consistent yields, it could attract institutional investors seeking exposure to Bitcoin through a structured instrument with a predictable income stream. However, the persistent price volatility of BTC and the performance of Strategy’s own equity remain critical inputs in assessing the risk-reward balance of this approach. The ongoing performance of Strategy’s BTC holdings, its Q4 2025 earnings, and the trajectory of its financing strategy will likely influence investor sentiment and the broader adoption of similar mechanisms in the crypto treasury space.
Ultimately, the interplay between BTC price movements, dividend policy, and the company’s financing choices will determine how STRC and other crypto treasury instruments fare over time. The market is watching whether the pivot to preferred capital can deliver a sustainable path to capital formation that supports Bitcoin accumulation while avoiding excessive dilution or cost of capital concerns. As Strategy continues to publish updates on its BTC purchases and balance sheet composition, observers will gauge whether this model can translate into durable value creation for shareholders in a sector still defining its long-term viability.
What to watch next
- Monitor STRC’s next monthly dividend adjustment and March 31 payout date for record holders.
- Watch Strategy’s ongoing pivot toward preferred capital and any subsequent financing rounds or issuances.
- Track BTC purchases and total holdings, including the 592 BTC purchase in the week of Feb. 16, to see if the pace of accumulation accelerates or slows.
- Assess Strategy’s Q1 2026 results for any improvement in operating metrics alongside BTC balance sheet expansion.
- Observe market reactions to STRC dividend changes and any European listings related to STRC ETP developments.
Sources & verification
- STRC dividend rate and payout schedule confirmation on Strategy’s official Stretch page.
- Saylor’s post on X (formerly Twitter) confirming the dividend adjustment.
- Strategy’s February statement about shifting from common stock to preferred stock for BTC funding.
- Strategy’s public disclosures of BTC purchases, including the 592 BTC purchase and total holdings of 717,722 BTC.
- Q4 2025 results reporting a net loss of $12.4 billion and revenue of about $123 million.
Strategy’s evolving capital mix and ongoing BTC accumulation
Strategy’s leadership has publicly framed 2026 as a year of structural evolution, with STRC (EXCHANGE: STRC) and other perpetual preferred instruments playing a central role in capital formation. The company’s chairman, Michael Saylor, communicated through a social post that STRC’s dividend rate is being adjusted monthly, targeting an 11.50% yield for March 2026. This adjustment follows a formal update posted on Strategy’s Stretch site, which notes that the payout is aligned with a par value of $100 and that the rate changes are designed to encourage trading around that level while dampening volatility. The monthly cadence remains intact, providing a predictable income stream for holders and a predictable funding mechanism for ongoing BTC acquisitions.
The broader policy shift toward preferred capital aligns with remarks from Strategy’s leadership in February, when CEO Phong Le described the company’s decision to pivot away from common stock issuances as a primary funding source for Bitcoin purchases. As the company continues to accumulate BTC, the balance sheet now holds a substantial stake—717,722 BTC—reflecting a disciplined approach to building a corporate treasury anchored by the world’s leading cryptocurrency. The latest tranche, a 592 BTC purchase in the week of February 16, underscores the ongoing emphasis on scalable BTC accumulation even as market prices fluctuate, with the company’s decision to finance purchases through preferred stock helping to manage dilution concerns and investor expectations.
While the macro backdrop has pressured crypto and related equities, Strategy’s financing strategy highlights a broader industry shift toward asset-backed, income-generating structures that can sustain long-term BTC holdings. The company’s stock performance and the price actions of related instruments—including the Bitwise Bitcoin Standard Corporations ETF (EXCHANGE: OWNB), which is also down—reflect the challenging environment for investor sentiment around crypto corporate treasuries. Nevertheless, Strategy’s approach demonstrates a commitment to leveraging preferred income to support a growing Bitcoin reserve, an approach that could influence other corporate treasuries seeking scalable, income-generating financing alternatives as the crypto industry matures.

Strategy chairman Michael Saylor said in a social media post on Sunday that the largest Bitcoin (BTC) treasury company is raising the dividend on its STRC preferred stock, also known as “Stretch,” to 11.50% for March 2026, from the previous 11.25%.
STRC is perpetual, meaning the company is not obligated to buy back the stock at any specified date, and features a variable yield that changes monthly.
A Friday update on the company’s website confirmed Saylor’s post. “STRC’s dividend rate is adjusted monthly to encourage trading around STRC’s $100 par value and to help strip away price volatility,” according to the website. The dividend is also paid monthly. with the next payout date on March 31, to shareholders of record
In February, Strategy CEO Phong Le said the company is pivoting away from issuing common stock to fund its BTC purchases and toward issuing more preferred shares.

“Last year, a stretch and our perpetual preferreds raised $7 billion. That’s 33% of the entire preferred market,” Le said.
“As we go throughout the course of this year, we expect structure to be a big product for us,” he said, adding, “We will start to transition from equity capital to preferred capital.”
To be sure, the company continues to accumulate Bitcoin amid a market drawdown that has nearly halved the price of Bitcoin since October and driven down the share prices of digital asset treasury companies.
In the year to date, BTC has lost 23.2% of its value, while the share price of Bitwise Bitcoin Standard Corporations ETF (OWNB) is down 16.1%. That exchange-traded fund provides exposure to public companies holding significant amounts of Bitcoin on their balance sheets.

Related: Strategy yield wrapper lands in Europe as 21Shares lists STRC ETP
Strategy records $12.4 billion loss in Q4 2025
Strategy in early February reported a net loss of $12.4 billion for the fourth quarter of 2025, leading to investors pushing the company’s share price down by 13% to about $107 per share.
Despite revenue for the quarter increasing 1.9% year-over-year to about $123 million, the company’s stock has been in freefall.
Strategy’s (MSTR) common stock price briefly hit a high of $543 per share during intraday trading in November 2024, before falling back down below $300 in February 2025.
The company’s stock has fallen by about 75% since the November 2024 peak, closing on Friday at $129.50 a shares.

The price of BTC is trading well below Strategy’s average purchase cost of $76,020 per Bitcoin, according to data from the company.
Strategy’s last bought BTC during the week of Feb. 16, when the company purchased 592 BTC, valued at over $39.8 million, bringing its total holdings to 717,722 BTC, and marking its 100th BTC acquisition.
Magazine: Bitcoin’s ‘biggest bull catalyst’ would be Saylor’s liquidation: Santiment founder


The mood around digital assets has shifted again among the world’s largest allocators, according to Ron Biscardi, CEO of iConnections, which runs one of the largest capital introduction conferences globally.
Biscardi, who has spent more than 25 years in the alternative investment industry and runs a platform that represents over $55 trillion in assets, has a front-row seat. His firm tracks thousands of meetings between fund managers and institutional investors each year. That data shows how quickly sentiment can turn.
After a couple of “rough” years following the crypto market crash following the FTX collapse in 2022, interest began to stabilize at last year’s conference, he recalls. “[In 2025] we started to see funds wanting to come back, wanting to spend some money,” he said. Optimism around a more crypto-friendly regulatory stance in Washington helped, even if progress has been slow.
“I feel like what we’re seeing now at the event [this year] is a more normal experience,” Biscardi said. “It’s not extremely crazy, but it’s also not [like] ‘I don’t want to go anywhere near it.’”
A change of tone
More than 75 digital asset funds participated in this year’s event, generating roughly 750 meetings between managers and allocators, a level comparable to 2022 when crypto interest soared before the FTX collapse. Nearly one quarter of limited partners on the iConnections platform now indicate interest in digital asset strategies, reinforcing that crypto has become an established sleeve within alternatives rather than a fringe allocation.
Family offices represent the largest LP cohort expressing interest, consistent with their track record of backing emerging and innovation-driven asset classes.
And this trend has been growing in recent years. While some family offices remain cautious about the asset, many traditional wealth managers are under mounting pressure to deliver digital assets to wealthy clients, particularly in crypto hotspots like Dubai, Switzerland and Singapore.
This interest is very much alive despite the crypto winter, with the price of bitcoin down nearly 25% since the beginning of the year and its market cap losing more than a trillion in value since October’s all-time high. Stocks of popular crypto companies, like Coinbase (COIN) or Strategy (MSTR), are also trading significantly lower this year, underperforming most other tech stocks.
Biscardi, however, believes digital asset managers are “very, very close to achieving institutional legitimacy.” Bitcoin, he said, has already crossed that line, but altcoins are close. “The last piece is really the regulatory framework that lets them do it safely.”
For chief investment officers, that issue dominates. “The regulatory hurdles are number one,” Biscardi said. “It just always goes back to that.”
Large allocators, he noted, are fiduciaries. “It’s not their money, they’re fiduciaries for other people’s money, and it might be a super interesting category, but they’re just not going to allocate there until they can tell their board that they’re doing it in a responsible, safe way.”
The tone of the debate has also changed. In 2022, some investors still questioned whether crypto was real or a Ponzi scheme. “That I don’t hear any of that anymore,” Biscardi said.
In fact, some traditionally conservative pools of capital, for example, have stepped in. Endowments, which tend to focus on long-term stability and avoid sharp swings in new asset classes, have begun allocating to bitcoin and ether exchange-traded funds. The idea is not to overhaul portfolios but to add measured exposure that could lift returns in years when crypto markets perform well, especially as many investors expect equities to deliver more muted gains than in the past decade.
Still a risk asset
Nevertheless, allocators treat bitcoin “much more as a risk asset” than a store of value. “Bitcoin just hasn’t behaved that way,” he said, pointing to its correlation with equities rather than gold during market stress.
Similarly, direct token buying remains rare among institutions. Instead, he hears more about ETFs and fund structures. Limited partners rely on general partners to choose specific coins. “The LPs who get bought into the space are really looking to the GPs to make those decisions.”
What’s not rare is crypto companies investing in spreading awareness of their products and services. According to Biscardi, sponsorship numbers saw a substantial uptick at this year’s event, with companies like BitGo (BTGO), Galaxy Digital (GLXY), Ripple and Blockstream all holding top-tier sponsor status.
Read more: Bitcoin is stuck in a rut but JPMorgan says new legislation could be the ultimate spark

Key Takeaways
- Q4 FY25 earnings report scheduled for March 2, 2026
- Analysts project a $0.02 per share loss, significantly improved from last year’s $0.47 deficit
- Projected revenue of $390K represents substantial growth from prior year’s $62K
- Shares declined 8.4% on February 27, now trading beneath key technical indicators
- Implied volatility suggests potential 14.05% price swing following results
Quantum Computing Inc. approaches its fourth quarter fiscal 2025 earnings announcement scheduled for Monday, March 2, 2026, with recent price weakness creating uncertainty among shareholders. The stock experienced an 8.4% decline on February 27, closing at $8.278.
Daily trading activity registered approximately 3.37 million shares — representing a dramatic 78% reduction compared to the typical 15 million share average. This significantly lighter volume during the selloff may indicate limited selling pressure, though the implications remain subject to interpretation.
Technically, shares are positioned beneath both the 50-day moving average at $10.35 and the 200-day moving average at $13.70. Despite recent weakness, QUBT maintains gains exceeding 39% over the trailing twelve months, propelled primarily by enthusiasm surrounding its photonic computing platform.
The Street’s consensus estimate calls for a quarterly loss of $0.02 per share in Q4 2025. This figure represents substantial improvement compared to the $0.47 per share deficit recorded in the year-ago period.
On the top line, analysts anticipate revenues reaching $390K, a meaningful increase from the $62K generated in Q4 2024. Though absolute dollar amounts remain modest, the growth trajectory is capturing attention from market observers.
Luminar Deal Takes Center Stage
A significant narrative entering the earnings discussion involves the company’s $110 million all-cash purchase of Luminar Semiconductor Inc., formerly held by Luminar Technologies. This strategic transaction aims to provide QUBT with greater vertical integration and enhanced capability to generate consistent revenue streams.
Market participants will be focused on management commentary regarding semiconductor manufacturing schedules, fulfillment of existing orders, and any preliminary indicators of revenue acceleration stemming from the acquisition.
Wall Street Revises Expectations Lower
The analyst community presents a varied outlook. Lake Street analyst Max Michaelis maintained his Buy recommendation while adjusting his price objective from $24 down to $16 — nonetheless suggesting approximately 77% appreciation potential from current trading levels.
Ascendiant Capital Markets similarly reduced its target from $40 to $25 while preserving a Buy stance. Taking a more reserved approach, Wedbush established coverage with a Neutral rating and $12 price target, while Cantor Fitzgerald reaffirmed its Neutral position with a $15 target.
Rosenblatt Securities launched coverage in January with a Buy rating and $22 price objective. The aggregate consensus stands at Moderate Buy, comprising one Strong Buy, two Buys, two Holds, and one Sell among analysts providing coverage.
The mean price target across all tracked analysts reaches $18.00, implying approximately 99% upside from the February 27 trading price.
QUBT exhibits a beta coefficient of 3.44, indicating heightened volatility relative to broader market movements. The company maintains a market capitalization near $1.83 billion, with a negative P/E ratio of -13.40 consistent with its current unprofitable state.
Company insiders control 19.3% of outstanding shares. COO Milan Begliarbekov divested 2,860 shares on January 7 at $11.85 per share, trimming his holdings by approximately 10.55%. Institutional ownership remains minimal at 4.26%.
Options market activity suggests traders are anticipating a potential price movement of roughly 14.05% in either direction once earnings results are released.
The company will publish Q4 FY25 financial results prior to the market opening on March 2, 2026.
US lawmakers want regulators to investigate Binance over the alleged $1.7 billion in transfers to Iran-linked entities. The concerns come at a particularly interesting time amid rising geopolitical tensions in the Middle East. However, Binance has already refuted such allegations.
In a letter, 11 lawmakers led by Sens. Chris Van Hollen and Elizabeth Warren urged Treasury Secretary Scott Bessent and Attorney General Pam Bondi to launch a formal probe.
US Lawmakers Warn Binance Oversight May be at Risk
The senators raised serious concerns about the strength of Binance’s anti-illicit finance guardrails and its adherence to sanctions and anti-money laundering laws.
“These allegations raise grave concerns that poor illicit finance controls at Binance remain a significant threat to national security. Our illicit finance controls are dangerously compromised if enormous sums can flow through Binance to terrorist groups or sanctions evaders. The firm controls the world’s largest digital asset exchange; it is essential that bad actors cannot benefit from its platform,” the lawmakers stated.
According to reports cited by the lawmakers, investigators uncovered at least two Binance accounts. These accounts were used to channel assets to entities linked to the Iran-backed Houthis and the Islamic Revolutionary Guard Corps.
Furthermore, the reports alleged that Iranian nationals successfully accessed more than 1,500 Binance accounts.
The senators described the incident as indicative of a “broader deterioration” in Binance’s compliance functions. They warned that the fund movements directly threaten the exchange’s historic 2023 settlement with US authorities.
Under that plea agreement, Binance paid a $4.3 billion fine and its founder, Changpeng Zhao, stepped down as CEO. The company also agreed to stringent oversight by a DOJ-mandated independent compliance monitor.
The lawmakers argued the alleged illicit transfers align with a wider pattern of risky behavior.
They highlighted Binance’s launch of payment cards in parts of the former Soviet Union, which they claim provides a backdoor for Russian entities to evade international sanctions.
“In light of these issues, we are deeply troubled by the prospect that Binance may once again be prioritizing profits over its compliance obligations,” the lawmakers argued.
Labeling the situation a severe national security threat, the senators gave the Treasury Department and the DOJ until March 13, 2026, to detail the results of their investigations.
If authorities determine Binance breached its 2023 monitorship terms, the exchange could face catastrophic legal and financial repercussions.
Binance Touts Compliance Efforts
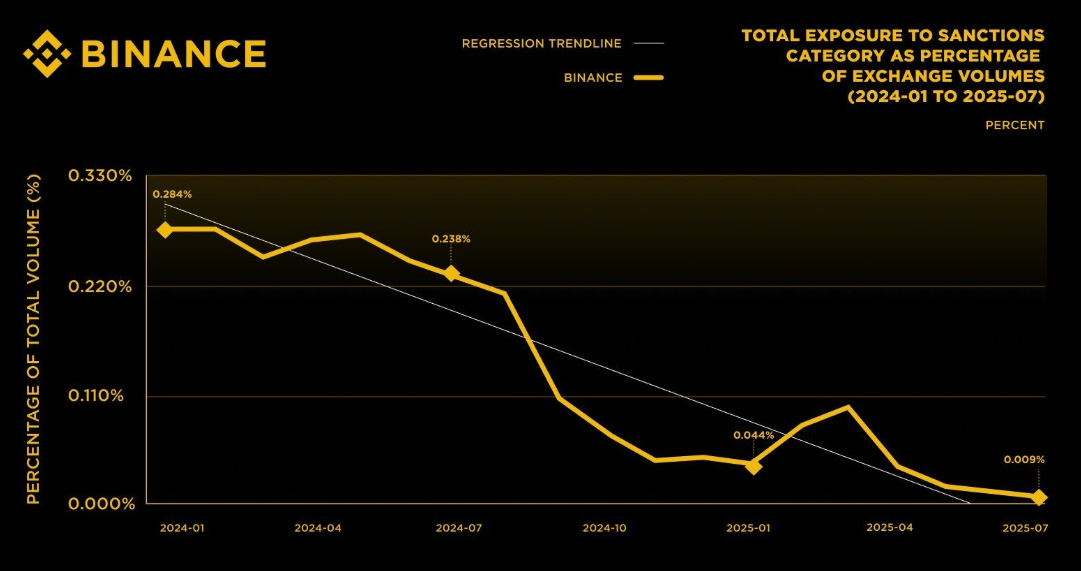
In a fierce rebuttal to the allegations, Binance defended its internal controls and noted a sharp decline in illicit activity on its platform.
According to the firm, its sanctions-related exposure dropped 96.8% over an 18-month period, falling from 0.284% in January 2024 to just 0.009% in July 2025.

The firm linked this progress to its “best-in-class” compliance program. It argued that the recent reports present a distorted viewpoint that fundamentally misunderstands standard control processes for digital asset platforms.
Binance stated that in the specific incidents cited by the media, it acted proactively, mitigated risks, offboarded the offending accounts, and coordinated with law enforcement.
“The facts are these: Binance’s compliance program is effective and it worked here. Any statement to the contrary is simply wrong,” the exchange concluded.

Zack Polanski shows how responsible leadership should be done

Gin Twist shines at Flemington in 2026 after straight preparation

The Biggest Crypto Trap I’ve Ever Seen


-

 Sports6 days ago
Women’s college basketball rankings: Iowa reenters top 10, Auriemma makes history
-

 Fashion2 days ago
Weekend Open Thread: Iris Top
-

 Politics6 days ago
Nick Reiner Enters Plea In Deaths Of Parents Rob And Michele
-

 Business5 days ago
True Citrus debuts functional drink mix collection
-

 Politics3 days ago
ITV enters Gaza with IDF amid ongoing genocide
-

 Tech15 hours ago
Unihertz’s Titan 2 Elite Arrives Just as Physical Keyboards Refuse to Fade Away
-
Sports2 days ago
The Vikings Need a Duck
-

 Crypto World5 days ago
XRP price enters “dead zone” as Binance leverage hits lows
-

 Tech5 days ago
Unsurprisingly, Apple's board gets what it wants in 2026 shareholder meeting
-
 NewsBeat1 day ago
Dubai flights cancelled as Brit told airspace closed ’10 minutes after boarding’
-

 NewsBeat4 days ago
Cuba says its forces have killed four on US-registered speedboat | World News
-
 NewsBeat1 day ago
The empty pub on busy Cambridge road that has been boarded up for years
-
 NewsBeat4 days ago
Manchester Central Mosque issues statement as it imposes new measures ‘with immediate effect’ after armed men enter
-

 NewsBeat5 hours ago
‘Significant’ damage to boarded-up Horden house after fire
-
 NewsBeat6 days ago
‘Hourly’ method from gastroenterologist ‘helps reduce air travel bloating’
-

 NewsBeat22 hours ago
Abusive parents will now be treated like sex offenders and placed on a ‘child cruelty register’ | News UK
-
 NewsBeat5 days ago
Police latest as search for missing woman enters day nine
-

 Business4 days ago
Discord Pushes Implementation of Global Age Checks to Second Half of 2026
-

 Business3 days ago
Only 4% of women globally reside in countries that offer almost complete legal equality
-
 Sports6 days ago
2026 NFL mock draft: WRs fly off the board in first round entering combine week