

Crypto World
Could Bitcoin Face a Liquidity Selloff?

Rising tensions around the Strait of Hormuz are once again forcing crypto traders to look beyond blockchain fundamentals and toward global macro risk.
Roughly 20% of the world’s oil supply passes daily through the narrow maritime corridor between Iran and Oman. While no full closure has been confirmed, escalating military activity in the region has already pushed war-risk insurance premiums sharply higher.
Oil, Yields, and $2 Trillion in Liquidity: Why Crypto Could Be First to Crack
Premiums on oil tankers have surged more than 50%. At the same time, insurance costs for a $100 million vessel jumped from approximately $250,000 to $375,000 per voyage.
The spike in shipping risk alone, even without a formal blockade, has been enough to raise fears of supply disruption. Several analysts have suggested that crude oil could surge to $120–$130 per barrel under a prolonged disruption scenario.
“Estimates suggest crude could jump to $120–$130 per barrel,” wrote analyst 0xNobler in a post.
For crypto markets, the implications go far beyond energy.
The Inflation-to-Liquidity Transmission
An oil spike of that magnitude would likely reignite inflation expectations just as markets have been positioning for policy easing.
Higher crude prices feed directly into transportation, manufacturing, and consumer goods costs, putting upward pressure on CPI data globally.
“Wars are generally inflationary, driving up commodity prices and widening fiscal deficits, and despite an initial knee‑jerk selloff when the conflict began, it makes sense that we have subsequently seen Bitcoin prices recover over the weekend, given it also benefits from higher inflation expectations,” 21Shares Head of Macro Stephen Coltman told BeInCrypto in an email.
If inflation expectations rise, central banks, including the US Federal Reserve, may be forced to delay or scale back anticipated rate cuts. That repricing would likely push Treasury yields higher.
And yields are where crypto risk begins.
Rising yields tighten global liquidity conditions. When government bonds offer increasingly attractive returns, capital often rotates away from speculative assets. Trillions in rate-sensitive capital across bonds and equities could be repriced if yields rise materially amid renewed inflation fears.
Bitcoin has historically traded as a high-beta liquidity asset during tightening cycles. During prior periods of rising real yields, digital assets have tended to underperform as leverage unwinds and funding costs climb.
In other words, crypto does not need a geopolitical catastrophe to fall. It only needs liquidity to tighten.
Several prominent crypto commentators have warned of an imminent spike in volatility. Posts from accounts such as DeFiTracer and 0xNobler framed the Strait of Hormuz situation as a potential macro “turning point,” outlining a chain reaction:
“Higher oil → higher inflation → no rate cuts → rising yields → tightening liquidity.”

Meanwhile, Merlijn the Trader introduced a secondary risk. The analyst cites a potential hashrate shock if energy infrastructure in Iran, reportedly a hub for low-cost Bitcoin mining, were disrupted.
While speculative, such narratives add to broader uncertainty around supply dynamics and network stability.
Still, not all political voices share the alarm. President Donald Trump publicly commented that he is “not concerned” about the Strait of Hormuz situation.
Markets, however, tend to respond more directly to bond yields than to political reassurance.
Crypto’s Deleveraging Risk
The structure of crypto derivatives markets adds another layer of fragility. Leverage tends to build during periods of calm, and sudden macro shocks can trigger cascading liquidations.
If Treasury yields spike alongside oil, leveraged positions across Bitcoin and altcoins could unwind quickly.
High-risk assets, including small-cap equities, high-growth tech stocks, and cryptocurrencies, are typically the first to feel pressure when liquidity tightens.
Unlike traditional markets, crypto trades 24/7, meaning reactions can be immediate and amplified.
It explains why traders are already watching crude futures and bond markets as leading indicators. A temporary de-escalation could stabilize oil and restore risk appetite.
A sustained disruption, however, could transform what begins as an energy shock into a broader liquidity event.
The coming sessions, starting Monday, may determine whether this remains geopolitical noise or becomes crypto’s next macro-driven selloff.


Bitcoin posted a -23.21% return in Q1 2026 and marked the third-worst first-quarter performance since 2013 according to CoinGlass data.
Summary
- Bitcoin fell 23% in Q1 2026, its third-worst first quarter on record.
- Ethereum dropped 32%, also marking its third-worst Q1 performance.
- Back-to-back quarterly losses follow the October 2025 market peak.
The loss falls far below Bitcoin’s (BTC) historical Q1 average of 45.90% and sits well below the median return of -2.26%.
Only two prior first quarters posted worse performance: Q1 2018 at -49.7% and Q1 2014 at -37.42%.
Ethereum fared worse with -32.17% in Q1 2026, also the third-worst since 2016, trailing its historical Q1 average of 66.45% and median return of 4.37%.
Bitcoin historical Q1 pattern shows mixed performance across years
Bitcoin’s quarterly returns since 2013 show no consistent first-quarter pattern. Strong Q1 gains in 2013 (+539.96%), 2021 (+103.17%), 2023 (+71.77%), and 2024 (+68.68%) contrast sharply with losses in 2014 (-37.42%), 2015 (-24.14%), 2018 (-49.7%), 2022 (-1.46%), 2025 (-11.82%), and 2026 (-23.21%).
The historical Q1 average of 45.90% gets pulled higher by extreme outliers like 2013’s +539.96% and 2021’s +103.17%.
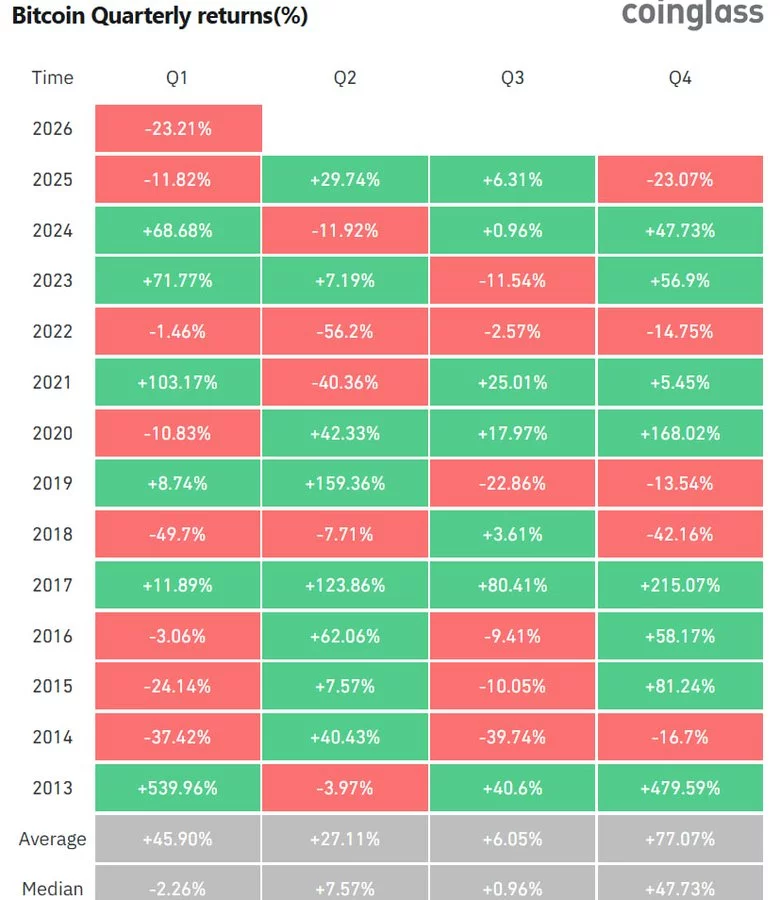
The median Q1 return of -2.26% provides a more accurate picture, showing first quarters tend toward slight losses more often than gains.
Q4 historically posts the strongest performance with a 77.07% average and 47.73% median. Q2 averages 27.11% with a 7.57% median, while Q3 averages 6.05% with a 0.96% median.
Recent years show increasing volatility. 2024 posted strong gains across Q1 (+68.68%), Q3 (+0.96%), and Q4 (+47.73%) while Q2 dropped -11.92%. 2025 saw Q2 (+29.74%) and Q3 (+6.31%) gains offset by Q1 (-11.82%) and Q4 (-23.07%) losses.
2026 Q1 decline follows October liquidation event
The Q1 2026 loss follows Bitcoin’s October 2025 all-time high and the October 10 liquidation event that triggered $19 billion in market-wide liquidations.
Bitcoin fell from $126,080 to current levels around $66,000, a 48% decline from the peak.
Q1 2026’s -23.21% return exceeds Q4 2025’s -23.07% loss, creating back-to-back losing quarters.
The last time Bitcoin posted consecutive quarterly declines occurred in 2022, which saw losses across all four quarters: -1.46%, -56.2%, -2.57%, and -14.75%.
Crypto World
Stablecoins Challenge Traditional Banks as Yield Gap Widens and Regulatory Debate Intensifies

TLDR:
- Stablecoins like USDC and PYUSD now offer yields above 4%, far outpacing bank savings rates near 0.01%.
- The CLARITY Act missed its March 1, 2026 deadline amid heavy banking industry resistance in the Senate.
- Tokenized T-bills settle instantly and globally, cutting out SWIFT fees and traditional multi-day windows.
- JPMorgan analysts flagged CLARITY Act passage as a potential trigger for major crypto inflows in late 2026.
Stablecoins are reshaping how retail and institutional investors think about deposit alternatives. Digital dollar assets like USDC and PYUSD now offer yields above 4%, delivered through exchanges, wallets, and decentralized protocols.
Meanwhile, traditional savings accounts at major banks remain near 0.01%. The growing gap has sparked fierce debate in Washington, with the CLARITY Act stalling past its March 1, 2026 White House deadline amid continued banking industry resistance.
Yield Competition Puts Banks Under Pressure
Banks have long profited by collecting deposits at low rates and lending them out at 5–7%. That spread model is now facing a direct challenge from stablecoin issuers.
Treasury-bill reserves backing these digital assets generate 4–5% returns, which platforms pass along to holders through revenue-sharing programs.
Crypto analyst Adam Livingston argued on X that the banking sector is losing this battle by choice. He wrote that stablecoins offer “zero branches, zero tellers, and zero KYC theater for every transaction” while reserves sit in actual T-bills that return yield directly to users.
The cost structure difference between banks and stablecoin issuers is hard to ignore. Legacy systems, compliance teams, and physical infrastructure drive overhead costs for traditional banks. Stablecoin platforms, by contrast, operate with far leaner models and pass savings to users.
Regulatory Battles Reflect Industry Tensions
The GENIUS Act attempted to prevent stablecoin issuers from paying direct interest to holders. However, the market adapted quickly.
Exchanges and smart contracts now route Treasury returns to users without issuers paying interest directly.
The CLARITY Act, which would have established broader crypto market structure rules, missed its March 1 deadline. Banking lobbyists remain active in Senate Banking Committee discussions.
Critics say the industry is pushing for regulatory barriers rather than competing on product quality.
Livingston was pointed in his criticism, writing that banks “pressured the OCC into a 376-page rulemaking precisely to close loopholes” that allowed customers to earn market-rate yields. He suggested the banking lobby prefers legislative protection over innovation.
The Office of the Comptroller of the Currency rulemaking referenced in that critique targeted programs like Coinbase’s revenue-sharing model. Whether regulators will sustain that approach remains an open question as the debate continues in Congress.
Market Shifts Signal Long-Term Structural Change
Tokenized real-world assets are already settling on-chain at faster speeds and lower costs than traditional systems.
Products like tokenized T-bills allow investors to hold interest-bearing instruments globally without SWIFT fees or multi-day settlement windows. This represents a fundamental change in how capital moves.
JPMorgan’s internal analysts, according to Livingston, have quietly acknowledged that CLARITY Act passage could trigger significant crypto inflows in the second half of 2026.
Meanwhile, both retail and institutional money continues moving toward yield-bearing digital assets. The trend is gaining momentum regardless of legislative outcomes.
The Silicon Valley Bank collapse in 2023 added a new dimension to the stablecoin conversation. Fully reserved stablecoins carry a different risk profile than fractional-reserve bank deposits, and that distinction is drawing attention from investors who lived through recent bank failures.
The deposit flight narrative is no longer theoretical — it is showing up in capital flow data across the financial sector.


Lighter reported that its upgraded liquidity pool system successfully limited ADL losses to a pre-determined threshold.
On February 26, Lighter, a decentralized crypto exchange, announced that its upgraded liquidity pool system successfully resisted a $50 million ARC perpetual long squeeze attempt.
This occurred after approximately 600 traders reversed a whale’s position, resulting in an $8.2 million loss, and the episode tested Lighter’s newly launched LLP Strategies, capping the downside risk for liquidity providers at just $75,000.
LLP Strategies Face First Stress Event
In a February 17 post on X, Lighter announced changes to its LLP infrastructure, splitting liquidity into separate strategies for different market types, including RWAs. Risk, liquidations, and auto-deleveraging are now handled at the strategy level rather than across the entire pool.
That structure faced what the platform called its “first battle test” on February 26. According to Lighter, a trader had built a large long position in ARC perpetuals over several days, with around 600 other traders and market makers taking the short side and pushing total open interest to $50 million.
ARC perp trading was assigned to Strategy #7, a high-risk strategy with about $75,000 in allocated USDC. Lighter said this meant only that portion of LLP deposits could be exposed if auto-deleveraging occurred.
As ARC’s price fell around 6 p.m. ET on February 26, the large long position was first liquidated on the order book for roughly $2 million. Lighter said LLP was initially in profit on the position, but further downside depleted Strategy #7, triggering another ADL at 0.071123. In the end, the whale lost about $8.2 million, LLP lost its capped $75,000 allocation, and short traders who held their positions were profitable.
ARC Price Collapse
The unwind left visible scars on the ARC price chart, with data from CoinGecko showing the token experienced a flash crash in the early hours of February 27, sliding from around $0.031 to $0.025 before recovering to $0.0348.
You may also like:
At the time of writing, ARC, which powers the Ryzome agentic AI “app store,” was down over 9% in 24 hours and nearly 59% across seven days. The token has also lost more than 63% of its value in the past two weeks, as well as falling 42% over 30 days. It currently sits 95% below its January 2025 all-time high of $0.62, having shed nearly 88% off its price in the past year.
This turbulence matches up with observations from crypto commentator Simon Dedic, who noted that ARC’s value had dipped overnight by about 80% on volumes approaching $400 million, which was nearly ten times its fully diluted valuation.
Dedic pointed out that before dumping, the token had been “massively outperforming” despite a weak market, even suggesting it had been “heavily manipulated.”
The concerns raised by Dedic echo a broader industry debate about market integrity. Just last month, Base co-founder Jesse Pollak rejected the idea of behind-the-scenes manipulation, stating his team won’t coordinate or deploy capital to influence prices because markets “deserve to be free, open, and fair.”
Binance Free $600 (CryptoPotato Exclusive): Use this link to register a new account and receive $600 exclusive welcome offer on Binance (full details).
LIMITED OFFER for CryptoPotato readers at Bybit: Use this link to register and open a $500 FREE position on any coin!
Crypto World
What the U.S. Treasury’s $745 Million TIPS Buyback Actually Means for the National Debt
TLDR:
- The U.S. Treasury confirmed a $745 million TIPS buyback on February 25, 2026, as part of routine debt management.
- The $2.7 billion weekly repurchase operation accounts for less than 0.008% of the total $35 trillion national debt.
- Treasury buybacks have been used since 2002 to improve bond market liquidity and manage maturity structure efficiently.
- The repurchase reshuffles existing debt obligations but does not cancel principal or alter the broader fiscal debt outlook.
U.S. Treasury buyback operations came into focus on February 25, 2026, as the government confirmed a $745 million repurchase of Treasury Inflation-Protected Securities (TIPS).
The transaction was part of a broader $2.7 billion repurchase program executed that same week. The bonds involved fall within a 2027–2036 maturity range.
While the action reflects active portfolio management, analysts note it does not reduce the national debt. The total U.S. debt currently exceeds $35 trillion.
Treasury Buyback Functions as a Routine Portfolio Management Tool
The U.S. Treasury buyback program has been in active use since 2002. Over recent years, the program has been expanded to meet growing bond market demands.
The primary goal is to enhance liquidity in older, less actively traded bond issues. These operations also help smooth refinancing cycles and manage interest rate exposure.
Paul White Gold Eagle noted on X that the $2.7 billion weekly operation represents less than 0.008% of total outstanding debt.
The $745 million TIPS repurchase amounts to roughly 0.00002% of the total federal debt load. These figures make clear that the buyback operates within a narrow financial scope. It does not translate into any measurable reduction in overall debt.
Treasury officials describe the buyback as a tool to improve functioning in bond markets. The operation also aims to maintain stability within secondary markets for government securities.
By targeting bonds in the 2027–2036 maturity range, the Treasury manages its future refinancing schedule. This approach is designed to reduce rollover risk over the medium term.
The buyback ultimately reshuffles existing obligations within the Treasury’s broader issuance strategy. It does not cancel debt or reduce the principal amount owed to bondholders.
Rather, it adjusts the composition of outstanding securities in circulation. This distinction matters when assessing the true fiscal result of such operations.
Structural Debt Concerns Stay Unchanged After the Repurchase
The broader debt picture remains a pressing concern for fiscal observers and analysts. The national debt now surpasses $35 trillion and continues on an upward path.
A $745 million repurchase barely registers against that scale of obligation. The gap between buyback size and total debt volume remains enormous.
Without long-term spending reform or meaningful revenue adjustments, the debt trajectory stays the same. Portfolio adjustments are not a substitute for genuine fiscal consolidation measures.
Treasury repurchase operations serve operational and technical goals, not fiscal reduction ones. Debt reduction requires legislative action and structural policy changes.
As Paul White Gold Eagle stated, this action “is not debt cancellation.” It remains a standard liquidity and portfolio management tool.
The buyback does improve technical efficiency within bond markets during periods of tighter financial conditions. However, it leaves the macro debt outlook fundamentally unchanged.
Market observers continue watching Treasury operations closely for signals of any broader fiscal strategy. For now, the $745 million repurchase remains a routine technical adjustment within existing programs.
It reflects the Treasury’s ongoing effort to manage the maturity structure of current obligations. The national debt trajectory, however, continues on its present course without alteration.

Tarek Mansour, the co-founder of prediction market Kalshi, provided an update, following the platform’s decision to void some positions that were opened after the death of Iran’s Supreme Leader Ayatollah Ali Khamenei was confirmed.
“We don’t list markets directly tied to death. When there are markets where potential outcomes involve death, we design the rules to prevent people from profiting from death. That is what we did here,” Mansour said in a post on X.
Iranian state media reported the death early Sunday, after an attack launched by Israel and the United States a day earlier.
Kalshi is reimbursing all fees from the “Ali Khamenei out as Supreme Leader” market, and will pay traders with positions open before Khamenei died according to the “last-traded price before his death,” Mansour said.
Additionally, users who opened positions after the death of Khamenei were reimbursed the difference between the higher price paid for entry and the last traded price.

A Kalshi spokesperson told Cointelegraph that the platform’s policy on not allowing “death markets” is clear and long-standing.
The platform reiterated the policy on Saturday, and Mansour said that the death carveout stipulations were clearly stated in the rules for the market. However, the decision sparked backlash from users online, who accused the platform of curtailing user profits.

Related: Kalshi bans US politician over alleged insider trading violation
Suspicions of insider trading activity on prediction market platforms rise amid geopolitical tensions
In February, six traders on rival prediction market Polymarket netted about $1 million betting that the US would initiate a strike on Iran before the end of the month.
All six wallets were created in February, mostly bet on markets related to a strike on Iran, and some of the positions were filled hours before the first explosions were heard over the Iranian capital of Tehran, according to Bloomberg.
The trading patterns raised suspicion of insider trading activity among onchain investigators and analysts.
In January, US President Donald Trump announced that the individual who leaked information tied to the raid and capture of former Venezuelan President Nicolás Maduro had been arrested by US law enforcement.
The comments fueled speculation from onchain analysis platform Lookonchain that the leaker Trump was referencing may have been linked to winning bets on Polymarket placed shortly before the US raid in Caracas.
Magazine: Astrology could make you a better crypto trader: It has been foretold

Pi Coin price is attempting to recover after forming a new all-time low earlier this month. The altcoin has shown modest strength in recent sessions, holding above key short-term support.
However, broader technical indicators and historical patterns suggest that Pi Coin’s price recovery may face significant resistance in March 2026.
While some investors anticipate stabilization, momentum indicators highlight persistent weakness. Past seasonal trends and current capital flows imply that Pi Coin could remain under pressure unless buying demand improves meaningfully.
Pi Coin’s Past Is Bleak
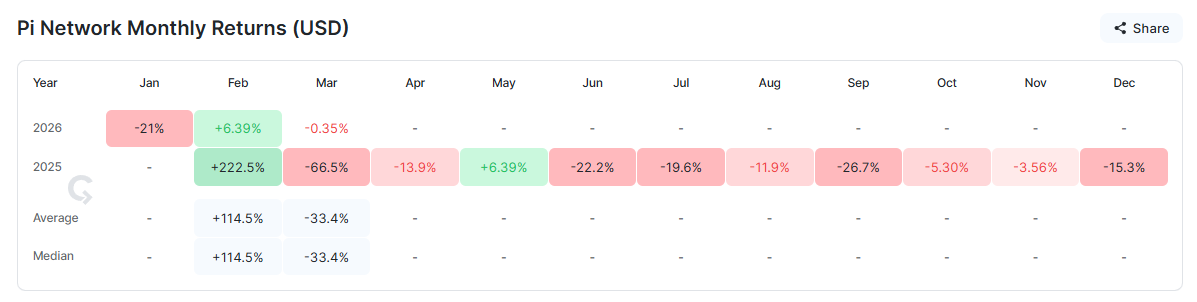
March has historically been volatile for Pi Coin. In March 2024, PI declined by 66.5%, marking its weakest monthly performance on record. That steep drop followed its initial launch phase, when early participants moved quickly to secure profits.
The sharp decline was largely driven by immediate post-launch distribution. Early miners and holders capitalized on newly available liquidity. Those specific launch-related dynamics do not fully apply today. However, the memory of extreme volatility still shapes investor caution entering March 2026.
Want more token insights like this? Sign up for Editor Harsh Notariya’s Daily Crypto Newsletter here.
PI Holders Aren’t Too Supportive
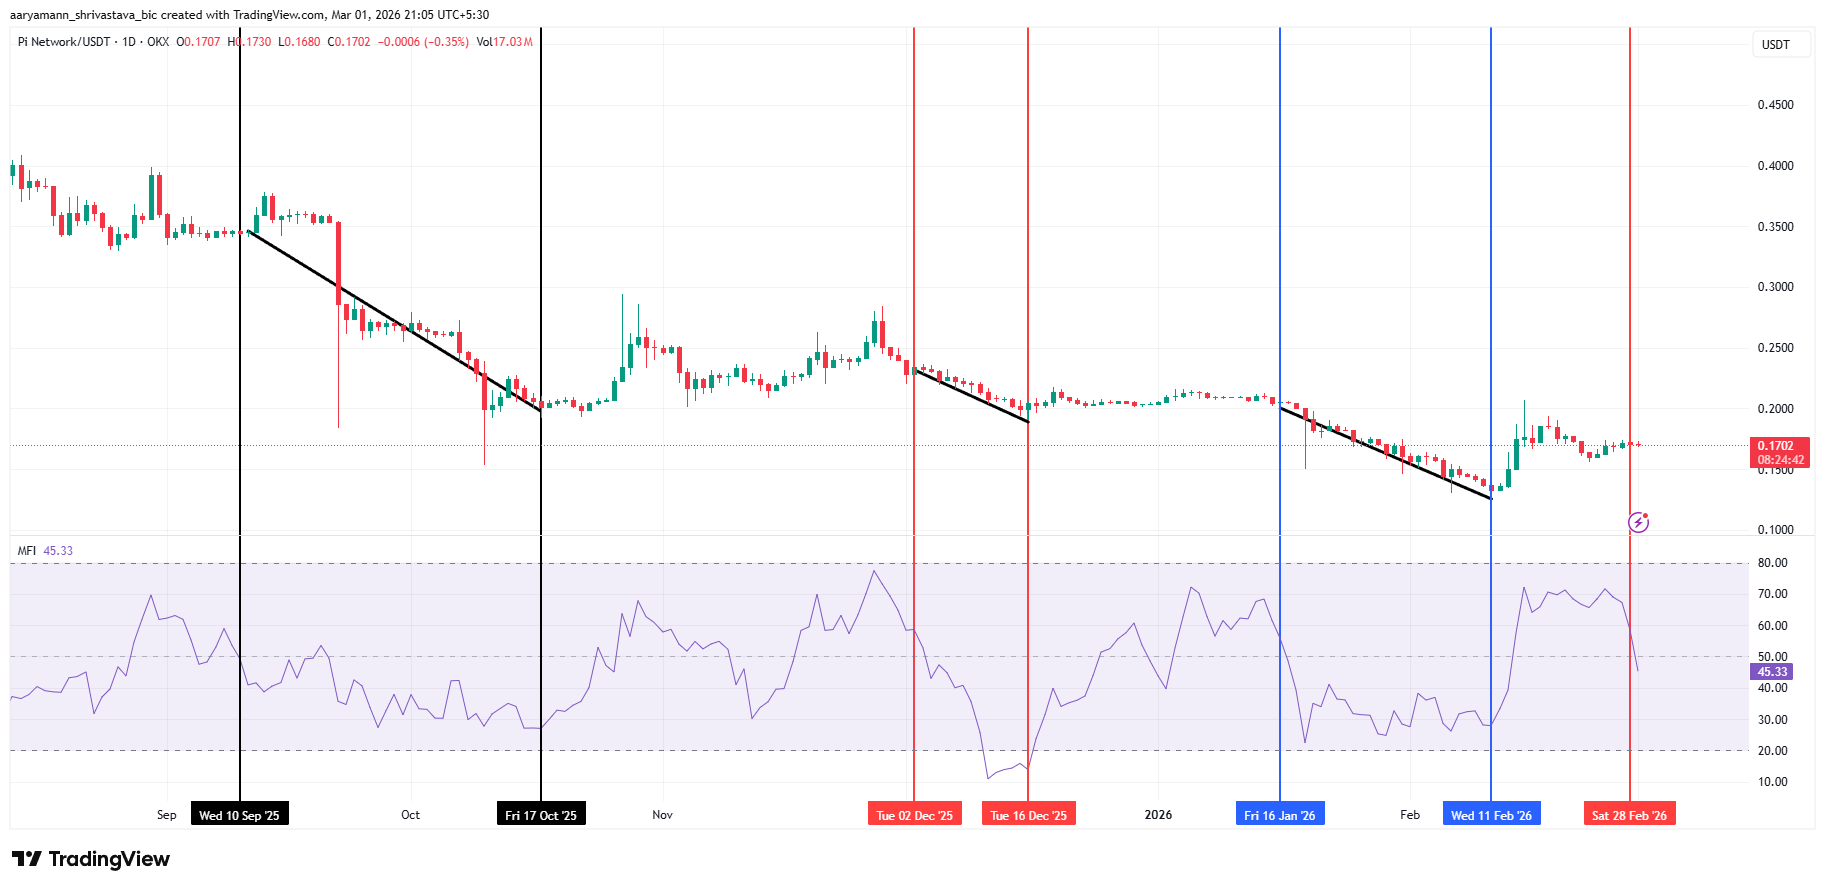
The Money Flow Index now signals renewed selling pressure. MFI has slipped below the neutral 50 mark, reflecting capital outflows rather than sustained inflows. This shift often precedes extended corrective phases when buyer conviction weakens.
Historically, whenever MFI dropped below neutral for PI, the price tended to decline until buying momentum returned. Current readings suggest that sellers remain active. Unless the indicator rebounds above 50, downside risks may continue to outweigh short-term recovery attempts.
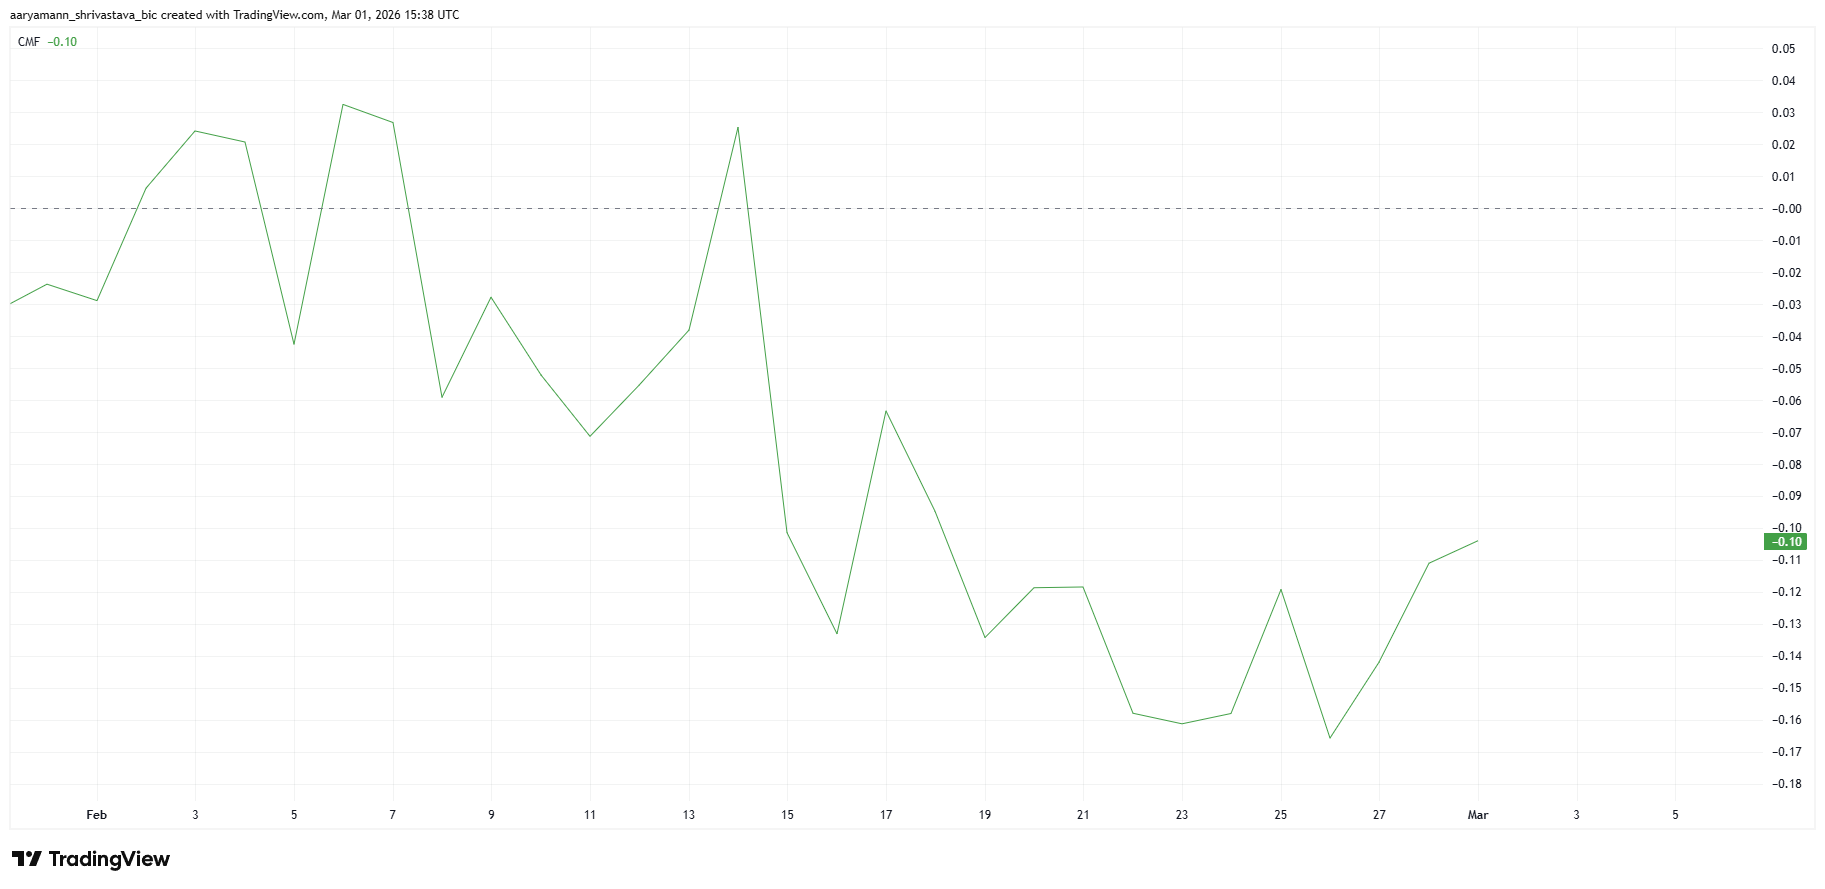
The Chaikin Money Flow indicator reinforces this cautious outlook. CMF has remained below the zero line for nearly three consecutive weeks. Persistent negative readings signal ongoing net outflows from Pi Coin.
These outflows indicate fading investor confidence. Reduced participation from new buyers compounds the issue. Without fresh capital entering the ecosystem, upward price movements may lack sustainability. Weak inflows often limit breakout potential and increase vulnerability to corrections.
PI Price May See a Reversal
Pi Coin price is trading at $0.1701 at the beginning of March, holding above an ascending trendline support. Immediate resistance sits at $0.1752. Despite this structure, technical indicators suggest that March may bring corrective pressure rather than sustained gains.
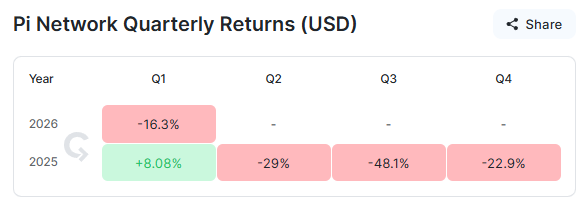
Quarterly performance adds another layer of concern. Following mixed results in January and February, Pi Coin is tracking a 16% loss for Q1 2026. Closing the quarter in negative territory could weigh on investor sentiment heading into Q2, especially if broader crypto market conditions remain cautious.
If selling pressure intensifies, Pi Coin may decline toward the $0.1597 support level. A breakdown below that threshold would likely expose $0.1502. Continued weakness could push the price closer to the all-time low of $0.1300, increasing downside risk in the near term.
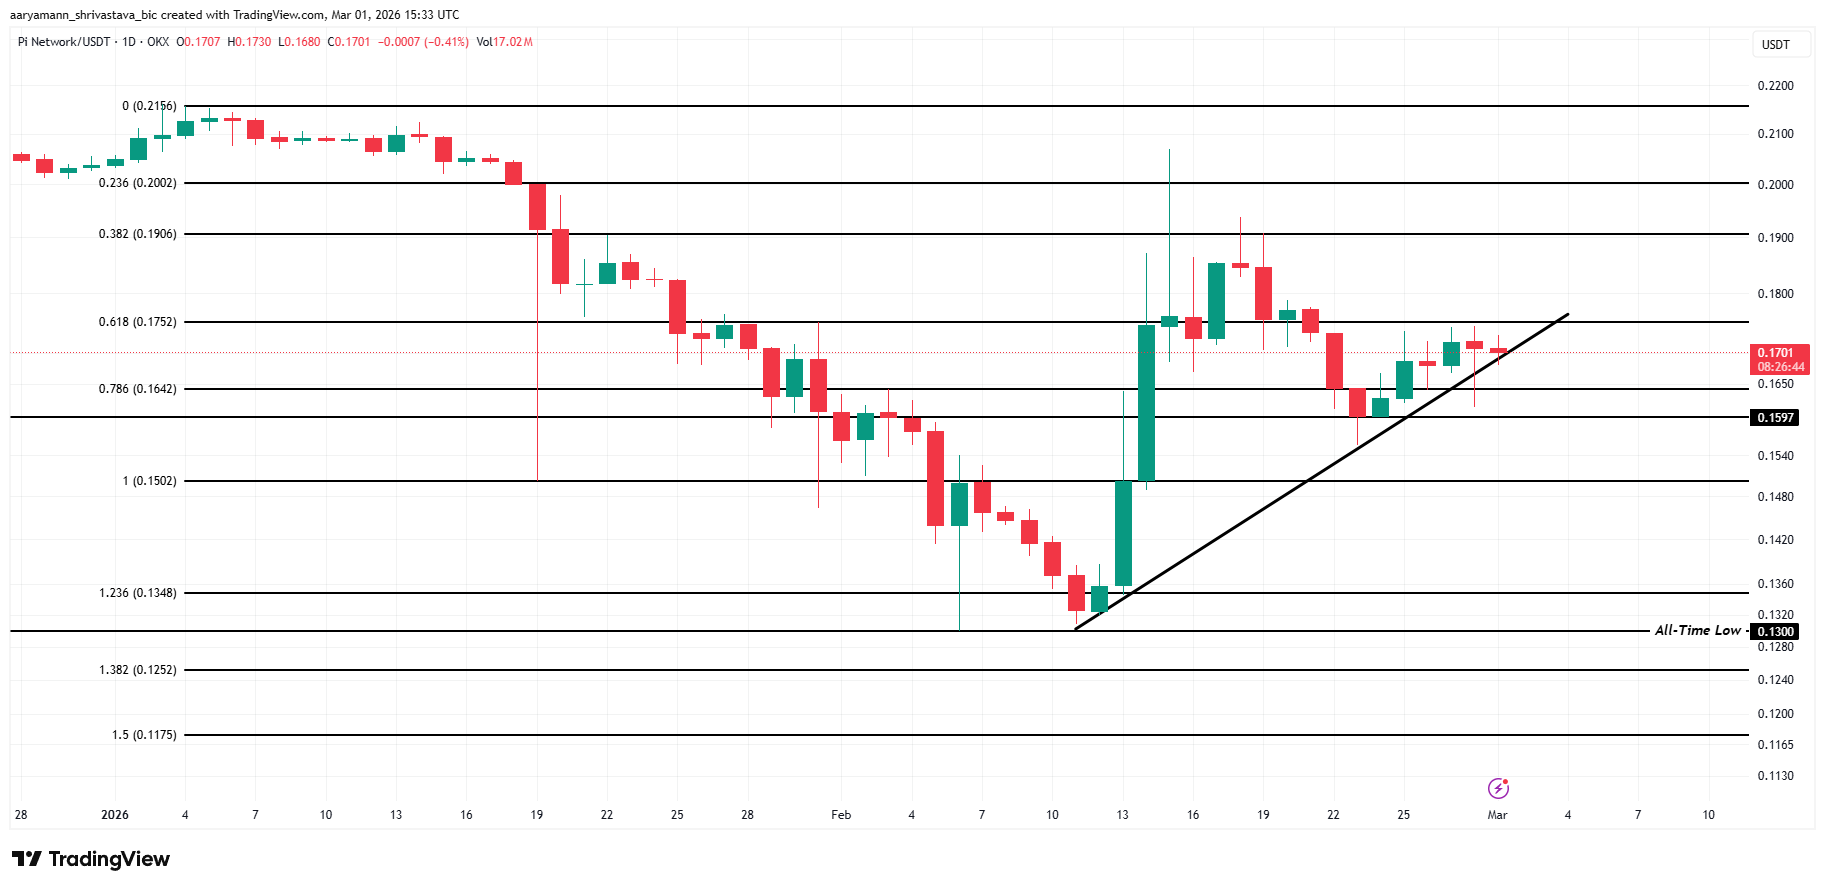
The bearish thesis would be invalidated only if buyers regain control. A decisive breakout above $0.1752 would be the first signal of strength. Flipping $0.2002 into support would confirm renewed bullish momentum. Sustained inflows and improved sentiment would be required to support such a move and stabilize Pi Coin price action.
TLDR:
- Binance received over 472 million XRP worth $652M, marking February’s largest single inflow period.
- U.S.–Iran strikes launched after market close, leaving crypto directly exposed to the geopolitical shock.
- XRP price has rolled back toward $1.44 after rallying above $3, with MACD and RSI turning bearish.
- Open interest across exchanges contracted sharply, signaling leverage is being flushed rather than rebuilt.
XRP selling pressure worth $650 million has emerged as U.S.–Iran tensions escalate sharply. Over the past week, large token inflows into Binance have raised red flags across the crypto market.
Geopolitical uncertainty has driven investors toward a more defensive posture, moving liquidity closer to the market.
Combined with weakening technical readings and shrinking derivatives activity, XRP now faces mounting headwinds that traders and analysts are watching closely.
Binance Inflows Surge as Geopolitical Shock Hits Crypto Markets
The U.S.–Iran standoff intensified over the weekend when the first strikes launched shortly after traditional financial markets closed.
That timing left crypto markets directly exposed to the geopolitical shock without broader market support. Risk assets reacted almost immediately, and XRP was among the most visibly affected tokens.
On-chain analyst Darkfost reported that Binance received more than 472 million XRP over the past week alone. That volume translates to roughly $652 million worth of tokens flowing into the exchange.
Darkfost confirmed this marks the largest single inflow period recorded throughout the month of February.
Large exchange inflows of this size typically reflect a defensive shift among token holders. When investors move tokens onto exchanges, it often signals a readiness to sell or at least position liquidity closer to active markets. Flows at this scale can create conditions for sudden selling waves that affect short-term price action.
Darkfost noted that it remains too early to confirm whether this activity marks the start of a broader distribution dynamic.
However, the analyst stressed the situation warrants close monitoring to determine if panic movements tied to geopolitical uncertainty will deepen further in the days ahead.
Technical Weakness and Derivatives Data Reinforce the Bearish Setup
The $650 million inflow surge arrives against an already deteriorating technical backdrop for XRP. After rallying above $3 earlier this cycle, price has since rolled back toward the $1.44 zone.
Analyst DavidTheBuilder noted that the MACD has crossed lower, histogram bars remain red, and RSI has drifted toward the lower half of its range.
These readings stop short of signaling full capitulation. However, the aggressive upside energy that once powered XRP’s breakout has clearly faded. The current chart structure bears little resemblance to the euphoria phase that drove the earlier rally higher.
Derivatives data tells a similar story. Open interest across major exchanges spiked sharply during the rally, then contracted just as quickly as traders pulled risk off the table.
When open interest compresses while price trends lower, leverage is typically being flushed rather than built back up.
DavidTheBuilder pointed out that sustained positioning growth has not returned to the market. Strong trends require conviction behind them, and without open interest expanding alongside price, XRP’s path to recovery remains uncertain.
With geopolitical tensions still unresolved, market participants are keeping a close watch on whether conditions stabilize or worsen further.


In a major policy shift, X has removed cryptocurrency and gambling from its prohibited industries list for paid promotions, opening the door for influencers and KOLs to legally monetize crypto content on the platform.
The change marks a significant reversal of a ban that had been in place since at least June 2024.
The entire financial products category, including loans, investment services, and crypto, was removed from X’s advertising policies.
“Crypto is no longer listed under Prohibited Industries for paid promo on X,” observed analyst DeFi Ignas. “The policy page changed recently. On February 16, it was still there.”
Gambling was also removed from the list, while other industries such as pharmaceuticals, tobacco, weapons, and weight loss were added.
The platform’s new Paid Partnership framework requires influencers to disclose any compensated promotion.
“Undisclosed promotions hurt the integrity of the product and lead people to distrust the content they read on X. This new feature will allow you to comply with regulations, but more importantly, it enables you to be transparent with your followers,” Nikita Bier, X’s Head of Product, articulated.
Posts created as part of a Paid Partnership must now include the “Paid Partnership” label. Influencers are responsible for ensuring that content complies with applicable laws, including the FTC’s regulations on endorsements and testimonials.
Meanwhile, X’s updated policy distinguishes Paid Partnerships from standard advertising. This means content prohibited under Paid Partnerships may still be permitted through X Ads.
The policy update has drawn mixed reactions in the crypto community, with some users celebrating the return of crypto promotions.
However, not all reactions are positive, with analyst Benjamin Cowen highlighting what the change means for the business models crypto influencers use.
“90% of crypto influencers now need to find a new business model that does not just involve them pretending to like a project they were paid to promote, allowing them to dump their allocations on the people that trusted them,” warned Cowen.
In the same tone, Rune raised concerns about enforcement, noting that the platform was now banning every user promoting (shilling) cryptos, whether disclosed or not. In their opinion, the latest move lays the groundwork for future restrictions on Crypto Twitter.
“It’s supposed to be for ‘paid partnerships,’ but who can tell the difference between someone promoting a token without being paid and someone who is being paid to promote it? There will be a massive ban wave on CT, and everyone will be scared to shill tokens,” Rune wrote.
General sentiment is that this policy change could reshape crypto marketing on X (Twitter). Crypto influencers who previously relied on informal promotion may need to adapt their strategies.
Meanwhile, brands now have a clearer, legal path for campaigns, provided they adhere strictly to disclosure rules.
The update is effective immediately, signaling X’s attempt to balance regulatory compliance with creator monetization.
As the platform navigates these changes, transparency and proper labeling are likely to become the central pillars of any successful crypto marketing strategy on X.
TLDR:
- Bitcoin fell to $63,000 on Saturday as Middle East tensions surged while all traditional markets remained fully closed.
- On-chain data recorded $100 million migrating from Bitcoin into USDT on the Tron network within a single 24-hour period.
- The USDT Flight Signal hit “1,” confirming a capital rotation from Bitcoin into stablecoins during the geopolitical panic weekend.
- Around $1.9 billion in put options at a $60,000 strike on Deribit revealed strong demand for downside protection among traders.
Bitcoin proved itself a round-the-clock financial tool when Middle East tensions rattled global markets last weekend.
While traditional exchanges sat idle on Saturday, Bitcoin dropped to $63,000 and absorbed the immediate shock of the geopolitical event.
By Sunday, it recovered to $66,000. No bank, no stock exchange, and no traditional market was available. Bitcoin was the only ATM open worldwide, and it processed every transaction without interruption.
When Every Other Market Closed, Bitcoin Stayed Open
Traditional financial systems operate on schedules. They close on weekends, on holidays, and during emergencies. Bitcoin does none of that. When panic spread across global markets on Saturday, investors had one liquid exit available — and they used it immediately.
Investors who sold did not lose faith in Bitcoin. They needed fast dollar liquidity to protect themselves against an unfolding geopolitical crisis.
Bitcoin gave them that access within seconds, at any hour, from any location around the world. No other financial instrument offered that during the same window.
As Cryptoquant analyst GugaOnChain noted , “Bitcoin operated as the only global ATM open during a weekend of panic.” That description is precise and accurate. It processed capital exits while every competing system was offline and unavailable to investors.
On-chain data backed this observation directly. The USDT Flight Signal, which tracks capital movement from Bitcoin into stablecoins on the Tron network, recorded approximately $100 million migrating into USDT within just 24 hours.
Bitcoin’s total market capitalization stood at $1.319 trillion during this period, reflecting the weight of capital that passed through it over the weekend.
On-Chain Data Confirms Bitcoin’s ATM Function in Real Time
The Tron network currently holds between 42% and 50% of all circulating global USDT supply. That makes it the most reliable network for measuring capital behavior during stress events.
When the USDT Flight Signal reads “1,” money is moving out of Bitcoin and into stablecoins. Over this weekend, the signal confirmed that rotation in real time.
The USDT supply on the Tron network reached $84.72 billion during this period. That figure captures the scale of the digital dollar vault that investors ran toward. Bitcoin served as the withdrawal point that made accessing that vault possible on a weekend.
Derivatives markets further confirmed the demand for protection. Roughly $1.9 billion in put options were concentrated on Deribit, with a strike price at $60,000.
Traders had already positioned themselves for downside risk, treating Bitcoin as both an exposure and a hedging instrument simultaneously.
True price discovery, according to market expectations, will follow Monday’s reopening of U.S. markets. Bitcoin, however, had already completed its job.
It absorbed the initial tremor, provided emergency liquidity, and directed capital toward stablecoin shelter — all before traditional markets could open their doors.


UAE’s Capital Markets Authority shut both the Abu Dhabi (ADX) and Dubai Financial Market (DFM) stock exchanges for March 2–3 after Iran struck major ports and oil tankers across the Middle East.
The ADX and DFM are the two primary equities exchanges in the United Arab Emirates, together serving as the Gulf region’s key capital market hubs.
Why it matters:
- Iran’s strikes effectively blocked the Strait of Hormuz, the chokepoint through which roughly 20 million barrels of oil per day and nearly 20% of global LNG exports transit.
- A sustained Hormuz closure could push oil above $100 per barrel, according to Kobeissi Letter analysis, spiking US CPI inflation toward 5%.
- War-risk insurance costs have reportedly jumped ~50%, adding hundreds of thousands of dollars per voyage and reducing global trade flow.
- Shipping reroutes around Africa add 10–14 extra days to deliveries, slowing just-in-time manufacturing supply chains.
The details:
- UAE’s Capital Markets Authority ordered the two-day closure explicitly to prevent panic selling; officials said it is not a public holiday.
- The exchange shutdown followed Iranian strikes on regional ports.
- Meanwhile, Israel extended its state of emergency through March 12, 2026.
- Qatar, one of the world’s largest LNG exporters, faces potential supply delays as the Hormuz route remains disrupted.
The big picture:
- Gold surged 13% and oil rose 20% over six weeks prior to the strikes, suggesting markets had already priced in geopolitical risk.
- Analysts at Bull Theory compare potential LNG disruption to the 2022 European energy crisis, when governments drew down emergency reserves.
- Trump’s stated policy goals — low inflation and $2.00/gallon gas — conflict directly with a prolonged Iran conflict, which analysts say creates political pressure for a swift resolution.
The post UAE Suspends Stock Trading Amid Iran Strikes appeared first on BeInCrypto.
Britain agrees to help US bomb Iran and ‘destroy missiles at source’

Trump says combat operations in Iran will continue until all objectives achieved

Keir Starmer Gives United States Permission To Use UK Bases To Strike Iranian Targets


-

 Sports6 days ago
Women’s college basketball rankings: Iowa reenters top 10, Auriemma makes history
-

 Fashion2 days ago
Weekend Open Thread: Iris Top
-

 Politics6 days ago
Nick Reiner Enters Plea In Deaths Of Parents Rob And Michele
-

 Business5 days ago
True Citrus debuts functional drink mix collection
-

 Politics3 days ago
ITV enters Gaza with IDF amid ongoing genocide
-

 Tech18 hours ago
Unihertz’s Titan 2 Elite Arrives Just as Physical Keyboards Refuse to Fade Away
-
Sports2 days ago
The Vikings Need a Duck
-

 Crypto World6 days ago
XRP price enters “dead zone” as Binance leverage hits lows
-

 Tech5 days ago
Unsurprisingly, Apple's board gets what it wants in 2026 shareholder meeting
-
 NewsBeat1 day ago
Dubai flights cancelled as Brit told airspace closed ’10 minutes after boarding’
-

 NewsBeat4 days ago
Cuba says its forces have killed four on US-registered speedboat | World News
-
 NewsBeat1 day ago
The empty pub on busy Cambridge road that has been boarded up for years
-
 NewsBeat4 days ago
Manchester Central Mosque issues statement as it imposes new measures ‘with immediate effect’ after armed men enter
-

 NewsBeat7 hours ago
‘Significant’ damage to boarded-up Horden house after fire
-
 NewsBeat6 days ago
‘Hourly’ method from gastroenterologist ‘helps reduce air travel bloating’
-

 NewsBeat1 day ago
Abusive parents will now be treated like sex offenders and placed on a ‘child cruelty register’ | News UK
-
 NewsBeat5 days ago
Police latest as search for missing woman enters day nine
-

 Business4 days ago
Discord Pushes Implementation of Global Age Checks to Second Half of 2026
-

 Business3 days ago
Only 4% of women globally reside in countries that offer almost complete legal equality
-
 Sports6 days ago
2026 NFL mock draft: WRs fly off the board in first round entering combine week