
Business
Boyar Value Group 2025 Year-End Letter

da-kuk/E+ via Getty Images

2025: The Year Confidence Eroded—and Discipline Paid
An investor looking at U.S. stocks on February 19, 2025 could reasonably have expected a calm year. The S&P 500 (SP500) had already reached an all-time high closing price three times, was up roughly 4.5% YTD, and volatility remained unusually subdued. Coming off 2024’s remarkable run of 57 record closes, the market’s early message felt familiar: steady gains, low volatility, and a sense that the path of least resistance remained higher.
That confidence proved short-lived. What began as a routine pullback in early March escalated rapidly as tariff concerns came to dominate the narrative. The “Liberation Day” announcement on April 2, 2025 shocked investors with both the scale of the proposed tariff increases and their seemingly arbitrary design. From the February 19 peak to the early-April low, the S&P 500 fell roughly 21%, briefly meeting the textbook definition of a bear market. Sentiment collapsed alongside prices, and the VIX (a volatility index; values above 30 indicate greater market fear and uncertainty) surged above 50—levels typically seen only during periods of acute stress.
Then, almost as abruptly, the narrative reversed. On April 9, tariff implementation was paused and proposed rates were reduced for most trading partners. Markets responded forcefully, with the S&P 500 surging roughly 9% in a single session—one of the largest one-day gains since 1950. In the weeks that followed, a familiar pattern emerged: tariff threats triggered selloffs, followed by delays, exemptions, or reversals that fueled equally sharp rebounds. Financial Times columnist Robert Armstrong famously dubbed the pattern the “TACO” trade—Trump Always Chickens Out—a play on the administration’s tendency to use tariff threats as a negotiating tool rather than a final policy destination. By late June, the market had fully retraced its losses and pushed to new highs, completing the second-fastest recovery from a bear-market drawdown since 1950.
In retrospect, the investor who expected an uneventful year was clearly wrong—a point underscored by Charlie Bilello of Creative Planning, whose 2025: The Year in Charts vividly illustrates the historical extremity of the market’s whipsaw.
Yet for long-term investors, the most successful course of action—short of the impossible task of selling the peak and buying the April low—was simply to stay the course. By year-end, the S&P 500 had logged 39 all-time highs and gained nearly 18%. It also marked the index’s seventh double-digit annual gain in the past nine years, a streak matched by the Nasdaq (IXIC) and Russell indices (RUT), according to FactSet (FDS). Markets lurched, narratives shifted, and volatility spiked—but patience once again proved its worth.
International Stocks, the Bond Market, and Beyond
After a prolonged period of American stock market dominance, 2025 marked a notable reversal. International equities meaningfully outperformed U.S. stocks, and investor flows reflected that shift. According to Investment Company Institute data, more than $100 billion flowed into international equity funds during the year, while nearly $400 billion was withdrawn from U.S. equity funds.
Currency and commodity markets reinforced the trend. The U.S. dollar posted its weakest calendar-year performance since 2017. Precious metals enjoyed a banner year, led by gold (+65%) and silver (+144%), both of which posted their strongest annual gains since 1979. Copper also rose sharply (+40%), reflecting sustained global demand. Energy markets moved in the opposite direction, with oil prices falling nearly 20%, marking crude’s worst year since 2020. Interestingly, despite this, Energy shares were positive for 2025.
Fixed income also performed well. The Bloomberg U.S. Aggregate Bond Index (AGG) advanced 7.3%, its best annual return since 2020. Longer-term results, however, remain less impressive: since 2020, the Aggregate has generated annualized returns of just 0.9%, well below the roughly 3.7% compound annual increase in consumer prices. Emerging market fixed income stood out in 2025, with U.S. dollar-denominated sovereign debt rising 13.9%, while U.S. high-yield corporate bonds posted returns of approximately 8.6%.
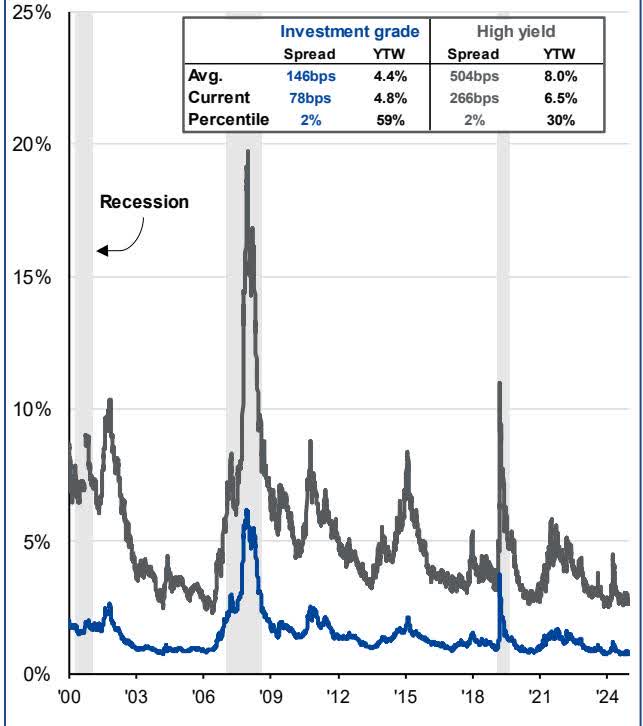
Despite these returns, the bond market gives us pause going forward. Credit spreads remain historically tight, even as U.S. companies issued roughly $1.7 trillion of investment-grade debt in 2025, with nearly 30% tied to AI-related spending. At current levels, we do not believe investors are being adequately compensated for embedded credit risk in many corporate bond issues. Corporate bond investors need to be very selective with respect to embedded credit risk and maturity in today’s environment. Caveat emptor.
Market Imbalances and Dispersion
A familiar—but increasingly pronounced—market imbalance was reinforced in 2025. Market leadership remained narrow, and speculative behavior resurfaced. Retail-investor favorites performed well, dip-buying remained effective, and investor leverage climbed sharply. FINRA margin debt reached a record $1.2 trillion in November, marking a seventh consecutive monthly increase and standing 36% higher than a year earlier. Speculation was further evident in a resurgence of SPAC IPOs, with 2025’s total SPAC issuance exceeding that of 2023 and 2024 combined. Interestingly, according to SPAC Analytics, 2025 saw more SPAC IPOs (144) than traditional IPOs (86).
Index-level returns masked these divergences. The capitalization-weighted S&P 500 advanced nearly 18% (including dividends), while the equal-weighted index rose just 11.4%. In addition, the 25 largest companies in the index gained 27% on average, while the 25 smallest declined by an average of 13% (Source: Creative Planning).
Sector performance told a similar story. Communication Services (XLC) and Technology (XLK) led the market, advancing 33.6% and 24.0%, respectively. Real Estate (XLRE) and Consumer Staples (XLP) lagged, posting gains of just 2.7% and 3.9%. This large spread underscores how headline index returns concealed wide variation beneath the surface. Importantly, corporate fundamentals remained intact. Earnings grew at a double-digit rate for the second consecutive year, and profit growth outside the Magnificent Seven was respectable at 9%. Credit markets echoed that resilience, with spreads remaining tight and default expectations subdued.
Sentiment: A Historically Bullish Signal—with a Caveat
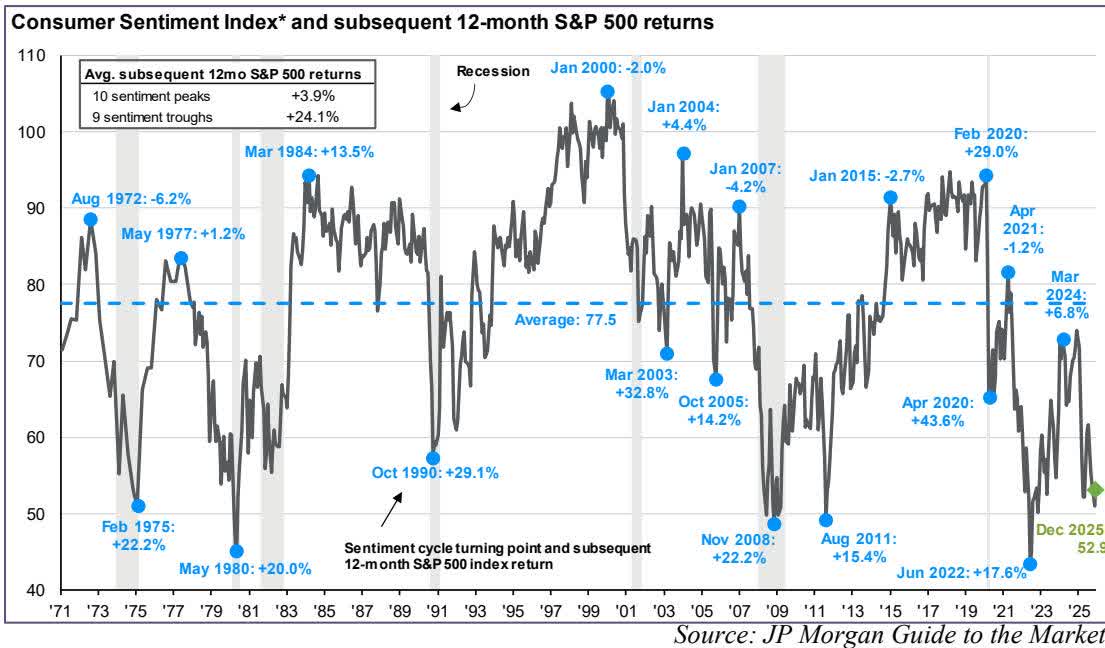
We are currently in a period of deeply negative consumer sentiment, despite strong equity-market performance and repeated new all-time highs.
Historically, periods of deeply depressed consumer sentiment have often coincided with attractive entry points for long-term investors. In past cycles, sentiment troughs—while impossible to identify with certainty in real time—have tended to cluster near market lows, with subsequent equity returns strengthening as pessimism eventually gave way to recovery.
Corporate credit spreads
Option adjusted spread, 2001 – present
Source: JP Morgan Guide to the Markets
Today’s environment, however, is unusual. In the modern era of U.S. markets, we are not aware of a sustained period in which consumer sentiment has remained this low while equity indices have continued to register new all-time highs over an extended stretch.
To make matters more confusing, the American Association of Individual Investors’ latest survey—where members are asked which direction they believe the market will be in six months (a measure many view as a contrarian indicator)—shows bullish sentiment at a one-year high. Fully 49.5% of respondents expect the market to be higher, well above the historical average of 37.5% and sharply higher than the 21.8% bullish reading immediately following “Liberation Day.”
As a result, the signals are less straightforward than history alone might suggest. The optimist in us views persistently low consumer sentiment as constructive insofar as it implies restrained expectations rather than euphoria. At the same time, humility is warranted. Low sentiment has historically been bullish—but in this instance it coexists with elevated valuations and strong recent returns, making the outlook more nuanced than a simple contrarian signal would imply.
Source: JP Morgan Guide to the Markets
Monetary Policy Uncertainty
That tension between optimism and caution shows up most clearly in monetary policy. While politics delivered the year’s sharpest shocks, monetary policy provided a more persistent undercurrent of uncertainty. At its December meeting, the Federal Reserve delivered its third 25-basis-point rate cut of 2025, leaving the federal funds rate at 3.5%–3.75%. More revealing than the cut itself was the Fed’s “dot plot”—a quarterly summary of policymakers’ anonymous interest-rate projections—which exposed a striking lack of consensus. Forecasts for 2026 ranged from a rate hike to cuts totaling as much as 150 basis points, producing a median expectation of just one additional cut.
With economic growth near 2% and inflation still above the Fed’s long-term target, the policy path ahead appears tenuous. Rate cuts that come too quickly risk reigniting inflation and steepening the yield curve, while holding policy too tight risks placing additional strain on an already fragile economy. Adding to the uncertainty are renewed questions about Federal Reserve independence, as political pressure on Chair Powell has intensified ahead of expected leadership changes in 2026.
From an interest-rate perspective, the margin for error appears unusually thin. With inflation still above target and growth slowing only modestly, the Fed’s flexibility is limited. Any miscalculation—whether easing too aggressively or holding policy too tight—risks amplifying volatility rather than containing it. In that sense, monetary policy in 2026 may prove less a tailwind or headwind for markets than a test of how well policymakers can navigate a narrowing path.
A Fiscal Tailwind—with Strings Attached
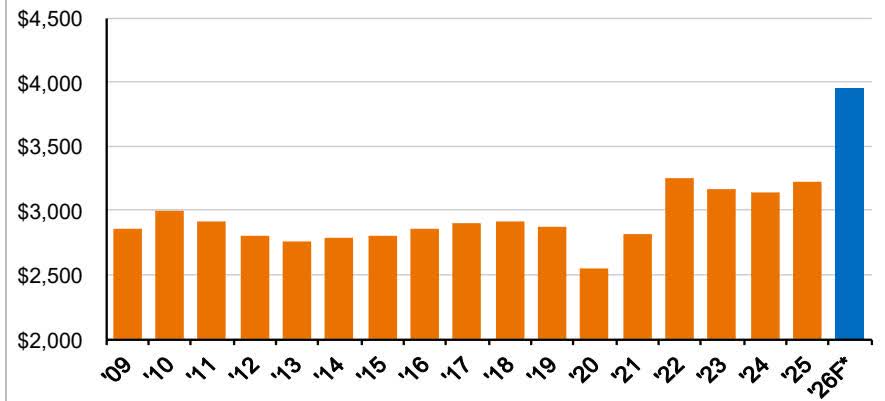
One of the more straightforward bull cases for 2026 lies on the fiscal side. The “One Big Beautiful Bill Act” materially lowers personal taxes by making previously temporary individual income-tax rate reductions permanent and by introducing a $6,000 deduction for individuals over the age of 65 (subject to income limitations), which will reduce taxable income for many retirees. The legislation also includes targeted exemptions—such as eliminating taxes on certain forms of wage income, including tips and overtime—though these provisions come with notable limits. Average tax refunds for the 2026 filing year are estimated to approach $4,000, roughly 25% above recent levels and approximately 35%–40% above pre-pandemic norms. Historically, refund season has supported near-term consumption by pulling spending forward into the spring.
Average income tax refund by filing year
2009 – 2026F*
Source: JP Morgan Guide to the Markets
Another meaningful fiscal tailwind comes from making 100% bonus depreciation permanent (it was scheduled to be reduced to 20% in 2026). Bonus depreciation allows businesses to immediately deduct a large portion—or in some cases all—of the cost of qualifying capital investments, such as machinery, equipment, technology, and certain improvements, rather than spreading those deductions over many years.
In practical terms, this improves near-term cash flow and raises the after-tax return on investment, making it easier for companies to justify new spending or accelerate projects that might otherwise be delayed. Historically, accelerated depreciation has tended to pull capital spending forward, supporting economic activity in the short run even if it does not materially change long-term demand. Since partial bonus depreciation was already in effect in recent years, it is unclear how impactful making bonus depreciation permanent will be for the economy.
Both tailwinds may prove double-edged. With inflation still above the Fed’s target, a sizable boost to disposable income risks adding to price pressures, particularly in services, reinforcing the case for monetary policy caution despite political pressure to ease further. In other words, fiscal stimulus may support growth at the margin—but it also complicates the already narrow path facing monetary policymakers.
Where do we go from Here?
Taken together, these forces help explain why the market’s signals feel unusually mixed. History rarely delivers clean signals, and 2025 was no exception. Beneath strong index-level returns lay sharp dispersion, elevated speculation, unresolved policy uncertainty, and historically low sentiment—a combination that resists simple interpretation. For investors, the lesson is not to predict the next narrative shift, but to remain disciplined when narratives inevitably change. In an environment where confidence and caution coexist, durable results are more likely to come from valuation discipline, mindfulness of balance-sheet strength, and patience than from attempts to anticipate the next turn of the tape.
Best regards,
Mark A. Boyar | Jonathan I. Boyar
Editor’s Note: The summary bullets for this article were chosen by Seeking Alpha editors.


