
CryptoCurrency
Ethereum Price Faces Peak Test as 3 Forces Quietly Collide

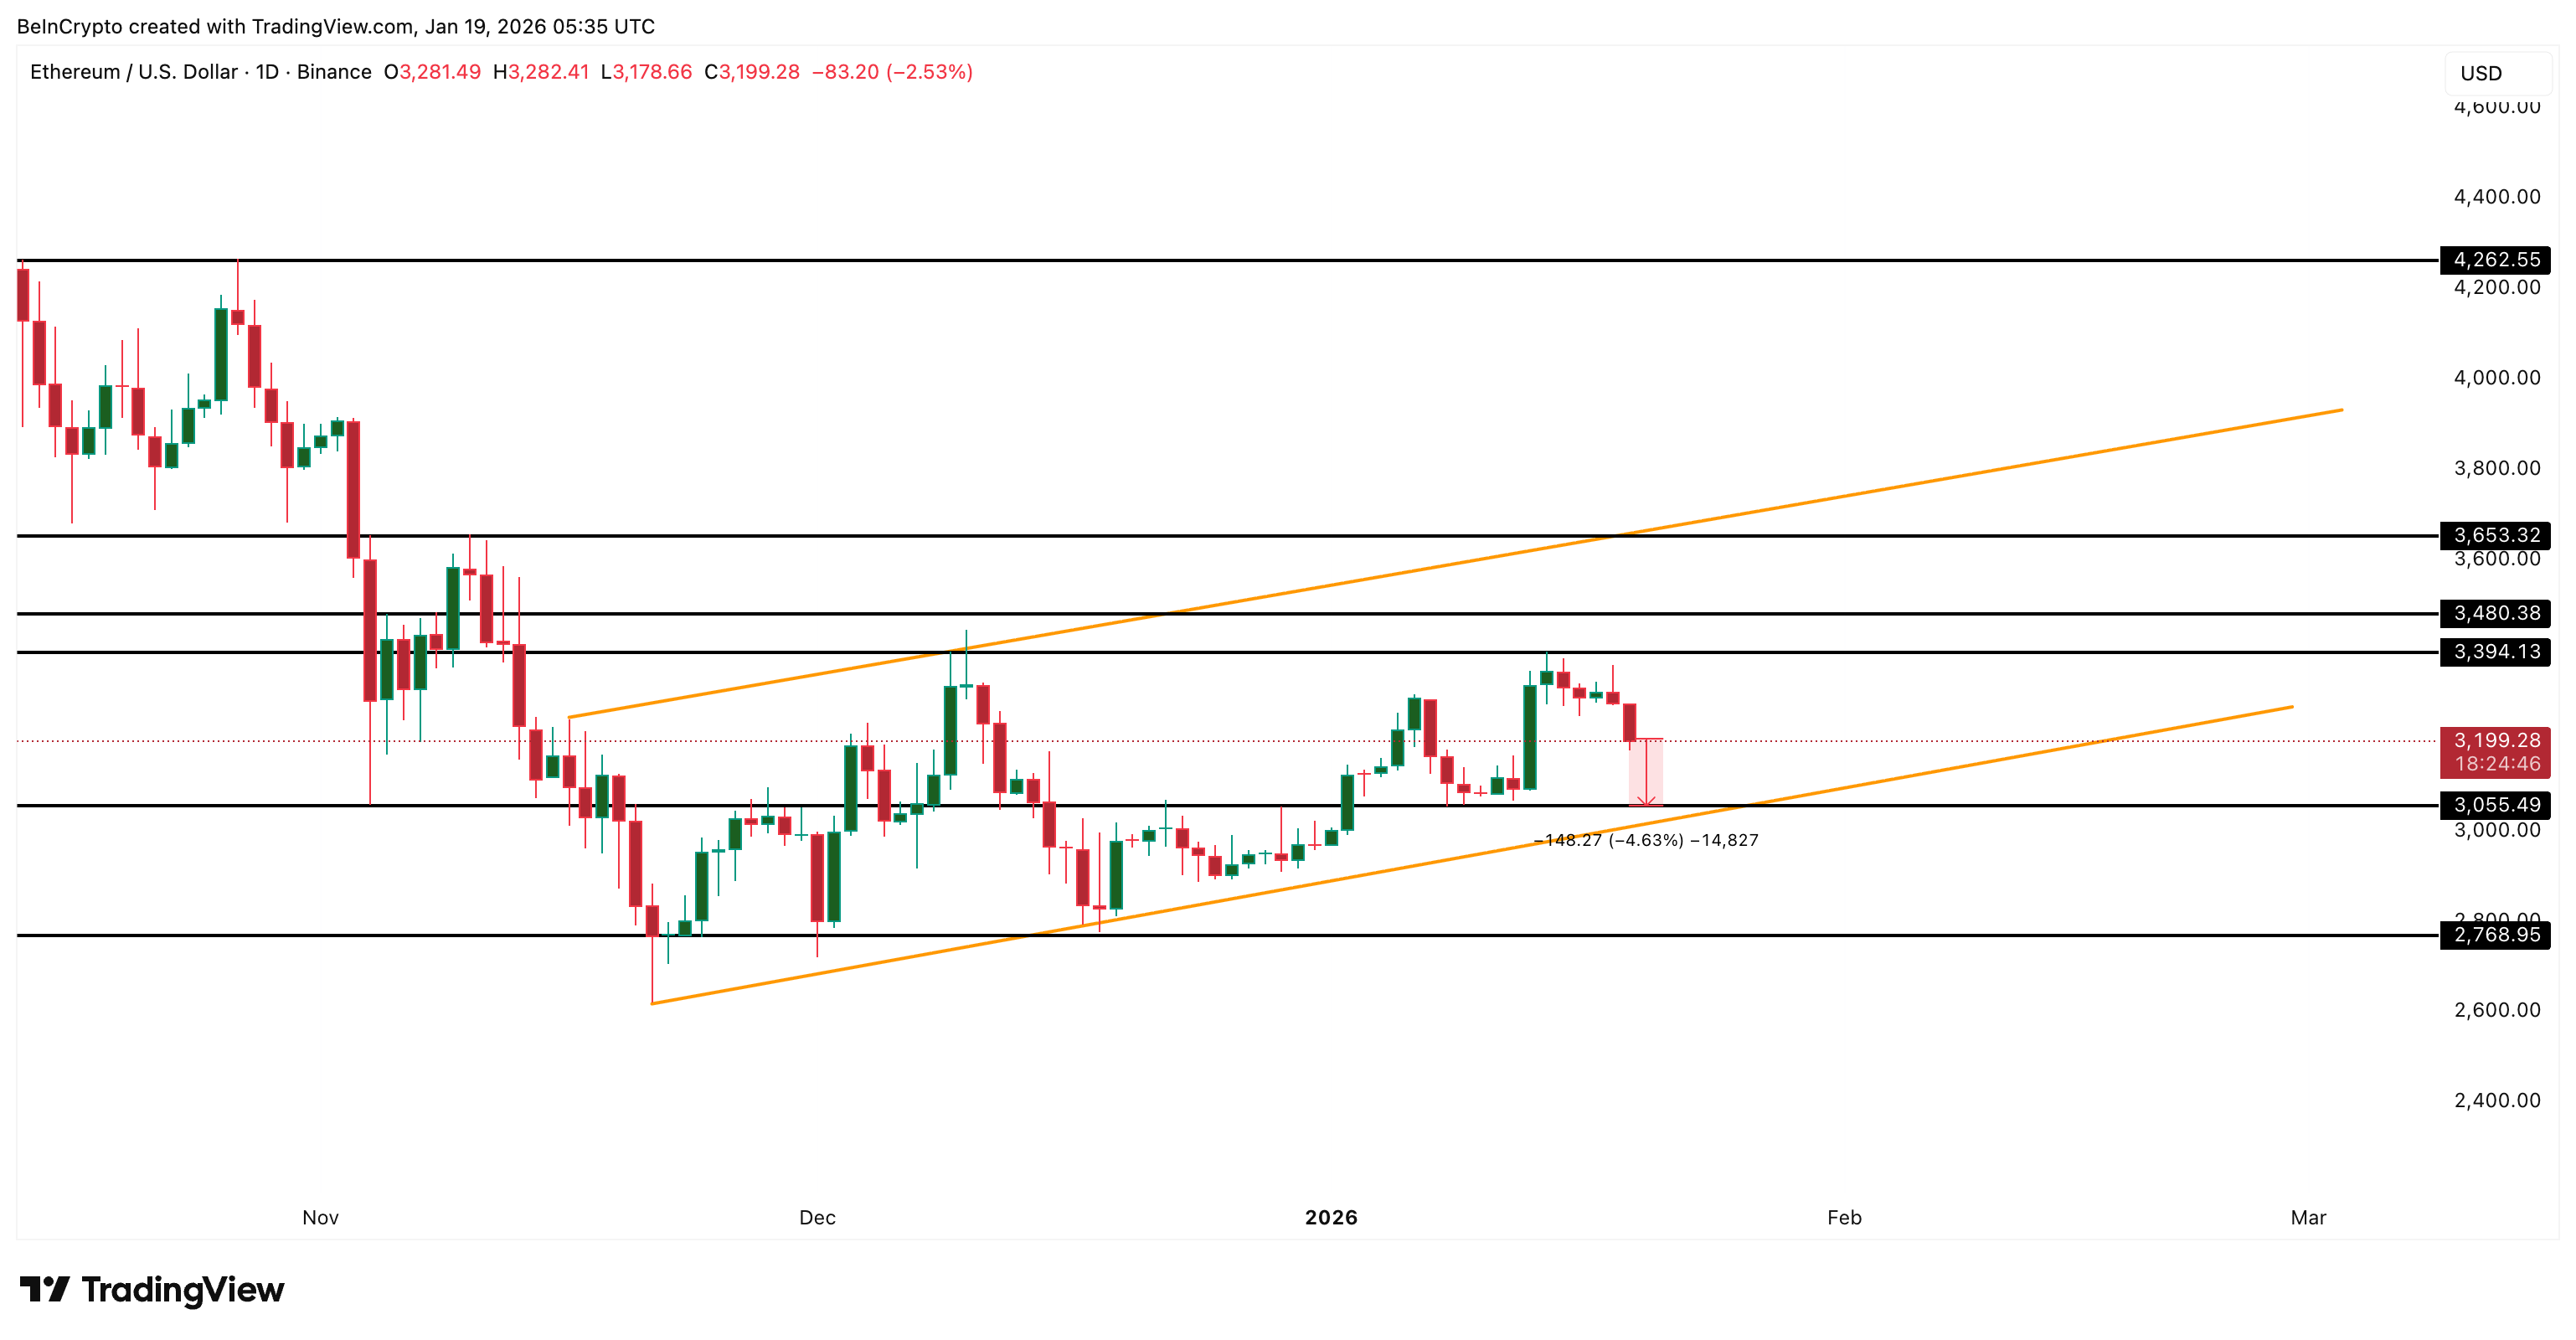
Ethereum price is slipping again. ETH is down about 3.2% over the past 24 hours, extending its pullback from the January peak near $3,390. On the surface, this looks like a normal cooldown inside a broader uptrend. But the chart structure shows growing tension under the hood.
The risk is not obvious at first glance, but it builds when multiple signals are viewed together.
Ethereum’s Bullish Structure Is Intact, But Momentum Is Quietly Weakening
Ethereum remains inside a rising channel, with the lower trendline still holding since mid-November. This structure keeps the current trend technically bullish. However, price failed to break the upper boundary on December 10 and again topped near $3,390 on January 14 before rolling over.
Sponsored
Sponsored
The warning comes from momentum behavior, the first bearish force. Relative Strength Index, or RSI, is a momentum indicator that compares recent gains to recent losses to show whether buying or selling pressure is strengthening.
Between December 10 and January 14, the Ethereum price made a lower high while the RSI made a higher high. That combination reflects hidden bearish pressure. It signals that momentum improved, but price failed to respond, often appearing near trend exhaustion zones.
Then, between January 6 and January 14, the ETH price pushed slightly higher again, but RSI formed a lower high. That second move added a standard bearish divergence on the daily timeframe.
Want more token insights like this? Sign up for Editor Harsh Notariya’s Daily Crypto Newsletter here.
Together, these two RSI signals point to the same conclusion. Momentum is fading across both the broader swing and the recent push, or rather, the January peak. That does not confirm a breakdown, but it raises the risk that the January peak could hold unless buyers regain control quickly.
If momentum continues to weaken, Ethereum becomes vulnerable to a deeper test of support. That shifts attention to on-chain behavior.
Sponsored
Sponsored
Profit Incentives Exist, But Spot Sellers Are Staying Calm
On-chain data shows Ethereum holders are sitting on sizeable unrealized gains. Net Unrealized Profit/Loss, or NUPL, measures whether holders are in profit or loss by comparing current prices to the average acquisition price of coins.
Ethereum’s aggregate NUPL, covering both short- and long-term holders, is hovering near its highest monthly level. Even after the recent drop of more than 6% from the January peak, NUPL only slipped from about 0.31 to 0.30. That is a small, 3% decline relative to the price move.
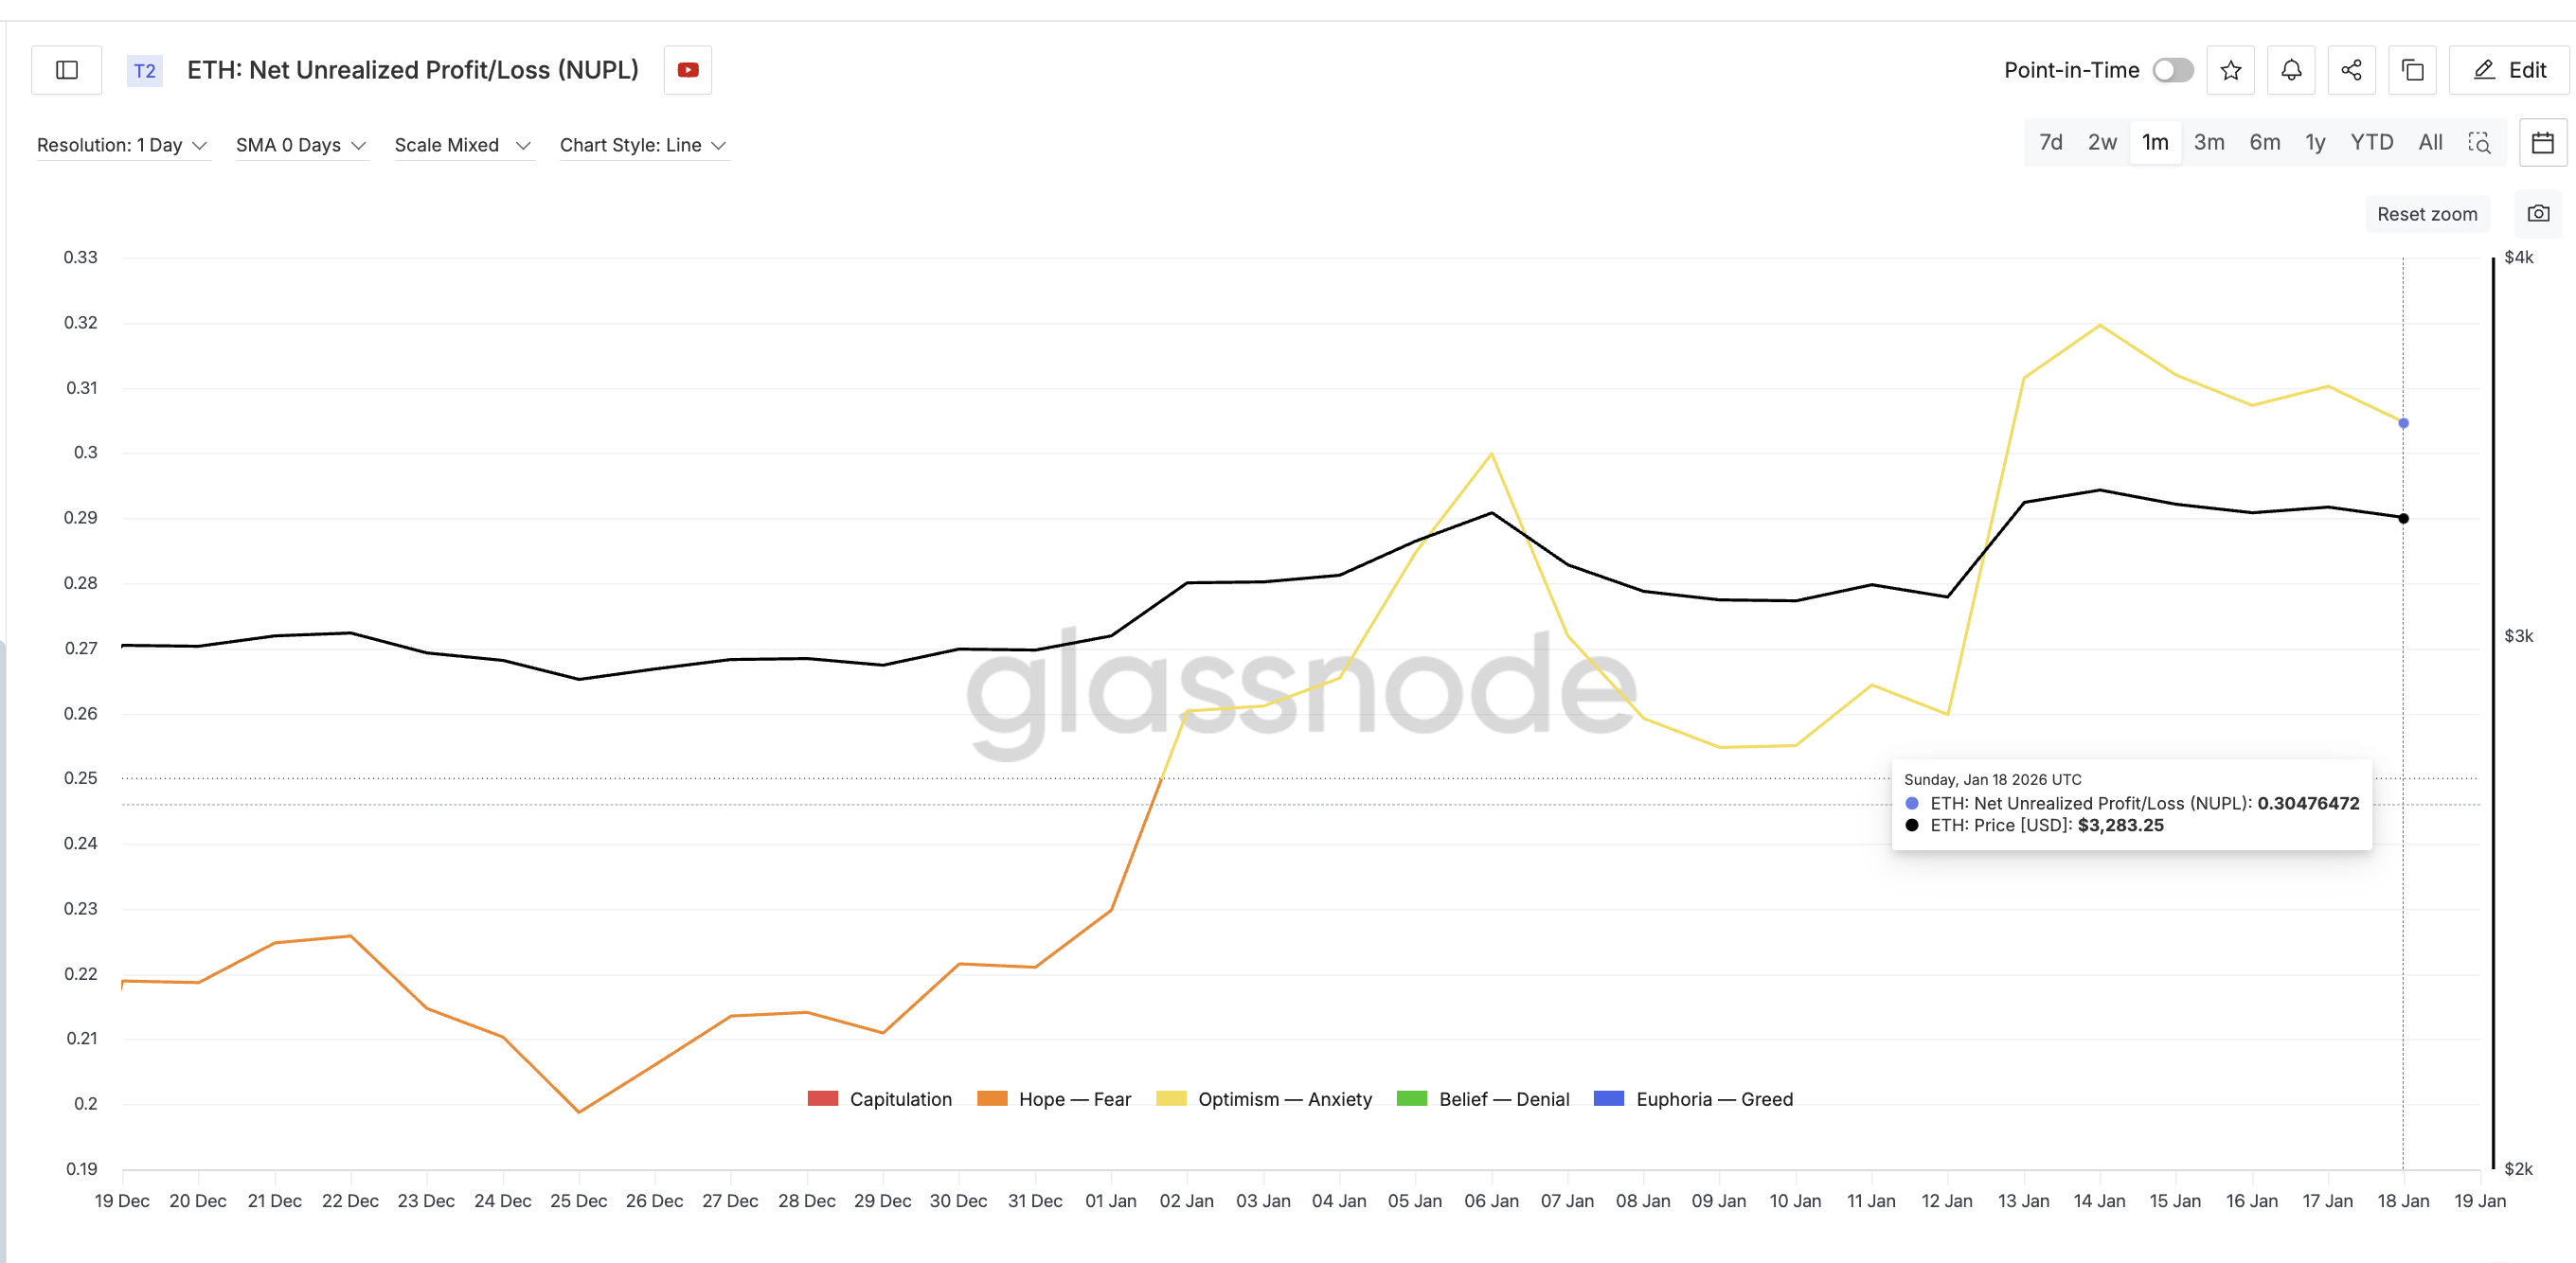
This matters because high NUPL creates an incentive to take profits, especially when technical signals weaken. On paper, Ethereum is vulnerable to profit booking. That’s the second force.
But that risk has not played out in the spot market.
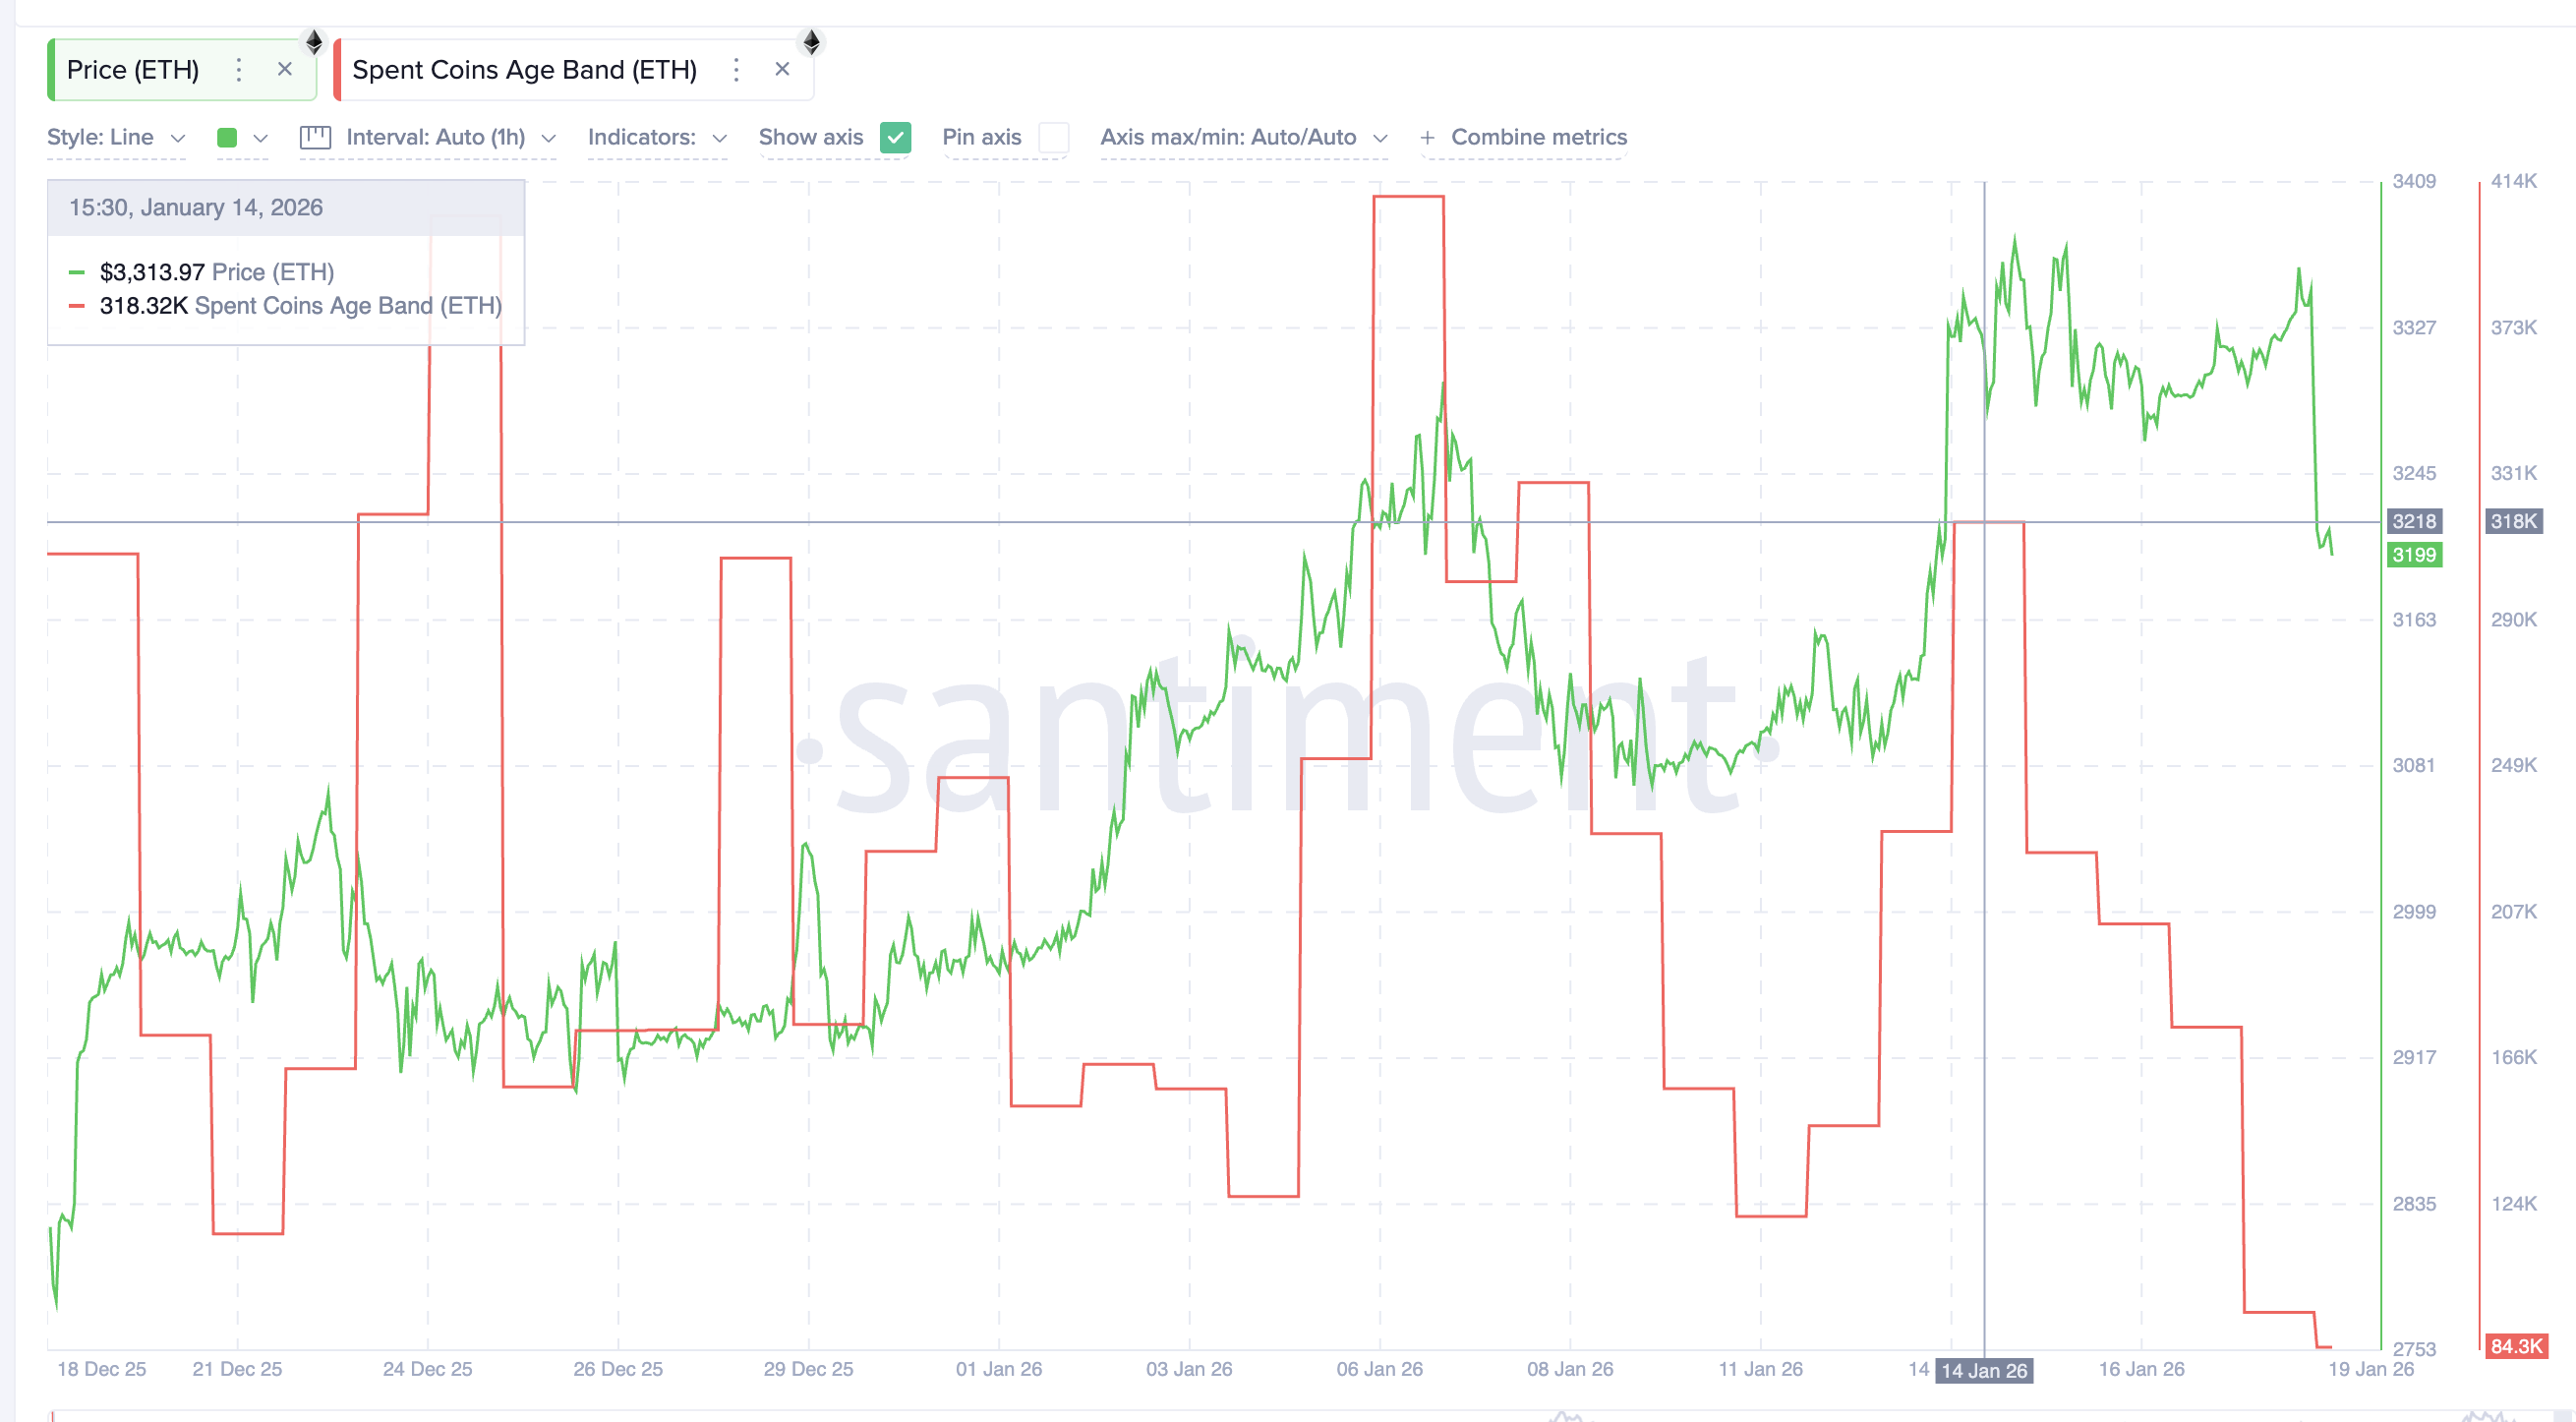
Spent Coins Age Band data, which tracks how many coins are actually moving on-chain, shows the opposite behavior. Since January 14, spent coin activity across cohorts has collapsed from roughly 318,000 ETH to about 84,300 ETH (monthly low). That is a drop of nearly 74%.
Sponsored
Sponsored
In simple terms, fewer holders are moving coins even as the price falls. That suggests no panic selling and no rush to realize profits. Spot holders appear patient, absorbing the dip rather than accelerating it.
So if spot behavior is calm, where does the downside risk come from?
Derivatives Positioning Turns $3,050 Into a Make-or-Break Ethereum Price Level
The pressure shifts when derivatives are added to the picture.
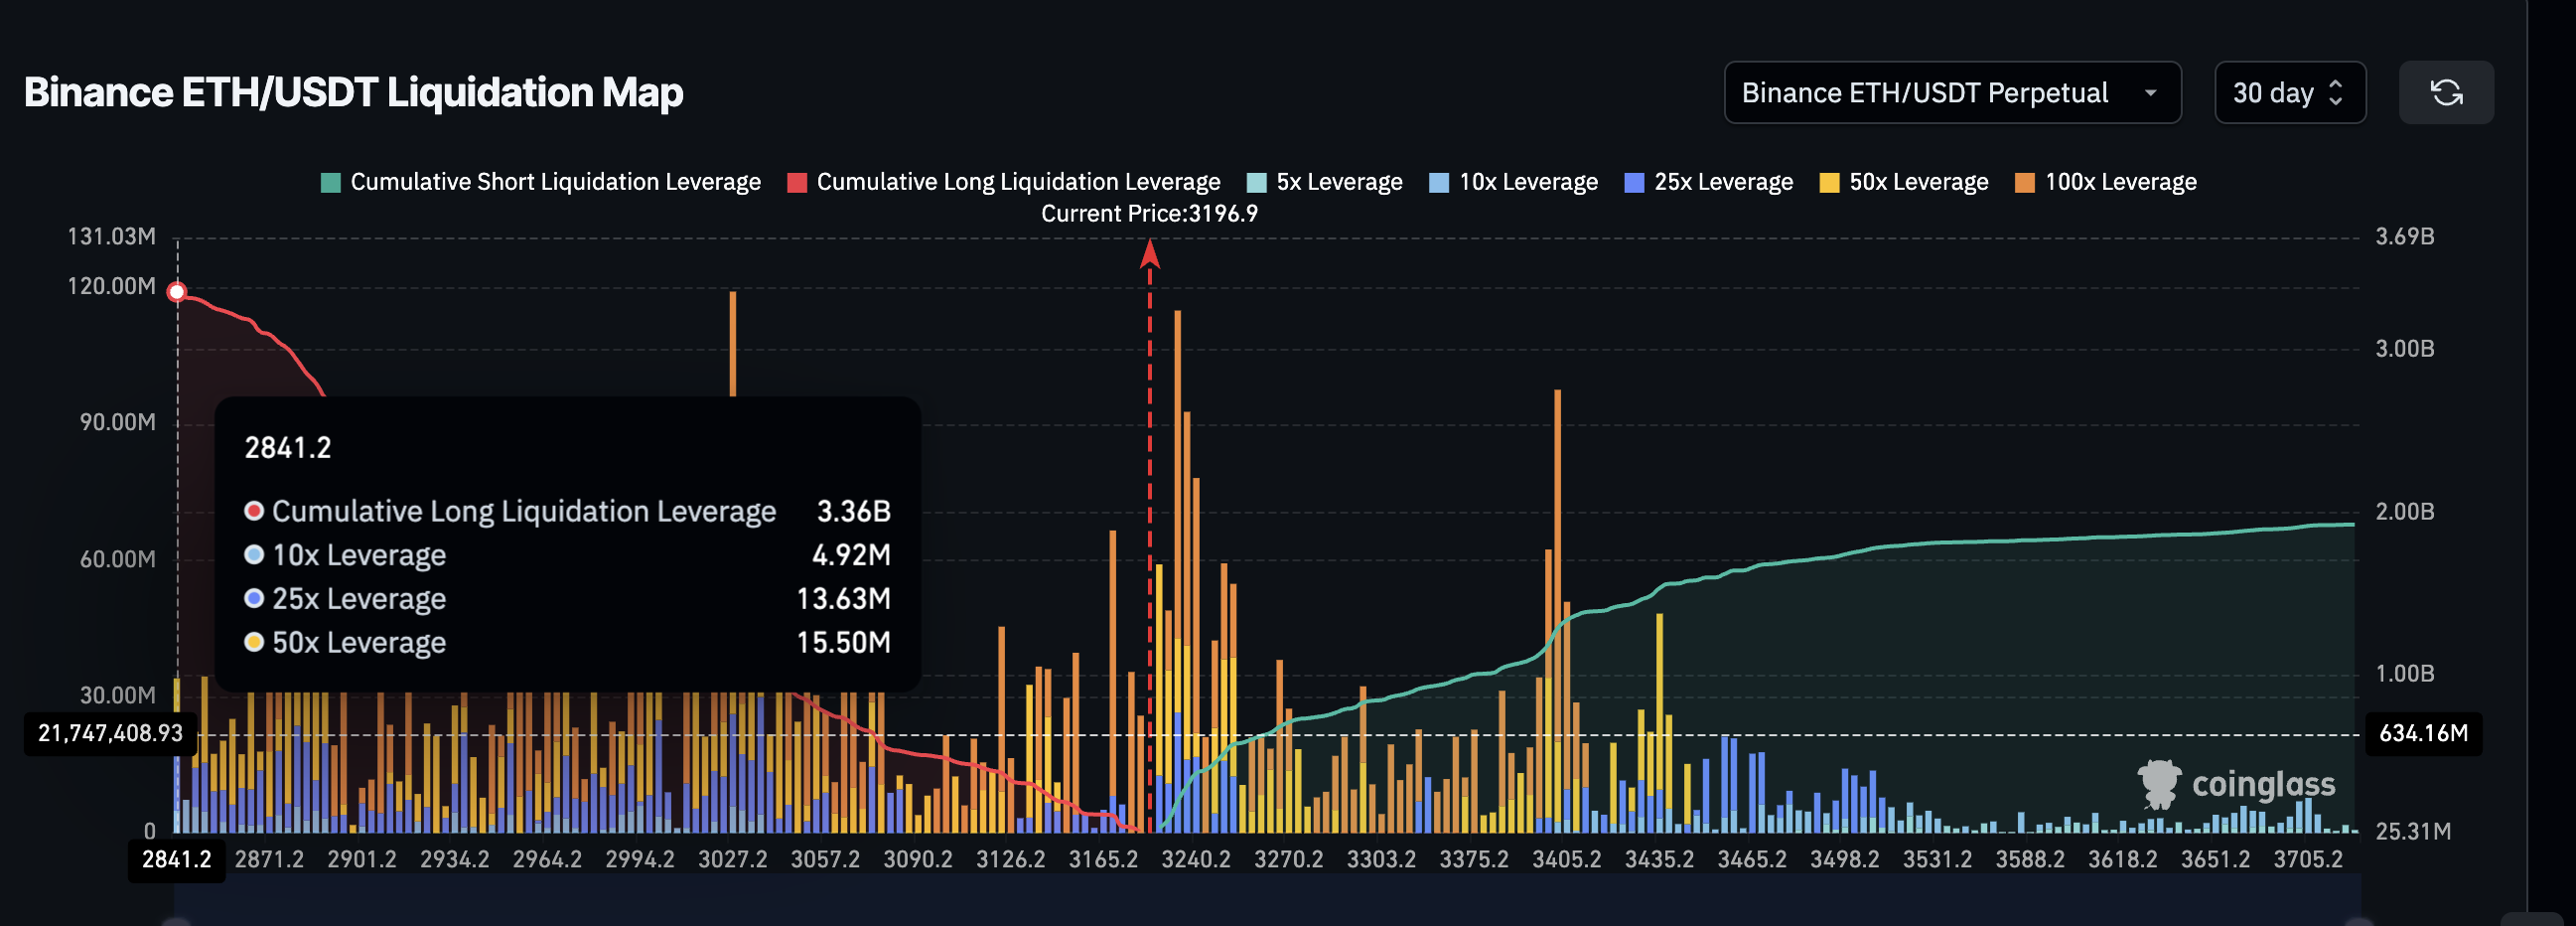
On Binance’s ETH-USDT perpetual market, positioning over the next 30 days is heavily skewed toward longs. Cumulative long leverage sits near $3.36 billion, while short exposure is closer to $1.93 billion. That creates a strong long bias, with roughly 80–90% of directional exposure leaning one way.
Sponsored
Sponsored
This imbalance becomes dangerous near key price levels.
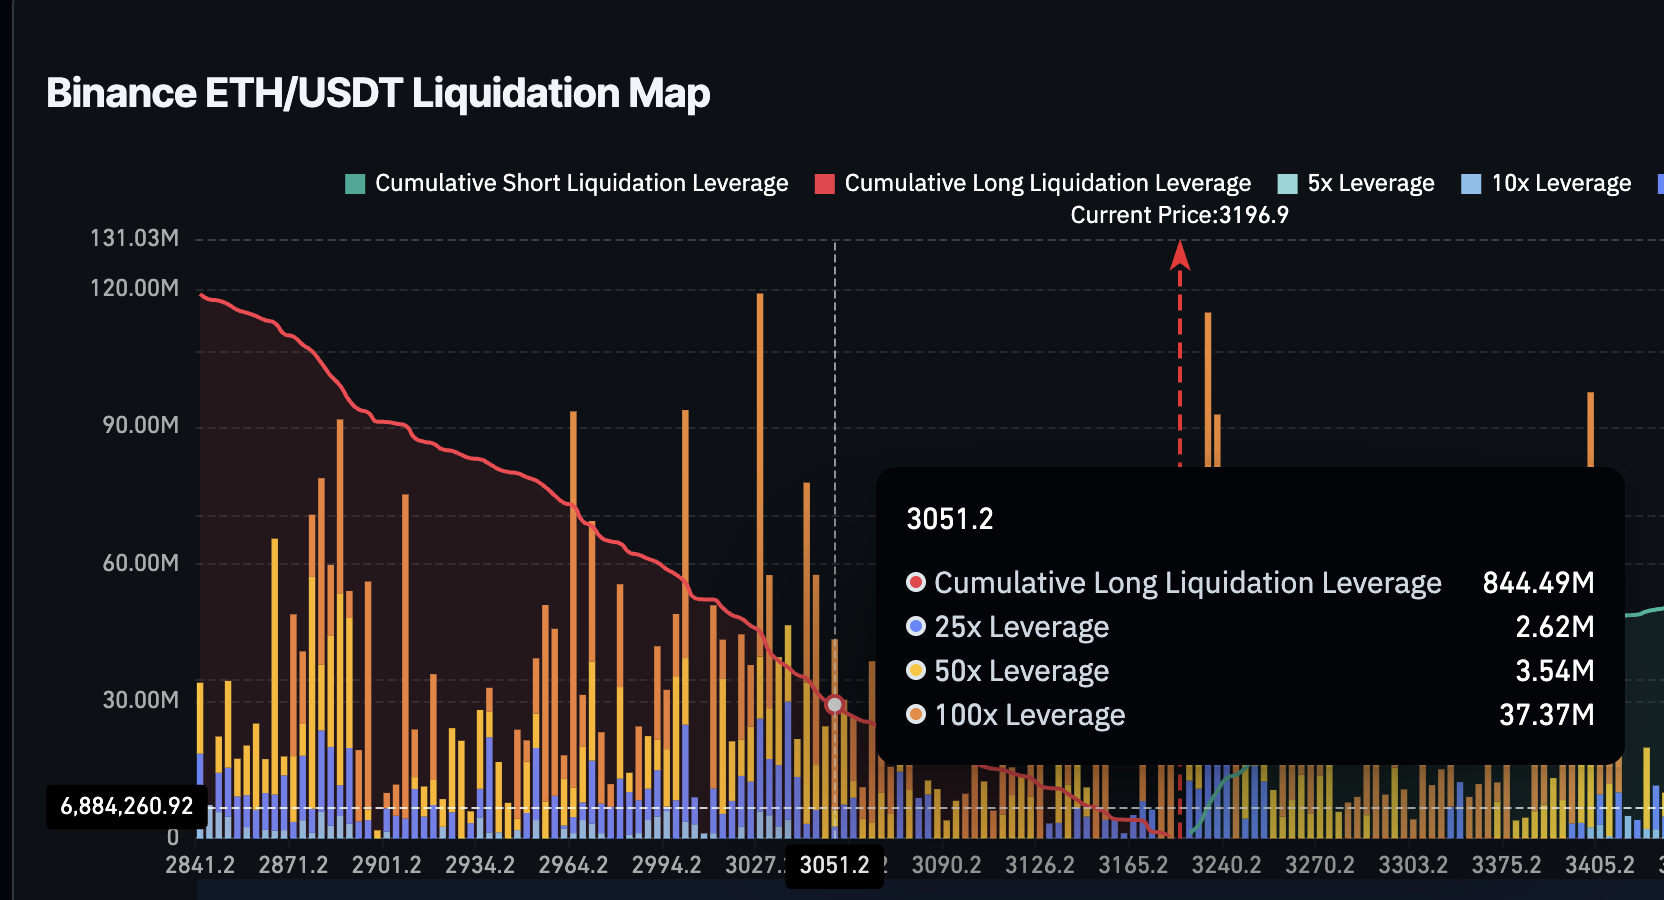
Liquidation maps show the largest concentration of long liquidations clustered below $3,050. Above that level, liquidation pressure is relatively limited. Below it, a much larger portion of the $3.3 billion in long leverage becomes vulnerable. That comes across as the third force.
That aligns directly with the chart.
The $3,050 area sits as one of the key support levels for ETH since early 2026. A daily break below it would not only activate heavy long liquidations but also come close to breaking the channel structure that has supported ETH since November. In that scenario, downside momentum could accelerate quickly, with $2,760 emerging as the next major support.
On the upside, Ethereum needs to reclaim $3,390 on a daily close to neutralize the bearish momentum signals. A move above $3,480 would strengthen recovery odds. A full trend breakout likely requires a push above $3,650, opening the door toward $4,260 later.
For now, the message is clear. Momentum is weakening. Profit incentives exist. Spot holders are calm. Derivatives are crowded. Ethereum has not broken yet. But if $3,050 fails, the risk stops being theoretical.


