

Crypto World
RWAs exceed $25 billion after nearly quadrupling in a year
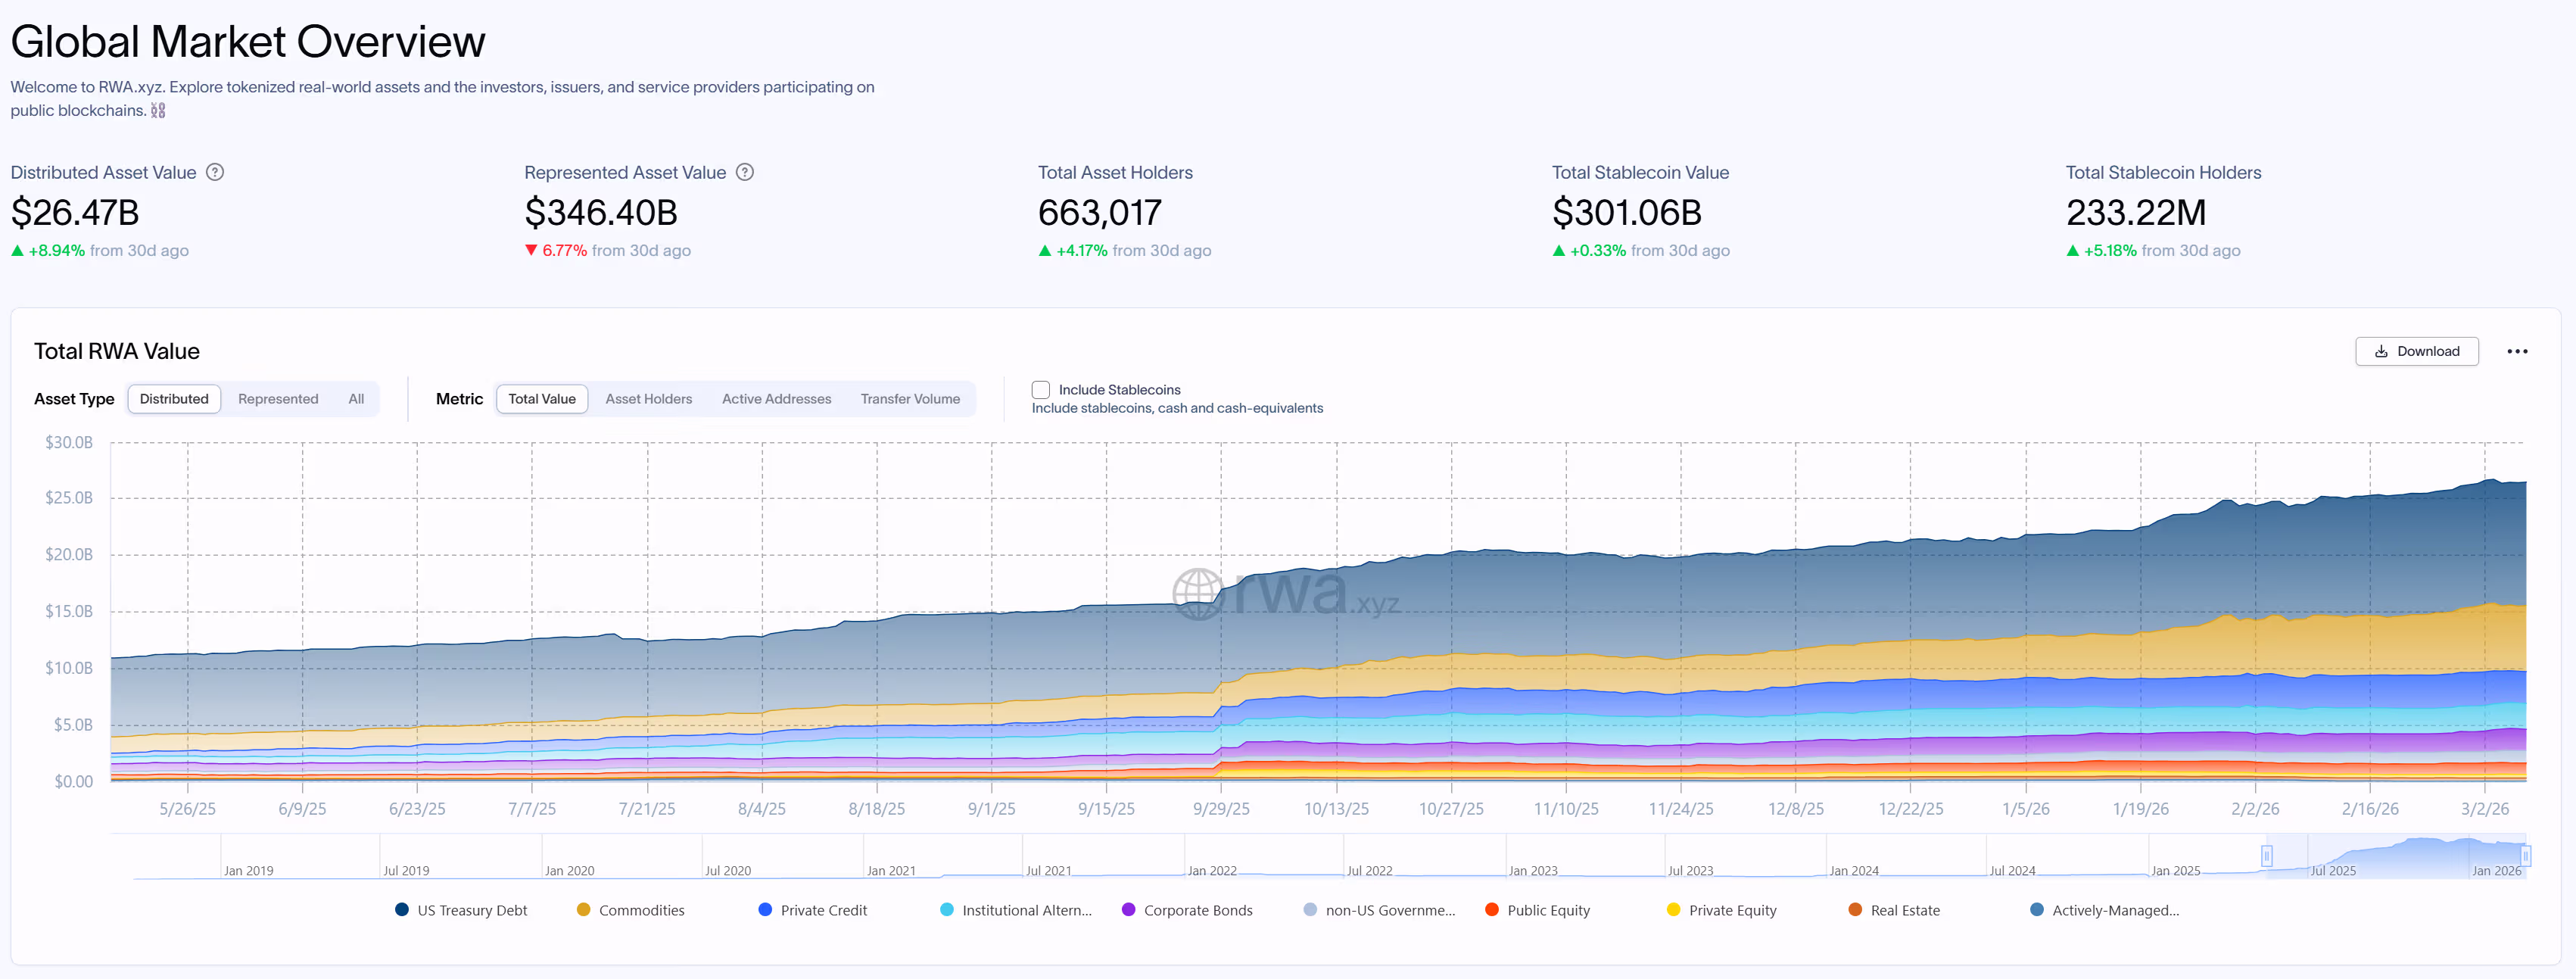
Six asset classes now exceed $1 billion onchain, but just 12% of RWA-backed stablecoin supply has entered DeFi protocols.
Tokenized real-world assets, excluding stablecoins, have crossed $25 billion in onchain value, nearly quadrupling from roughly $6.4 billion a year earlier, according to data from RWA.xyz.

The milestone, and continued growth, as RWAs hit the $20 billion mark at the end of 2025, continues a shift from early experimentation toward institutional-scale deployment. Asset managers, including BlackRock, Fidelity, and WisdomTree, have launched tokenized fund products over the past year, while the number of tokenized U.S. Treasury offerings alone expanded from 35 to over 50, according to data compiled by Nexus Data Labs.
Six tokenized asset categories have now crossed the $1 billion threshold: U.S. Treasuries, commodities, private credit, institutional alternative funds, corporate bonds, and non-U.S. government debt, according to RWA.xyz data.
Issuance outpaces integration
Still, much of the activity reflects asset issuance rather than active trading.
Despite the growth in supply, much of the activity reflects asset issuance rather than active trading. Onchain transfer data shows many of the largest RWA transactions clustering around $10 million per transfer, a pattern consistent with institutional allocation batching rather than continuous market activity.
A February 2026 survey from tokenization platform Brickken reinforced the point: 53.8% of tokenized asset issuers said capital formation and fundraising efficiency are their primary motivation for tokenizing, while just 15.4% cited liquidity.
Even when assets move onchain, most remain walled off from decentralized finance.
6/7
The twist nobody talks about:
RWA-backed stablecoin supply = ~$8.5B
Only $1B (11.8%) is actually deployed in DeFi
88% sits idle because of KYC/whitelisting walls
Permissionless assets (reUSD, etc.) hit 96%+ utilization
Composability is the next unlock for RWA
h/t… pic.twitter.com/gpbyRl9CD0
— Diego | Take Profits (@0xTakeProfits) March 7, 2026
Nexus Data Labs estimates roughly $8.49 billion in RWA-backed stablecoin supply exists, but only about $1 billion, or 11.8%, is currently deployed in DeFi protocols.
The remaining 88% sits outside onchain lending and trading systems, largely because the underlying assets impose compliance requirements, including KYC checks, transfer restrictions, and whitelisting.
That gap frames the sector’s central question heading into the second half of the year. Tokenized asset supply is growing fast enough that some projections place the market above $400 billion by year-end.
Whether those assets remain siloed in permissioned structures or begin integrating with the composable collateral, lending, and trading systems that define DeFi will likely determine whether tokenization scales as a parallel settlement layer for traditional finance or becomes something structurally different.

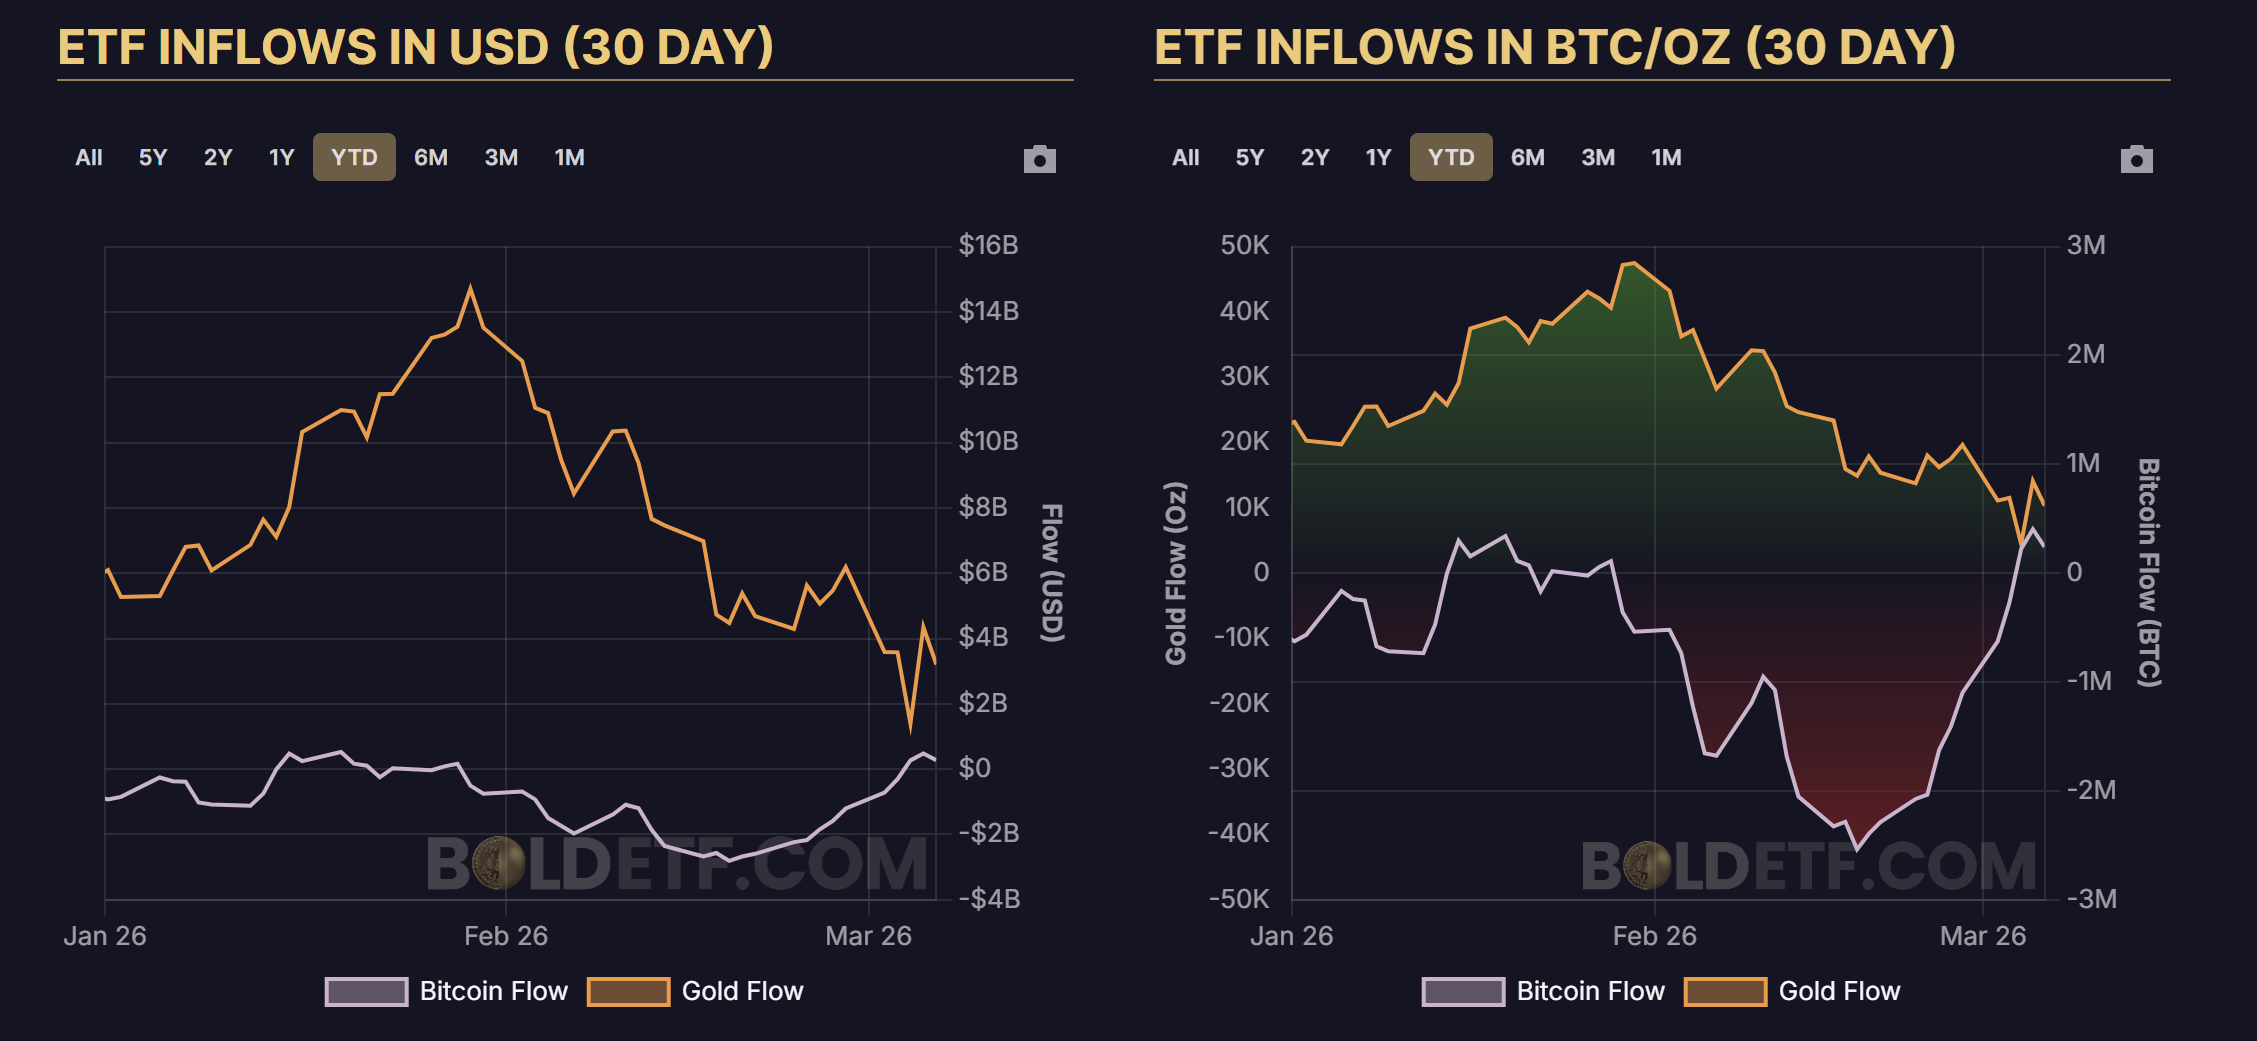
Bitcoin (BTC) exchange-traded fund (ETF) flows have turned net positive over the past 30 days, while gold ETF demand has started to slow down after nine straight months of inflows. The shift comes even as gold prices remain elevated and sentiment around Bitcoin continues to cool.
With these contrasting trends in ETF flows and the historical pattern of Bitcoin-to-gold performance cycles, analysts are now examining data that may signal a gradual shift in investor demand between the two assets.
Are ETF flows beginning to rotate?
According to the Kobeissi Letter, the largest US gold-backed ETF, GLD, recorded a $3 billion outflow on Wednesday, the largest daily withdrawal in more than two years. The move followed a 4.4% decline in gold prices, the sharpest drop since the Jan. 30 sell-off.
Gold ETFs had attracted $18.7 billion in January and another $5.3 billion in February, marking the strongest two-month start to a year on record and extending a nine-month inflow streak. The latest outflow points to investors taking profits after gold’s massive rally in 2025.
Bitcoin ETF flows moved in the opposite direction over the past month. The 30-day net flow shifted to a $273 million inflow on March 6 from a $1.9 billion outflow on Feb. 6

The holdings data measured in native units show the divergence more clearly. Bitcoin ETF balances moved to a net increase of 4,021 BTC on March 6 from −42,275 BTC on Feb. 6. Gold ETF holdings declined from 1.4 million ounces to 621,100 ounces during the same period.
The native units represent the actual underlying asset held by funds rather than the dollar value of those holdings. Tracking BTC or ounces isolates real accumulation or distribution without the distortion created by the price movements.
Head of growth at Horizon, Joe Consorti, summarized the current trend and said,
“Gold is stalling out while bitcoin is soaring. BTC is set to overtake gold’s % growth over the last month as the U.S. economy accelerates and risk sentiment improves. The anticipated risk-off → risk-on rotation could be underway.”
Related: Bitcoin dip may not be over as retail ramps up buying below $70K: Santiment
Gold rallies precede Bitcoin recoveries
In a “2026 Look Ahead” report released at the end of December 2025, Fidelity Digital Assets analyst Chris Kuiper noted that gold’s 65% return in 2025 was the fourth-largest annual gain since the end of the gold standard. With respect to past rallies, Kuiper noted that gold is potentially near the late stages of its leadership cycle between the two assets. Kuiper said,
“Historically, gold and bitcoin have taken turns outperforming. With gold shining in 2025, it would not be surprising if bitcoin takes the lead next.”
However, the rotation may take some time to unfold in the market.

As illustrated in the chart, BTC needed roughly 147 days or 21 weeks to establish a sustained trend outperforming gold after Bitcoin’s 2022 bottom. The period marked a consolidation phase before the ratio began trending higher.
The BTC-to-gold ratio currently trades near the same consolidation zone seen during the earlier rotation phases in 2022-2023.
Kuiper also added that both assets can benefit from the persistent fiscal deficits, trade tensions, and geopolitical uncertainty as investors seek neutral stores of value outside traditional monetary systems.
The ongoing US-Israel and Iran war has reinforced demand for traditional safe-haven assets, which previously supported gold rallies during periods of geopolitical stress.
Meanwhile, macroeconomic strategist Lyn Alden expects Bitcoin to outperform gold over the next two to three years following gold’s recent rally in the past few months.
Related: When buying Bitcoin, don’t expect profit for at least 3 years: Data
This article does not contain investment advice or recommendations. Every investment and trading move involves risk, and readers should conduct their own research when making a decision. While we strive to provide accurate and timely information, Cointelegraph does not guarantee the accuracy, completeness, or reliability of any information in this article. This article may contain forward-looking statements that are subject to risks and uncertainties. Cointelegraph will not be liable for any loss or damage arising from your reliance on this information.

XRP price is holding the $1.30 support level, but order flow data shows sellers are still dominating market activity, keeping short-term upside limited.
Summary
- XRP trades around $1.36 after rising 1.3% in the past 24 hours, though the token remains about 62% below its 2025 peak.
- Order flow data shows aggressive sell orders outweighing buys, indicating continued selling pressure.
- If $1.30 support holds, XRP could attempt a move toward $1.40 psychological level, while a breakdown may open the path to $1.20.
XRP (XRP) was trading at $1.36 at press time, gaining 1.3% in the past 24 hours as the token attempted to stabilize after weeks of selling pressure.
Over the last seven days, XRP moved between $1.34 and $1.46. Even with the recent consolidation, the token remains far below previous highs and is currently about 62% below its July 2025 all-time high of $3.65.
Market activity has picked up. 24-hour trading volume reached $2.55 billion, marking a 67.5% increase from the previous day.
Derivatives activity has also grown. Data from CoinGlass shows trading volume rising 63% to $3.54 billion, while open interest climbed 2.5% to $2.33 billion. The increase suggests traders are opening new positions as the market searches for direction.
Sellers dominate market orders
A March 9 report from CryptoQuant contributor PelinayPA shows that sellers currently control the aggressive side of the order flow.
The buy-to-sell liquidity ratio stands near 0.912, meaning market sell orders are exceeding market buy orders. In simple terms, traders are using market orders to sell more often than to buy.
XRP has been trading close to $1.34 during this time, with little upward momentum. When the ratio dips below 1, market orders are not pushing the price higher.
Although there are still buyers in the market, the majority seem to be making limit orders instead of aggressive market buys. As a result, buyers supply liquidity and sellers remove it through market orders.
As long as this imbalance continues, selling pressure may persist. The data suggests that the current market structure is still leaning toward the sell side.
XRP price technical analysis
A short-term support area has formed between $1.30 and $1.33 on the daily chart. Price has stabilized around this zone several times, and recent candles show sideways movement just above it, which suggests buyers are defending the level.
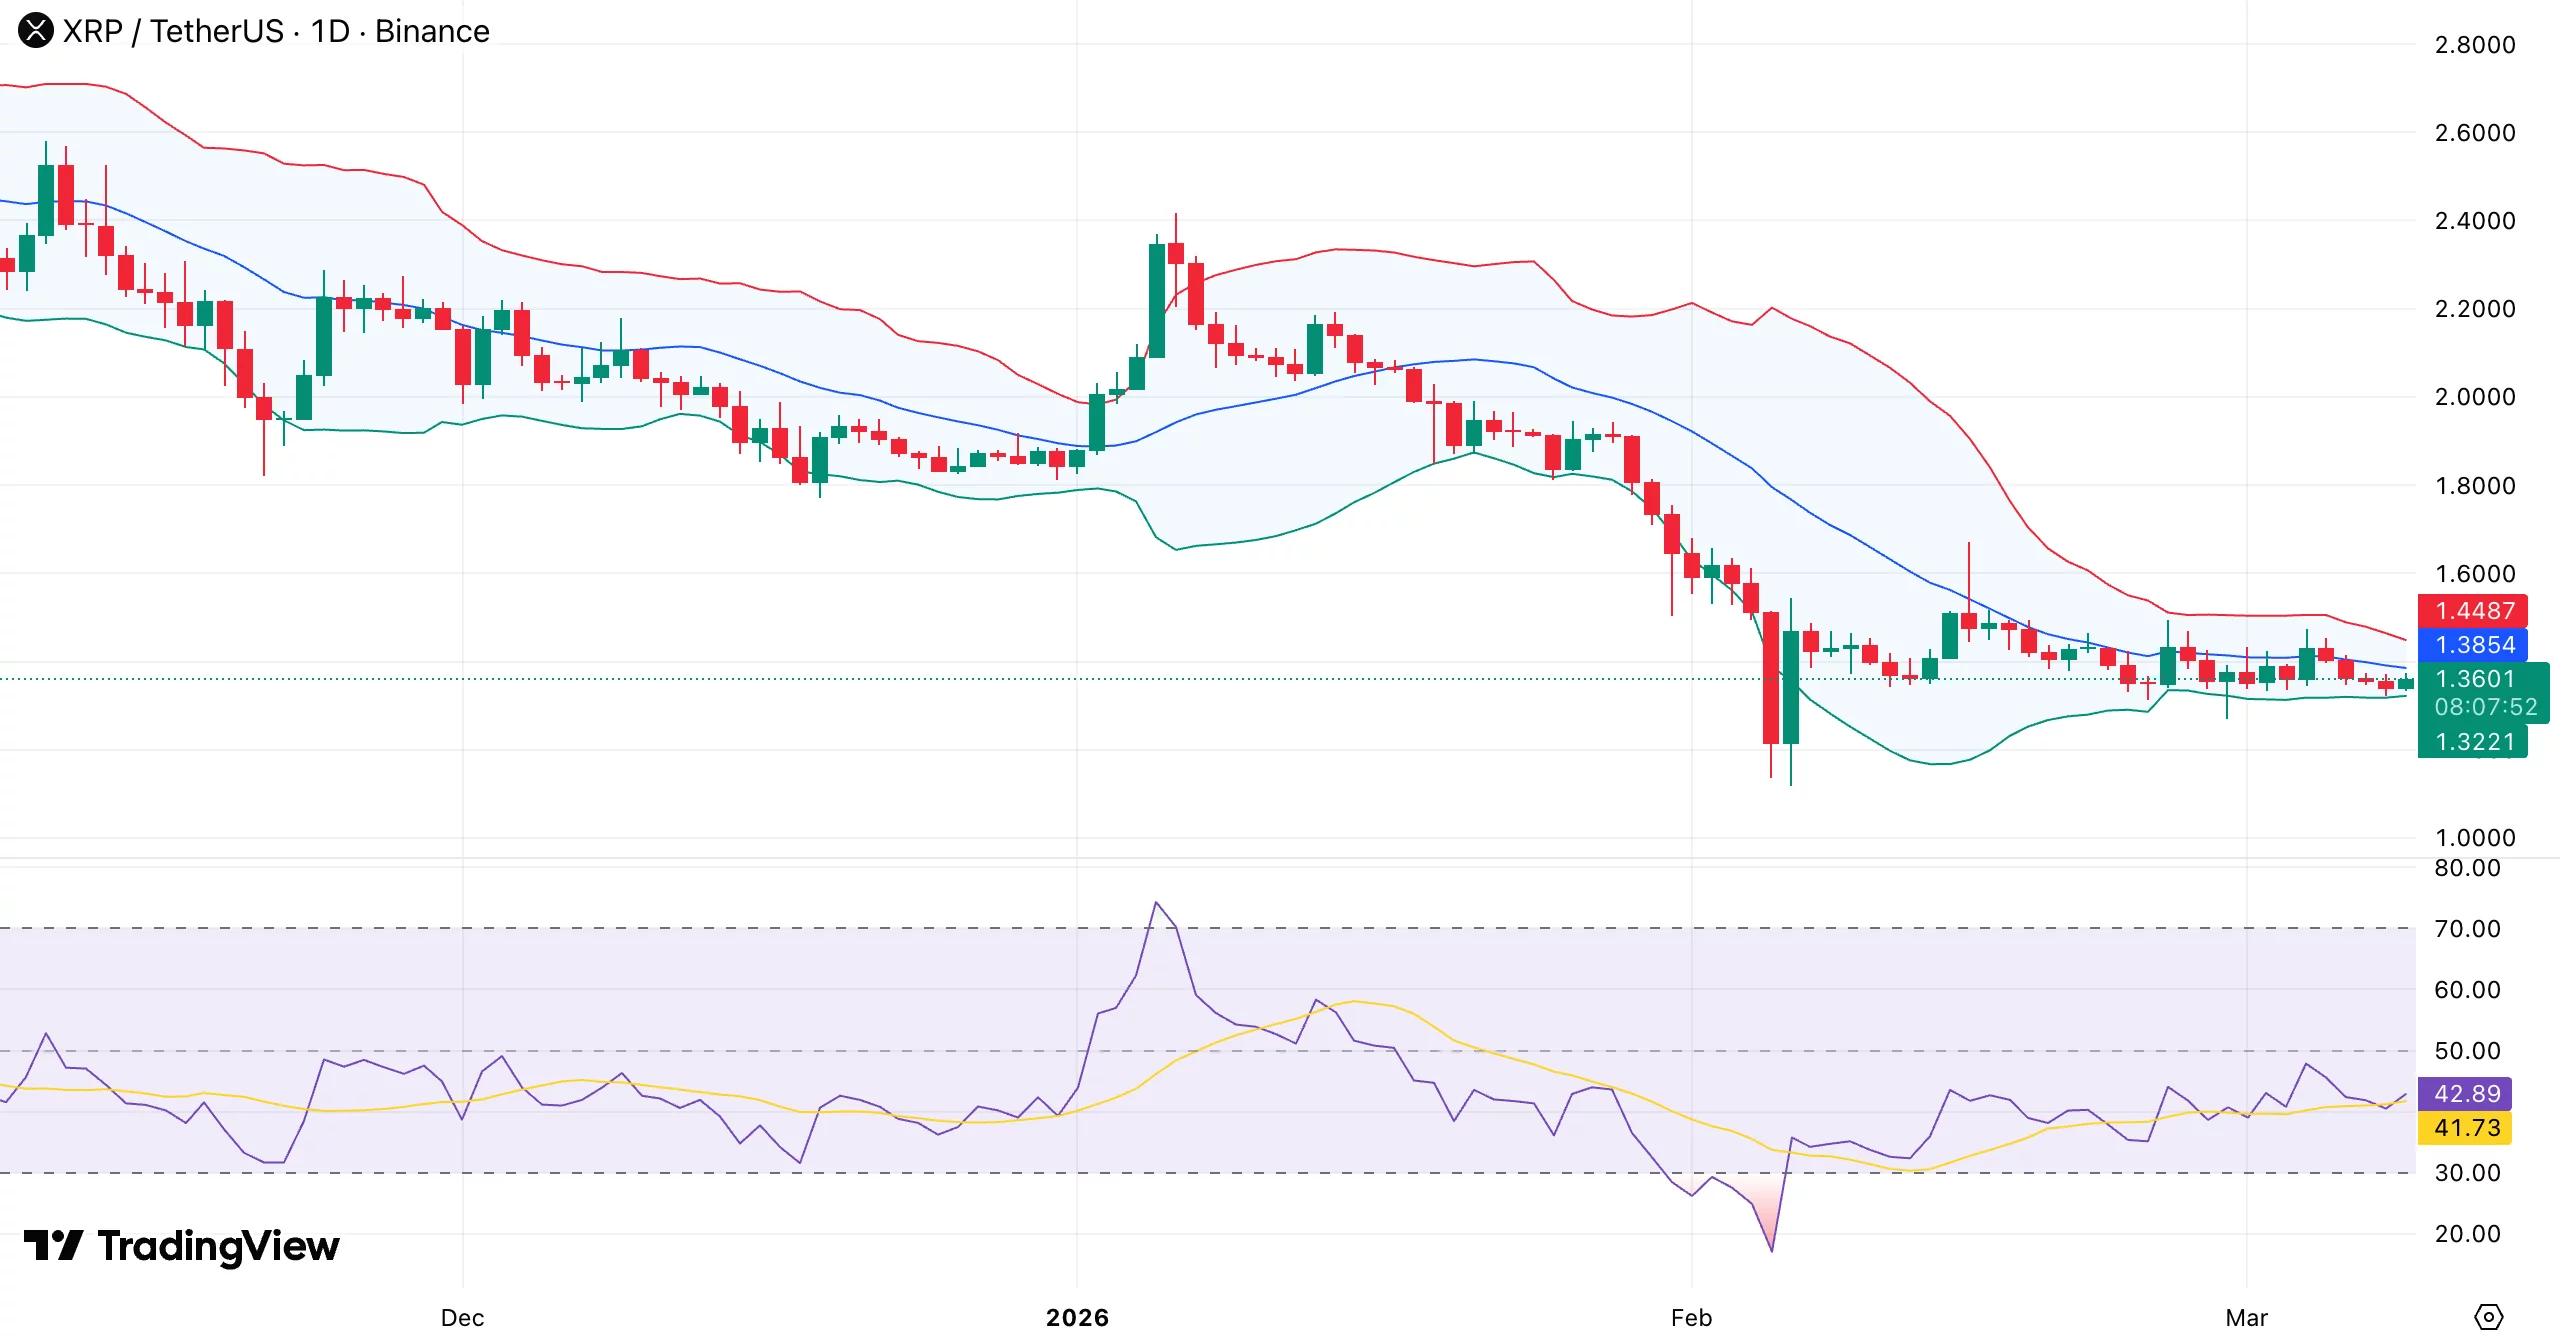
At the same time, XRP is trading below the Bollinger Bands mid-line, which is in line with the 20-day moving average. When price trades under this level, the short-term trend is usually considered bearish.
Earlier in February, XRP touched the lower Bollinger Band before bouncing higher. Since that drop, volatility has slowly decreased and price has moved sideways.
Momentum is still weak. The relative strength index sits around 42–43, which is still below the neutral 50 level. The indicator has recovered from near-oversold levels seen earlier in February, but buying momentum is still limited.
The larger structure also shows pressure. Since early January, the chart has produced a series of lower highs, meaning the wider downtrend has not yet changed. The current sideways movement appears to be a pause within that trend.
Meanwhile, Bollinger Bands are tightening, which often comes before a stronger price move. If XRP continues to hold above $1.30, buyers may try to push the price toward the $1.38–$1.40 area, where the Bollinger mid-line sits.
A move above that zone, together with RSI approaching 50, would improve the short-term outlook. However, if $1.30 support breaks, XRP could slide toward $1.20. Continued weakness in RSI below the neutral level would keep the bearish structure in place for now.


US investors drove most crypto fund activity, and added $646 million last week.
Investment products tied to digital assets posted net inflows of $619 million last week, which, according to CoinShares, indicates that the initial response to the Iran crisis was favorable for the sector. Inflows of $1.44 billion were registered during the first three days of the week, reflecting early optimism among investors.
Sentiment weakened later as $829 million left the market on Thursday and Friday. The withdrawals came even as payroll figures were much weaker than anticipated, a development that might normally support risk assets.
Geopolitical Tensions Shape Weekly Gain
However, higher oil prices countered any potential decline in inflation that could have resulted from the weak labor data. Despite the late-week outflows, the overall weekly flows suggest investor sentiment toward digital asset investment products remained broadly positive during ongoing geopolitical uncertainty.
According to the latest edition of CoinShares’ Digital Asset Fund Flows Weekly Report, Bitcoin attracted the largest share of investor allocations last week, as $521 million was directed into related investment products. However, sentiment toward the asset remained divided, as short-Bitcoin products also recorded $11.4 million in new capital. Among altcoins, Ethereum led activity with $88.5 million, followed by Solana with $14.6 million.
Smaller additions were recorded for Uniswap and Chainlink, each receiving $1.4 million. Multi-asset products raked in $5.4 million during the same period. On the other hand, XRP moved in the opposite direction and saw withdrawals of $30.3 million from investment products tied to the token.
Most of the positive investor activity came from the United States, where digital asset products amassed $646 million. Other regions showed weaker sentiment. For instance, Europe recorded $23.8 million leaving the market, while Asia and Canada saw outflows of $2.2 million and $3.6 million, respectively.
Traders Brace for Volatility
Bitcoin remained relatively resilient even as rising tensions involving Iran pushed oil prices above $115 and triggered broader market stress. Fears of significant supply disruptions through the Strait of Hormuz and wider instability in the Middle East pressured global equities and pushed the VIX above 29.
You may also like:
Despite this environment, QCP Capital said Bitcoin has held up better than many other risk assets, a pattern the crypto market has not seen for some time. Options market positioning also revealed that traders are less concerned about another sharp decline than during the initial shock last week.
While downside protection is still in place, particularly through short-dated options with strikes between $61,000 and $64,000, flows indicate expectations of continued volatility rather than a one-way decline.
Binance Free $600 (CryptoPotato Exclusive): Use this link to register a new account and receive $600 exclusive welcome offer on Binance (full details).
LIMITED OFFER for CryptoPotato readers at Bybit: Use this link to register and open a $500 FREE position on any coin!
Crypto World
Coinbase (COIN) Stock: Collaborates With Aon and Paxos on Stablecoin Insurance Payment Pilot

TLDR
- Coinbase collaborates with Aon on blockchain-based insurance premium pilot using stablecoins.
- Transactions settle nearly instantaneously across global networks using digital tokens.
- Blockchain technology eliminates multiple intermediaries in payment processing.
- Immutable ledger records enhance audit trails and financial reconciliation.
- Growing corporate interest follows improved regulatory framework for digital assets.
Corporate finance continues embracing innovative payment technologies as leading institutions experiment with distributed ledger solutions. Coinbase Global, Inc. stock closed at $194.71, declining 1.26%, as the cryptocurrency exchange engaged in a blockchain insurance payment trial. Insurance brokerage giant Aon partnered with Paxos to facilitate premium settlements through dollar-backed digital tokens.
Coinbase Global, Inc., COIN
This experiment showcased the potential for stablecoins to accelerate corporate payment workflows while minimizing delays inherent in conventional banking infrastructure. The trial leveraged blockchain technology that creates transparent transaction records and completes fund transfers in minutes rather than multiple business days. This development illustrates how tokenized currency could progressively merge with mainstream financial frameworks and insurance workflows.
Conventional insurance premium processing typically involves multiple banking intermediaries before final settlement, particularly for international transactions among enterprise clients. Distributed ledger payments streamline this workflow by enabling peer-to-peer value transfer without protracted clearing procedures. The experiment offered valuable operational data on modernizing premium payment infrastructure through digital assets.
USD Coin on Ethereum Network Processes Corporate Insurance Payment
The trial employed USD Coin to execute an insurance premium transaction via the Ethereum blockchain. Coinbase facilitated the payment on behalf of an Aon customer while Paxos contributed to the overall testing framework. This transaction examined how distributed ledger technology manages corporate insurance financial obligations.
Stablecoins preserve value through fiat currency backing, providing stable pricing for substantial institutional transactions. Furthermore, blockchain settlement generates permanent payment records, streamlining audit and reconciliation workflows for corporate finance teams. Organizations can therefore determine whether distributed ledger settlement minimizes operational overhead in insurance payment processing.
The trial also mirrored increasing regulatory definition around stablecoins within American financial markets. Enactment of the GENIUS Act established federal supervision requirements for token issuers and reserve disclosure standards. Major corporations now explore stablecoins within compliant regulatory parameters.
PayPal USD on Solana Network Demonstrates Alternative Blockchain Payment Path
An additional premium transaction utilized PayPal USD via the Solana blockchain as part of the identical pilot program. Paxos facilitated this payment while Aon executed the transfer within its insurance distribution infrastructure. This approach enabled performance comparison across different stablecoin ecosystems.
Stablecoin transactions deliver near-real-time settlement versus conventional banking networks that frequently require multiple days for international fund clearing. Distributed ledger systems provide transaction transparency, enabling organizations to monitor payments and verify settlement promptly. Enterprises can evaluate operational performance gains from tokenized payment systems.
Aon administers risk management and insurance solutions spanning over 120 nations while consulting on trillions in worldwide assets. The brokerage firm’s blockchain experiment therefore indicates expanding institutional appetite for distributed ledger payment infrastructure in corporate treasury functions. This pilot generates practical implementation insights that may influence future deployment strategies throughout insurance sectors and major financial organizations.

Toobit, the popular and award-winning international cryptocurrency exchange, announced a 200,000 USDT campaign, which will be focused on its integrated TradFi markets.
The move follows a recent expansion of the firm’s TradFi offerings, which enabled the direct trading of assets such as gold and global indices within a unified interface.
The 200,000 USDT Initiative
To further facilitate this campaign, Toobit has implemented a reduced fee tier which works for all eligible TradFi futures pairs. The maker fees are set at 0.01%, while the taker fees are set at 0.03%. This is supported by a protection fund for first trades worth 50,000 USDT, which covers between 2% and 100% of the losses (capped at 100 USDT).
The fund is designed to help traders buffer while navigating the global asset classes for the very first time.
The 200,000 USDT prize pool is distributed across four activity tiers:
- New trader milestones: 50,000 USDT for the first 5,000 traders who meet minimum volume requirements (3,000 USDT for Futures or 500 USDT for Spot).
- Downside protection: 50,000 USDT dedicated to the first-trade loss reimbursement program.
- Futures trading challenge: A 50,000 pool USDT for top-ranked futures traders, with participation rewards starting at a 10,000 USDT volume threshold.
- Spot trading challenge: A 50,000 USDT pool for spot traders, featuring a leaderboard and volume-based rewards for participants reaching 3,000 USDT in volume.
Commenting on the matter was the Chief Communication Officer at Toobit, Mile Williams, who said:
“As the TradFi sector matures, providing accessible entry points into traditional markets is a priority. […] These fee incentives and the 50,000 USDT protection fund provide a lower barrier for traders looking to explore multi-asset diversification directly from their existing Toobit accounts.”
The campaign will conclude on March 30, 2026. To be eligible for rewards, traders must register on the campaign page. For a comprehensive breakdown of terms and conditions, please refer to the details available on the Toobit announcement page.
The Rise of TradFi in Crypto
The first few months of this year saw a considerable shift in the integration of digital and traditional finance. At the time of this writing, the total volume of on-chain real-world assets (RWAs) has already surpassed $25 billion, and tokenized commodities have reached a market cap of more than $7.32 billion.
This represents an increase of more than 300% in the past 12 months.
This particular expansion has mainly been driven by a rotation toward transparent, asset-backed structures. Tokenized gold now ranks as the world’s second-largest gold investment product by trading volume, trailing only the GLD ETF.
For more information about Toobit, visit: Website | X | Telegram | LinkedIn | Discord | Instagram
Binance Free $600 (CryptoPotato Exclusive): Use this link to register a new account and receive $600 exclusive welcome offer on Binance (full details).
LIMITED OFFER for CryptoPotato readers at Bybit: Use this link to register and open a $500 FREE position on any coin!
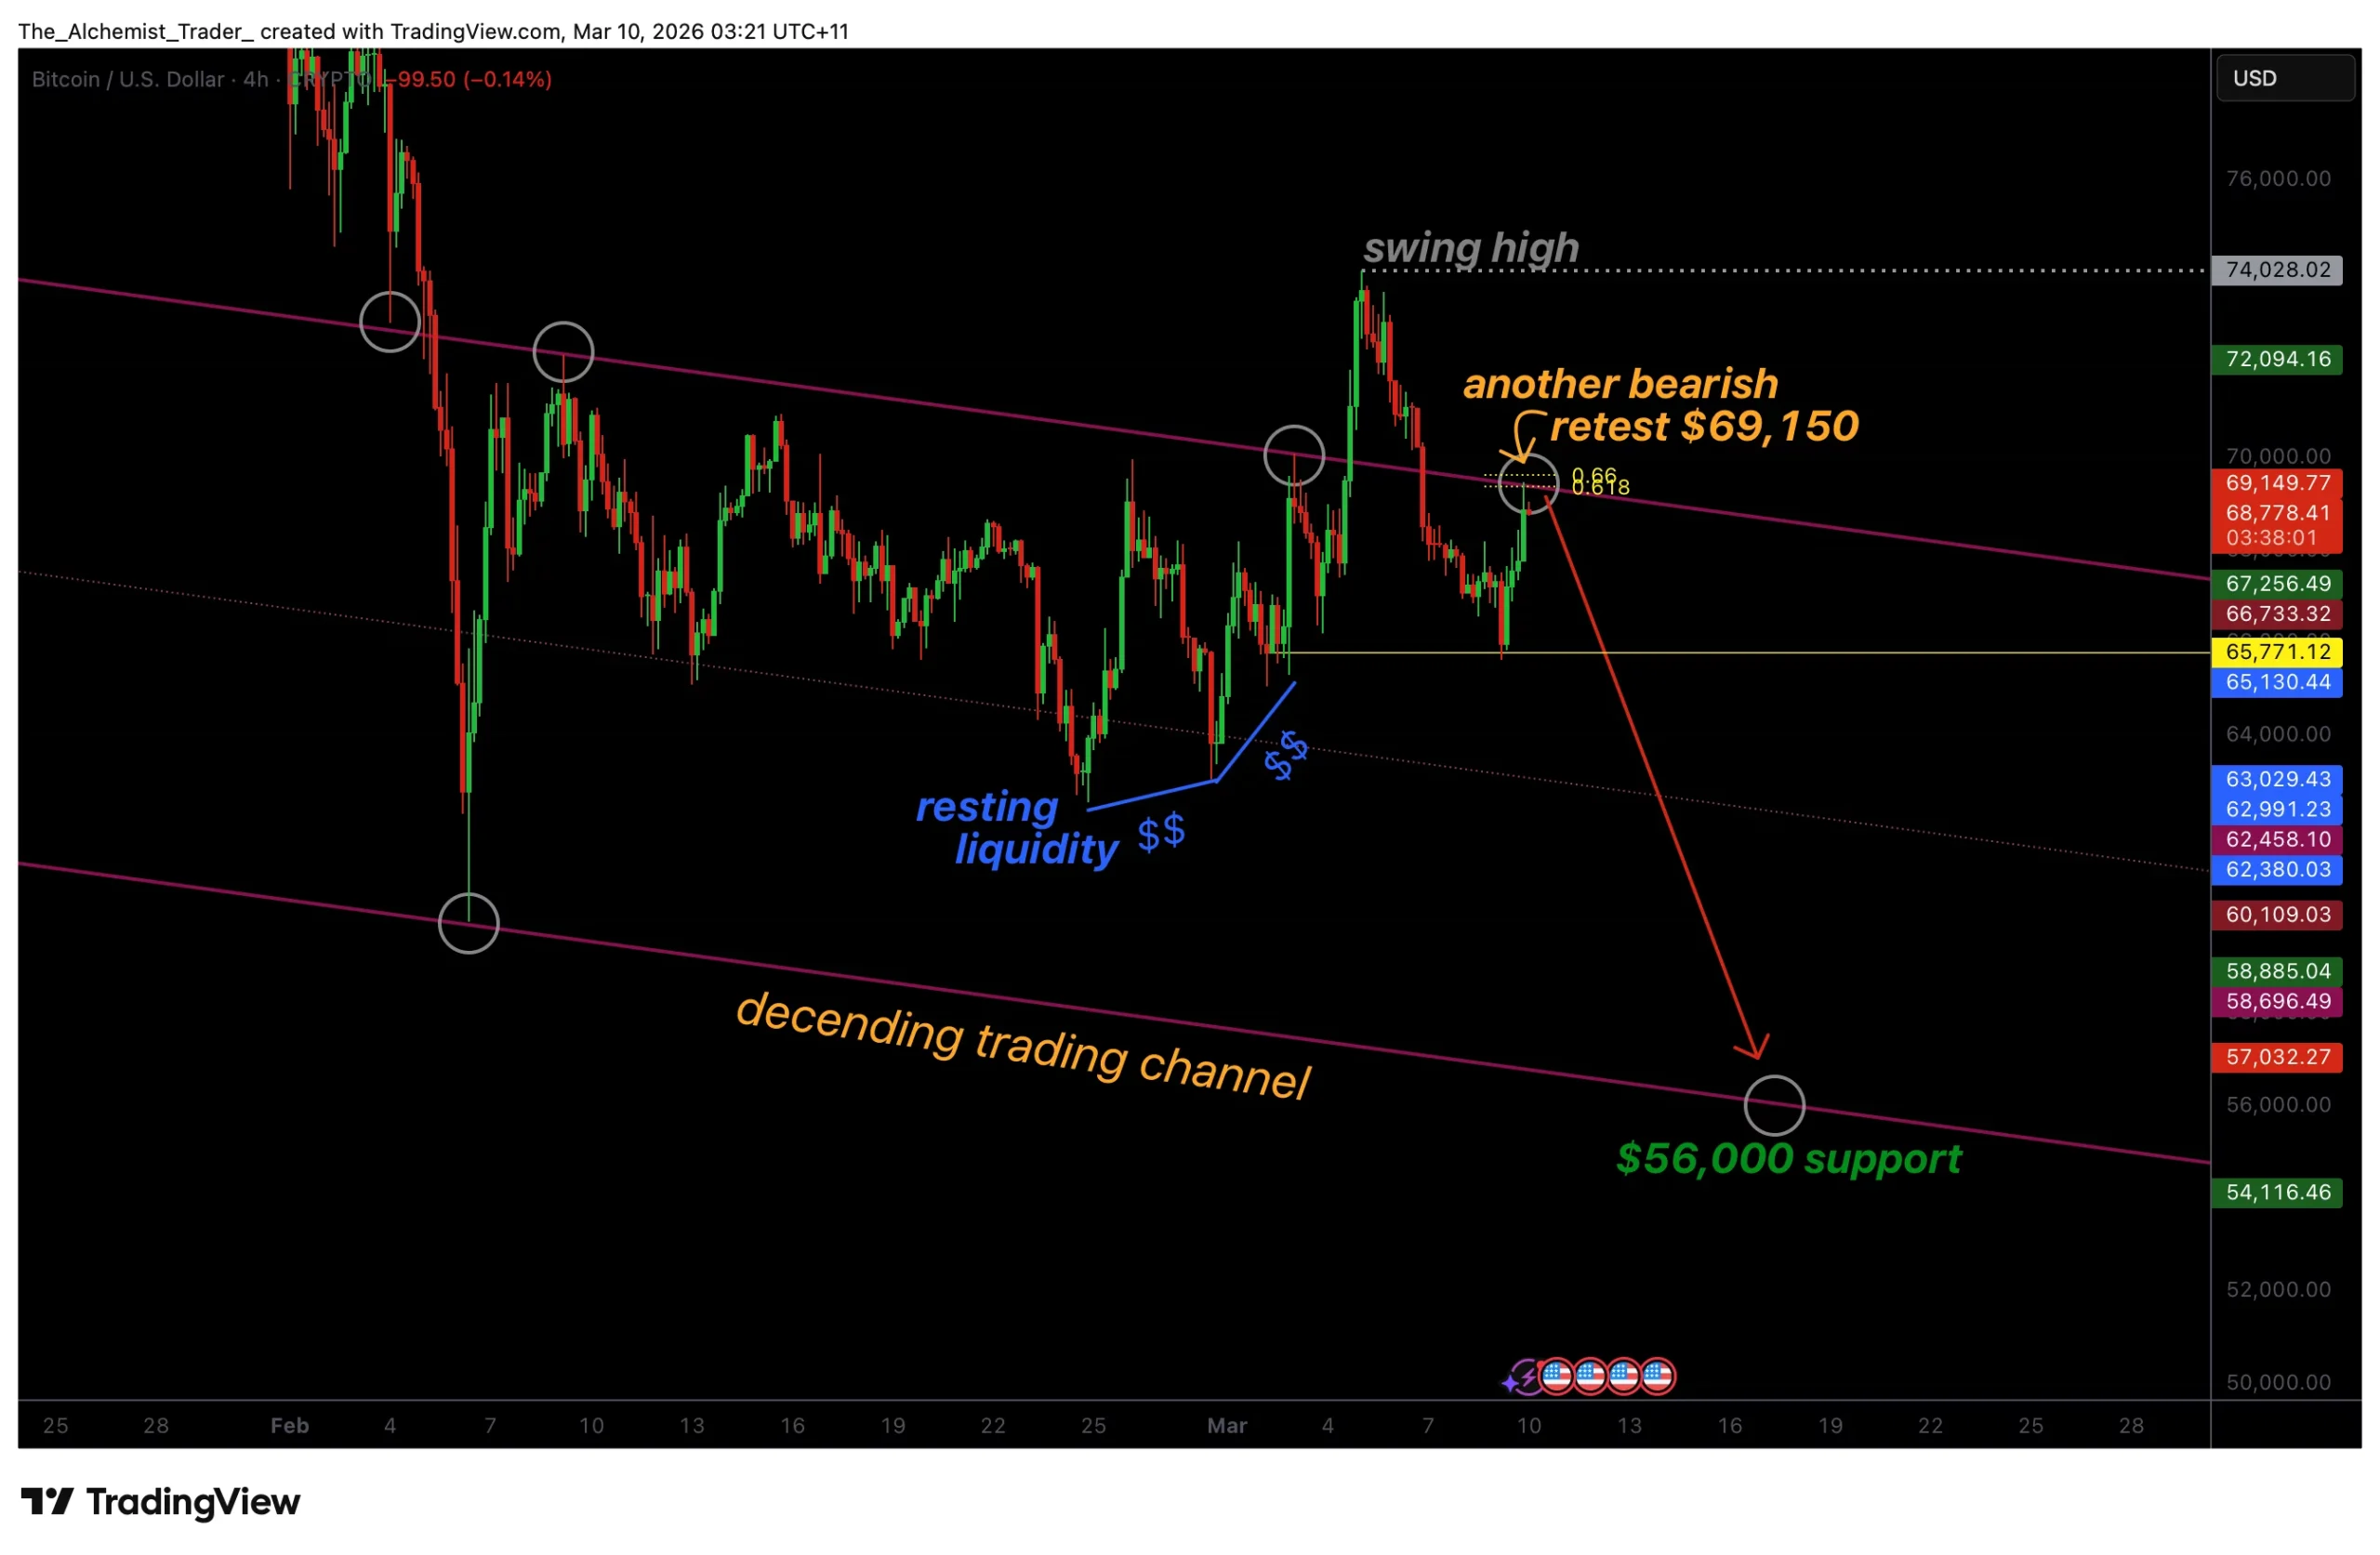
Bitcoin price rallies into channel resistance near $69,150. A rejection here could signal a bull trap and open the door for a rotation toward lower support near $56,000.
Summary
- Key Resistance: Bitcoin testing descending channel resistance near $69,150.
- Bull Trap Risk: Failure to break higher could confirm a bearish retest.
- Downside Target: Potential rotation toward $56,000–$58,000 support if rejection occurs.
Bitcoin (BTC) price action is currently approaching a critical resistance level that may determine the next major move in the market. After a recent recovery rally, BTC is now testing the upper boundary of a descending trading channel, a level that has historically rejected price on multiple previous attempts.
While the short-term rally may appear bullish, the broader technical structure suggests that the move could be setting up a potential bull trap if resistance continues to hold.
Bitcoin price key technical points
- Channel Resistance: Bitcoin is testing the descending channel resistance near $69,150.
- Deviation Confirmed: The recent swing high above the range was invalidated after price re-entered the trading range.
- Downside Target: A confirmed rejection could lead to a rotation toward $56,000–$58,000 support.
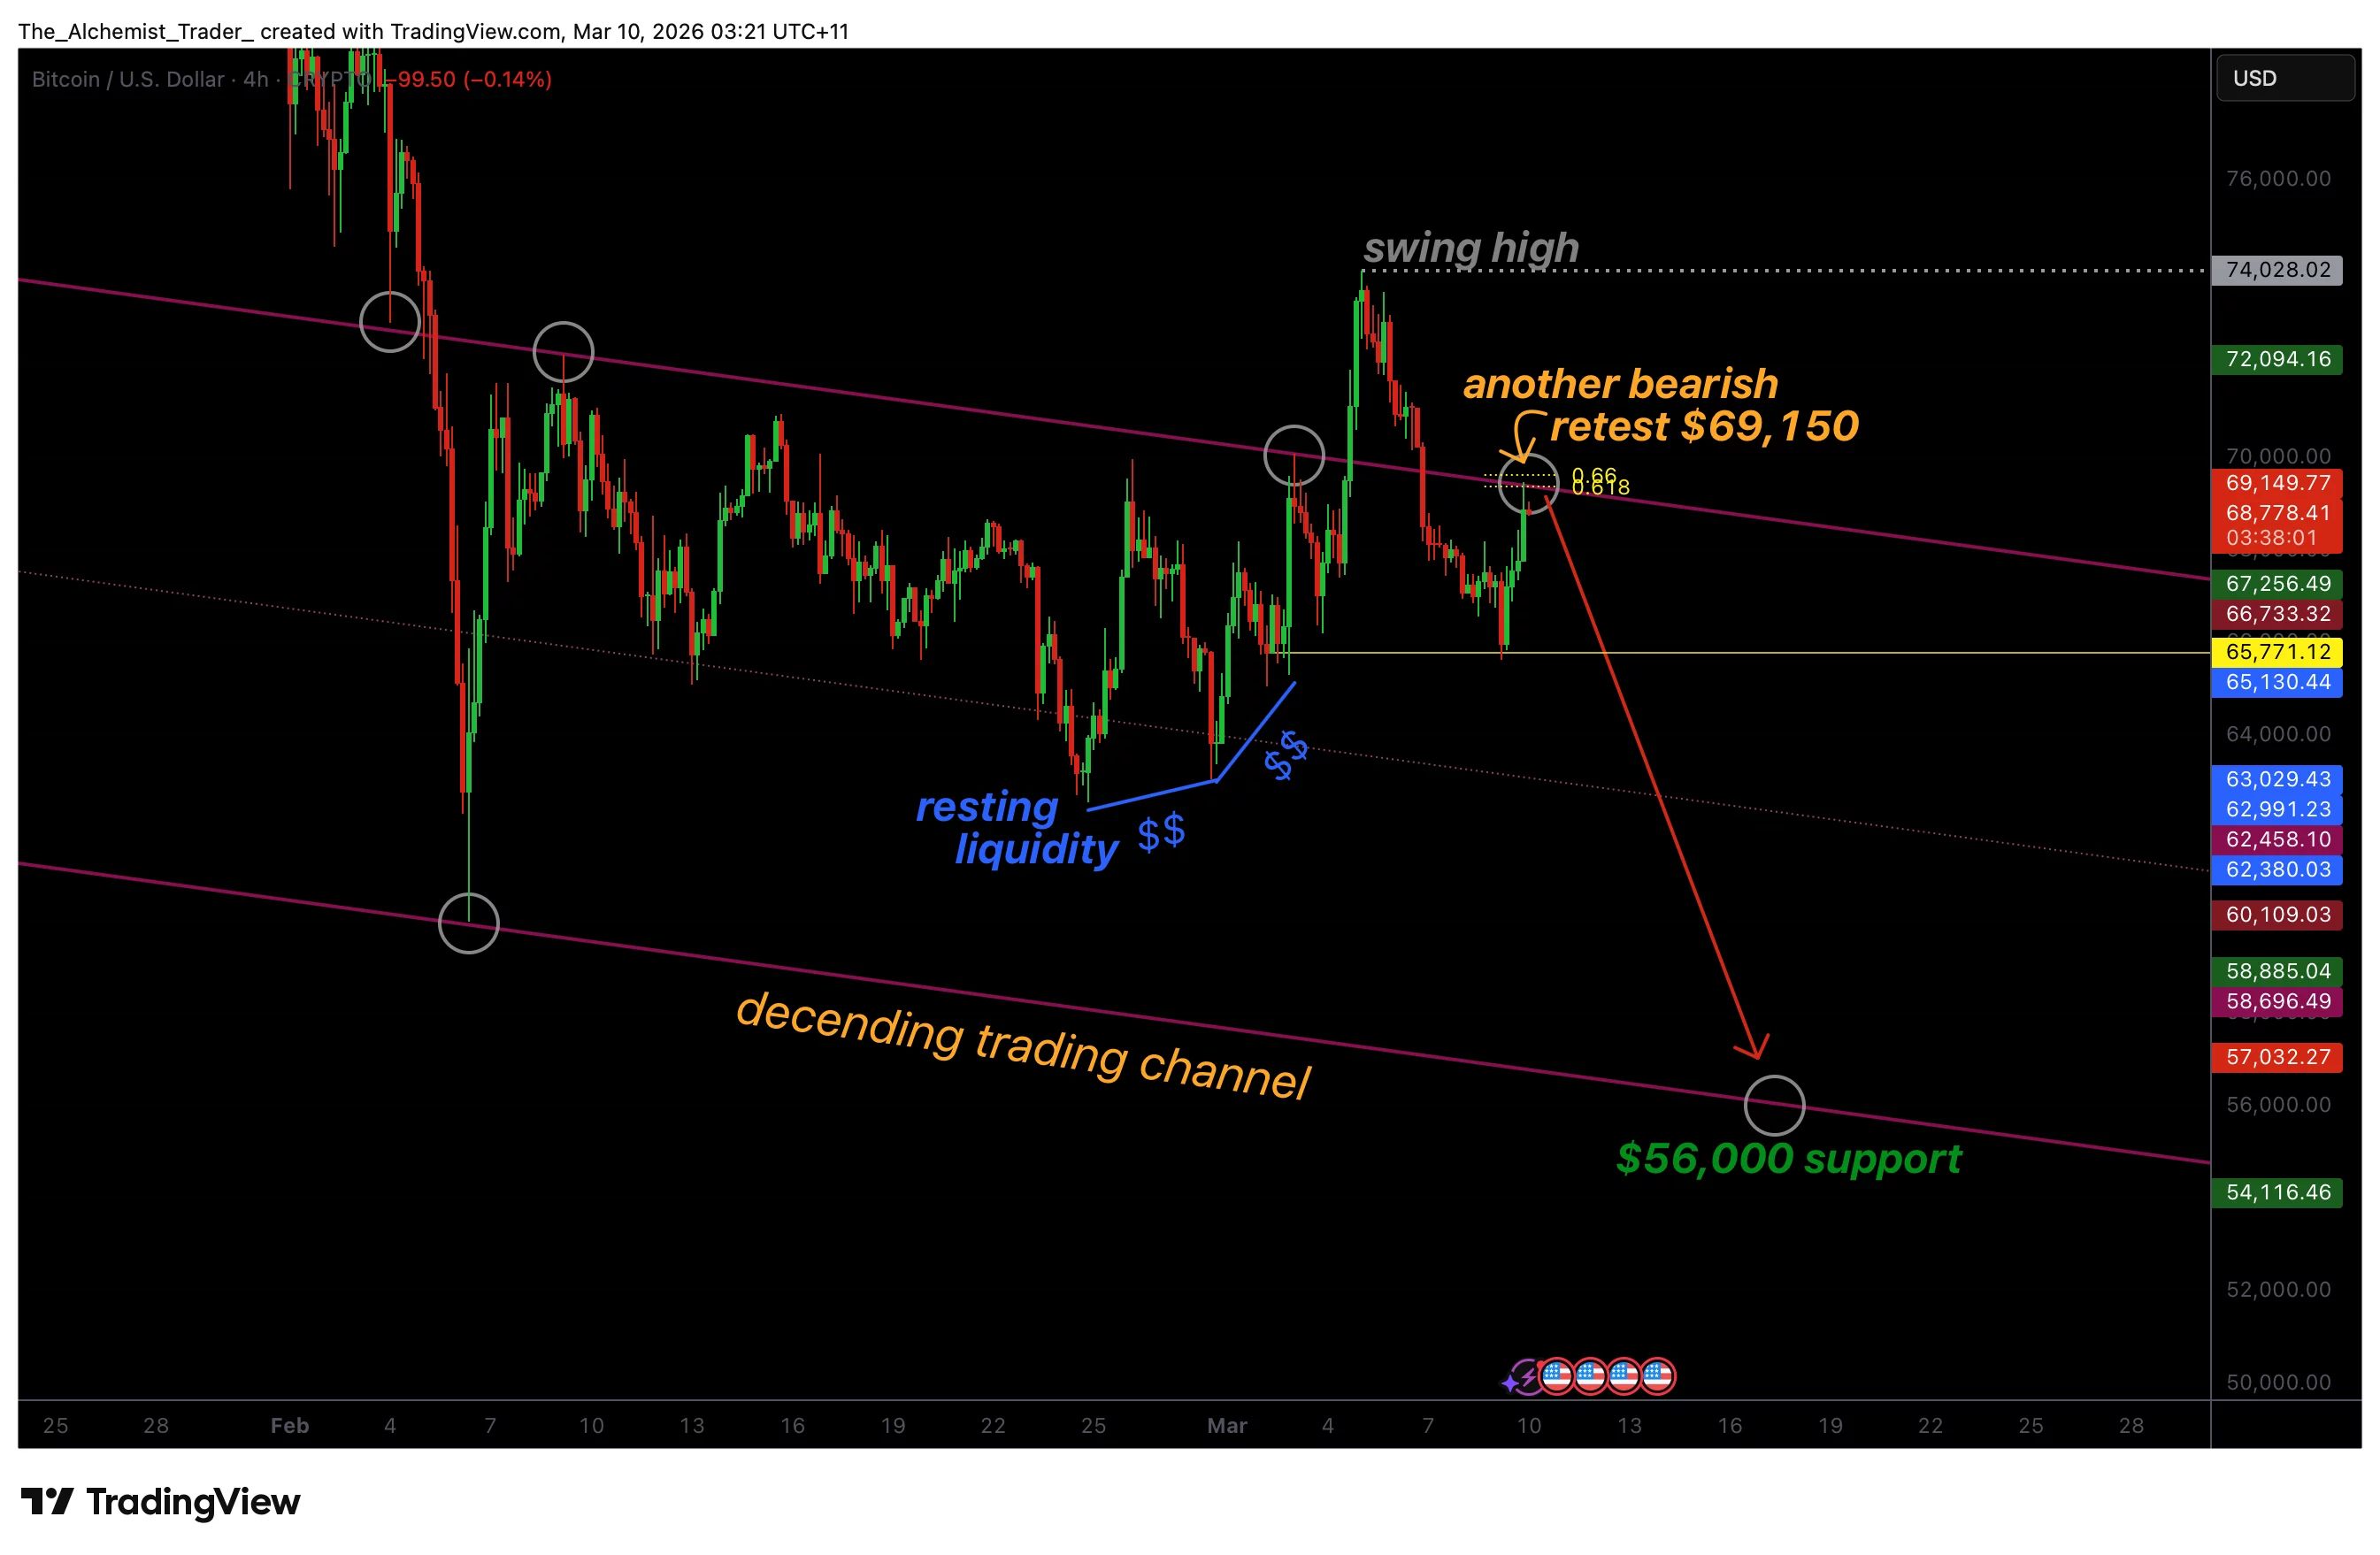
Bitcoin’s current rally has brought price back toward a key technical resistance within the descending channel structure. This channel has guided price action for several weeks, with the upper boundary acting as a consistent rejection zone. Each time Bitcoin approaches this region, sellers tend to step in, preventing price from establishing a sustained breakout.
The most recent swing high is particularly important in understanding the current market structure. That move initially appeared to signal bullish continuation, but the subsequent return back into the range revealed that the breakout lacked strength. In technical terms, this type of move is often referred to as a range deviation, where price temporarily breaks a key level before quickly reversing back into the prior trading environment.
With price now returning to test resistance near $69,150, the market may be forming a bearish retest of the same level that previously rejected price. Bearish retests occur when price rallies back into a resistance zone after failing to hold above it. If sellers defend this level again, it would reinforce the descending channel structure and increase the likelihood of another move lower.
This comes as Bitcoin has also surpassed 20 million mined coins, reinforcing its scarcity as macro volatility, lost BTC, and the network’s shift toward fee-driven security continue shaping its long-term future.
From a liquidity perspective, the market tends to move toward areas where stop orders and resting liquidity are concentrated. Currently, a large portion of this liquidity sits below the current price action. This includes liquidity pools that formed during previous consolidation phases, particularly around the lower boundary of the trading range.
Because of this liquidity imbalance, the probability of a downside rotation increases if resistance continues to hold. Markets frequently move toward these liquidity zones as they provide the necessary volume for larger participants to execute trades.
In Bitcoin’s case, this means the path of least resistance could potentially remain lower if buyers fail to push price above the channel resistance. This also comes as oil prices surging more than 60% this year amid rising tensions around the Strait of Hormuz, adding macro pressure to risk assets.
Another factor reinforcing the bearish scenario is the broader market structure within the descending channel. As long as price remains contained within this structure, rallies toward the upper boundary are typically considered corrective moves rather than trend reversals.
Without a decisive breakout above the channel resistance, the dominant trend remains neutral to bearish in the short term.
What to expect in the coming price action
Bitcoin is currently at a decisive technical level as price tests channel resistance near $69,150. If sellers reject this level once again, the probability increases for a rotation toward the lower support region between $56,000 and $58,000.
However, a sustained breakout above channel resistance would invalidate the bearish scenario and could shift momentum back in favor of the bulls.

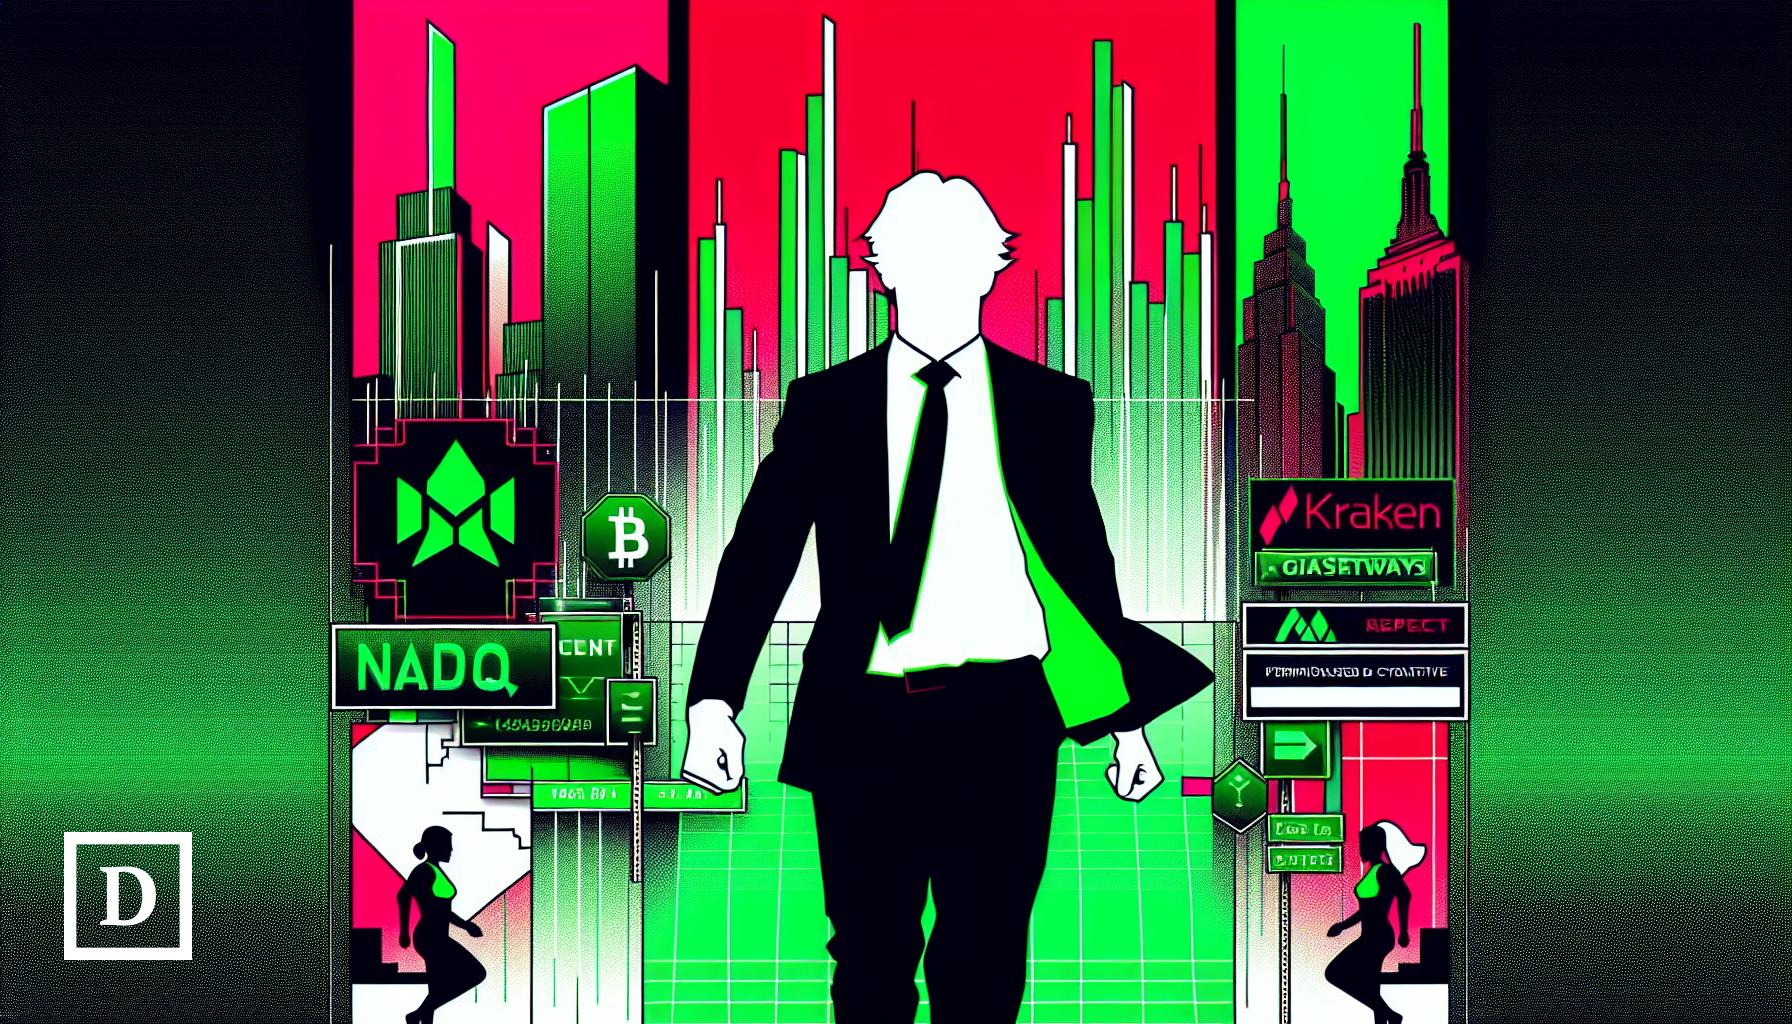
Nasdaq revealed its new equity token design, emphasizing issuer control and bridging traditional financial markets with decentralized blockchain networks.
Nasdaq and Kraken announced a partnership as part of Nasdaq’s tokenized equity initiative, aimed at integrating traditional capital markets with decentralized finance.
Per announcements from Kraken and Nasdaq today, March 9, the traditional brokerage giant will collaborate with Payward, Kraken’s parent company, to develop gateway that connects permissioned and permissionless tokenized equities markets. The partnership involves connecting Nasdaq’s infrastructure with xStocks, the tokenization platform originally developed by Kraken and Backed.
The partnership was announced as part of Nasdaq’s initiative to launch its new equity token design, which it says prioritizes giving public companies “more control over their shares in tokenized form.”
Per Kraken’s announcement, Payward will provide compliance services, such as know your customer (KYC) and anti-money laundering (AML), for onboarding clients. The firm will also serve as the primary settlement layer for Nasdaq’s equity token design transactions in eligible jurisdictions — namely, where xStocks are available, which does not include the United States.
“With xStocks, our goal is to make equities natively interoperable across trading venues, financial applications and blockchain networks while preserving issuer rights regulatory protections and price integrity.,” Kraken and Payward’s co-CEO, Arjun Sethi, said in the announcement.
The firms said the goal of the collaboration is to let eligible participants trade tokenized stocks “between a regulated, permissioned market environment and the permissionless DeFi ecosystem.”
Nasdaq president Tal Cohen said in a statement:
“Tokenization has the potential to unlock the benefits of an always-on financial ecosystem – enhancing how investors access markets, how issuers engage with shareholders.”
This development follows Kraken’s recent moves in tokenized equity and TradFi. Just last week, the centralized exchange announced that xStocks is launching a cross-chain trading platform on Ethereum and Solana. Meanwhile, the firm’s state-regulated banking arm received a limited purpose Federal Reserve master account.
Nasdaq first filed with the U.S. Securities and Exchange Commission to launched tokenized equities back in September, as The Defiant reported.
This article was generated with the assistance of AI workflows.
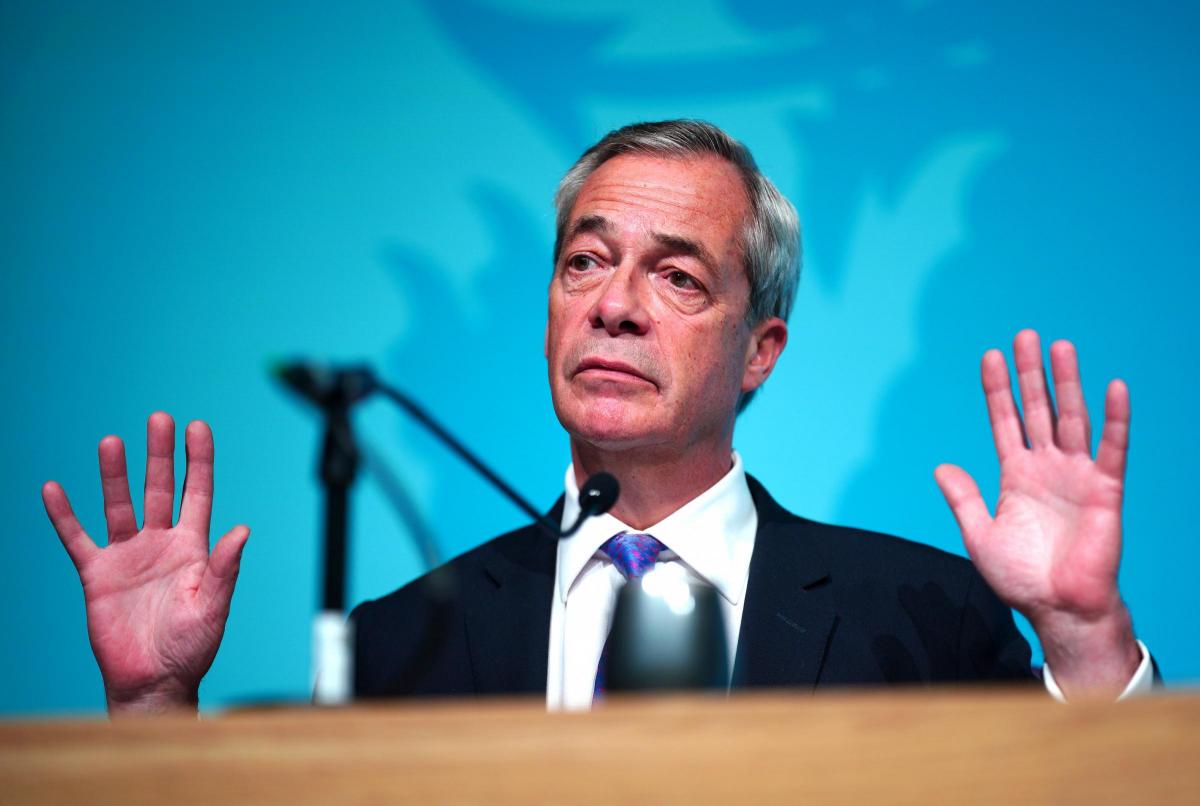

Stack BTC Plc has raised $347,204 from several entities, including Nigel Farage, leader of the Reform UK party, and Blockchain.com.
The fundraising was carried out through the issuance of 5,200,000 new ordinary shares at 5 pence per unit, with plans to use the proceeds to buy and grow UK businesses, build a Bitcoin (BTC) treasury, and fund general working capital.
Stack’s BTC Fundraise
A March 9 press release shows that Farage’s financing was made as a show of his long-standing support for British businesses and advocacy for BTC. Throughout his career, the politician has championed local independent companies and talked about his belief in the OG cryptocurrency’s potential as a financial asset and digital currency.
“London and the UK have historically been the center of the world’s financial markets, and I believe we can and should be a major global hub for the crypto industry,” said Farage in the press release.
He also mentions the importance of UK SMEs, which provide jobs to about 60% of the private sector workforce, adding that Stack’s approach of acquiring and growing businesses is a strategy for long-term capital and support.
Blockchain.com will be providing institutional-grade services to support Stack’s BTC stockpile plan on top of its investment. The firm was officially registered under the UK Financial Conduct Authority (FCA) on February 10, 2026, a development that allows it to legally operate as a crypto asset business in the region.
Kwasi Kwarteng, Stack’s Executive Chairman and former UK Chancellor, welcomed the two as investors, saying the partnership aligns closely with the company’s goals.
“Nigel’s unwavering support for British business and belief that Bitcoin is set to rapidly expand its role in finance is perfectly aligned with the company’s ethos and business plans,” he wrote.
He added that the crypto service provider’s infrastructure will help ensure the firm maintains the highest standards of custody services for its BTC treasury.
Shares To Begin Trading in March
The new shares will be available for trading on the Aquis Growth Market from 12 March 2026, with investors also receiving warrants that can be exercised once certain conditions have been met in the future.
Stack will now have 68,130,000 ordinary shares in circulation, each carrying one voting right. Of the total issued share capital, the company’s existing concert party now collectively accounts for 45.21%.
Farage currently controls 4,300,000 shares (6.31%), while Kwarteng holds 3,700,000 shares (5.43%), with the remaining units distributed among other directors and parties.
Stack announced earlier in March that it would begin operating as a BTC treasury company, with plans to start its reserves with a 21 BTC purchase. The firm intends to fund this future stockpile through equity issuance, acquisitions, and operating profits.
The company will now join established players in the UK BTC treasury space, including the Smarter Web Company and Satsuma Technology, which respectively hold 2,692 BTC and 620 BTC, per data from BitcoinTreasuries.
The post Nigel Farage Invests in UK Bitcoin Firm Led by Former Chancellor Kwasi Kwarteng appeared first on CryptoPotato.

The gambling industry respects history. A brand that has survived decades of regulation changes, technological shifts, and market upheaval earns a certain kind of credibility that cannot be bought or manufactured. William Hill has that credibility in abundance. But 2026 is testing whether credibility alone is enough when a new generation of platforms is rewriting the rules around game selection, payment speed, and player rewards. ZunaBet represents that new generation, and putting it alongside William Hill highlights just how much distance has opened up between the traditional model and what comes after it.
William Hill: Heritage as a Foundation
William Hill has been part of the gambling landscape since 1934. What started as a UK bookmaking operation has grown into a global brand with an online presence spanning multiple markets. The acquisition by Caesars Entertainment in 2021 reshaped parts of the business, particularly in the United States where it now operates under the Caesars Sportsbook name in several states. In the UK and other international markets, the William Hill name endures as one of the most recognized in the industry.
The sportsbook reflects that long history. Horse racing coverage runs deep, a natural strength for a brand with British bookmaking roots. Football, tennis, basketball, cricket, rugby, golf, and numerous secondary sports are all available with respectable market depth. Live in-play betting keeps pace with modern expectations, offering updated odds across major events. The sports betting product is mature and well-constructed, built through decades of refinement rather than a single launch cycle.
The online casino sits alongside the sportsbook with a modest but functional game library. Slots, table games, and live dealer options from established providers cover the standard categories. Total game counts vary by market but generally land in the range of several hundred to a couple of thousand. It is a competent casino that meets basic expectations without pushing boundaries on scale or variety.
William Hill handles payments through familiar traditional methods. Debit cards, bank transfers, PayPal, Skrill, Neteller, and other conventional options are available depending on the market. Withdrawals follow standard banking timelines — faster for e-wallets, slower for bank-based methods, and occasionally complicated by cross-border processing for international users. It is the same infrastructure the industry has relied on for years.
Loyalty at William Hill depends on the market. UK players have historically had access to the William Hill Plus Card and various promotional offers. Free bets, enhanced odds, and occasional bonuses make up the reward structure. The approach is promotion-driven rather than tier-based, meaning what a player receives back fluctuates with whatever campaigns happen to be live at any given time.
ZunaBet: No Legacy, No Limitations
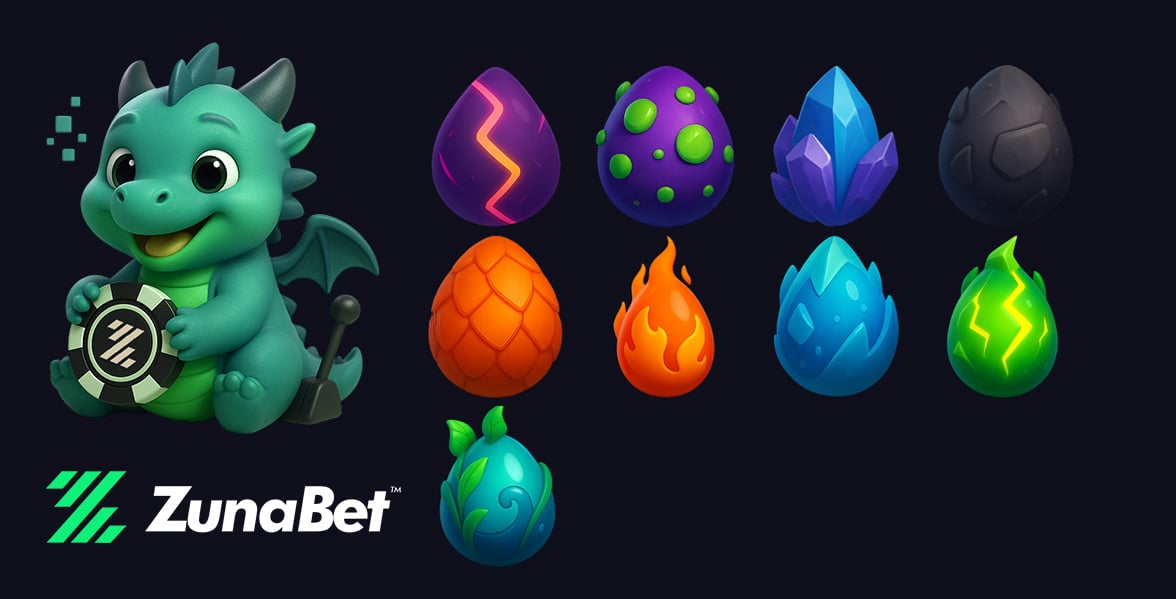
ZunaBet arrived in 2026 under Strathvale Group Ltd with an Anjouan gaming license and a team that collectively brings more than 20 years of gambling industry experience. That experience informed the build, but it did not constrain it. Instead of iterating on traditional platforms, the team constructed ZunaBet around cryptocurrency as its core operating layer. The result is a platform that shares very little DNA with legacy operators.
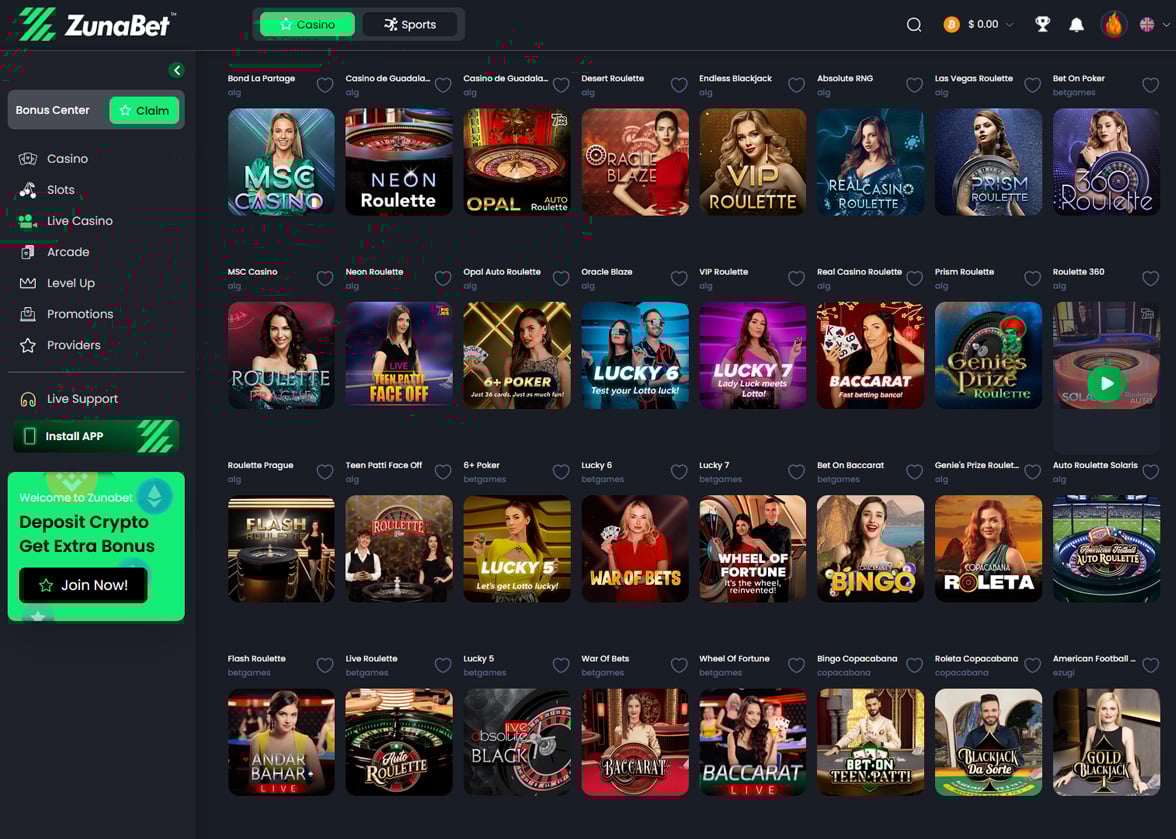
Game selection tells the story fastest. ZunaBet carries 11,294 titles across 63 providers. Pragmatic Play, Evolution, Hacksaw Gaming, Yggdrasil, and BGaming anchor the top of the list, while dozens of additional studios push the variety well beyond what most players encounter on any single platform. Slots dominate the numbers, but live dealer rooms and RNG table games receive enough attention that casino players of all preferences find genuine depth. Stacking this catalog against what most traditional operators offer reveals a gap measured not in percentages but in multiples.
The sportsbook was designed as a full product from the outset. Football, basketball, tennis, hockey, and other mainstream sports get thorough coverage. Esports betting runs as a built-in category rather than a supplementary afterthought, with dedicated markets on CS2, Dota 2, League of Legends, and Valorant. Virtual sports and combat sports complete an offering that serves both traditional bettors and a younger audience whose sporting interests extend well into the digital arena.
Payments are crypto only. Over 20 coins are accepted — BTC, ETH, USDT on multiple chains, SOL, DOGE, ADA, XRP, and others. ZunaBet takes no processing fees. Withdrawals happen through the blockchain without bank interaction, without variable timelines, and without the geographic inconsistencies that plague traditional payment setups. A player anywhere in the world gets the same fast, fee-free experience.
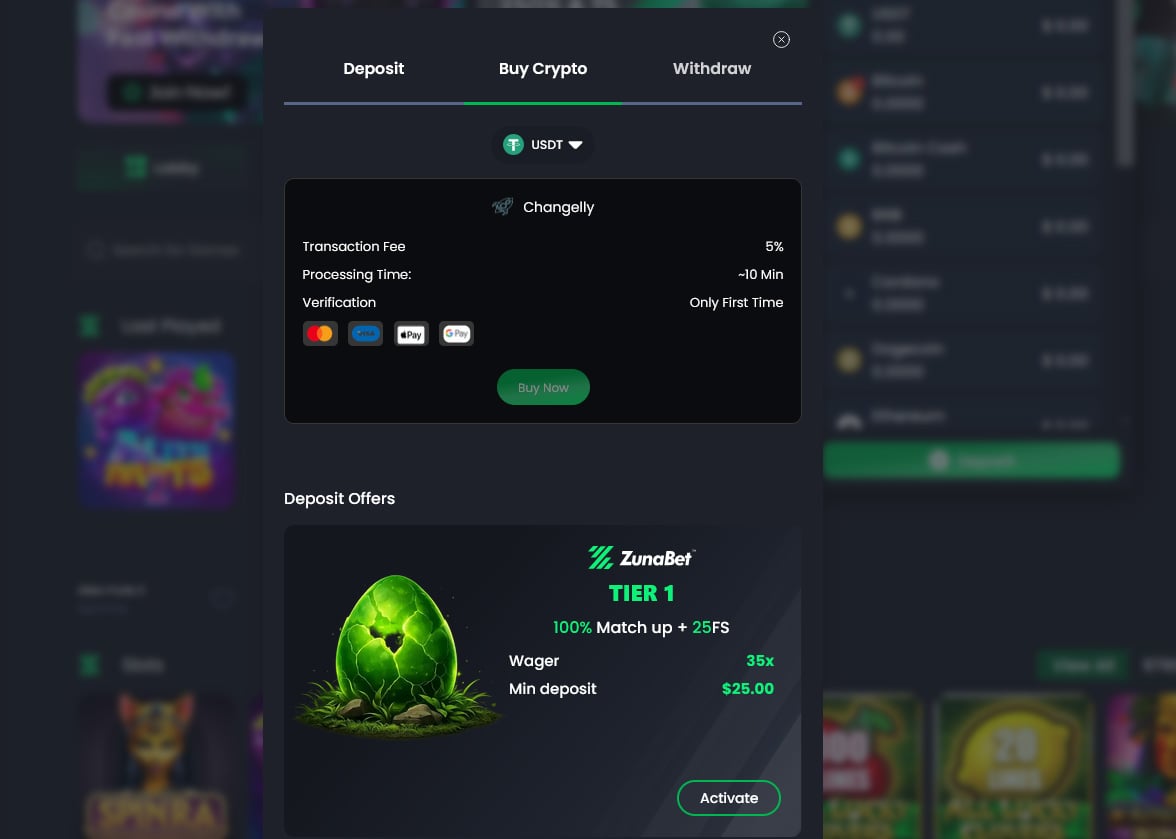
New players receive up to $5,000 plus 75 free spins through a welcome offer split across three deposits. The first deposit earns 100% up to $2,000 and 25 spins. The second earns 50% up to $1,500 and 25 spins. The third earns 100% up to $1,500 and 25 spins. Distributing the bonus across three stages keeps the platform rewarding players well into their early weeks rather than front-loading everything into a single moment.
Native apps cover iOS, Android, Windows, and MacOS. A dark-themed responsive design delivers fast load times across devices, and live chat support stays available 24/7.
What Loyalty Actually Looks Like on Each Platform
Strip the branding away and loyalty comes down to a simple question — what does your regular play actually earn you? William Hill and ZunaBet give very different answers.
William Hill distributes value through periodic promotions. A free bet might appear before a major horse racing event. Enhanced odds might run during a football derby weekend. A deposit match could surface around a quiet midweek period. These offers have value when they show up, but they arrive on the platform’s schedule and vary based on which market you are in. Players cannot look at their activity from the past month and calculate a precise return because no fixed system exists to deliver one.
ZunaBet removes the guesswork entirely. Its dragon evolution loyalty program tracks players across six tiers — Squire at 1% rakeback, Warden at 2%, Champion at 4%, Divine at 5%, Knight at 10%, and Ultimate at 20%. A dragon mascot called Zuno evolves as players move up. Upper tiers unlock extras like up to 1,000 free spins, VIP club access, and double wheel spins.
The rakeback model gives regular players something promotional systems cannot — consistency. Every session, every wager, every week generates a return at a known rate. A player sitting at 15% or 20% rakeback does not need to check a promotions page to know what they are earning. That predictability compounds into serious value over time, and it is one of the main reasons players who try rakeback-based systems rarely want to go back to traditional promotional models.
Getting Paid: Days vs Minutes
Every online gambler has a withdrawal story. Waiting days for funds to clear, wondering whether verification is holding things up, checking bank balances repeatedly. This is the reality of traditional payment infrastructure, and William Hill operates within it just like every other legacy operator. E-wallets offer some relief with faster processing, but card and bank withdrawals still land in the one-to-five business day range. International players may face additional friction through currency conversion and cross-border processing fees.

ZunaBet does not participate in any of that. Withdrawals go out on-chain. No banks are involved. No business day schedules apply. No platform fees are charged. Whether you cash out on a Monday morning or a Saturday night, the process is the same. Whether you are in Nairobi or New York, the speed is the same. Crypto infrastructure does not differentiate between geographies or time zones, which gives ZunaBet a payment experience that is structurally faster and simpler than anything built on traditional rails.
Once a player gets used to instant crypto withdrawals with zero fees, the idea of waiting three to five business days for a bank transfer feels like a relic of a different era. That shift in expectation is happening across the international gambling market in real time.
Where History Meets the Future
William Hill has survived world wars, regulatory overhauls, the transition from retail to digital, and a corporate acquisition. That resilience deserves respect. The brand carries weight, the sportsbook remains competitive, and the trust built over nine decades has genuine value for players who prioritize tradition and established regulatory standing.
But the market William Hill operates in looks very different in 2026 than it did even five years ago. Players who have grown up with crypto wallets see no reason to wait days for a withdrawal. Players accustomed to streaming libraries with thousands of options expect the same scale from their casino. Players who understand percentages prefer knowing their exact rakeback rate over hoping a useful promotion appears at the right time.
ZunaBet was built for exactly these players. Over 11,000 games from 63 providers. Rakeback scaling to 20% through a transparent tier system. A sportsbook that treats esports with the same respect as traditional markets. Crypto payments that work identically for every player on earth without fees or delays. It is a platform that was not designed to compete with history — it was designed to make the case for what happens next.
William Hill wrote important chapters in the story of gambling. ZunaBet is writing the next one. For players choosing between heritage and momentum in 2026, that distinction is becoming the deciding factor.
Disclaimer: This is a Press Release provided by a third party who is responsible for the content. Please conduct your own research before taking any action based on the content.

Ethereum price consolidates near the point of control after rejecting $4,800 resistance. Market Auction Theory suggests a potential rotation toward $870, risking a drop below $1,000.
Summary
- Range Structure: Ethereum trades within a macro range between $4,800 resistance and $870 support.
- Current Level: Price consolidating near the point of control (POC).
- Downside Risk: Market Auction Theory favors rotation toward $870, risking a move below $1,000.
Ethereum (ETH) price is currently trading within a large macro trading range that has defined price behavior over an extended period. The upper boundary of this range sits near $4,800, while the lower boundary is positioned around $870.
This broad structure has acted as the framework for Ethereum’s price action as the market continues to rotate between areas of high and low value.
Ethereum price key technical points
- Range Structure: Ethereum continues to trade within a macro range between $4,800 resistance and $870 support.
- Point of Control: Price is currently consolidating around the POC, a major equilibrium level.
- Downside Target: Market Auction Theory suggests a potential rotation toward the $870 range low.
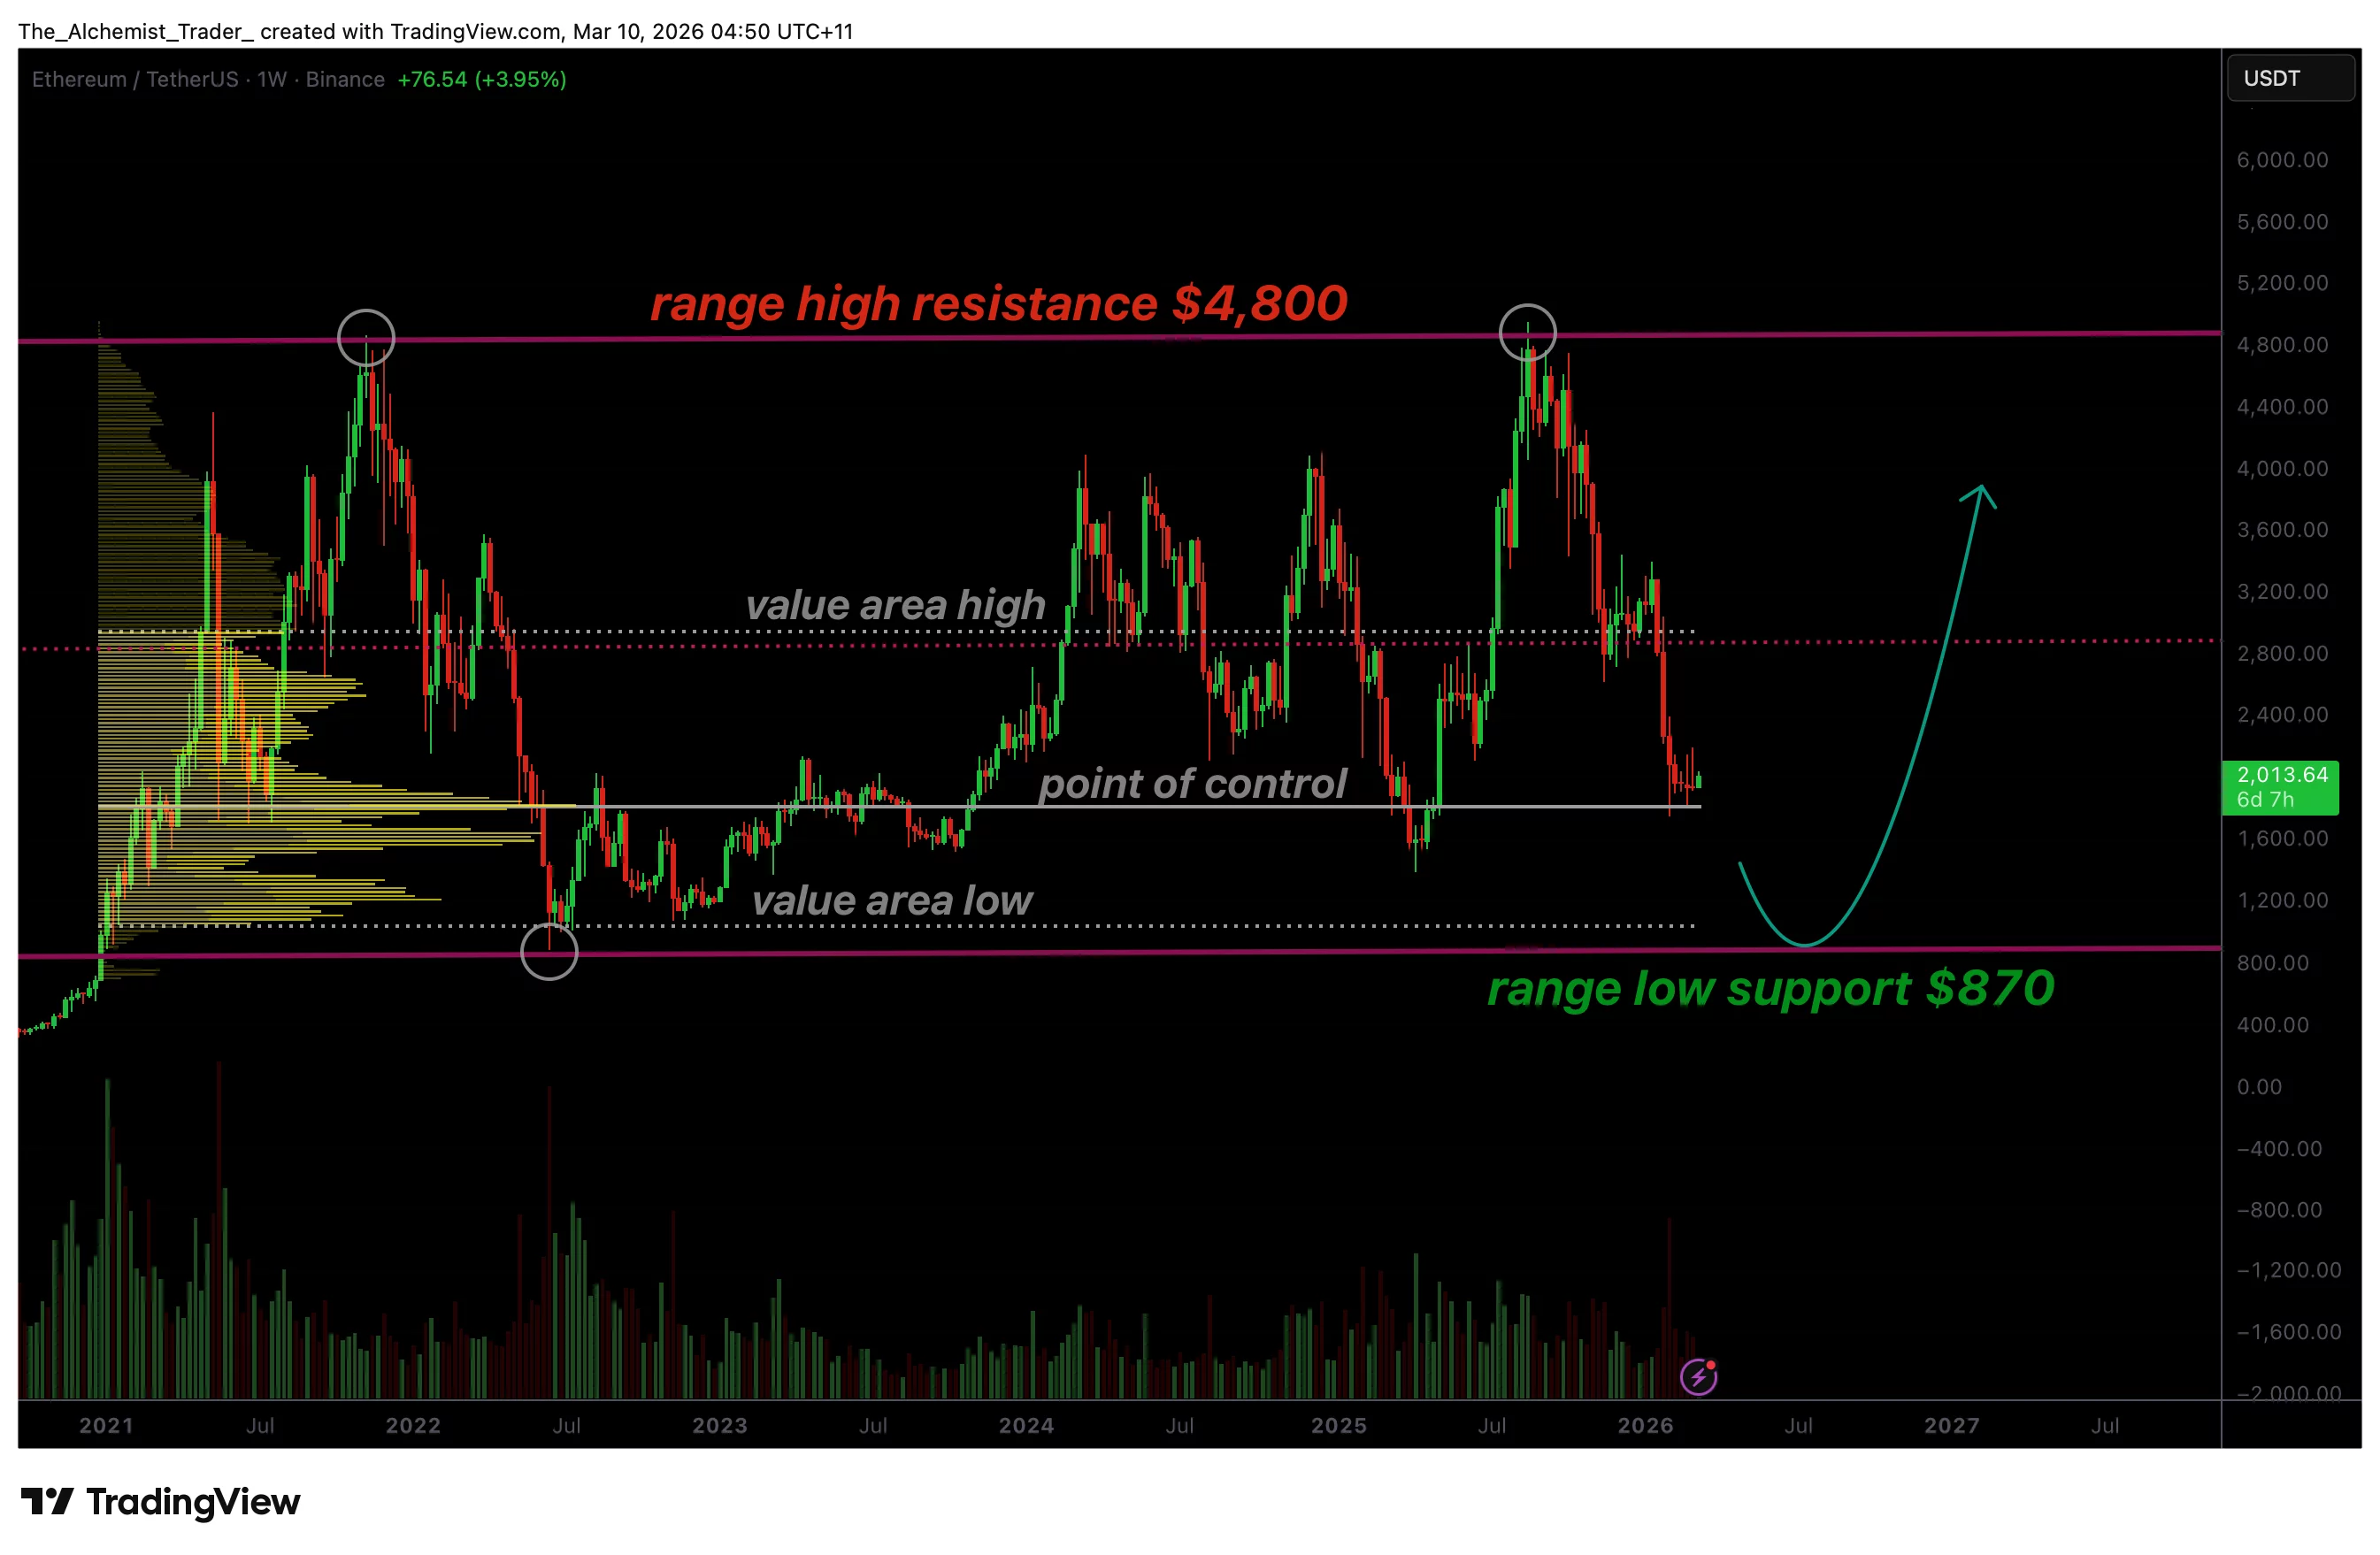
Ethereum’s rejection from the range high resistance near $4,800 marked a significant technical development for the broader market structure. Range highs often act as areas of heavy supply where sellers begin to step into the market. When price is unable to sustain acceptance above these levels, it typically signals that bullish momentum is weakening and that a corrective rotation may follow.
Following the rejection at resistance, Ethereum’s price rotated lower and has now returned to the point of control, which represents the area where the highest volume within the range has been traded. The POC often functions as a magnet for price during periods of consolidation because it reflects a fair value zone where both buyers and sellers previously agreed on price.
At the moment, Ethereum is attempting to hold above this level as the market enters a short-term consolidation phase. From a technical standpoint, it is common for price to temporarily stabilize around the POC before deciding on the next directional move. In many cases, this area can provide a short-term bounce or relief rally as buyers attempt to defend the equilibrium zone.
This comes as BMNR shares climbed over 4% on Monday, revisiting the key $20 resistance as Ethereum rebounded and the company continued accumulating, highlighting renewed interest in Ethereum-linked assets.
However, when analyzing the broader structure through the lens of Market Auction Theory, the larger directional bias may still favor further downside. This theory suggests that once price loses acceptance near the value area high, the market often seeks to rotate toward the value area low, where the next significant liquidity pool exists.
In Ethereum’s current structure, the value area high aligns closely with the previous rejection near $4,800, while the value area low sits near the range low around $870. If the auction process continues to develop in this direction, the market may gradually move lower as price searches for the next major area of value.
Such a move would place Ethereum below the psychological $1,000 level, which represents an important milestone for traders and investors. Psychological price levels often act as areas where market sentiment can shift quickly, particularly if broader bearish conditions remain intact.
However, rising institutional accumulation of Ethereum signals growing confidence in the asset and renewed momentum for the expansion of decentralized finance, which could influence long-term market sentiment despite short-term downside risks.
Another factor supporting the downside scenario is the broader macro market structure. Ethereum’s inability to sustain higher highs within the range suggests that bullish momentum remains limited. Until a strong structural breakout occurs, the dominant market behavior is likely to remain rotational rather than trending.
What to expect in the coming price action
Ethereum is currently holding near the point of control, where short-term consolidation or a temporary bounce may occur. However, the broader market structure remains bearish following the rejection at $4,800 resistance.
If Market Auction Theory continues to play out, price may gradually rotate toward the range low near $870, increasing the probability that Ethereum could trade below $1,000 in the coming weeks or months.

Ryobi RY18BLCXA-125 Review – Trusted Reviews
Prince Harry and Meghan Markle’s ‘turning point’ in relationship with royals

Goldman pitches hedge funds product to bet against corporate loans, source says

Smart energy pays enters the US market, targeting scalable financial infrastructure

Why Israel is blocking foreign journalists from entering

Bitcoin: We’re Entering The Most Dangerous Phase

Paid Off My Debt and Immediately Made This Mistake #debtfree #finance #relatable

The CRYPTO Bear Market Is ENDING. Here’s Why Both Sides Are Right

KB. Ganesh Kumar | KSRTC | Supreme Court of India questioned KSRTC financial crisis | CONGRESS | LDF
-

 Politics7 days ago
Alan Cumming Brands Baftas Ceremony A ‘Triggering S**tshow’
-
Business3 days ago
Form 8K Entergy Mississippi LLC For: 6 March
-

 Fashion3 days ago
Weekend Open Thread: Ann Taylor
-

 News Videos12 hours ago
10th Algebra | Financial Planning | Question Bank Solution | Board Exam 2026
-

 Crypto World8 hours ago
Paradigm, a16z, Winklevoss Capital, Balaji Srinivasan among investors in ZODL
-

 Tech5 days ago
Bitwarden adds support for passkey login on Windows 11
-
 Sports4 days ago
499 runs and 34 sixes later, India beat England to enter T20 World Cup final | Cricket News
-

 Sports2 days ago
Three share 2-shot lead entering final round in Hong Kong
-

 Sports2 days ago
Braveheart Lakshya downs Lai in epic battle to enter All England Open final | Other Sports News
-

 Business6 days ago
Guthrie Disappearance Enters Fifth Week as Family Visits Memorial
-

 NewsBeat4 days ago
Piccadilly Circus just unveiled ‘London’s newest tourist attraction’ and it only costs 80p to enter
-

 Politics4 days ago
Top Mamdani aide takes progressive project to the UK
-

 Business1 day ago
Search for Nancy Guthrie Enters 37th Day as FBI Probes Wi-Fi Jammer Theory
-

 Entertainment3 days ago
Hailey Bieber Poses For Sexy Selfies In New Luscious Lip Thirst Traps
-
 Sports7 days ago
Jack Grealish posts new injury update as Man City star enters crucial period
-

 Tech9 hours ago
Despite challenges, Ireland sixth in EU for board gender diversity
-

 Crypto World5 days ago
New Crypto Mutuum Finance (MUTM) Reports V1 Protocol Progress as Roadmap Enters Phase 3
-

 Tech5 days ago
ACIP To Discuss COVID ‘Vaccine Injuries’ Next Month, Despite That Not Being In Its Purview
-
Entertainment5 days ago
Harry Styles Has ‘Struggled’ to Discuss Liam Payne’s Death
-

 Business4 hours ago
Search Enters 39th Day with FBI Tip Line Developments and No Major Breakthroughs