

Crypto World
Will Ethereum price fall under $1,900 as a bearish crossover forms?
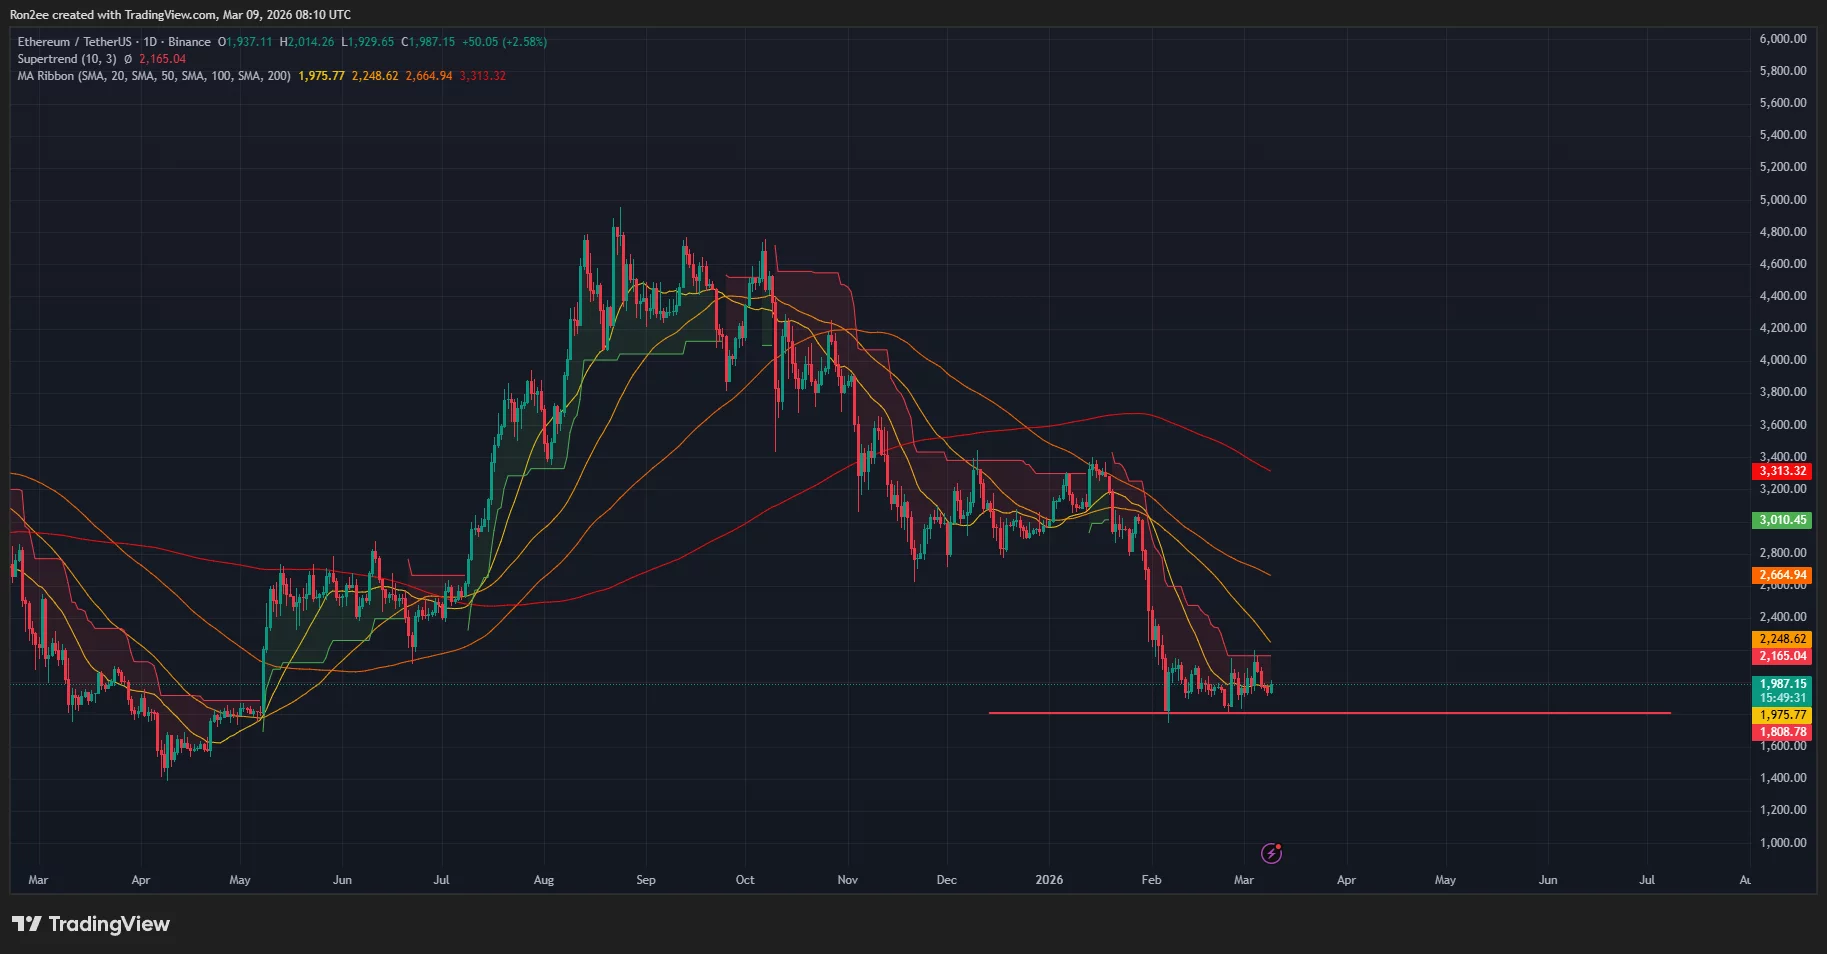
Ethereum price has held above $1,900 against the current crypto market volatility. However, a bearish crossover continues to threaten a drop below this crucial level.
Summary
- Ethereum price approached the $1,900 support as liquidations mounted and investors moved away from risk assets.
- A bearish SMA crossover has been confirmed on the daily chart.
According to data from crypto.news, Ethereum (ETH) price briefly fell 12% to an intraday low of $1,930 on Monday before retracing back part of its loss as it stabilised around $2,000 at press time.
Ethereum has spent the last three sessions oscillating within a tight $1,900 to $2,000 corridor as traders weighed escalating geopolitical risks in the Middle East against a backdrop of persistent macroeconomic uncertainty.
Ethereum price fell after Bitcoin dropped toward $65,000 in response to oil prices climbing past $100 worldwide amid fears of a potential blockade in the Strait of Hormuz as tensions between the U.S. and Iran escalated.
As Ethereum price dipped, it liquidated highly leveraged bets across the derivatives market. Data from CoinGlass shows nearly $75 million was liquidated from ETH futures over the past 24 hours, with long positions accounting for the majority.
A jump in long liquidations can intensify selling pressure and accelerate downside momentum, particularly during periods of heightened market volatility, as experienced over the past 24 hours.
Technical indicators seem to suggest bears could soon gain the upper hand. On the daily chart, the 20-day moving average for ETH price action has confirmed a bearish crossover with the 50-day SMA. As long as these key moving averages continue to move downwards, the asset could struggle to find its footing.

Ethereum price has also moved below the Supertrend line, which confirms that sellers are currently in control. At the same time, the Chaikin Money Flow index showed a negative reading, an indication that capital has been flowing out from the asset.
Hence, Ethereum price remains at high risk of dropping under $1,900, which could trigger bears to retest the Feb. 24 swing low near $1,800.
On the contrary, if price returns above the 50-day SMA at $2,248, traders may view this as a positive change in the current market momentum.
Disclosure: This article does not represent investment advice. The content and materials featured on this page are for educational purposes only.


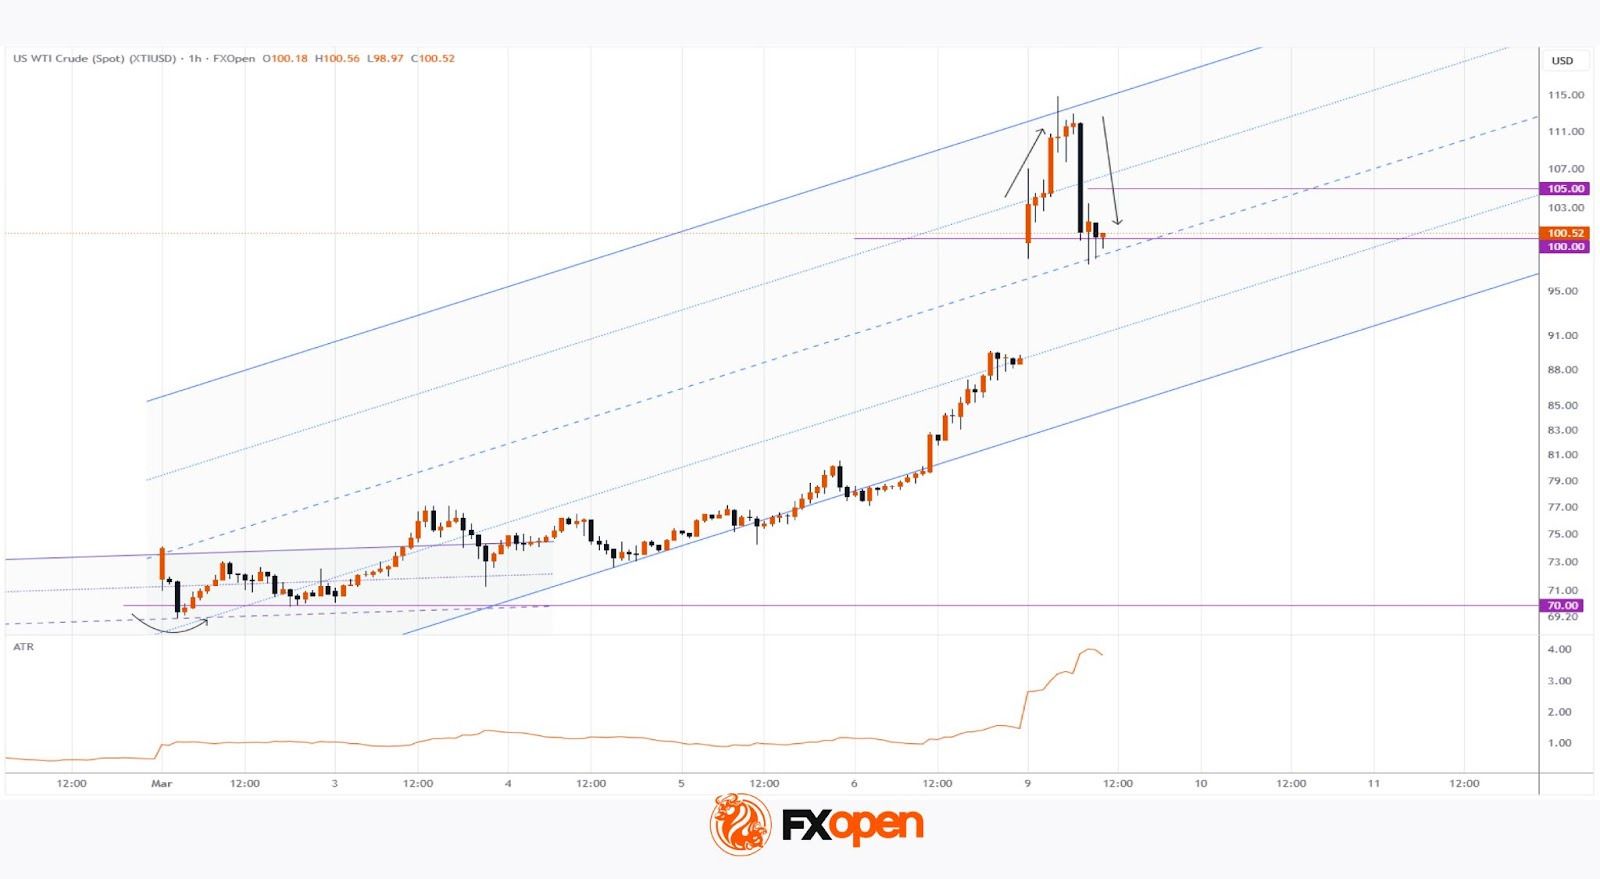
Another shocking Monday for the energy market. Last week’s start was remembered for a bullish gap of more than 10% (which was later followed by a pullback), but today’s market open proved even more volatile (as reflected by the ATR indicator). After a bullish gap of roughly 11%, the price continued to climb, reaching a peak of around $114 per barrel of WTI during the Asian session. This is the highest price since 2022.
The drivers of the rally are obvious – the escalation of the war in the Middle East, with more countries becoming involved. Risks have reached a critical point, with discussions emerging around the scenario of a complete blockade of shipping through the Strait of Hormuz. In such a case, oil-producing countries could invoke force majeure as grounds for halting supplies.
Technical Analysis of the XTI/USD Chart
Analysing the oil price chart a week ago, we assumed that the $70 level would act as support. Indeed, the market remained above this psychological level, while rising highs and lows reflected traders’ concerns.
Extreme volatility must be taken into account when applying classical technical patterns. Today, the oil price chart allows us to draw a broad ascending channel with a steep slope. In this context, it is worth noting (as indicated by the arrows):
→ the rapid rise in oil prices within the upper quarter of the channel;
→ the subsequent reversal and a swift decline towards the median.
This price action (essentially resembling a Bearish Engulfing pattern) points to a sharp shift in sentiment.
From the bulls’ perspective → the median of the wide channel, reinforced by the psychological $100 level, may act as support.
However, judging by the extremely wide candle, during which the XTI/USD quote dropped from $111 to $100 today, it is reasonable to assume that the initiative currently lies with the bears. And even if a rebound from the median occurs, it may fade near the $105 level (which has already acted as resistance on lower timeframes).
Start trading commodity CFDs with tight spreads (additional fees may apply). Open your trading account now or learn more about trading commodity CFDs with FXOpen.
This article represents the opinion of the Companies operating under the FXOpen brand only. It is not to be construed as an offer, solicitation, or recommendation with respect to products and services provided by the Companies operating under the FXOpen brand, nor is it to be considered financial advice.
Crypto World
Japan Denies Releasing Strategic Oil Reserves Amid Middle East Tensions and Surging Crude Prices

TLDR:
- Japan holds the world’s third-largest petroleum reserves, covering roughly 254 days of domestic consumption needs.
- Over 90% of Japan’s crude oil imports pass through the Strait of Hormuz, raising serious energy security concerns.
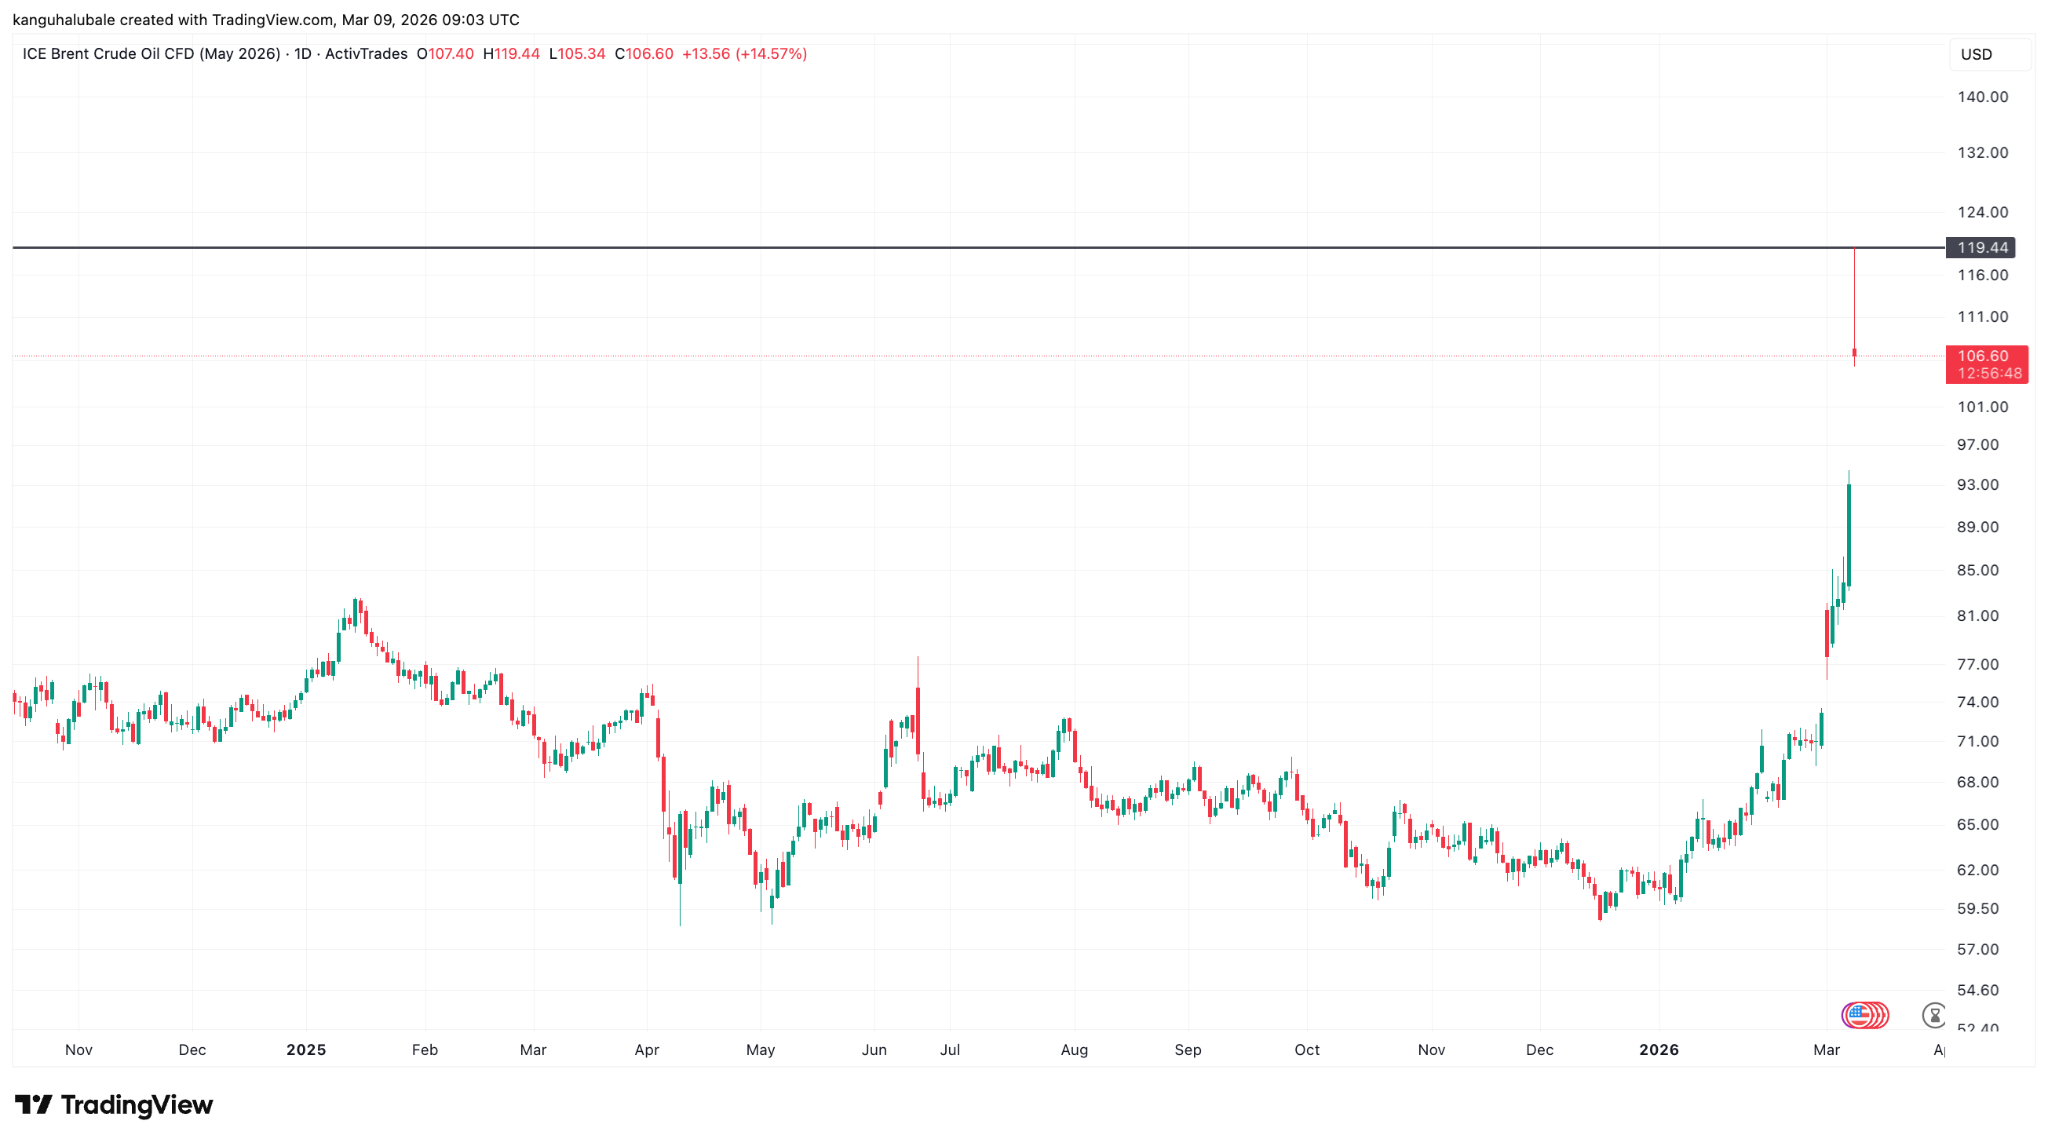
- Brent crude briefly surged near $120 per barrel, marking one of the sharpest oil price spikes seen in decades.
- Governments discussing strategic reserve releases signal preparations for a broader, potentially global energy supply shock.
Japan’s strategic oil reserves have become a focal point amid escalating Middle East tensions. Tokyo has denied making any final decision on releasing emergency petroleum stockpiles.
Reports earlier suggested Japan was preparing to tap its reserves. Officials say the government is closely monitoring developments before acting. Brent crude briefly surged near $120 per barrel.
This marks one of the sharpest price increases in recent decades. Global energy markets remain on edge.
Japan Monitors Middle East Crisis as Oil Prices Surge
Japan’s government confirmed no final call has been made on releasing strategic petroleum. Officials stated Tokyo is actively watching the Middle East conflict before committing to action.
The situation remains fluid, and energy markets are reacting accordingly. Any formal decision would carry major weight given Japan’s deep crude oil dependency.
Crypto and markets analyst Coin Bureau noted the broader context on social media. The account referenced past crises, including the 1990 Gulf War and the 2011 Fukushima disaster.
Both events prompted emergency energy responses across major economies. This context places the current situation in serious historical company.
Brent crude briefly touched near $120 per barrel amid growing uncertainty. That price level represents one of the largest spikes seen in decades.
Energy traders are pricing in potential supply disruptions stemming from the region. Market volatility is expected to continue as long as regional tensions persist.
Japan holds the world’s third-largest petroleum reserves, behind the United States and China. Its emergency stockpiles cover approximately 254 days of domestic consumption.
Releasing those barrels could help stabilize global supply chains considerably. It could also bring some measured relief to volatile crude prices worldwide.
Strait of Hormuz Disruption Puts Japan’s Energy Security at Risk
The Strait of Hormuz remains central to this rapidly developing energy story. Roughly 20% of the world’s oil supply passes through this single waterway.
Any disruption there would send strong shockwaves through global energy markets. Japan stands among the most exposed nations to such a supply scenario.
More than 90% of Japan’s crude oil imports travel through the Strait of Hormuz. This makes the country particularly sensitive to any blockage or regional conflict.
Strategic reserves exist precisely to buffer economies against sudden supply shocks. Their potential use shows how seriously Tokyo views the current threat.
As Coin Bureau posted: “Even discussing a release tells you something — Governments are preparing for a potential GLOBAL energy shock.” Governments that discuss reserve releases are typically preparing for a broader disruption.
This pattern has held true across several major historical energy crises. The current conversation around Japan’s reserves follows that same well-established logic.
For now, Tokyo maintains a cautious, wait-and-watch stance on the matter. However, if the Hormuz disruption worsens, strategic reserves may become essential.
Japan’s response could set the tone for other energy-dependent nations watching closely. The coming days will determine how far this energy crisis escalates.

Bitcoin (BTC) displayed strength as it traded above $67,000 on Monday, after producing the first bullish weekly close in seven weeks. Meanwhile, oil prices exploded as the Middle East conflict prompted fears of a major supply shortage.
Key takeaways:
-
Bitcoin holds firm above $67,000 as oil prices surge to the highest level since 2022.
-
The biggest oil supply shock in history triggers global inflation worries.
-
A bullish inverted hammer on the weekly chart suggests a potential BTC bottom.
Global oil supply shock sparks inflation worries
Data from TradingView showed oil futures rose to $119 during early Asian trading hours on Monday, as the escalating Middle East conflict raised fears of supply disruptions.
This is the highest price oil has reached since Russia invaded Ukraine in 2022.

The latest surge in oil prices came as Iraq warned that roughly 3 million barrels per day of production could be disrupted due to Iranian threats against tankers in the Strait of Hormuz.
Related: Bitcoin preps fresh trend line showdown as weekly close sparks $60K target
Capital markets commentator The Kobeissi Letter said the world is now experiencing the “largest oil supply shock in history,” losing nearly 20 million barrels of oil supply daily.

Despite the exploding oil prices, US President Donald Trump said it’s a “small price” to pay for peace.
“Short-term oil prices, which will drop rapidly when the destruction of the Iran nuclear threat is over, is a very small price to pay for U.S.A., and world, safety and peace.”
Meanwhile, the sharp rise in oil prices and the imminent supply shock have revived global inflation concerns, with markets seeing few chances of rate cuts in 2026.
Polymarket bettors are pricing in a roughly 99% probability that the Federal Reserve leaves rates unchanged at its March 18 meeting, with only about a 27% chance of a 25-basis-point cut in 2026.

Leaving rates unchanged tightens financial conditions, boosts the dollar, and pressures Bitcoin, which often sees short-term volatility as investors rotate capital into safe havens like gold.
Has Bitcoin price already bottomed?
At the time of writing, Bitcoin traded around $67,000 with little sign of panic selling, suggesting that traders treated the spike as an energy-specific shock rather than a broad risk-off event.
“Bitcoin’s refusal to go down when the rest of the market is burning is one of the strongest indications I’ve seen yet that the bottom could be in,” analyst Brian Brookshire said in an X post on Monday, adding:
“If there were even the slightest hint of froth in Bitcoin, it would have panic-sold off 10% into the futures open.”
Despite being rejected from the $74,000 resistance level, the BTC/USD pair still produced the “first positive weekly candle in 7 weeks,” founder and CEO at CoinBureau Nic said on Monday.
The price action has also formed an “inverted hammer, which could indicate a potential bullish reversal,” Nic added.

An inverted hammer weekly candle is a bullish reversal pattern found at the end of a downtrend. It features a small body at the lower end, little to no lower wick, and a long upper wick at least twice the size of the body. It signals that buyers are challenging sellers, potentially reversing the trend.
Thus, Bitcoin could move higher if this pattern is confirmed by a strong bullish follow-through candle this week, with higher volume to break overhead resistance.
As Cointelegraph reported, spikes in oil prices immediately after conflicts tend to be short-lived, with Bitcoin outperforming over the longer term.
This article does not contain investment advice or recommendations. Every investment and trading move involves risk, and readers should conduct their own research when making a decision. While we strive to provide accurate and timely information, Cointelegraph does not guarantee the accuracy, completeness, or reliability of any information in this article. This article may contain forward-looking statements that are subject to risks and uncertainties. Cointelegraph will not be liable for any loss or damage arising from your reliance on this information.


Prediction markets are expanding rapidly, with multiple platforms introducing new ways for users to trade on real-world outcomes.
But as sports are increasingly driving volume in these markets, some founders tend to believe that theinfrastructure itself has to evolve.
In the following conversation, Amit Mahensaria explains why his company PRED is built around an exchange model rather than a traditional sportsbook. He also explains how it approaches liquidity and speed in live sports trading, as well as why hebelieves aligned incentives between platfrom and traders are particularly important when it comes to building long-term trust.
PRED positions itself as a true peer-to-peer sports prediction exchange rather than a sportsbook or a house-backed market. For readers familiar with platforms like Polymarket or Kalshi, what are the most important structural differences in how PRED runs markets, makes money, and treats users?
The simplest way to understand PRED is this: we are an exchange, not a sportsbook. On a traditional sportsbook, you trade against the house. The house sets the odds, takes the other side of your position, and profits when you lose. That creates a fundamental conflict of interest, and it’s why every major sportsbook in the world eventually limits or bans their best customers.
On PRED, users trade directly with each other. We match buyers and sellers. We never take the other side of your trade, and we never take a directional position against our users. Our revenue comes from trading fees on matched orders. We make money when people trade, not when people lose. That alignment changes everything.
Compared to Polymarket or Kalshi, the key difference is that we’re purpose-built for sports. Right now, these general-purpose prediction markets are deriving majority volume through sports, but it is coincidental, they are not designed for sports. PRED is sports trading infrastructure from the ground up. That means features like cross-matching, where a single order on one outcome automatically generates liquidity across all related outcomes in the same match. It means capital efficiency mechanics where your collateral works harder because the system understands the structure of sports markets. And it means live match handling that’s designed for the high speed and volatility of in-play sports, not tweet speculation or political events.
Polymarket proved that on-chain prediction markets work. We’re building the next step: specialised infrastructure for the world’s largest prediction market, which is sports.
Speed and liquidity are everything in live sports markets. You’ve said PRED is currently the fastest exchange for sports predictions—can you break down what that actually means in practice, and how your architecture on Base enables that performance advantage?
In live sports, a goal can shift a market by 30 or 40 percentage points in seconds. If your platform can’t keep up with that, traders either miss opportunities or get filled at stale prices. Both outcomes destroy trust.
We execute trades in under 200 milliseconds. To put that in context, most on-chain prediction platforms take multiple seconds to confirm a trade. Traditional sportsbooks can take even longer during peak moments because they’re adjusting lines. Our execution speed means that when you see a price on PRED, you can actually get it. That sounds basic, but it’s genuinely rare in this space.
We built on Base, Coinbase’s Layer 2, for three reasons. First, the transaction costs are fractions of a cent, which matters enormously for a trading use case where gas fees can eat into your edge. Second, we get sub-second finality, which is the baseline requirement for live sports markets. Third, the Base ecosystem is where serious consumer crypto applications are being built right now, and those users understand the DeFi primitives that make an exchange model work.
The combination of on-chain settlement with off-chain order matching gives us the transparency of blockchain with the performance of a centralised exchange. You get the speed which is needed for live sports.
Many traders in both Web2 sportsbooks and Web3 prediction markets worry about one thing above all else: getting banned for winning. PRED has taken a strong stance on never banning winners. Why was that policy non-negotiable for you, and what does it say about the kind of market you’re trying to build?
This one is personal. I’ve been involved in sports trading for over 22 years. I’ve watched the best analysts and traders I know get systematically shut out of platform after platform simply for being good at what they do. They spend half their time on logistics, spreading funds across accounts, using friends and family, hunting for books that haven’t limited them yet. It’s absurd.
The reason sportsbooks ban winners is structural, not personal. When the house is your counterparty, every dollar you win is a dollar they lose. Of course they’re going to remove the people who cost them the most money. It’s rational behaviour within a broken model.
On an exchange, that incentive doesn’t exist. We don’t take the other side of your trade. The more skilled traders we attract, the more volume they generate, the deeper our markets become, and the better the experience gets for everyone. Winning traders are our most valuable users, not our biggest liability.
This wasn’t some marketing decision. It’s a direct consequence of our exchange architecture. We structurally cannot profit from your losses, so we have zero incentive to punish your wins. That’s the kind of market I wanted to build from day one: one where skill is rewarded, not penalised.
One of PRED’s talked-about features is the 5–6% native yield on user deposits, which is rare in prediction markets today. How does this yield work mechanically, and why did you feel it was important to design capital efficiency into the core user experience rather than treat it as an add-on?
Think about what happens on a traditional sportsbook or even most prediction platforms. You deposit funds, and that capital sits idle until you place a trade. If you’re waiting for the right market or the right price, your money is doing nothing. On some platforms, your deposits might sit uninvested for days or weeks while you’re being selective about your entries.
On PRED, your deposited capital earns yield while it’s in your account. We’ve partnered with global institutions to generate yield on the underlying stablecoin deposits. Also since we don’t have huge marketing costs like deposit bonus, we are able to pass on a portion of our trading fees to the users in the form of yield. Your capital is working for you even when you’re not actively trading.
We designed this into the core experience because capital efficiency is something serious traders think about constantly. If you’re a professional, the opportunity cost of idle capital matters. Offering native yield means traders can keep larger balances on PRED without feeling like they’re sacrificing returns elsewhere. It removes a friction point that most platforms don’t even acknowledge exists.
This is also a statement about how we think about the relationship between a platform and its users. Your money should work for you. That’s a simple principle, but almost nobody in this industry follows it.
Your earlier career spans investment banking, private equity, and building Impartus into a scaled edtech platform that saw real institutional adoption. How did that background shape your thinking around market design, incentives, and long-term trust when building PRED?
Each chapter taught me something different. Investment banking and private equity gave me a deep understanding of how markets work, how liquidity is structured, and how incentive alignment between participants determines whether a market thrives or collapses. You learn quickly that markets only work sustainably when the operator’s interests are aligned with the participants.
Building Impartus, which was acquired by upGrad and scaled to two million users, taught me something completely different. It taught me how to build products that earn users and institutional trust over time. They adopt because you prove reliability, transparency, and consistent delivery. That patience and focus on earned trust is something I brought directly to PRED.
And then there’s the 22 years of sports trading that runs underneath all of it. That’s where I experienced firsthand every problem PRED is built to solve. Getting limited, getting banned, slow platforms, pain of cashing out, watching platforms change the rules, watching the industry punish skill. That frustration is what made me want to build the alternative.
The combination of those experiences is why PRED isn’t just a crypto product with sports bolted on. It’s built by someone who understands both market infrastructure and the specific pain points of being a serious sports trader in a system that’s designed to work against you.
Unlike many crypto products that prioritize short-term speculation, PRED emphasizes running a fair market rather than taking directional risk. How do you think this “exchange-first” philosophy changes user behavior and retention over time, especially among serious sports traders?
When users trust that the platform isn’t working against them, their behaviour changes fundamentally. They deploy more capital. They trade more frequently. They think longer-term about their strategies instead of constantly looking over their shoulder wondering when they’ll get limited.
On traditional platforms, skilled traders develop adversarial habits. They spread their activity across multiple accounts. They deliberately lose some trades to avoid triggering algorithms. They keep balances low because they don’t trust the platform with large amounts. All of that suppresses volume and creates a worse market for everyone.
On an exchange where the rules are transparent and the incentives are aligned, traders can just focus on what they’re good at: analysing sports and taking positions. That might sound simple, but it’s actually a radical change from how most of this industry operates.
In terms of retention, the logic is straightforward. If you’re not going to get banned for being good, why would you leave? The biggest churn driver in sports trading is platform distrust. Remove that, and you build a community of committed, high-quality traders who generate consistent volume. That’s the foundation of a healthy exchange.
Looking ahead, what does success for PRED look like in the next 12–24 months—is it about volume, liquidity depth, new sports, or redefining how prediction markets fit into the broader Web3 financial stack?
Honestly, it’s all of those things, but if I had to prioritise, it starts with liquidity depth. Volume numbers can be misleading. What matters is whether a trader can come to PRED, find a market they want to trade, and get filled at a competitive price with real depth behind it. That’s the core promise, and everything else follows from it.
In the near term, we’re focused on building a base of serious, active traders rather than chasing signup numbers. I’d rather have a few thousand committed traders generating real, sustainable liquidity than hundreds of thousands of casual signups with no depth behind them. The quality of users matters more than quantity, especially in the early stages of an exchange.
Expanding into new markets is absolutely on the roadmap. We launched with major leagues in Soccer (EPL, UCL, La Liga) and will expand into other sports soon. And not only new sports, but even within a sport or a league, launching diverse markets that cater to varying users. Sports will drive a lot of innovation, like combination as well as conditional predictions. The infrastructure we’ve built is designed for trading to scale across any sport with verifiable outcomes.
The bigger picture is about where prediction markets sit within Web3 finance. I think we’re still in the early stages of people understanding that sports outcomes are a tradeable asset class with real analytical depth, not just entertainment.
We raised $2.5 million led by Accel with participation from Coinbase Ventures, and that backing reflects confidence in this thesis. We’re building for the long term, not the next cycle.
Disclaimer: The content shared in this interview is for informational purposes only and does not constitute financial advice, investment recommendation, or endorsement of any project, protocol, or asset. The cryptocurrency space involves risk and volatility. Readers are encouraged to conduct their own research and consult with qualified professionals before making any financial decisions. This interview was conducted in cooperation with PRED, who generously shared their time and insights. The content has been reviewed and approved for publication in mutual understanding. Minor edits have been made for clarity and readability, while preserving the substance and tone of the original conversation.
Binance Free $600 (CryptoPotato Exclusive): Use this link to register a new account and receive $600 exclusive welcome offer on Binance (full details).
LIMITED OFFER for CryptoPotato readers at Bybit: Use this link to register and open a $500 FREE position on any coin!
Crypto World
Bitcoin (BTC) price stays calm while other markets panic. Key levels to watch: Crypto Daybook Americas
By Omkar Godbole (All times ET unless indicated otherwise)
Bitcoin and the broader crypto market stayed resilient Monday as an oil price surge above $100 shook Asian markets and triggered a drop in U.S. stock futures. The crypto calm may be shattered if bitcoin moves outside the $60,000- $75,000 range, data on major market participants’ positions suggests.
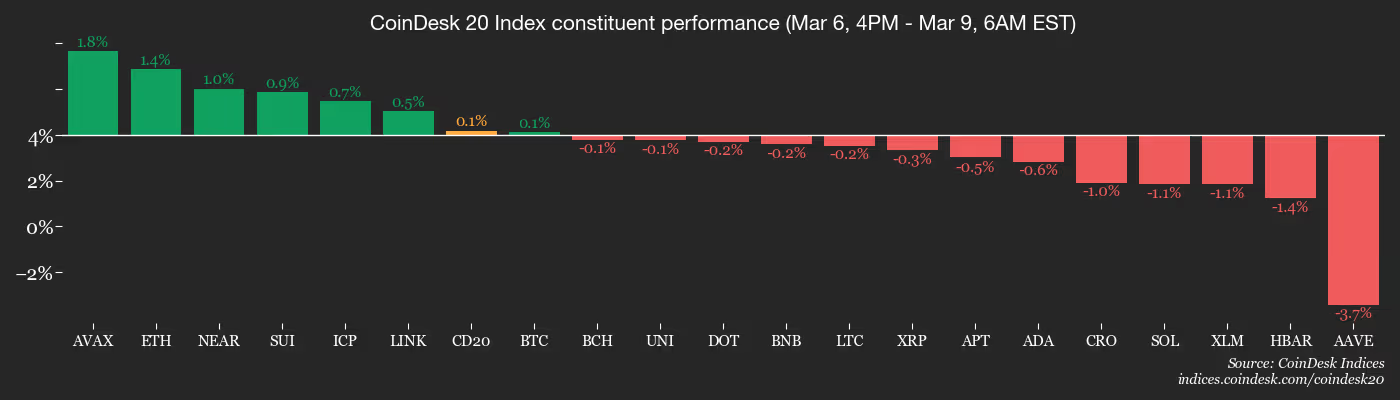
It’s solidly within that range at the moment, though. The leading cryptocurrency by market value has risen over 3% since early Asian hours to trade around $68,000. The rally follows a week of back-and-forth action that saw the price rise to nearly $74,000 only to drop back to $67,000 over the weekend. The CoinDesk 20 Index (CD20), ether (ETH), XRP (XRP), solana (SOL) saw similar increases.
This resilience to the war in the Middle East and risk-off sentiment in global stocks likely stems from the earlier outperformance of U.S. equities and the cryptocurrency’s oversold status. Nothing reflects the crypto calm better than BTC’s 30-day implied volatility index, BVIV, which remains steady around 60%. Wall Street’s volatility indexes, meantime, the equity VIX, the oil VIX and the gold VIX have all surged to multiweek highs, indicating panic in traditional markets.
Bitcoin market makers — those entities tasked with creating order book liquidity and ensuring seamless trading — are “short gamma” at $60,000 and $75,000. This means that if the market moves beyond those levels, they could trade in the direction of the price movement to rebalance their net exposure back to neutral. In other words, they may sell BTC as its price drops and buy when it rises, accentuating volatility.
“If we look at the Deribit GEX (gamma exposure chart) we see dealers are short a lot of gamma at the $60k level and the $75k levels … essentially the ceiling and floor of the box. Should markets actually trade beyond the box, negative gamma will make things worse from a dealer rebalancing perspective,” Amberdata’s Director of Derivatives Greg Magadini said in an email.
He added that traders are looking at the same levels and have hedged their own exposure at the ceiling and floor. Stay alert!
Read more: For analysis of today’s activity in altcoins and derivatives, see Crypto Markets Today
What to Watch
For a more comprehensive list of events this week, see CoinDesk’s “Crypto Week Ahead“.
- Crypto
- March 9: Solstice and Kamino to announce a new product or feature.
- Macro
- Earnings (Estimates based on FactSet data)
- March 9: Sharplink (SBET), pre-market, $0.31
Token Events
For a more comprehensive list of events this week, see CoinDesk’s “Crypto Week Ahead“.
- Governance votes & calls
- Convex Finance is voting on Curve Ownership DAO Vote ID: 1358, which would onboard GHO as a Pegkeeper with a 3 million crvUSD debt ceiling. Voting ends March 9.
- Lido DAO is voting to make the delegate incentivization program (DIP 2.0) a permanent governance mechanism. Voting ends March 9.
- Lido DAO is voting to authorize a one-time $5 million DAO Treasury allocation into the upcoming Lido Earn ETH and USD Vaults. Voting ends March 9.
- Lido DAO is voting on whether Stakin (recently acquired by The Tie) should continue operating as a node operator and whether to approve updating Stakin’s on-chain name and reward address. Voting ends March 9.
- Unlocks
- Token Launches
- March 9: Nexira’s (NEXI) token generation event occurs, token to be listed on KuCoin.
Conferences
For a more comprehensive list of events this week, see CoinDesk’s “Crypto Week Ahead“.
Market Movements
- BTC is up 0.68% from 4 p.m. ET Sunday at $67,649.34 (24hrs: -0.36%)
- ETH is up 1.89% at $1,995.45 (24hrs: +1.12%)
- CoinDesk 20 is up 1.04% at 1,943.48 (24hrs: +0.12%)
- Ether CESR Composite Staking Rate is down 9 bps at 2.64%
- BTC funding rate is at -0.0025% (-5.8613% annualized) on Binance

- DXY is up 0.30% at 99.2812
- Gold futures are down 0.70% at $5,110.00
- Silver futures are up 0.21% at $84.00
- Nikkei 225 closed down 5.20% at 52,728.72
- Hang Seng closed down 1.35% at 25,408.46
- FTSE 100 is down 1.22% at 10,159.26
- Euro Stoxx 50 is down 1.70% at 5,622.84
- DJIA closed on Friday down 0.95% at 47,501.55
- S&P 500 closed down 1.33% at 6,740.02
- Nasdaq Composite closed down 1.59% at 22,387.68
- S&P/TSX Composite closed down 1.57% at 33,083.70
- U.S. 10-Year Treasury rate is up 4 bps at 4.18%
- E-mini S&P 500 futures are down 0.90% at 6,682.75
- E-mini Nasdaq-100 futures are down 0.96% at 24,434.00
- E-mini Dow Jones Industrial Average futures are down 1.04% at 47,024.00
Bitcoin Stats
- BTC Dominance: 59.04% (0.62%)
- Ether-bitcoin ratio: 0.02951 (0.51%)
- Hashrate (seven-day moving average): 1,005 EH/s
- Hashprice (spot): $29.61
- Total fees: 1.96 BTC / $131,828
- CME Futures Open Interest: 100,675 BTC
- BTC priced in gold: 13.3 oz.
- BTC vs gold market cap: 4.56%
Technical Analysis

- The chart shows daily swings in bitcoin’s 30-day implied volatility index, BVIV, in candlestick format.
- The index is hovering close to the upper end of its recent range.
- A potential breakout would mean higher volatility and risk aversion, leading to losses in bitcoin.
Crypto Equities
- Coinbase Global (COIN): closed on Friday at $197.22 (-4.13%), -0.84% at $195.57 in pre-market
- Galaxy Digital (GLXY): closed at $20.56 (-9.57%), -0.17% at $20.52
- MARA Holdings (MARA): closed at $8.01 (-8.67%), -0.12% at $8.00
- Riot Platforms (RIOT): closed at $14.16 (-9.20%), -1.38% at $13.97
- Core Scientific (CORZ): closed at $14.86 (-7.13%), -0.54% at $14.78
- CleanSpark (CLSK): closed at $9.21 (-7.44%), -0.43% at $9.17
- Exodus Movement (EXOD): closed at $10.90 (-2.50%)
- CoinShares Bitcoin Mining ETF (WGMI): closed at $36.07 (-8.10%), -0.80% at $35.78
- Circle Internet Group (CRCL): closed at $101.91 (-3.62%), +1.24% at $103.17
- Bullish (BLSH): closed at $34.96 (-0.17%), -1.34% at $34.49
Crypto Treasury Companies
- Strategy (MSTR): closed at $133.53 (-4.49%), +0.25% at $133.86
- Strive Asset Management (ASST): closed at $8.70 (-5.95%), -0.23% at $8.68
- Sharplink (SBET): closed at $7.36 (-7.19%), +2.45% at $7.54
- Upexi (UPXI): closed at $0.90 (-6.44%), +4.44% at $0.94
- Lite Strategy (LITS): closed at $1.14 (+0.88%)
ETF Flows
Spot BTC ETFs
- Daily net flows: -$348.9 million
- Cumulative net flows: $55.35 billion
- Total BTC holdings ~ 1.28 million
Spot ETH ETFs
- Daily net flows: -$82.9 million
- Cumulative net flows: $11.66 billion
- Total ETH holdings ~ 5.64 million
Source: Farside Investors
While You Were Sleeping

Today, the dollar index rose above last week’s peak around the 99.68 level, setting a new high for 2026. This movement is supported by a tense fundamental backdrop:
→ Inflationary pressures from rising oil prices. Markets may be pricing in a “higher for longer” scenario, with elevated Fed rates persisting.
→ Safe-haven demand. Escalation in the Middle East—including strikes on Iran and the rise of hardline leader Mojtaba Khamenei in Tehran—may push market participants towards defensive strategies and the US dollar.
→ Weakness in other currencies. The Middle East conflict can weigh on the yen and euro, as European and Japanese economies remain highly sensitive to energy prices.
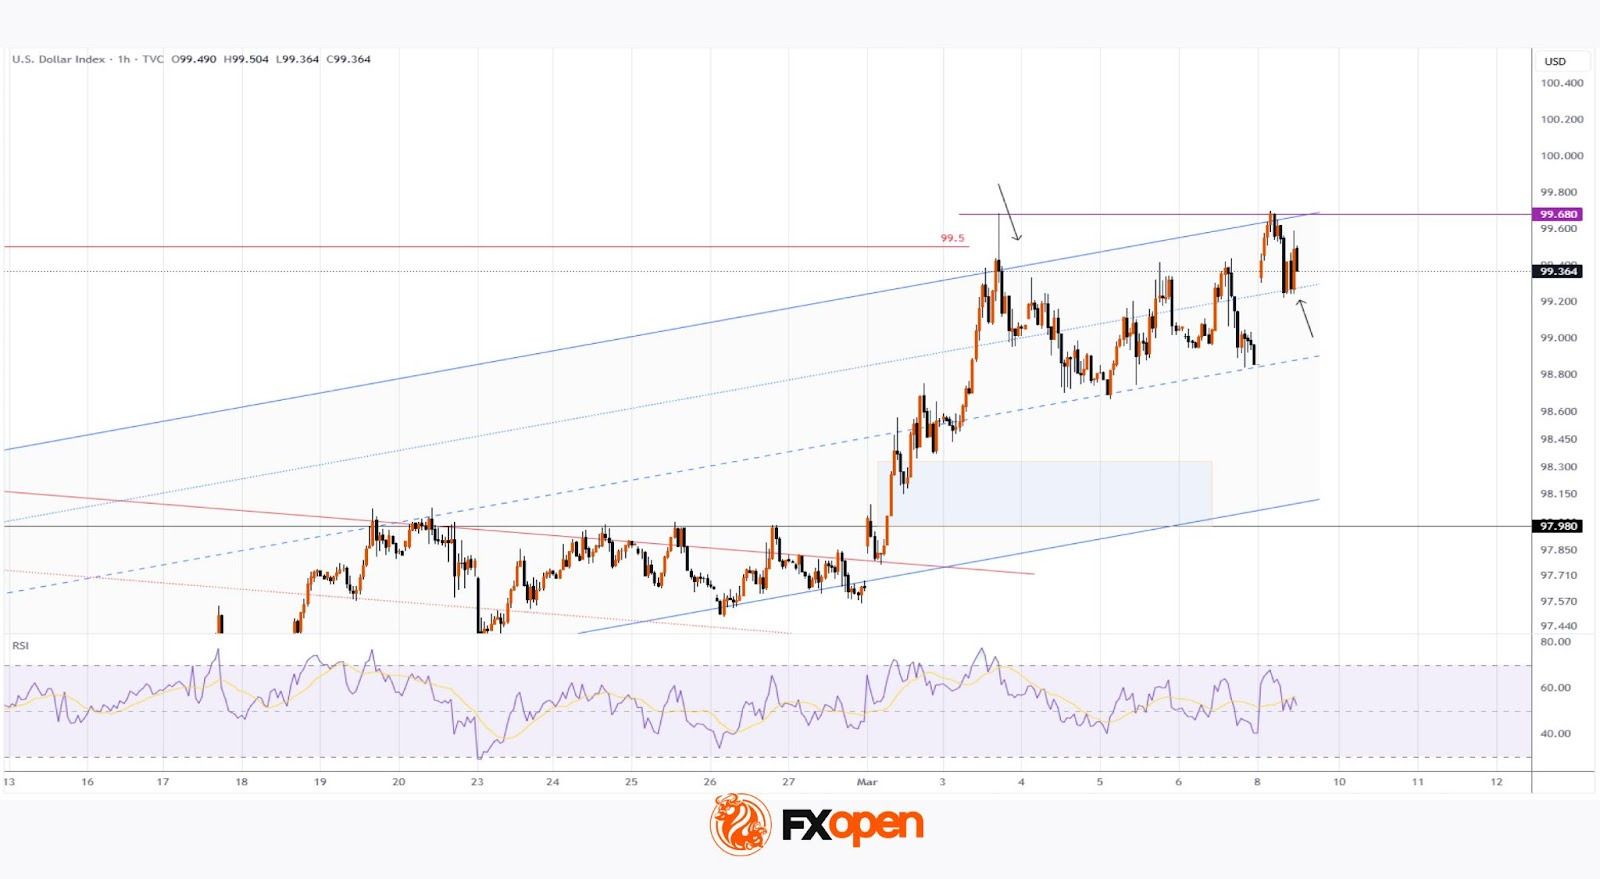
Technical Analysis of the DXY Chart
On the morning of 3 March, analysing the DXY chart, we:
→ drew an ascending channel (highlighted in blue);
→ anticipated that military escalation could drive the DXY index to the upper boundary of the channel.
Indeed, on the same day, the dollar index surged:
→ breaking above the channel’s upper boundary;
→ the RSI indicator entered overbought territory;
→ price slightly exceeded the January peak, signalling a possible bull trap.
As indicated by the first arrow, a long upper wick formed at the peak on 3 March, showing seller activity around the 99.60 level. Today’s brief surpassing of last week’s peak confirms this thesis, resembling a Liquidity Grab pattern.
On the other hand, buyers:
→ demonstrated strength at the market open (the bullish gap may continue to act as support);
→ can rely on support from the line dividing the upper half of the channel into two quarters (shown by the second arrow).
Traders should therefore be prepared for a scenario where DXY fluctuations show signs of stabilising near the yearly highs. Key developments around Iran are likely to have the strongest influence on the evolving balance.
Trade global index CFDs with zero commission and tight spreads (additional fees may apply). Open your FXOpen account now or learn more about trading index CFDs with FXOpen.
This article represents the opinion of the Companies operating under the FXOpen brand only. It is not to be construed as an offer, solicitation, or recommendation with respect to products and services provided by the Companies operating under the FXOpen brand, nor is it to be considered financial advice.


UK-based digital asset firm Stack BTC Plc has secured £260,000 in fresh funding, with Reform UK leader Nigel Farage emerging as a key investor after acquiring a roughly 6% stake in the company.
Summary
- Nigel Farage acquired an estimated 6% stake in Stack BTC through a £260,000 fundraising round.
- The company issued 5.2 million shares at 5p each on the Aquis Stock Exchange.
- Stack BTC plans to acquire profitable UK businesses while building a corporate Bitcoin treasury strategy.
UK firm Stack BTC raises £260K to build corporate Bitcoin treasury
The fundraising was completed through the issuance of 5.2 million new shares priced at 5 pence each, according to an announcement on the Aquis Stock Exchange. The new capital will support the firm’s strategy of building a Bitcoin-focused treasury while acquiring profitable UK businesses.
The investment also saw participation from Blockchain.com, which joined the company as a strategic investor as Stack BTC seeks to expand its role in digital asset infrastructure and treasury management.
Following the transaction, the newly issued shares are expected to be admitted to trading on the Aquis Growth Market, increasing the company’s total shares in issue to more than 68 million.
Stack BTC said the proceeds from the raise will be used to accelerate its merger-and-acquisition strategy, targeting “high-quality, cash-generative businesses” while gradually building exposure to Bitcoin as a long-term treasury asset.
The company’s strategy reflects a broader trend among publicly listed firms experimenting with corporate Bitcoin holdings as a hedge against currency debasement and macroeconomic uncertainty.
Farage has been an outspoken supporter of digital assets and has previously argued that cryptocurrencies could play an increasing role in the global financial system.
“I am delighted to have become an investor in Stack and lend my support to the team. I have long been one of the UK’s few political advocates for Bitcoin, recognising the role digital currencies will play in the future of business and finance. London and the UK has historically been the centre of world’s financial markets, and I believe that we can and should be a major global hub for the crypto industry,” Farage said.
Investors participating in the fundraising also received one warrant for every two shares purchased, exercisable at 5 pence under certain conditions, including if the company’s market capitalization reaches £100 million.
The move places Stack BTC among a growing group of companies attempting to combine traditional business acquisitions with Bitcoin treasury exposure, positioning itself to benefit from the expanding digital asset economy.

Data from Glassnode shows most XRP holders are underwater, with 36.8B tokens in loss positions totaling about $50.8B in unrealized losses.
On-chain analytics firm Glassnode reported on March 8 that approximately 36.8 billion XRP, representing nearly 60% of the circulating supply, is currently held at a loss, with the total unrealized loss denominated in USD sitting at roughly $50.8 billion.
The figure highlights the extent of the asset’s recent downturn as it trades near $1.34, down more than 63% from its all-time high of $3.65 reached in July 2025.
Data Shows Large Unrealized Losses Across XRP Supply
The unrealized profit and loss metric measure the difference between the current market price and the price at which tokens last moved on-chain. This method weighs each coin by its purchase cost rather than simply counting how many tokens sit above or below market price. Analysts often use the indicator to gauge investor sentiment during different stages of market cycles.
XRP has struggled over multiple timeframes, down 0.5% over the past week, 7.1% monthly, and more than 42% in the last year. The persistent weakness has left the majority of holders facing paper losses of $50.8 billion, creating an environment where selling pressure could emerge if prices recover toward individual cost bases.
Earlier attempts to recover ground stalled near $1.45, with the rejection occurring during a week when U.S. XRP ETFs posted net outflows, including $16.62 million leaving the products on March 6, the largest daily withdrawal since late January.
Derivatives Activity Rises While Analysts Debate Market Cycle
Despite the heavy unrealized losses across the supply, trading activity in derivatives markets has picked up across several exchanges. According to CoinGlass data, XRP futures volume on BitMEX has spiked more than 7,000% to around $49 million, suggesting traders may have increased leverage while waiting for a clearer price direction.
Meanwhile, Binance recorded about $733 million in XRP futures volume in the last 24 hours, with other platforms like Bybit and OKX also reporting large turnover. At the same time, some indicators point to slower spot trading activity. Data shared by analytics account Arab Chain showed Binance’s 30-day volume Z-Score near −1.16, meaning daily trading volume currently sits below its recent average.
You may also like:
However, market commentary on X reflects mixed views about the next move, with XRP permabull EGRAG Crypto writing that the asset’s cycles often include both price declines and extended consolidation periods before a new expansion phase begins. In the same thread, the analyst suggested the current structure may represent a period of “time-based capitulation,” where sentiment resets during long sideways trading.
Other forecasts remain cautious, with some analysts arguing that XRP could revisit sub-$1 levels, with one projection pointing to a potential support area near $0.90 if the downward channel seen since mid-2025 continues.
Binance Free $600 (CryptoPotato Exclusive): Use this link to register a new account and receive $600 exclusive welcome offer on Binance (full details).
LIMITED OFFER for CryptoPotato readers at Bybit: Use this link to register and open a $500 FREE position on any coin!
Cryptocurrency exchange Coinbase has launched new futures offerings in Europe, expanding its push to give users access to both crypto and traditional market exposure through regulated products.
Coinbase said Monday the contracts are being rolled out to Coinbase Advanced users in 26 European countries, including Germany, France and the Netherlands, through its Markets in Financial Instruments Directive, or MiFID, entity.
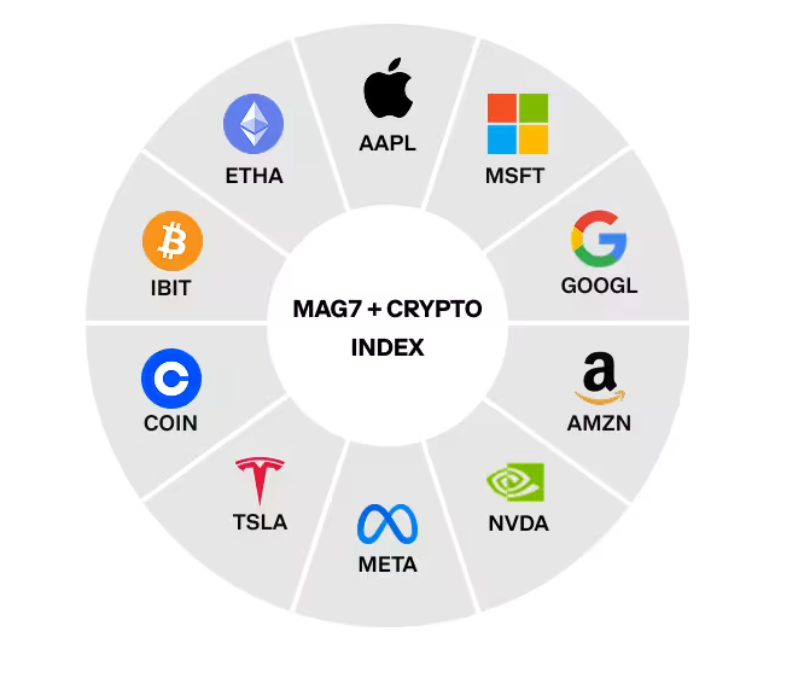
The new lineup includes crypto futures tied to assets such as Bitcoin (BTC) and Solana (SOL), along with an equity-index product called the Mag7 + Crypto Equity Index Futures. Coinbase said that contract combines exposure to the so-called Magnificent Seven stocks of Apple, Microsoft, Alphabet, Amazon, Nvidia, Meta and Tesla, with crypto-linked equities and BlackRock iShares exchange-traded funds tied to BTC and Ether (ETH).

The exchange said it has launched two types of cash-settled futures contracts, including perpetual-style futures with five-year expiries and dated contracts with specific monthly or quarterly expiries. Traders can access up to 10x leverage on select crypto-denominated contracts and equity indices and up to 5x leverage on other products, with fees as low as 0.02% per contract.
ESMA warns crypto perpetual derivatives may fall under CFD rules
The launch comes about two weeks after the European Securities and Markets Authority warned firms that many derivatives marketed as perpetual futures or perpetual contracts are likely to fall under existing national product intervention measures for contracts for difference (CFDs).
In a Feb. 24 statement, ESMA said products that meet the CFD definition are subject to leverage limits, mandatory risk warnings, margin close-out rules, negative balance protection and a ban on monetary and nonmonetary benefits. The regulator also told firms to identify, prevent or manage conflicts of interest tied to those offerings.
Coinbase also announced expanded access to its decentralized exchange (DEX) trading platform to 84 countries on Friday.
Related: Crypto exchanges gain as tokenized commodity market climbs to $7.7B
Coinbase doubles down on “everything exchange” ambitions
Coinbase called the derivatives rollout a “major step” in its ambition to build an “exchange for everything,” where users can trade all major global assets under a single platform.
“As regulatory clarity continues to mature across Europe and globally, we are looking forward to continuing to introduce new and expanded services,” Coinbase said in the announcement.
Other cryptocurrency exchanges that launched regulated perpetual contracts in Europe include One Trading, Kraken, Backpack and Gemini.
Cointelegraph reached out to Coinbase for comment, but had not received a response by publication.
Related: Binance completes $1B Bitcoin conversion for SAFU emergency fund
Magazine: Coinbase and Base: Is crypto just becoming traditional finance 2.0?
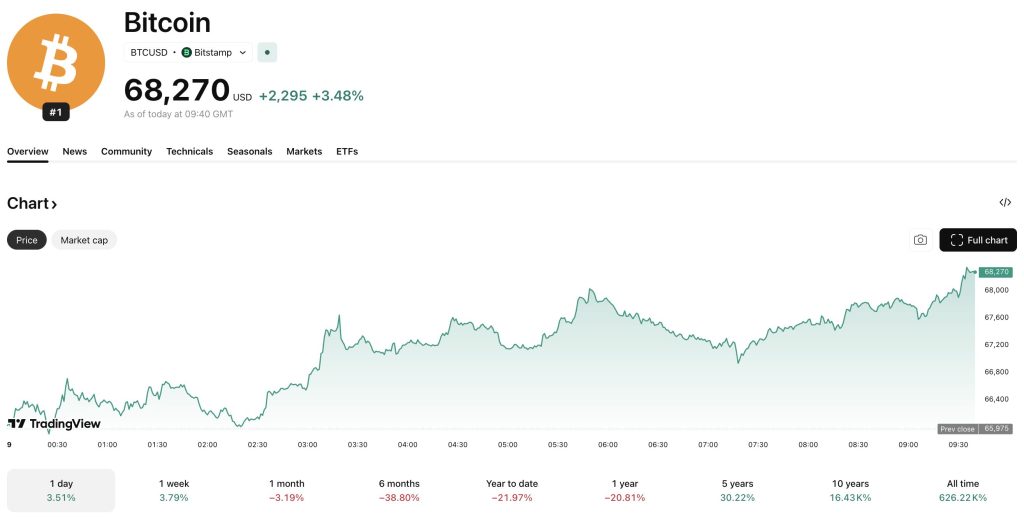
Crypto fundraising, or funding rate, surged +50% to over $25.5Bn in the 12 months ending March 2026 compared to the previous year, despite a -46% drop in total deal volume, according to Messari data.
This divergence signals a stark consolidation of capital into late-stage mega-rounds as VCs retreat from speculative early-stage bets and concentrate on established infrastructure.
It comes as the total crypto market cap stayed flat overnight, dropping just -0.1% to $2.38 trillion, with the Bitcoin price trading at around $68,200 after a 0.7% move since yesterday.

Record Average Deal Size Marks Strategic Shift
Data from Messari CEO Eric Turner shows that the average crypto deal size swelled to $34M over the last year, up +272% from the prior period.
This comes as the raw count of finalized deals dropped by nearly half. Total funding hit $25.5Bn, but the distribution of that capital has shifted fiercely toward established players rather than seed-stage startups.
The divergence between rising dollar volume and falling deal count indicates a structural maturation. The “spray and pray” tactics common in previous cycles have been replaced by high-conviction bets.
While the headline funding number looks bullish, Turner noted that outside of Dragonfly Capital, few major crypto VCs have closed new funds recently.
DISCOVER: Next Crypto to Explode in 2026
Institutional Concentration and the ‘Flight to Quality’
The heavy skew toward mega-rounds signals that the crypto market structure is beginning to mirror traditional fintech.
Late-stage strategic rounds are now the primary driver of volume. Big investors see value in established networks and infrastructure rather than speculative tokens, evidenced by significant flows into major assets.
Capital concentration is evident in the declining number of active investors, which fell -34.5% to 3,225. This drop likely represents the exit of tourists and crossover funds that dabbled in crypto during the bull market but lacked the conviction to stay through volatility.
If this trend holds, early-stage founders may face a liquidity crunch while Series B and C companies command premium valuations.
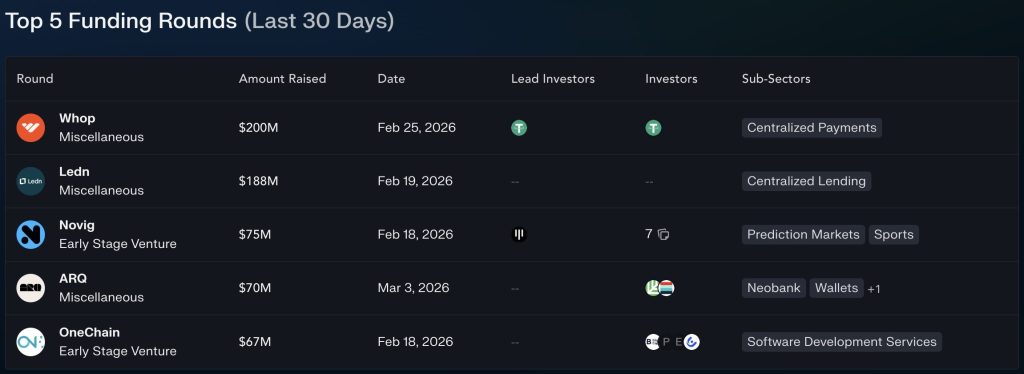
February’s data illustrates the trend perfectly. Just three fundraising events contributed 44% of the $795M raised that month. Tether injected $200M into the marketplace Whop, while stablecoin app ARQ secured $70M in a Series B led by Sequoia Capital.
Prediction markets are also attracting significant capital. Novig raised $75M in a round led by Pantera Capital. That sector heat recalls how competitors like Kalshi and Polymarket discuss fundraising at valuations hitting $2Bn. Investors are chasing platforms with clear revenue models and regulatory moats rather than governance tokens with vague utility.
Despite these massive checks, the monthly total of $795M represented a -65.3% drop from the previous 30 days. This volatility in monthly figures further highlights the reliance on a few mega-deals to prop up the aggregate numbers.
Outlook for the 2026 Crypto Funding Landscape: Bullish Times Ahead?
The funding environment suggests the industry is prepping for a wave of public listings. Pantera Capital predicts 2026 will be a breakout year for digital asset IPOs, with companies like Circle and Figure paving the way.
However, broad market conditions remain a factor. Stocks must stabilize against bond market risk for these high valuations to hold in public markets.
Moving forward, expect the line between crypto VCs and traditional finance to blur further. Banks like JPMorgan and heavyweights like Sequoia are taking seats at the table that were once reserved for the crypto-native firms that dominated funding from 2017-2022.
If the “fresh capital” Turner referenced does not enter the ecosystem soon, the innovation pipeline could stall, but for now, the money is following maturity.
EXPLORE: Best Crypto Presales to Buy in 2026
The post Crypto Funding Jumps +50% Year Over Year Despite Fewer Deals appeared first on Cryptonews.
The best adjustable dumbbells for upgrading your home workouts, reviewed by a PT

WTI Oil Price Rises Above $100

Luke Littler explains why he wants to meet Carlos Alcaraz at ‘Oscars of Sport’ awards ceremony


-

 Politics6 days ago
Alan Cumming Brands Baftas Ceremony A ‘Triggering S**tshow’
-
Business3 days ago
Form 8K Entergy Mississippi LLC For: 6 March
-

 Fashion3 days ago
Weekend Open Thread: Ann Taylor
-

 Tech4 days ago
Bitwarden adds support for passkey login on Windows 11
-
 Sports4 days ago
499 runs and 34 sixes later, India beat England to enter T20 World Cup final | Cricket News
-

 NewsBeat7 days ago
Is it acceptable to comment on the appearance of strangers in public? Readers discuss
-

 Sports2 days ago
Three share 2-shot lead entering final round in Hong Kong
-

 Sports1 day ago
Braveheart Lakshya downs Lai in epic battle to enter All England Open final | Other Sports News
-

 Business5 days ago
Guthrie Disappearance Enters Fifth Week as Family Visits Memorial
-

 Crypto World7 days ago
Why Nexo Is Reentering the US After the 2023 Crypto Lending Crackdown
-

 NewsBeat4 days ago
Piccadilly Circus just unveiled ‘London’s newest tourist attraction’ and it only costs 80p to enter
-

 Business18 hours ago
Search for Nancy Guthrie Enters 37th Day as FBI Probes Wi-Fi Jammer Theory
-

 Tech7 days ago
Cynus Chess Robot: A Chess Board With A Robotic Arm
-

 Entertainment2 days ago
Hailey Bieber Poses For Sexy Selfies In New Luscious Lip Thirst Traps
-

 Politics3 days ago
Top Mamdani aide takes progressive project to the UK
-
 NewsBeat7 days ago
Handcuffed presenter Jonathan Ross’ sweet admission about marriage to wife of 38 years
-
 Sports6 days ago
Jack Grealish posts new injury update as Man City star enters crucial period
-

 Crypto World5 days ago
New Crypto Mutuum Finance (MUTM) Reports V1 Protocol Progress as Roadmap Enters Phase 3
-

 Tech4 days ago
ACIP To Discuss COVID ‘Vaccine Injuries’ Next Month, Despite That Not Being In Its Purview
-
Entertainment4 days ago
Harry Styles Has ‘Struggled’ to Discuss Liam Payne’s Death