The initiative is now in its ninth year and has support many young people to move into managerial positions
14:02, 18 Mar 2026Updated 14:24, 18 Mar 2026
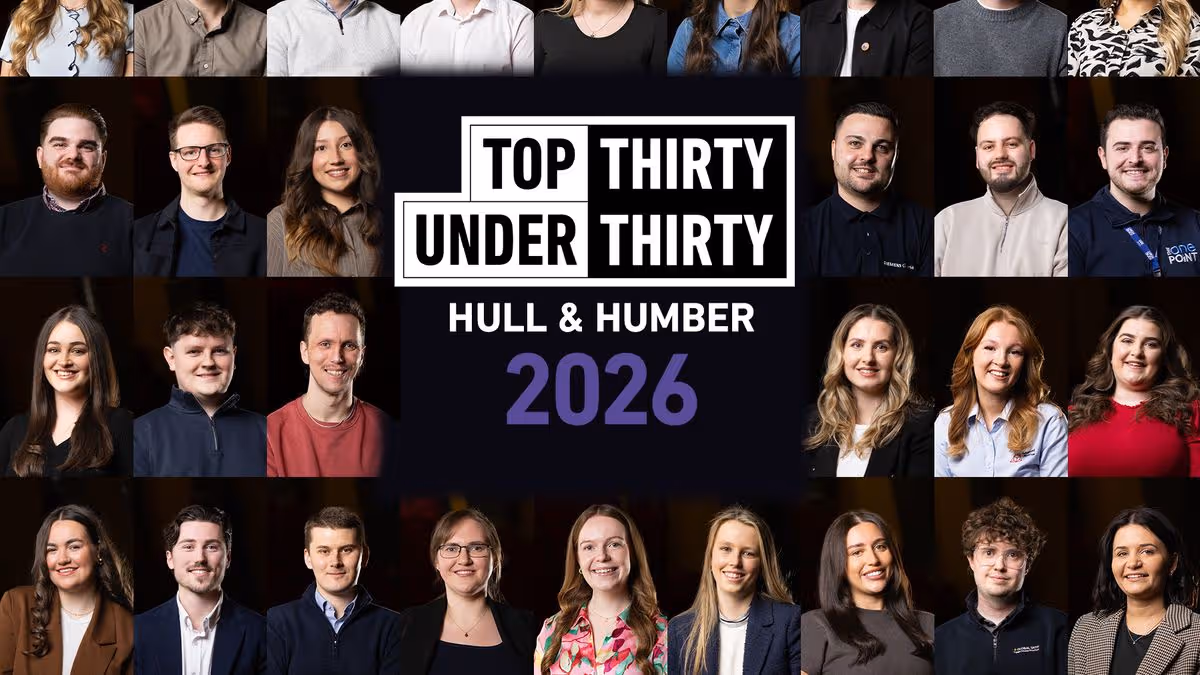
Hull and Humber 30 under 30 2026(Image: Simon Jones)
The 2026 list of the Hull and Humber Top 30 under 30 has been released, highlighting promising young professionals in a number of sectors. The ninth year of the training programme is designed to equip the selected young people with skills towards leadership pathways and ongoing professional development.
The scheme was launched in 2017 in a bid to recognise and support rising stars within businesses across the area. As part of the programme, each of the selected winners will undergo 12 months of development in line with the Leadership Excellence Acceleration Programme.
The process aims to equip each winner with the skills to become effective leaders, as well as providing an opportunity for businesses to recognise and invest in their own young talent.
Simon Jones, founder of Top 30 Under 30, said: “I am proud to announce this year’s winners, and our class of 2026. This year has seen us receive a record number of nominations, making the judging process the most difficult to date.
“Today, we celebrate the contribution of the region’s best young talent. This group have made a significant difference to their organisations, to their teams and to the local business community, and it is an honour to showcase who they are”
The programme provides winners the unique opportunity to further enhance their leadership skills, led by industry experts in leadership, self-development, and communication. It also campaigns to raise awareness around the various career opportunities that are available in the Humber area, including different pathways to success, and the range of professional industries that operate in the area.
Over its history, the initiative has supported 35 winners to become directors of organisations in the region, 14 heads of’ departments and more than 100 new managers. Organisers said that this year saw them receive a record number of nominations.
Mr Jones said: “By delivering the Top 30 Under 30s, we create an evidence-based narrative that helps shifts the often common perception that you need to leave the area to climb the career ladder, whereas in fact there are jobs, careers and progressive opportunities worth staying for.”
He added: “Seeing more organisations engaging with these awards is a positive sign for the future of our local economy, and our business community. We are upskilling and mobilising Hull and Humber’s future leaders, and I can’t wait to take this year’s winners on that journey.”
The winners are:
Lottie Almey, Events & General Donations Manager, Jon Egging Trust
Michael Atkin, Site Fuel Engineer, British Steel
George Baker, Compliance Manager, Pure Block Management Ltd
Michael Boland, Product Lead, Parallel
Sophie Broadhead, Customer Service Team Leader, Turner Price Ltd
Scarlet Bulmer, Regulatory Director, Rubicon Technical
Olly Burdett, Content and Design Executive, Future Humber
Sam Cassidy, Order Fulfilment Manager, Villeroy & Boch
Hannah Cochrane, Business Executive Assistant, Adams and Green Limited
Nathan Cocker, Material Planner, Bericap (Uk) Ltd
Phil Croft, Chemist, AAK
Heidi Donnison, Tourism Events & Projects Officer, East Riding of Yorkshire Council
Jack Drewry, Production Lead, Siemens Gamesa
Adam Griffiths, HR Specialist (Change and Recruitment), University of Hull
Jacob Hodgson, Helpdesk Team Leader, The One Point
Lucy Holland, Global Marketing Manager, Van Ameyde Marine
Tom Hornby, Product Analyst, Wren Kitchens
Chris Hughes, Control Design Engineer, Aldercote Limited
Abbie Jensen, Project Surveyor, Hull City Council
Ellie Kerins, Customer Service Liaison Officer, Advanced Plastics
Amy Leeman, Assistant HR Manager, Humber Bridge
Elena Martinez, Team Leader, Wescot Credit Services
Josh Milburn, Business Analyst, Rix Group
Tom Needler, Project Resource Manager, Boston Energy
Dainora Olechnovic, Shift Production Chemist, Phillips 66
Lucy Phillips, Research and Development Senior Associate, Reckitt
Jessica Pidgeon, Process Engineer, VPI
Zoi Sarris, Assistant Accountant, MKM Building Supplies
Jordan Stachan, R&D Engineer II, Smith+Nephew
Lucy Whyld, HR Manager UK & IE, Flora Group Ltd


You must be logged in to post a comment Login