Cardano’s price action closely follows Bitcoin’s, as the market has been rising higher after weeks of consolidation.
Meanwhile, ADA is seemingly bound even to outperform BTC in the short term, as technical analysis suggests.
By Edris Derakhshi (TradingRage)
The USDT Paired Chart
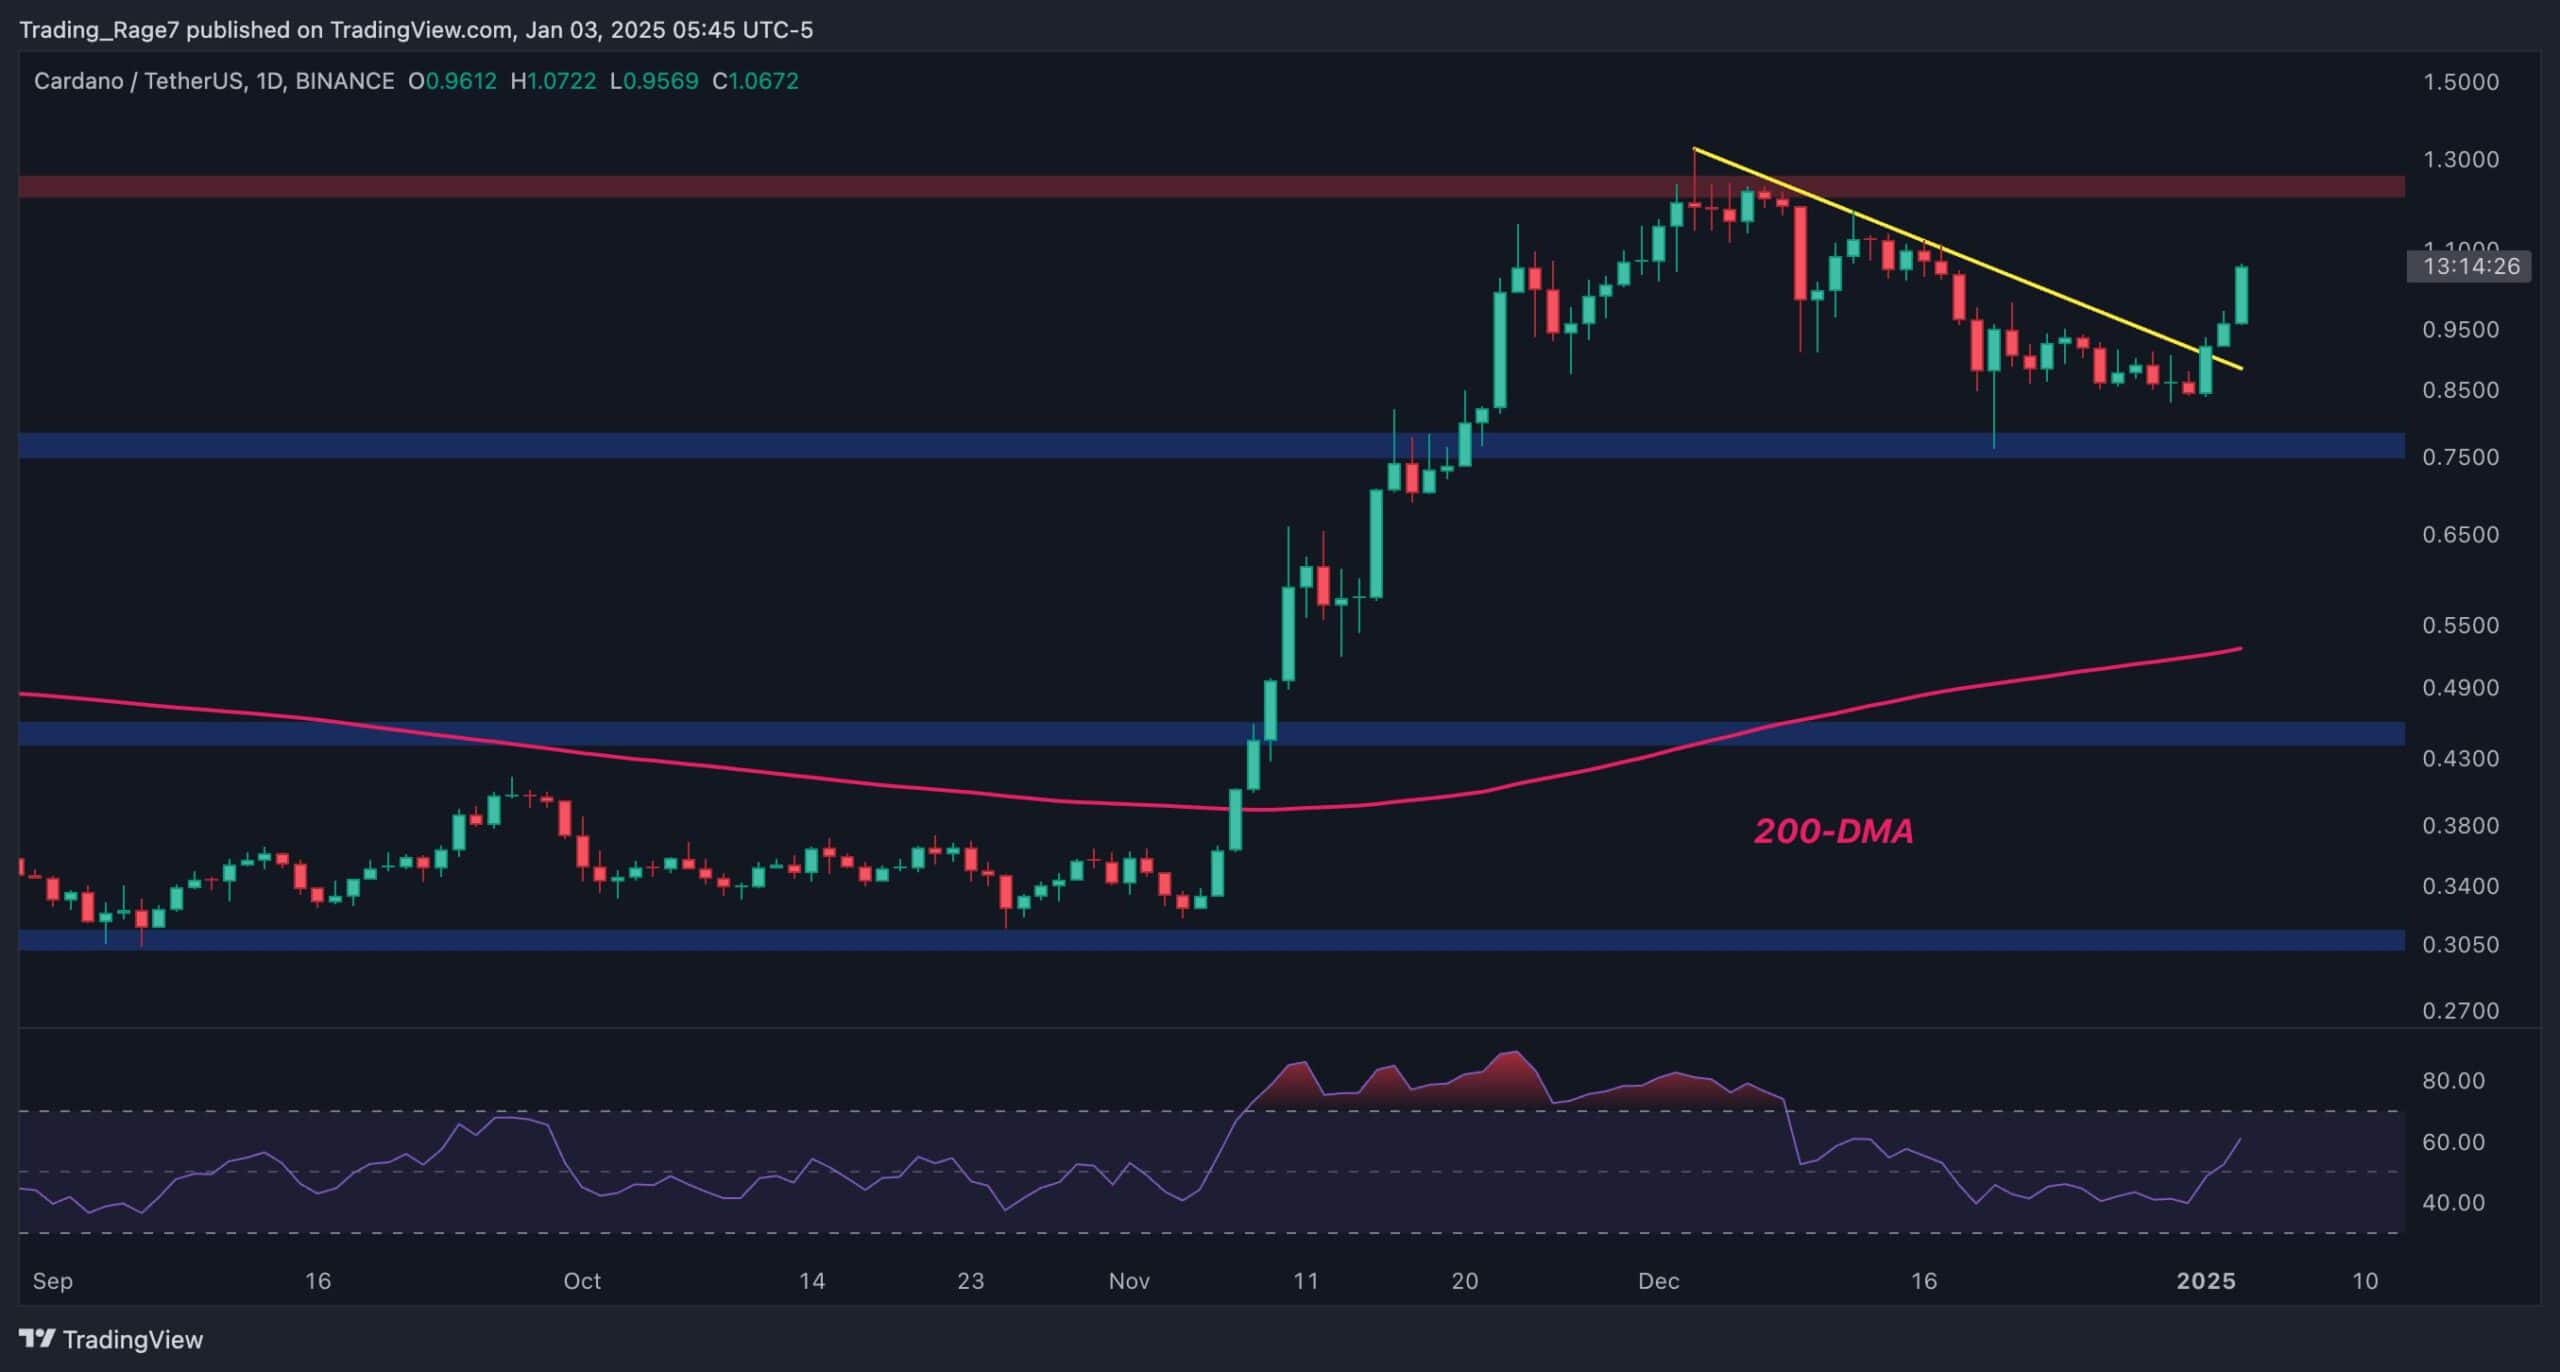
The BTC/USDT chart demonstrates a precise period of consolidation during December, as the market has also created a short-term bearish trendline.
However, a rebound from the $0.75 support zone has led to a breakout above the bearish trendline, which is likely to pave the way for the price to rally toward the $1.3 resistance level and even higher in the coming weeks.
The BTC Paired Chart
Looking at the ADA/BTC pair, it is evident that the market has climbed back above the 1,000 SAT zone after consolidating below it for a couple of weeks.
This makes the 1,000 SAT area a support zone again, which could push the price higher toward the 1,500 SAT resistance level in the coming days. With the 200-day moving average also following the higher price, ADA will likely begin a new rally soon against BTC.
Binance Free $600 (CryptoPotato Exclusive): Use this link to register a new account and receive $600 exclusive welcome offer on Binance (full details).
LIMITED OFFER for CryptoPotato readers at Bybit: Use this link to register and open a $500 FREE position on any coin!


+ There are no comments
Add yours