CryptoCurrency
Can Realized Cap HODL Waves Identify The Next Bitcoin Price Peak?


Bitcoin’s cyclical nature has captivated investors for over a decade, and tools like the Realized Cap HODL Waves offer a window into the psychology of the market. As an adaptation of the traditional HODL waves, this indicator provides crucial insights by weighting age bands by the realized price—the cost basis of Bitcoin held in wallets at any given time.
Currently, the six-month-and-below band sits at ~55%, signaling a market with room to grow before reaching overheated levels historically seen around 80%. In this article, we’ll dive into the details of Realized Cap HODL Waves, what they tell us about the market, and how investors can use this tool to better navigate Bitcoin’s price cycles.
When the 6-month and below #Bitcoin Realized Cap HODL Waves bands surpass ~80%, it's a good indication the market is over-heated, and a major price peak is likely… 🔥
Currently we're at around 55%, plenty of upside to go for #BTC!👆 pic.twitter.com/ZL5P7USMo9
— Bitcoin Magazine Pro (@BitcoinMagPro) December 12, 2024
Click here to view the Realized Cap HODL Waves live chart on Bitcoin Magazine Pro.
Understanding Realized Cap HODL Waves
At its core, the Realized Cap HODL Waves chart shows the cost basis of Bitcoin held in wallets, grouped into different age brackets. Unlike traditional HODL waves, which track the total supply of Bitcoin, this chart accounts for the realized value—a measure of the price at which Bitcoin was last moved.
The key insight? Younger age bands (e.g., coins held for six months or less) tend to dominate during bullish phases, reflecting rising market optimism. Conversely, older age bands gain prominence during bearish phases, often coinciding with market bottoms when investor sentiment is subdued.
This dynamic allows the chart to serve as a barometer for market cycles, identifying periods of overheating or underpricing with remarkable accuracy.
Why 80% Is Critical: Historical Context
The chart reveals that when short-term holders—represented by the six-month-and-below age bands—make up 80% or more of the total realized cap, Bitcoin is often nearing a major market peak. This level historically aligns with euphoric price action, where speculative mania drives the market.
For example:
- 2013 Bull Market: The six-month band surpassed 80% during Bitcoin’s meteoric rise, marking the peak of the cycle.
- 2017 Bull Market: A similar pattern occurred as Bitcoin reached its then-all-time high of $20,000.
- 2021 Bull Market: Peaks in the short-term bands preceded corrections, reinforcing the indicator’s predictive value.
At the current ~55% level, there is ample room for Bitcoin to grow before reaching the overheated territory historically seen near 80%.
What the Data Tells Us Today
The latest Chart of the Day, shared by Bitcoin Magazine Pro, underscores the importance of this indicator. Here are the key takeaways:
- Room for Growth: With the six-month-and-below bands at 55%, the market appears to be in a healthy growth phase with significant upside potential.
- No Overheating Yet: Historically, overheating occurs when these bands exceed 80%. This suggests Bitcoin has room to run before encountering similar conditions.
- Cycle Perspective: The current cycle aligns with early-to-mid-stage bull market behavior, where newer investors are accumulating, and optimism is building.
The ETF Effect: How Bitcoin ETFs Could Impact Realized Cap HODL Waves
Unlike previous Bitcoin cycles, 2024 marks a significant shift with the introduction of Bitcoin ETFs. These financial products, designed to provide institutional and retail investors easy exposure to Bitcoin, have the potential to reshape the on-chain data reported by tools like Realized Cap HODL Waves. While this indicator has historically been a reliable measure of market cycles and price peaks, the dynamics of this cycle may differ.
Bitcoin ETFs aggregate investments from numerous participants into centralized custodial wallets, reducing the number of active on-chain addresses and transactions. This centralization introduces unique challenges when interpreting Realized Cap HODL Waves:
- Younger Age Bands May Underestimate Market Activity: ETF trading occurs off-chain, meaning that short-term transactions and active addresses might be underrepresented in the six-month-and-below bands. As a result, the indicator could suggest less market enthusiasm than is actually present.
- Older Age Bands May Dominate: Long-term Bitcoin holdings within ETFs could shift realized value into higher age bands, making it appear that the market is more conservative and less dynamic than in previous cycles.
While ETFs bring increased liquidity and price discovery through traditional markets, they also introduce complexities for on-chain analysis. This shift highlights the importance of adapting how we interpret indicators like Realized Cap HODL Waves in the context of evolving market structures.
Why This Cycle May Be Different
With Bitcoin ETFs now playing a central role, this cycle may not follow the same patterns as previous ones. The historical success of Realized Cap HODL Waves in identifying price peaks remains noteworthy, but investors should consider that ETFs represent a new variable. Increased adoption via ETFs could lead to more significant price movements that are less directly visible in on-chain data.
As always, it’s crucial not to rely solely on one indicator for investment decisions. Tools like Realized Cap HODL Waves are best used to supplement broader market analysis, providing valuable insights into underlying market trends. By combining on-chain indicators with ETF inflow data and other metrics, investors can gain a clearer and more comprehensive understanding of Bitcoin’s price dynamics in this new era.
How Investors Can Use Realized Cap HODL Waves
For investors, the Realized Cap HODL Waves chart offers actionable insights:
- Market Sentiment: Use the six-month band as a gauge of market euphoria or fear. Higher percentages indicate bullish sentiment, while lower percentages often signal consolidation or accumulation phases.
- Cycle Timing: Peaks in younger age bands often precede corrections. Monitoring these levels can help investors manage risk during bullish cycles.
- Strategic Positioning: Understanding when the market is overheating can help long-term holders optimize their exit strategies, while buyers may find opportunities during periods dominated by older age bands.
Conclusion: Bullish Outlook with Room to Run
The Realized Cap HODL Waves chart is an invaluable tool for understanding Bitcoin’s price cycles. With the six-month-and-below bands currently at 55%, the market shows plenty of upside potential before hitting overheated levels. For investors, this means the current phase offers an attractive opportunity to capitalize on Bitcoin’s growth trajectory.
As always, it’s crucial to combine this indicator with other tools and fundamental analysis. To explore more live data and stay updated on Bitcoin’s price action, visit Bitcoin Magazine Pro.
Disclaimer: This article is for informational purposes only and should not be considered financial advice. Always do your own research before making any investment decisions.
CryptoCurrency
Martin Lewis issues update as banks slam DWP over account ‘spying’ under benefit fraud crackdown rules

Martin Lewis has issued a warning about changes to bank accounts from the Department for Work and Pensions (DWP).
Ministers have argued the change will speed up the debt recovery process and help contribute to a wider crackdown on benefits fraud.
The UK banking industry has raised concerns that the Government’s plan to tackle benefit fraud could put banks at risk of violating consumer protection rules.
Under the new law, the DWP can reclaim money from accounts without a court order. While ministers argue this will speed up debt recovery, UK Finance warns that it could undermine banks’ efforts to protect vulnerable customers.
Commenting on the changes, Lewis took to X and wrote: “Banks are (rightly) objecting to allowing DWP to take back benefits money directly via people’s bank account.
“YET I’ve never heard em object to the rule of Setting Off which allows banks to decide to directly take money from ur account to pay off another debt with them…” (sic)

Martin Lewis comments on banks concerns on DWP benefit debt recovery power under fraud crackdown
PA/GETTY
The Money Saving Expert highlighted that both situations involve “taking money from your bank account without permission”.
Responding to a man’s reply, Lewis added: “Ultimately for the individual both have same effect ie using position of power to make yourself priority creditor, when that may be destructive. For me, that is a valid comparison.”
The new law will be passed under the Public Authorities (Fraud, Error & Recovery) Bill, which aims to save £8.6billion over five years by cracking down on benefit fraud.
Privacy campaigners have described the measures as “one of the biggest attacks on welfare in a generation,” as the bill is set to give the DWP new powers to access bank statements of individuals suspected of benefit fraud and require banks to report potential violations of eligibility rules.
The DWP would be able to make banks take money directly from claimants’ accounts through “direct deduction orders.” Banks could charge fees to process these deductions.
Before taking any money, the DWP must check the claimant’s bank statements for the past three months and ensure the deduction won’t make it hard for them to cover basic living costs. The new rules mainly target people who are no longer receiving benefits or who are self-employed.
This new system will first be tested by a few banks and building societies before being fully rolled out in 2029. Banks have quietly opposed these plans for over a year, and this is their first public objection.
Under the new rules, banks would need to flag accounts showing foreign activity or holding more than £16,000 (the Universal Credit savings limit).
Banks would be required to share account holders’ details, including names, dates of birth and account numbers, in cases where benefits may have been incorrectly paid.
UK Finance, representing major British banks, has warned that the new powers could force banks to breach their existing consumer protection obligations.
LATEST DEVELOPMENTS:
Daniel Cichocki, director in economic crime and policy strategy at UK Finance, said the plans need further examination to ensure they don’t “create risks for vulnerable customers, or conflict with existing regulatory and legal obligations”.
The banking group specifically highlighted potential conflicts with the Financial Conduct Authority’s consumer duty, introduced in 2023.
This duty requires banks to maintain higher standards for consumer protection, with specific obligations to protect financially vulnerable customers. Banks face penalties from the FCA or financial ombudsman if they breach these protection rules.
While supporting anti-fraud efforts in principle, UK Finance called for more focus on preventing fraud from entering the benefits system initially.
Work and Pensions Secretary Liz Kendall said the new powers would include “new and important safeguards”, including annual reviews by an independent body.
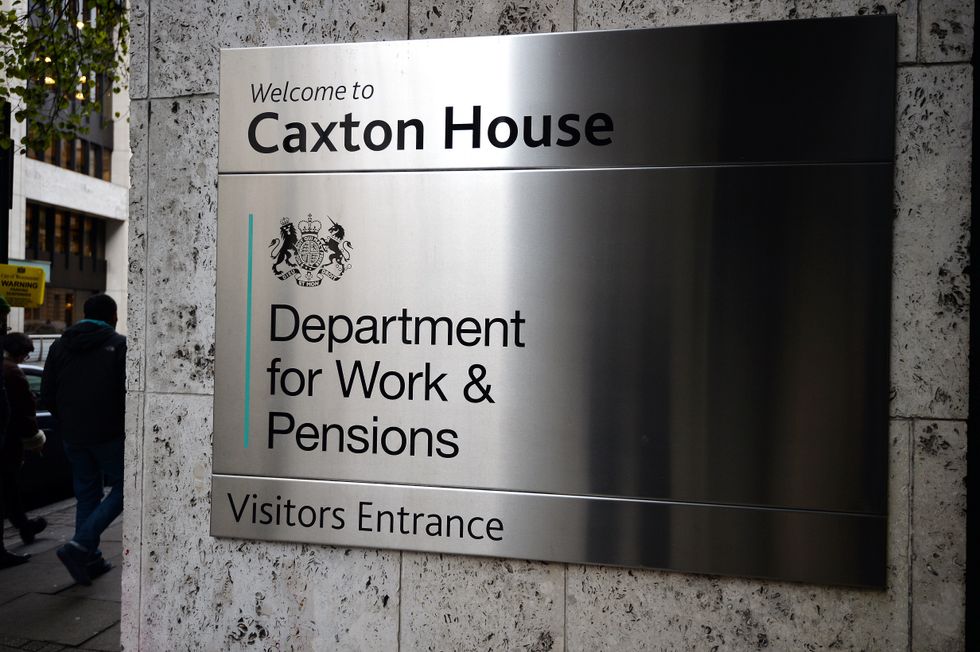 The DWP is is line to be awarded new powers Getty
The Government argues these measures will speed up debt recovery and contribute to tackling benefit fraud, which amounted to £7.4billion last year – around 2.8 per cent of total welfare spending. A further £1.6billion was overpaid due to claimant errors, while £800million resulted from DWP mistakes.
Officials say the powers would help reclaim funds from those no longer on benefits or self-employed individuals while easing pressure on the court system.
The DWP maintains that while they can request bank statements, they will not have direct access to bank accounts. They estimate these measures could save taxpayers around £500million annually once fully implemented.
Privacy campaigners have branded the measures “one of the biggest assaults on welfare in a generation” as the bill is set to grant the DWP new powers to obtain bank statements from individuals suspected of benefit fraud and require banks to flag potential breaches of eligibility rules.
CryptoCurrency
Coinbase CEO Advocates for Bitcoin Reserves, ‘Better Than Gold’

Armstrong’s comment trails the South African Reserve Bank Governor Lesetja Kganyago rebuffing any claims of the crypto asset as a national reserve. He asked what strategic benefit Bitcoin has, considering history was replete with gold as a store of value.
Armstrong has argued that Bitcoin could outperform gold in a decade. He noted Bitcoin’s $2 trillion market cap already makes up 11% of gold’s $18 trillion value. He suggested countries consider allocating a similar portion of their gold reserves to Bitcoin.
This debate took center stage at the World Economic Forum in Davos, where Kganyago opposed industries lobbying for specific assets without clear public policy benefits. Armstrong then cited Bitcoin’s decade-long performance as the best-performing asset and asked for gradual adoption by governments.
In the U.S., Bitcoin reserves are gaining momentum. Wyoming, Texas, and Massachusetts are pushing legislation to classify Bitcoin as a strategic asset. At least 15 other states, including Ohio and Pennsylvania, are considering similar measures.
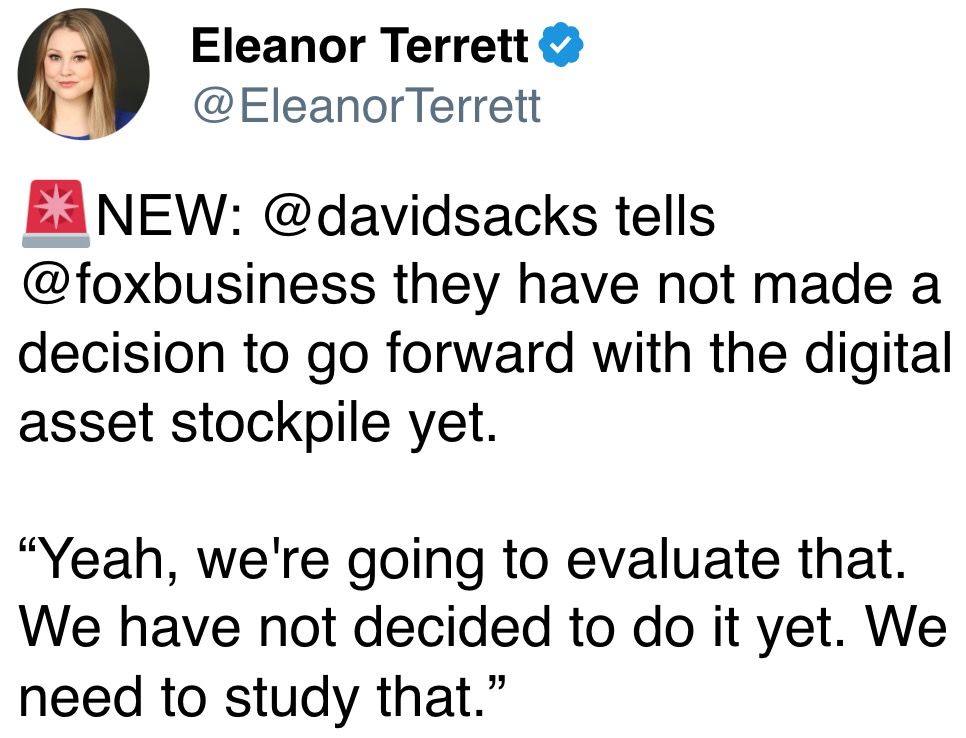
Additionally, an executive order issued by Donald Trump recently seeks to create a “national digital asset stockpile” to show the probable shift in monetary strategy by the United States. The call comes amidst debate by Armstrong about the future monetary systems position of Bitcoin globally.
CryptoCurrency
Medical device maker Semler Scientific seeks $75m in convertible notes to buy more Bitcoin


Semler Scientific seeks $75 million through a private offering of convertible senior notes, intending to use a portion for Bitcoin investments.
Public medial device maker Semler Scientific announced plans to offer $75 million in convertible senior notes, with a portion of the funds set aside for purchasing Bitcoin (BTC). The offering will be made to qualified institutional buyers under Rule 144A of the Securities Act, the company said in a Jan. 23 press release.
The notes will be due in 2030 and will earn interest every six months. When converted, Semler Scientific can pay in cash, shares, or both. The final details, like the interest rate and conversion terms, will be set when the notes are priced, the press release reads.
A key part of this offering includes “capped call transactions” to help protect the company’s stock from dilution. These transactions aim to reduce the impact of converting the notes. If the buyers decide to purchase more notes, more capped calls will be made.
The Santa Clara-headquartered company says it plans to use some of the proceeds to cover the costs of these capped call transactions. The rest will go toward general corporate purposes, including the “acquisition of Bitcoin.”
According to data from BitBo, Semler Scientific owns 2,321 BTC, worth over $244 million, or 0.011% of Bitcoin’s total supply. The company first revealed its Bitcoin treasury plans in May 2024, and since then, its shares under the ticker SMLR have risen by more than 140%, according to Google Finance data.
CryptoCurrency
Pro-XRP Attorney Outlines 3 Possible Scenarios for the Ripple v. SEC Lawsuit

TL;DR
What Might Come Next?
Gary Gensler’s tenure at the US Securities and Exchange Commission (SEC) might be over, but the lawsuit against Ripple remains ongoing. The former Chairman resigned on January 20 (the day Donald Trump officially became America’s 47th President) and was replaced by Mark Uyeda.
Gensler was considered an enemy of the cryptocurrency industry, while his successor stands in the opposite corner. Last year, Uyeda criticized the SEC’s previous leadership for its negative stance on the sector:
“The Commission’s war on crypto must end, including crypto enforcement actions solely based on a failure to register with no allegation of fraud or harm.”
The XRP Army has interpreted the changes as a positive factor that could lead to a faster and potentially favorable resolution in the Ripple case. Most recently, John Deaton (an American lawyer representing thousands of XRP investors in the lawsuit) also gave his two cents.
He believes there are now three possible scenarios. The first involves continuing the SEC’s appeal. The securities regulator opposed a verdict from 2023 when Judge Torres ruled that XRP sales on public exchanges to retail investors did not constitute securities transactions.
The second option is a dismissal of the appeal. According to him, this would require Ripple to pay the previously ordered $125 million penalty. Recall that Judge Torres ruled that the company should settle the amount due to violating certain rules.
While the figure sounds substantial, it actually represents just a fraction of the $2 billion the watchdog initially asked for. Somewhat expected, many Ripple proponents viewed the decision as a major victory, while some of the company’s executives promised to respect the court’s ruling.
The third scenario seems like the most favorable (and most unlikely) for Ripple. According to Deaton, this includes the SEC withdrawing its appeal and scrapping the firm’s $125 million fine.
“I don’t see the SEC saying: “No, we’re going to deny a judge’s ruling.” So that’s why I think the middle one is the option.”
The SEC Looks Like the Underdog
Despite not outlining when the case might be officially over, Deaton believes Ripple’s victory is just a matter of time. He based his thesis on the fact that the current President of the USA – Donald Trump – has completely changed his stance on the digital asset sector, planning to make the country the crypto capital of the world.
Last week, he doubled down on his supposed affection for the industry, launching a meme coin of his own. At first, the token, called Official Trump (TRUMP), experienced a spectacular price increase before heading south.
Most recently, Trump signed an executive order to review the creation of a “National Digital Asset Stockpile.” His initial intention was to establish a strategic BTC reserve in the US, but now the effort’s scope seems to have expanded to other cryptocurrencies, too.
Binance Free $600 (CryptoPotato Exclusive): Use this link to register a new account and receive $600 exclusive welcome offer on Binance (full details).
LIMITED OFFER for CryptoPotato readers at Bybit: Use this link to register and open a $500 FREE position on any coin!
CryptoCurrency
Uniswap Aims For Recovery – Bulls Take A Stand At $12.3 Support

My name is Godspower Owie, and I was born and brought up in Edo State, Nigeria. I grew up with my three siblings who have always been my idols and mentors, helping me to grow and understand the way of life.
My parents are literally the backbone of my story. They’ve always supported me in good and bad times and never for once left my side whenever I feel lost in this world. Honestly, having such amazing parents makes you feel safe and secure, and I won’t trade them for anything else in this world.
I was exposed to the cryptocurrency world 3 years ago and got so interested in knowing so much about it. It all started when a friend of mine invested in a crypto asset, which he yielded massive gains from his investments.
When I confronted him about cryptocurrency he explained his journey so far in the field. It was impressive getting to know about his consistency and dedication in the space despite the risks involved, and these are the major reasons why I got so interested in cryptocurrency.
Trust me, I’ve had my share of experience with the ups and downs in the market but I never for once lost the passion to grow in the field. This is because I believe growth leads to excellence and that’s my goal in the field. And today, I am an employee of Bitcoinnist and NewsBTC news outlets.
My Bosses and co-workers are the best kinds of people I have ever worked with, in and outside the crypto landscape. I intend to give my all working alongside my amazing colleagues for the growth of these companies.
Sometimes I like to picture myself as an explorer, this is because I like visiting new places, I like learning new things (useful things to be precise), I like meeting new people – people who make an impact in my life no matter how little it is.
One of the things I love and enjoy doing the most is football. It will remain my favorite outdoor activity, probably because I’m so good at it. I am also very good at singing, dancing, acting, fashion and others.
I cherish my time, work, family, and loved ones. I mean, those are probably the most important things in anyone’s life. I don’t chase illusions, I chase dreams.
I know there is still a lot about myself that I need to figure out as I strive to become successful in life. I’m certain I will get there because I know I am not a quitter, and I will give my all till the very end to see myself at the top.
I aspire to be a boss someday, having people work under me just as I’ve worked under great people. This is one of my biggest dreams professionally, and one I do not take lightly. Everyone knows the road ahead is not as easy as it looks, but with God Almighty, my family, and shared passion friends, there is no stopping me.
CryptoCurrency
Crypto Daybook Americas: Bitcoin Whipsaws as Risk Assets Get Feel-Good Boost
By James Van Straten (All times ET unless indicated otherwise)
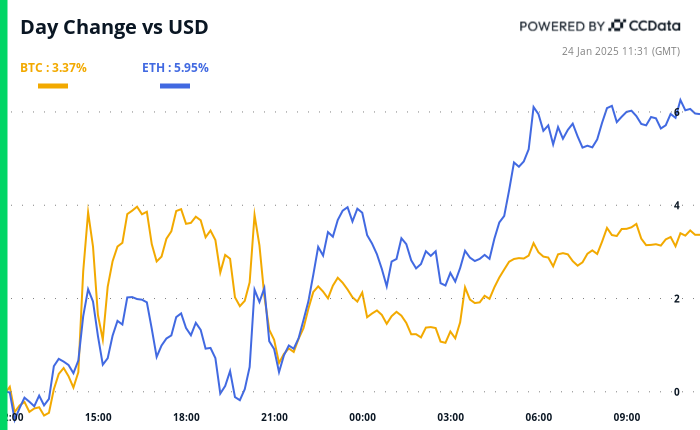
The past 24 hours have been among the most hectic in the crypto industry for years, and this was reflected in Thursday’s bitcoin (BTC) price, which whipsawed 2% to 3% multiple times in a matter of minutes. Still, it managed to stay above the psychological $100,000 level and is is currently around $105,000.
President Trump’s rhetoric is continuing to help weaken the dollar, which generally boosts risk assets such as cryptocurrencies. The DXY index, a measure of the U.S. currency against a basket of major trade partners, has dropped to the lowest since Dec. 17, so that should give risk-on assets a feel-good boost. U.S. bond yields and WTI crude oil are also heading down, with oil below $75 a barrel, the lowest in two weeks.
On the other side of the world, the Bank of Japan (BoJ) delivered on its promise with another interest-rate increase, taking the policy rate to 0.50%, the highest in more than 16 years. That followed a very hot inflation print, with headline inflation of 3.6% from the previous year, the fastest since January 2023. The question is whether we will get a second iteration of the yen carry trade unwind that occurred in August of last year. Time will tell. Stay alert!
What to Watch
Crypto:
Jan. 25: First deadline for SEC decisions on proposals for four spot solana ETFs: Bitwise Solana ETF, Canary Solana ETF, 21Shares Core Solana ETF and VanEck Solana Trust, which are all sponsored by Cboe BZX Exchange.
Jan. 29: Ice Open Network (ION) mainnet launch.
Feb. 4: MicroStrategy Inc. (MSTR) Q4 FY 2024 earnings report.
Feb. 4: Pepecoin (PEPE) halving. At block 400,000, the reward will drop to 31,250 pepecoin.
Feb. 5, 3:00 p.m.: Boba Network’s Holocene hard fork network upgrade for its Ethereum-based L2 mainnet.
Macro
Jan. 24, 4:00 a.m.: S&P Global releases January 2025 eurozone HCOB Purchasing Managers’ Index (Flash) reports.
Composite PMI Est. 49.7 vs. Prev. 49.6.
Manufacturing PMI Est. 45.3 vs. Prev. 45.1.
Services PMI Est. 51.5 vs. Prev. 51.6.
Jan. 24, 4:30 a.m.: S&P Global releases January 2025’s U.K. Purchasing Managers’ Index (Flash) reports.
Composite PMI Est. 50 vs. Prev. 50.4.
Manufacturing PMI Est. 47 vs. Prev. 47.
Services PMI Est. 50.9 vs. Prev. 51.1.
Jan. 24, 9:45 a.m.: S&P Global releases January 2025’s U.S. Purchasing Managers’ Index (Flash) reports.
Composite PMI Prev. 55.4.
Manufacturing PMI Est. 49.6 vs. Prev. 49.4.
Services PMI Est. 56.5 vs. Prev. 56.8.
Jan. 24, 10:00 a.m.: The University of Michigan releases January U.S. consumer sentiment data.
Index of Consumer Sentiment (Final) Est. 73.2 vs. Prev. 74.
Token Events
Governance votes & calls
Frax DAO is discussing a $5 million investment in World Liberty Financial (WLFI), the crypto project backed by the family of President Donald Trump.
Jan. 24: Arbitrum BoLD’s activation vote deadline. BoLD allows anyone to participate in validation and defend against malicious claims to an Arbitrum chain’s state.
Jan. 24: Hedera (HBAR) is hosting a community call at 11 a.m.
Unlocks
Jan. 31: Optimism (OP) to unlock 2.32% of circulating supply worth $52.9 million.
Jan. 31: Jupiter (JUP) to unlock 41.5% of circulating supply worth $626 million.
Conferences:
Day 12 of 12: Swiss WEB3FEST Winter Edition 2025 (Zug, Zurich, St. Moritz, Davos)
Day 5 of 5: World Economic Forum Annual Meeting (Davos-Klosters, Switzerland)
Day 1 of 2: Adopting Bitcoin (Cape Town, South Africa)
Jan. 25-26: Catstanbul 2025 (Istanbul). The first community conference for Jupiter, a decentralized exchange (DEX) aggregator built on Solana.
Jan. 30, 12:30 p.m. to 5:00 p.m.: International DeFi Day 2025 (online)
Jan 30-31: Plan B Forum (San Salvador, El Salvador)
Jan. 30 to Feb. 4: The Satoshi Roundtable (Dubai)
Feb. 3: Digital Assets Forum (London)
Feb. 5-6: The 14th Global Blockchain Congress (Dubai)
Feb. 6: Ondo Summit 2025 (New York).
Feb. 7: Solana APEX (Mexico City)
Feb. 13-14: The 4th Edition of NFT Paris.
Feb. 18-20: Consensus Hong Kong
Feb. 19: Sui Connect: Hong Kong
Feb. 23 to March 2: ETHDenver 2025 (Denver)
Feb. 25: HederaCon 2025 (Denver)
Token Talk
By Shaurya Malwa
A humorous new decentralized autonomous organization, FartStrategy (FSTR) DAO, is investing user funds into FARTCOIN.
The DAO is leveraging borrowed SOL to acquire the token, offering investors a chance to gain exposure to its price movements through FSTR.
If FSTR trades below its FARTCOIN backing, token holders can vote to dissolve the DAO, redeeming their share of FARTCOIN proportionally after settling any outstanding debts.
The VINE memecoin jumped to a $200 million market capitalization less than 48 hours after issuance.
It was launched on the Solana blockchain by Rus Yusupov, one of the co-founders of the original Vine app, and introduced as a nostalgic tribute to the eponymous platform known for its six-second looping videos. Vine was a significant cultural phenomenon before closing in 2017.
There have been recent discussions around potentially reviving the app, with Yusupov and technocrat Elon Musk expressing interest in its return.
Derivatives Positioning
TRX leads growth in perpetual futures open interest in major coins.
Funding rates for majors remain below an annualized 10%, a sign the market isn’t overly speculative despite BTC trading near record highs on optimism about Trump’s crypto policies.
BTC and ETH call skews have firmed up, with block flows featuring outright longs in higher strike BTC calls and a bull call spread in ETH, involving calls at strikes $5K and $6K.
Market Movements:
BTC is up 2 % from 4 p.m. ET Thursday to $105,450.57 (24hrs: +3.43%)
ETH is up 4.96% at $3,409.62 (24hrs: +6.18%)
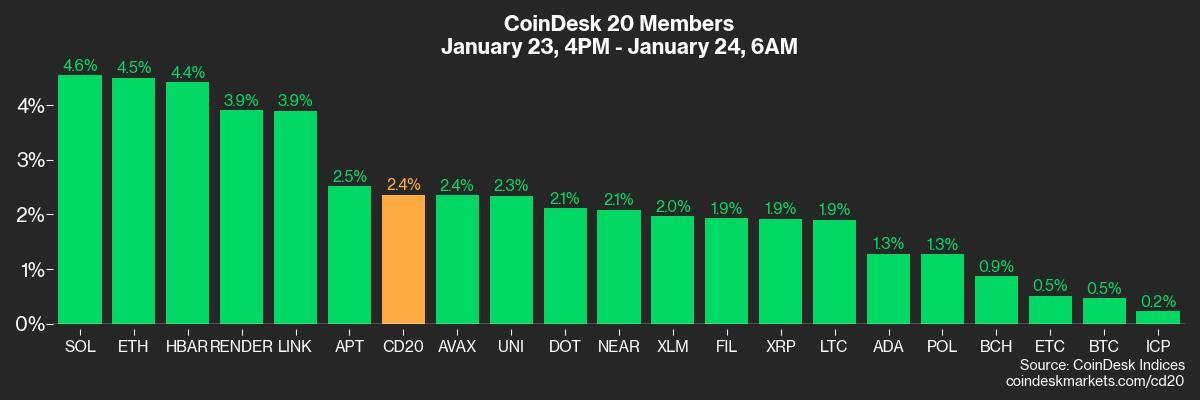
CoinDesk 20 is up 2.4% to 3,988.16 (24hrs: +4.79%)
CESR Composite Staking Rate is up 1 bp to 3.16%
BTC funding rate is at 0.0069% (7.58% annualized) on Binance
DXY is down 0.48% at 107.53
Gold is up 0.68% at $2,775.28/oz
Silver is up 1.21% to $30.86/oz
Nikkei 225 closed unchanged at 39,931.98
Hang Seng closed +1.86% to 20,066.19
FTSE is down 0.33% at 8,537.12
Euro Stoxx 50 is up 0.73% at 5,255.47
DJIA closed on Thursday +0.92% to 44,565.07
S&P 500 closed +0.53 at 6,118.71
Nasdaq closed +0.22% at 20,053.68
S&P/TSX Composite Index closed +0.48% at 25,434.08
S&P 40 Latin America closed +0.57% at 2,310.35
U.S. 10-year Treasury was down 13 bps at 4.64%
E-mini S&P 500 futures are down 0.13% at 6,143.75
E-mini Nasdaq-100 futures are down 0.56% at 22,005.50
E-mini Dow Jones Industrial Average Index futures are unchanged at 44,709.00
Bitcoin Stats:
BTC Dominance: 58.51 (-0.11%)
Ethereum to bitcoin ratio: 0.032 (0.68%)
Hashrate (seven-day moving average): 784 EH/s
Hashprice (spot): $61.0
Total Fees: 6.8 BTC/ $104,070
CME Futures Open Interest: 191,645
BTC priced in gold: 38.1 oz
BTC vs gold market cap: 10.83%
Technical Analysis
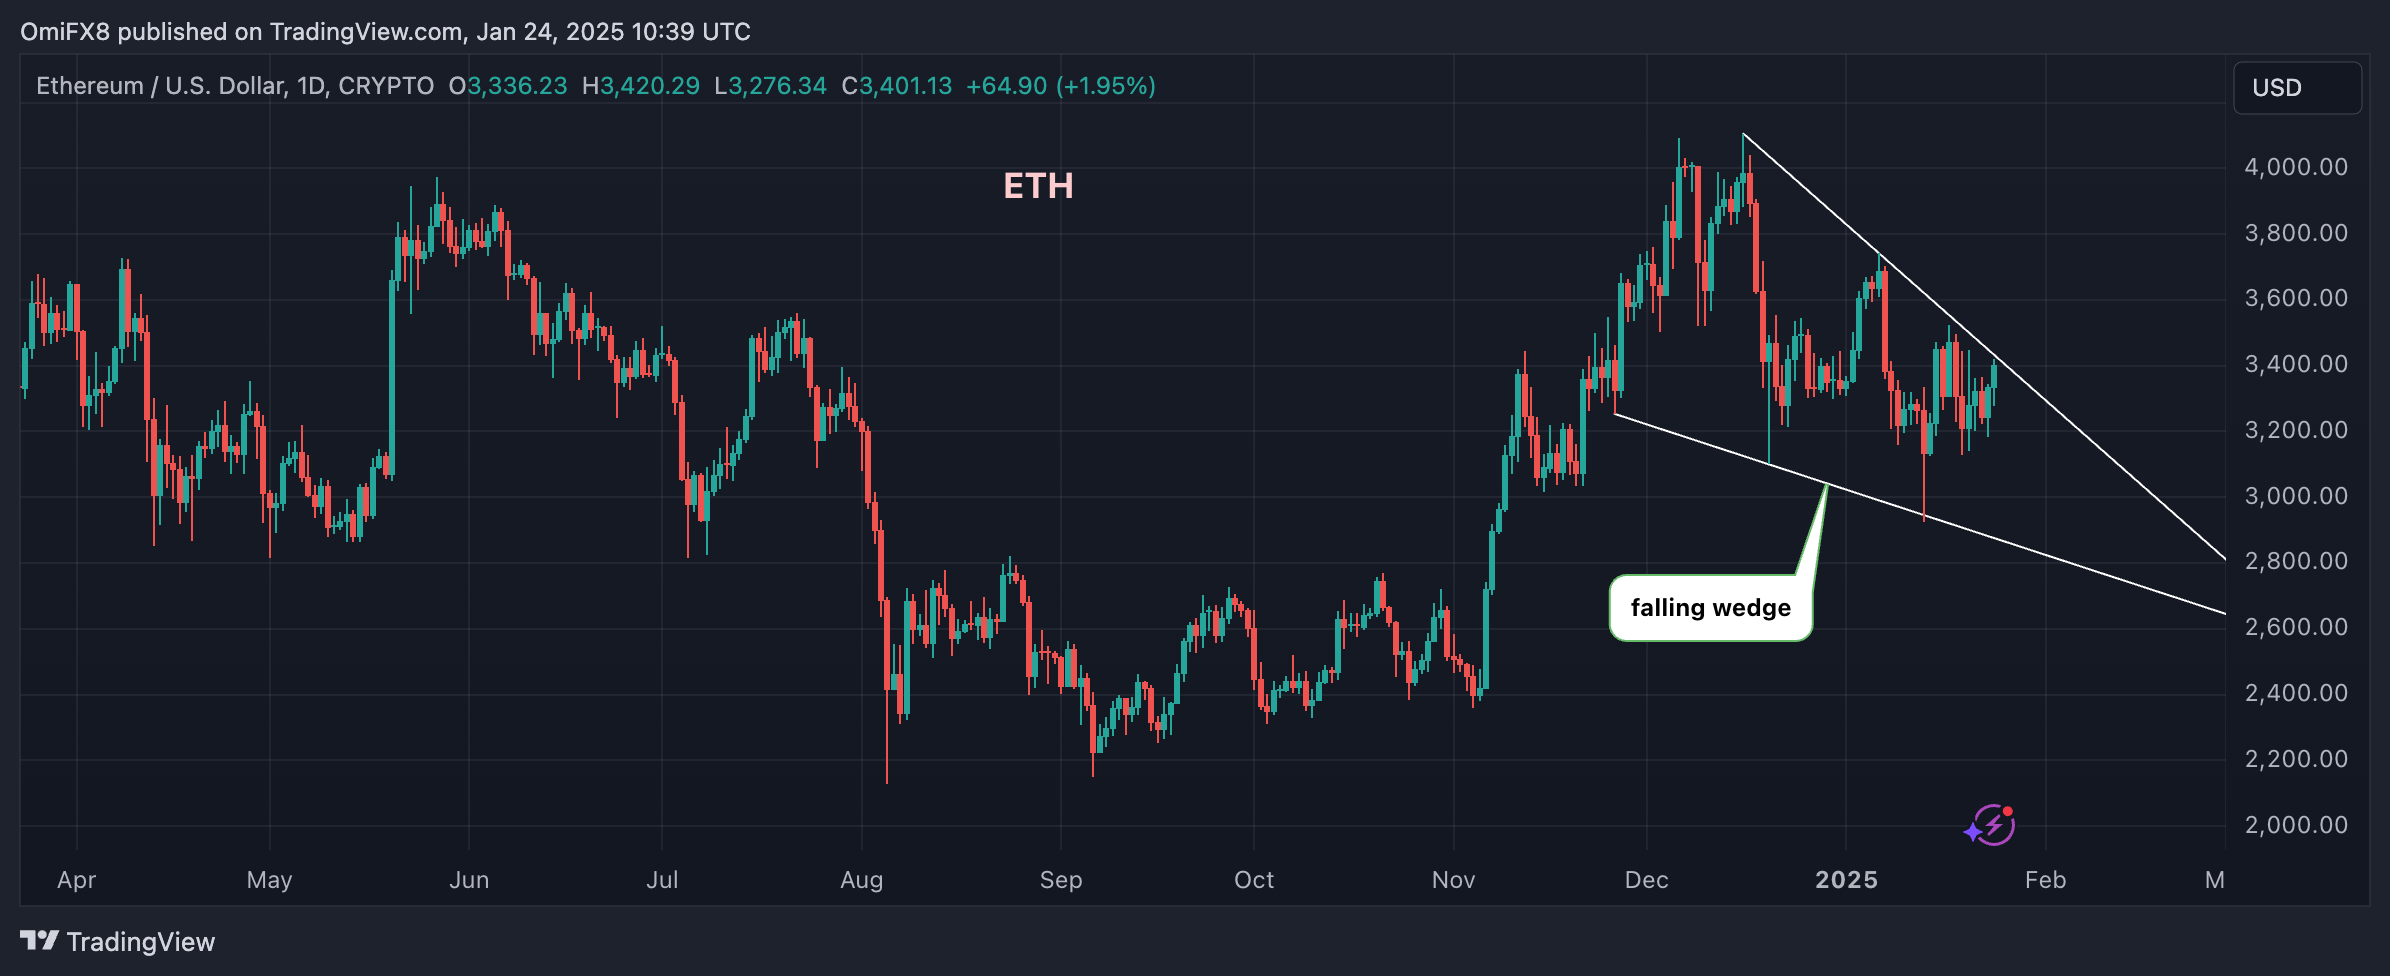
Ether seems have chalked out a falling wedge pattern, characterized by two converging trendlines, representing a series of lower highs and lower lows.
The converging nature of trendlines indicates that sellers are slowly losing grip.
A breakout is said to represent a bullish trend reversal.
Crypto Equities
MicroStrategy (MSTR): closed on Thursday at $373.12 (-1.11%), up 2.55% at $382.62 in pre-market.
Coinbase Global (COIN): closed at $296.01 (+0.05%), up 2.16% at $302.39 in pre-market.
Galaxy Digital Holdings (GLXY): closed at C$33.94 (+3.44%)
MARA Holdings (MARA): closed at $19.95 (+1.32%), up 1.8% at $20.31 in pre-market.
Riot Platforms (RIOT): closed at $12.99 (-1.14%), up 2.62% at $13.33 in pre-market.
Core Scientific (CORZ): closed at $16.34 (+2.32%), up 1.04% at $16.51 in pre-market.
CleanSpark (CLSK): closed at $11.41 (+2.42%), up 2.19% at $11.67 in pre-market.
CoinShares Valkyrie Bitcoin Miners ETF (WGMI): closed at $25.65 (+0.47%), up 1.75% at $26.10 in pre-market.
Semler Scientific (SMLR): closed at $61.15 (-1.55%), down 10.89% at $54.49 in pre-market.
Exodus Movement (EXOD): closed at $44 (+7.32%), up 0.75% at $44.33 in pre-market.
ETF Flows
Spot BTC ETFs:
Daily net flow: $188.7 million
Cumulative net flows: $39.42 billion
Total BTC holdings ~ 1.169 million.
Spot ETH ETFs
Daily net flow: -$14.9 million
Cumulative net flows: $2.79 billion
Total ETH holdings ~ 3.663 million.
Source: Farside Investors
Overnight Flows
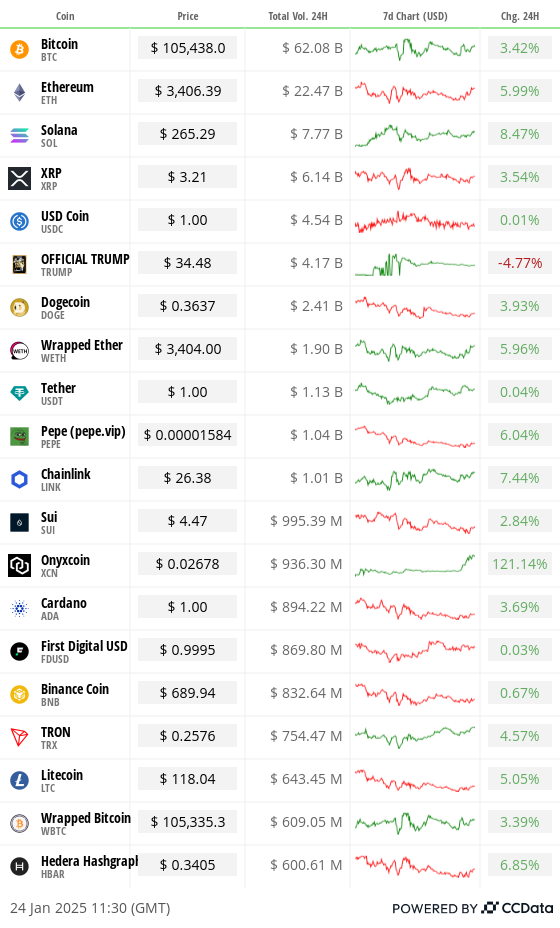
Chart of the Day
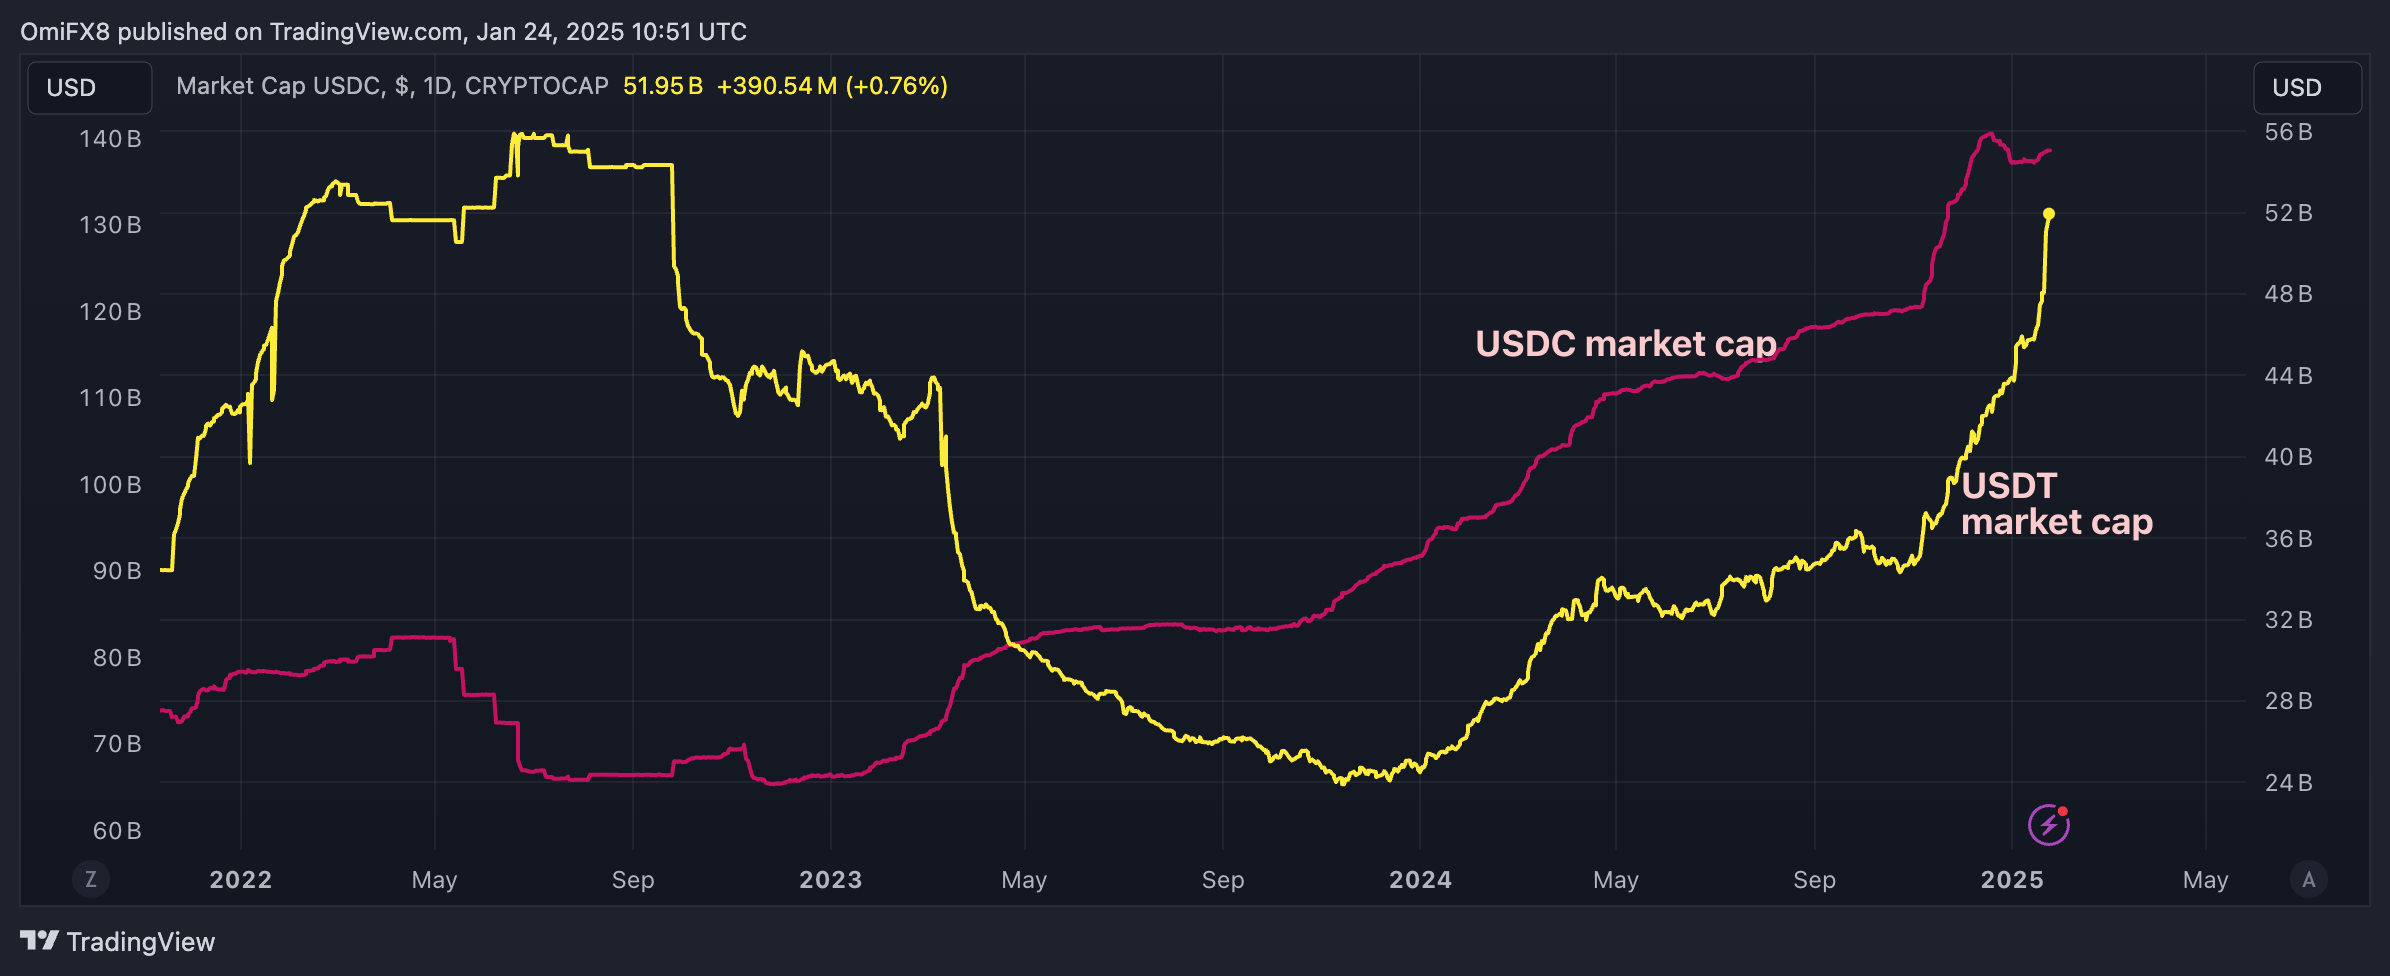
The market capitalization of Tether’s USDT, the world’s largest dollar-pegged stablecoin, has flattened near $138 billion.
The USDC supply continues to increase and has risen to nearly $52 billion this week, the highest since September 2022.
While You Were Sleeping
Bitcoin Steady Near $104K After Bank of Japan Delivers Hawkish Rate Hike (CoinDesk): Bitcoin held steady above $104,000 in early Asian hours Friday despite the Bank of Japan’s rate hike as markets eyed President Trump’s Thursday executive order on crypto and potential U.S. policy changes.
Trump Issues Crypto Executive Order to Pave U.S. Digital Assets Path (CoinDesk): President Trump issued a pro-crypto executive order, directing the creation of a digital asset framework, banning CBDC development and considering a national digital asset reserve.
Vitalik Buterin Calls for Added Focus on Ether as Part of the Network’s Scaling Plans (CoinDesk): In a Thursday post, Ethereum co-founder Vitalik Buterin outlined strategies to boost the value of ether including using it as collateral, implementing fee-burning incentives and increasing temporary transaction data called blobs.
Japan Hikes Rates, Solidifying Exit From Rock-Bottom Borrowing Costs (Bloomberg): The Bank of Japan raised its key rate by 25 basis points to 0.5% on Friday, the highest in 17 years, strengthening the yen and lifting 10-year bond yields to 1.23%.
U.S. Stocks at Most Expensive Relative to Bonds Since Dotcom Era (Financial Times): Stocks in the S&P 500 hit record valuations, with the equity risk premium turning negative for the first time since 2002 driven by soaring demand for dominant tech companies.
Trump 2.0 Is Going Well for China So Far. Can the Honeymoon Last? (CNN): In a Thursday interview, President Trump called tariffs a “tremendous power” but suggested deals could avert tougher measures. Beijing cautiously welcomed the reprieve, eyeing negotiations while bracing for future tensions.
In the Ether


CryptoCurrency
SEC Rescinds SAB 121, Permitting Banks to Custody Bitcoin


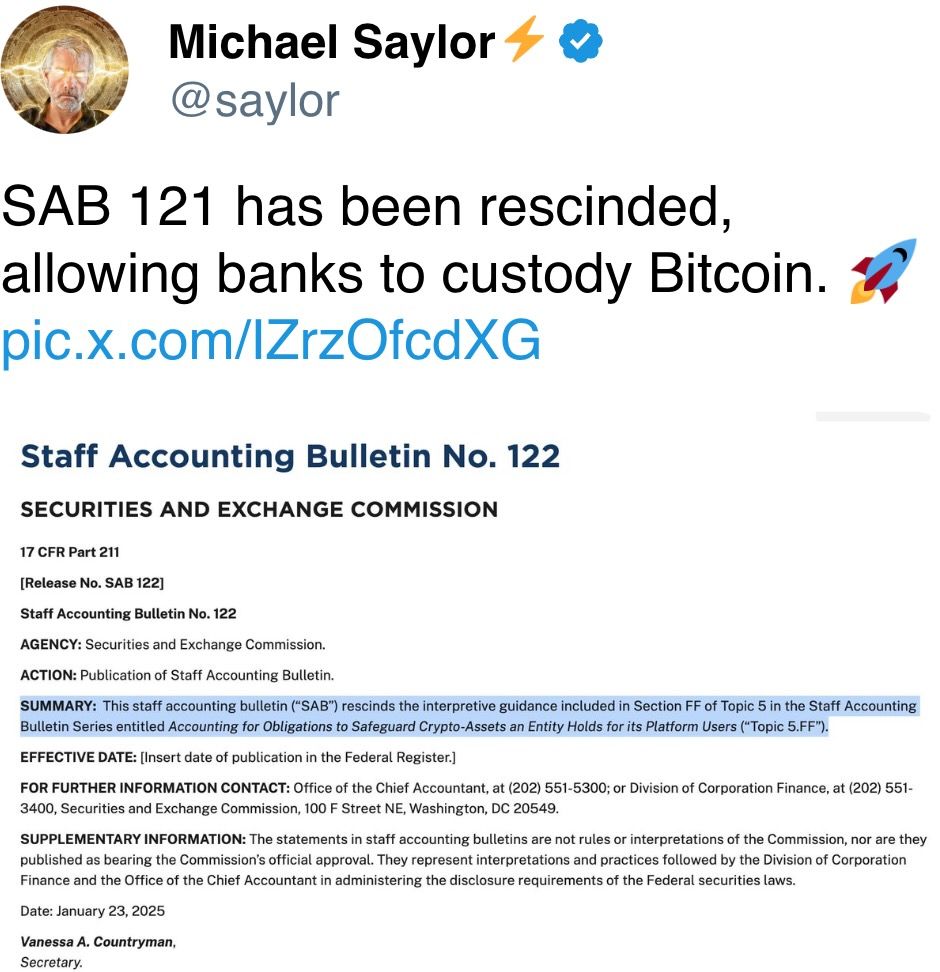
In a landmark decision, the U.S. Securities and Exchange Commission (SEC) has officially rescinded Staff Accounting Bulletin (SAB) No. 121, a controversial rule that had long hindered banks from offering bitcoin and crypto custody services. This move, announced on Thursday, signals a significant shift in the SEC’s approach to regulating bitcoin and crypto and paves the way for greater financial integration.
BREAKING: 🇺🇸 SEC OFFICIALLY RESCINDS SAB 121, WHICH PREVENTED BANKS FROM CUSTODYING #BITCOIN pic.twitter.com/VCnggkCGmL
— Bitcoin Magazine (@BitcoinMagazine) January 23, 2025
Introduced in March 2022 under former SEC Chair Gary Gensler, SAB 121 required institutions holding bitcoin and crypto assets for customers to record those holdings as liabilities on their balance sheets. This accounting standard created significant operational and financial burdens for banks and custodians, effectively discouraging them from providing bitcoin-related services. The rule was widely criticized by the crypto industry and lawmakers, with SEC Commissioner Hester Peirce famously calling it a “pernicious weed” in April 2023.
“Bye, bye SAB 121! It’s not been fun,” Peirce wrote in a post on X (formerly Twitter) on Thursday, following the SEC’s issuance of Staff Accounting Bulletin No. 122, which formally rescinds the guidance.
The SEC’s move to rescind SAB 121 comes just days after Gensler’s resignation and marks the start of a new era under Republican leadership. Acting SEC Chair Mark Uyeda, who assumed the role on Monday, quickly announced the formation of a crypto task force led by Peirce to craft clearer and more practical regulatory frameworks for the industry.
“To date, the SEC has relied primarily on enforcement actions to regulate crypto retroactively and reactively, often adopting novel and untested legal interpretations along the way,” the agency acknowledged in a statement on Tuesday.
With the removal of SAB 121, major banks are now expected to move swiftly to integrate bitcoin and crypto custody services into their offerings. This is a significant milestone in the financialization of bitcoin, bringing it closer to mainstream adoption.
CryptoCurrency
Altcoins Surge: Breaking Out Now – Latest Crypto Market Trends


A new US presidency is undoing all the anti-crypto legislation of the old. Bitcoin is riding high above $105,000, and the altcoins are starting to break out. Is this the beginning of the final parabolic stage for crypto?
Total3 breakout about to happen?
Source: TradingView
Total3 is the chart of the combined market capitalisation of all cryptocurrencies, excluding $BTC and $ETH, so is a good guide to moves from the altcoins. As can be seen in the chart, the combined market cap looks as though it is about to break out.
The 0.786 Fibonacci for this latest move has been surpassed, and the price has consolidated above this, as well as above the wedge, which began to form in early December 2024. A breakout of the pennant, plus an eventual confirmation above the $1.13 trillion resistance is all that remains before Total3 can move into price discovery.
40-year descending trendline rejects the US dollar
Source: TradingView
One chart that signals the inverse of a bullish case for crypto is the Dollar Index (DXY). If the dollar is strong, this makes things more difficult for crypto, and vice versa. When Donald Trump came into office he said that he wanted to see interest rates fall, and a weaker dollar.
The chart above shows a rejection of the DXY from a downtrend that is 40 years in the making. Combine this with strong horizontal resistance, and you have an almost impenetrable wall. As the dollar falls further during the Trump administration, expect the crypto market to make hay.
$SOL one of the first altcoins to enter price discovery
Source: TradingView
Of all the major altcoins, Solana (SOL) is the one that is leading the rest of the field into what could be the last, exciting stage of the bull market. Currently holding above the major resistance at $252, the bulls will want to see the price above this level at the end of this week.
If this is the case, with major upward price momentum being signalled by the Stochastic RSI at the bottom of the chart, price discovery awaits. An inspirational target is the 1.618 Fibonacci at $416. Although, higher prices than this are very possible.
Disclaimer: This article is provided for informational purposes only. It is not offered or intended to be used as legal, tax, investment, financial, or other advice.
CryptoCurrency
‘Bitcoin reserve or nothing’ — Ripple slammed for pushing multi-asset reserve

The Bitcoin community is unhappy with Ripple pushing the creation of a diversified crypto reserve, slamming the firm for “prioritizing their own interests.”
CryptoCurrency
New VINE meme coin coming to Binance Futures on Jan. 24

VINE, the Solana-based meme coin launched by VINE co-founder Rus Yusupov, is coming to Binance Futures as a USDT-based perpetual contract.
In a recent notice, Binance Futures announced that it will be adding the Vine coin and pippin on USDT (USDT)-based perpetual contracts starting Jan. 24, 2025 at 10:00 UTC for VINE and 10:15 UTC for pippin. Binance Futures is offering maximum leverage of up to 25x for both USDT-margined contracts.
The maximum funding rate for VINEUSDT and PIPPINUSDT perpetual contracts at launch will be +2.00% and -2.00%. The funding fee calculation frequency will occur every four hours.
Moreover, Binance will provide multi-asset trading support for both perpetual tokens.
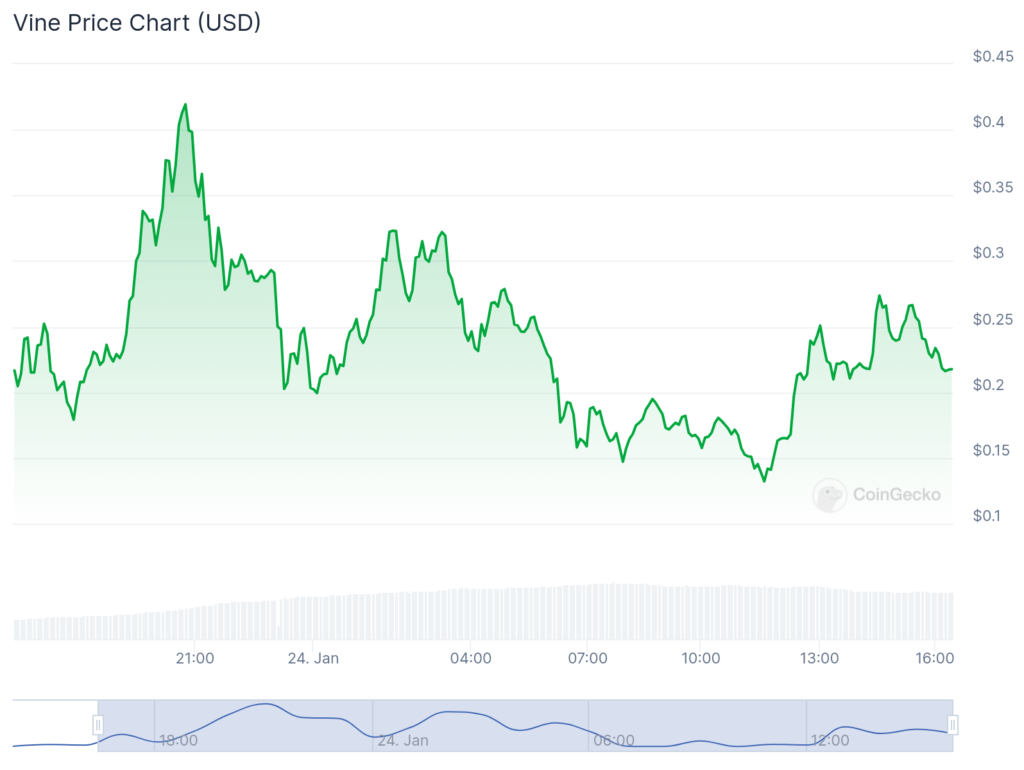
Unlike most meme coins that experience a surge after Binance perpetual contract announcements, VINE and PIPPIN seem to have gone down in value. Having only launched two days ago, the VINE coin has gone down by 11.5% in the past 24 hours and 18.4% in the past hour. Minutes after the Binance Futures announcement was released, its price went up to $0.26 before dropping to $0.22. VINE is currently trading hands at $0.21.
The meme coin inspired by the now-discontinued social media app has reached a market cap of $217 million. However, its 24-hour trading volume managed to surpass $1.6 billion in just a short time.
PIPPIN fared a little better than VINE, increasing by nearly 9% in the past hour after the Binance Futures announcement. Though, the token’s value has been slipping by 7.6% in the past 24 hours. Launched in November 2024, pippin’s market cap stands at $144 million with a 24-hour trading volume of $88 million.
VINE coin triggered by rumored VINE revival
The VINE meme coin was launched on Jan. 22, 2025 by VINE co-founder Rus Yusupov as a way to “commemorate the beauty of togetherness and creation” that content creators experienced through the short-form video app that reigned supreme in the early 2010s.
“We impacted culture. Millions of videos were posted. I am launching this coin to commemorate the beauty of togetherness and creation,” wrote Yusupov on the Vine coin’s website.
He claimed that the team will not sell a single token. Instead, all profits reaped from the VINE meme coin will be donated to X, which he views “has become a beacon for free speech and self expression.”
VINE was shut down in 2017 by its parent company Twitter as it struggled to compete with other emerging social media platforms at the time. Since then, Elon Musk has taken over as Twitter’s owner and rebranded it to X.
On Jan. 19, one X user asked Musk to bring back Vine following the ban of TikTok in the United States. To which Musk responded his team was “looking into it.” Many believe Musk’s response is what prompted Yusupov to launch the VINE meme coin.
-

 Fashion8 years ago
These ’90s fashion trends are making a comeback in 2025
-

 Entertainment8 years ago
The Season 9 ‘ Game of Thrones’ is here.
-

 Fashion8 years ago
9 spring/summer 2025 fashion trends to know for next season
-

 Entertainment8 years ago
The old and New Edition cast comes together to perform You’re Not My Kind of Girl.
-

 Sports8 years ago
Ethical Hacker: “I’ll Show You Why Google Has Just Shut Down Their Quantum Chip”
-
Business8 years ago
Uber and Lyft are finally available in all of New York State
-
Entertainment8 years ago
Disney’s live-action Aladdin finally finds its stars
-
Sports8 years ago
Steph Curry finally got the contract he deserves from the Warriors
-
Entertainment8 years ago
Mod turns ‘Counter-Strike’ into a ‘Tekken’ clone with fighting chickens
-
Fashion8 years ago
Your comprehensive guide to this fall’s biggest trends


You must be logged in to post a comment Login