Crypto analyst Master Kenobi has provided insights into the current Dogecoin price action. The analyst revealed that the foremost meme coin was approaching the moving average (MA) line, which could lead to a new all-time high (ATH).
Dogecoin Eyes ATH As Weekly RSI Approaches The MA Line
In an X post, Master Kenobi revealed that Dogecoin’s weekly Relative Strength Index (RSI) is approaching the MA. He remarked that this is a crucial level that needs to be broken to confirm a continued upward movement. The crypto analyst added that if these barriers are cleared, then the current ATH of $0.74 becomes the next major point of interest for Dogecoin.
Related Reading
As part of his Dogecoin analysis, Master Kenobi also noted that DOGE has had a solid week, although it is unlikely to close in the ATH zone. As part of the obstacles that DOGE needs to overcome, the crypto analyst highlighted a resistance that the foremost meme coin faces at the upper green trendline on his accompanying chart. This comes after DOGE successfully tested the lower green trendline two weeks ago.
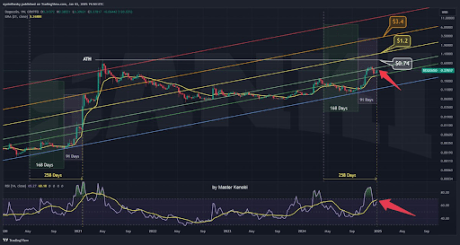
From a fundamentals perspective, the crypto analyst noted that Donald Trump’s reinstatement in the White House could serve as both an indicator and a significant catalyst for Dogecoin reaching its current ATH.
Crypto analyst Kevin Capital also shared an analysis of what needs to happen for Dogecoin to reach and surpass its current ATH. First, he stated that the meme coin needs to break the macro golden pocket at $0.49, then the Fib .703 level at $0.53, and then a break above $0.59. The crypto analyst asserted that a clean break above $0.59 would pave the way for a new ATH for Dogecoin.
DOGE Ready For Next Leg Up
The Dogecoin price looks well-primed for the next leg of its bull run. In an X post, crypto analyst Trader Tardigrade revealed that a Dogecoin MACD bullish crossover has occurred on the daily chart. He added that the previous bullish crossover triggered a massive pump for DOGE when it soared from $0.11 to $0.43.
Related Reading
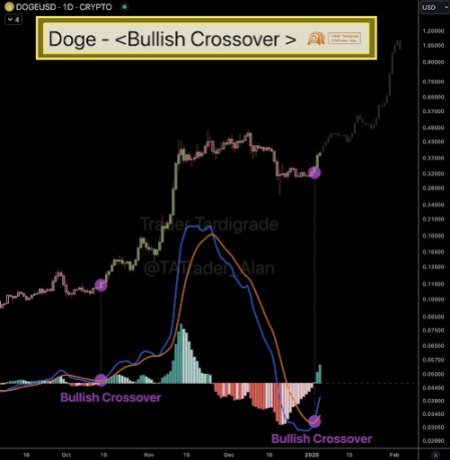
The crypto analyst added that Dogecoin could record a similar rally again. His accompanying chart showed that DOGE could reach the much-anticipated psychological $1 level on this next leg up.
In another X post, Trader Tardigrade mentioned that the meme coin has just entered distribution in the “Power of Three” (PO3) pattern. He added that this pattern makes $1 a reasonable target. Master Kenobi also recently predicted that Dogecoin could rally to as high as $1.2 if the meme coin breaks its ATH by the end of January.
At the time of writing, the Dogecoin price is trading at around $0.38, up over 15% in the last 24 hours, according to data from CoinMarketCap.
Featured image created with Dall.E, chart from Tradingview.com









+ There are no comments
Add yours