Ripple’s uptrend is yet to show any sign of weakness, as it is very likely for the asset to hit a new record high in the short term.
By Edris Derakhshi (TradingRage)
The USDT Paired Chart
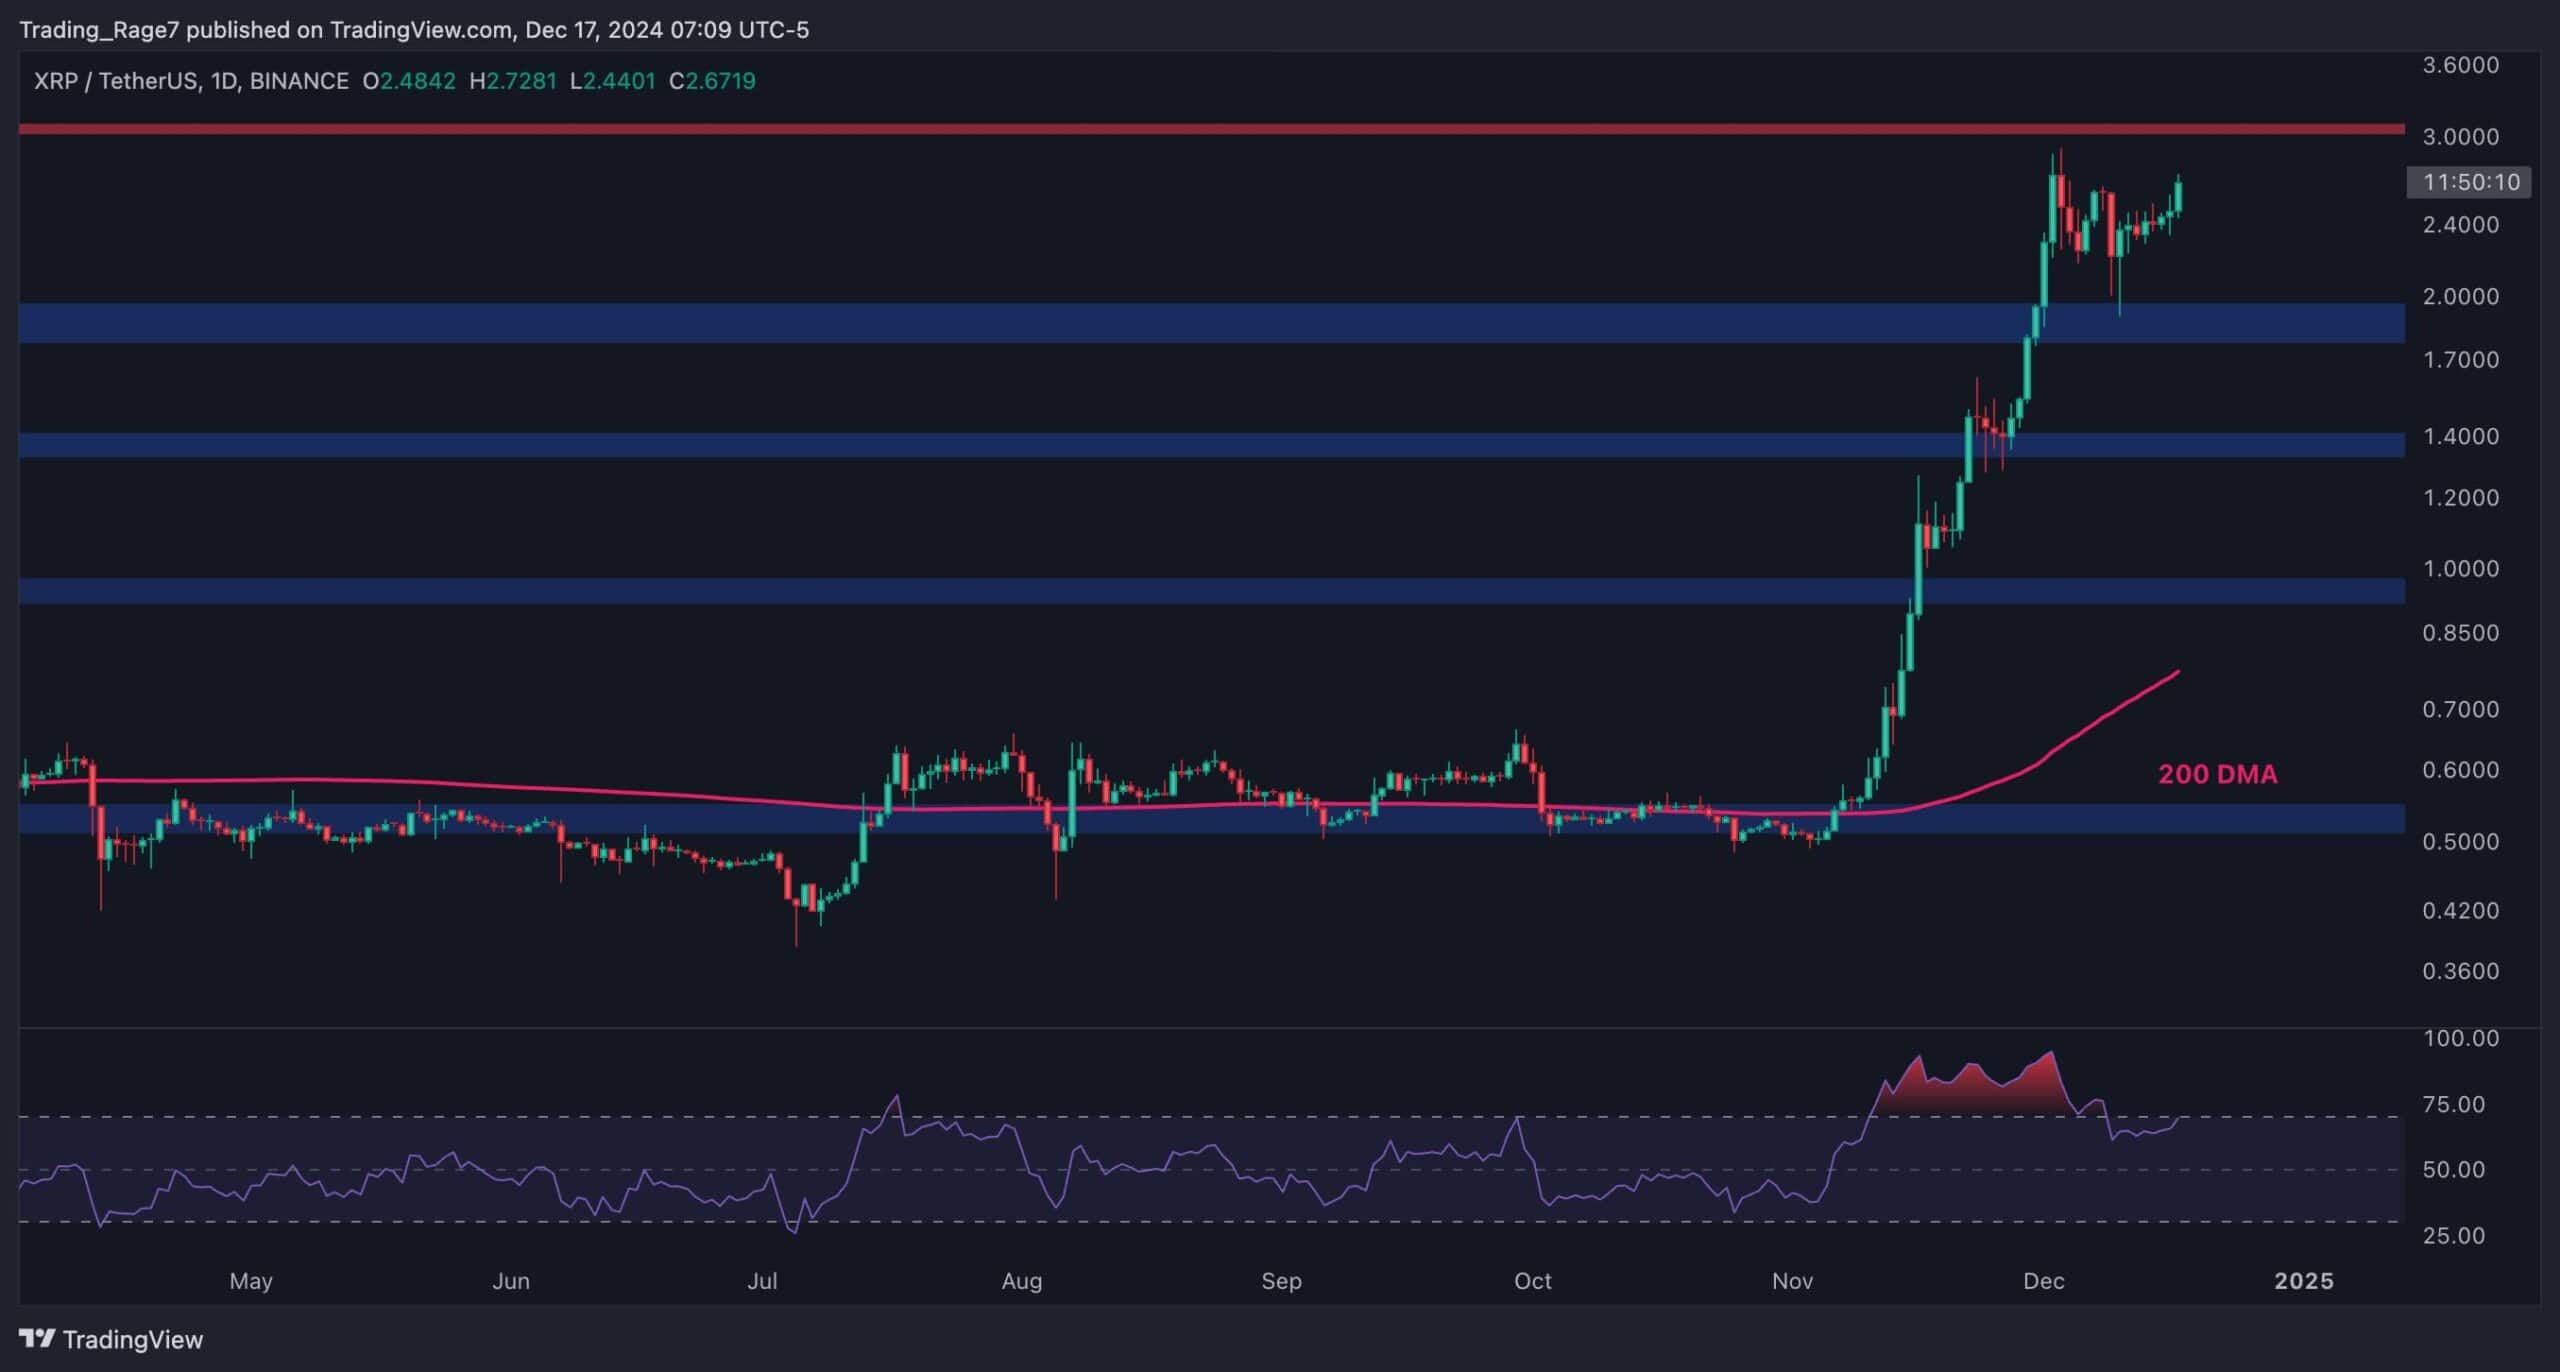
On the USDT paired chart, the price has been surging almost vertically since breaking above the 200-day moving average at the beginning of November. While the market has broken above several resistance levels, it is currently consolidating below the key $3 level.
Meanwhile, the $2 support zone has supported the asset, preventing a long-term correction even though XRP dipped below that level last week. With the RSI also cooling down, it is likely that the market will continue higher soon.
The BTC Paired Chart
Looking at the XRP/BTC pair, things look quite similar to that of the Tether paired chart. The market has begun an aggressive uptrend since breaking above the long-term bearish trendline but failed to break above the 2800 SAT resistance level in its first attempt.
Yet, as long as the 2000 SAT support area is intact, higher prices could be expected for XRP against BTC.
Binance Free $600 (CryptoPotato Exclusive): Use this link to register a new account and receive $600 exclusive welcome offer on Binance (full details).
LIMITED OFFER for CryptoPotato readers at Bybit: Use this link to register and open a $500 FREE position on any coin!
Disclaimer: Information found on CryptoPotato is those of writers quoted. It does not represent the opinions of CryptoPotato on whether to buy, sell, or hold any investments. You are advised to conduct your own research before making any investment decisions. Use provided information at your own risk. See Disclaimer for more information.
Cryptocurrency charts by TradingView.


+ There are no comments
Add yours