The relevance of NYMEX WTI and the United States crude complex is continuing to rise, with higher trading volumes outside core U.S. trading hours signaling further international participation in the benchmark. Since Russia’s invasion of Ukraine in 2022, Europe’s oil refiners have turned to alternative crude oil grades in record volumes as a way of diversifying away from long-term crude supplies from Russia. One of the major beneficiaries would appear to be the U.S., with European refiners buying higher volumes of North American crude grades.
The push to export crude oil from the U.S. after a 40-year ban resulted from burgeoning production and a race to build infrastructure to efficiently deliver it to market. Canadian and U.S. crude production has grown from a low of 8 million barrels per day in 2008 to around 19 million barrels per day in 2025. WTI Midland produced in the U.S. was added to the Brent basket in 2023, formally linking the price of Brent with WTI. This change was very supportive for the trading of NYMEX WTI Crude Oil futures and increasing global interest in WTI, boosted trading volumes of WTI during European hours, and created a more direct price link between the U.S. and Brent.
Advertisement
The Rise of NYMEX WTI and Its Impact Globally
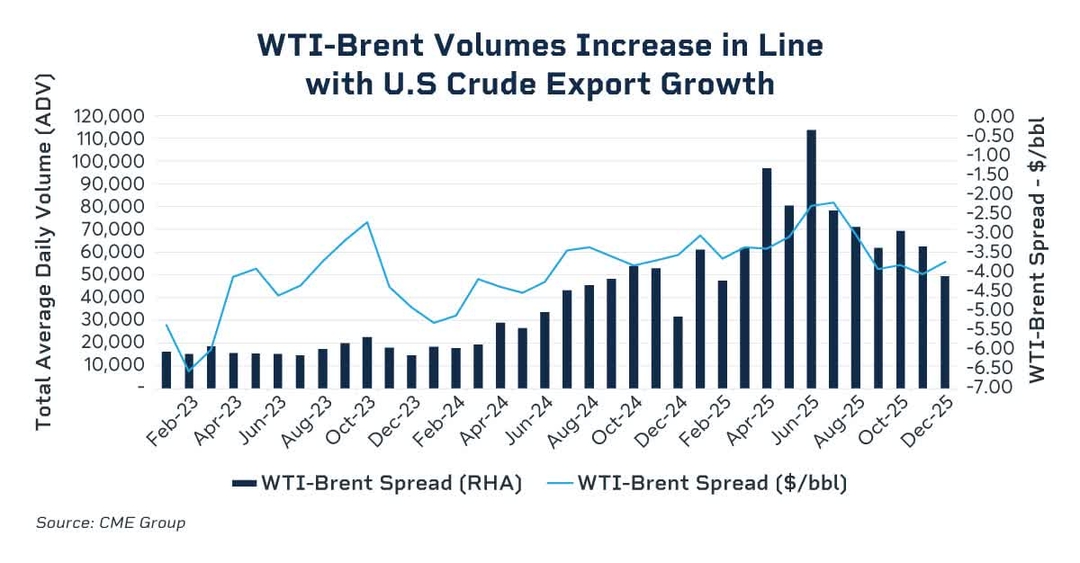
The scale of U.S. export capability has meant that U.S. crude oil prices are playing an increasingly important role in the global crude oil system. The WTI-Brent futures spread reflects the price spread between U.S. crude oil and the North Sea. The buildout of export infrastructure in the U.S. has been beneficial to the WTI-Brent spread, which has risen from a low of $25 per barrel to trade around -$4 per barrel under Brent at the end of 2025. Trading volumes in the WTI-Brent futures spread, which are typically viewed as a hedging vehicle for the rising volumes of U.S. crude internationally, have remained robust with an average daily volume of around 61,000 contracts through December 2025 – a five-fold increase on the 2024 levels, based on the latest CME Group data.
While there have been some new oil discoveries in the North Sea in recent years – such as Johan Sverdrup and Johan Castberg – that have boosted total North Sea production, this has seemingly had little direct effect on the pricing mechanism for Dated Brent, which relies on production from Brent, Forties, Oseberg, Ekofisk and Troll crude oils plus delivered cargoes of WTI Midland. Production for the core North Sea grades (excluding WTI Midland) that underpin Brent have experienced mixed fortunes in recent years with total volumes falling by around 100,000 barrels per day in the past 12 months to December 2025.
At the same time, the volume of U.S. crude oil exported to northwest Europe has continued to rise, which has been supportive for the Brent benchmark. The total volume of U.S. crude oil sold into Europe has reached more than double the volume of oil that is produced at the North Sea crude oil terminals for Brent, Forties, Oseberg, Ekofisk and Troll. In the latest data from shipping analytics firm Vortexa, total volumes of U.S. crude oil exported to NW Europe reached around 1.1 million barrels per day compared to around 550,000 barrels per day for the crude oils which make up the current Brent basket.
European refiners have benefited from the increased availability of light sweet U.S. crude oil grades and, in some cases, have been able to replace the long-standing baseload crude grades from places like Russia with U.S. alternatives. This has been beneficial to the growth of NYMEX WTI crude oil futures, and other U.S. crudes like Argus MEH which trade relative to the U.S. crude futures marker. Traders note that this has been a major boost to the success of WTI Midland. It is generally considered to be a good quality crude grade that is able to produce a larger quantity of road transport fuels such as diesel and gasoline, both of which are important fuels used in the European markets.
Advertisement
All of these changes are considered to be supportive to the growth of NYMEX WTI futures and broader U.S. crude complex as a global benchmark.
A Quarter of All NYMEX WTI Futures Now Trade During European Hours
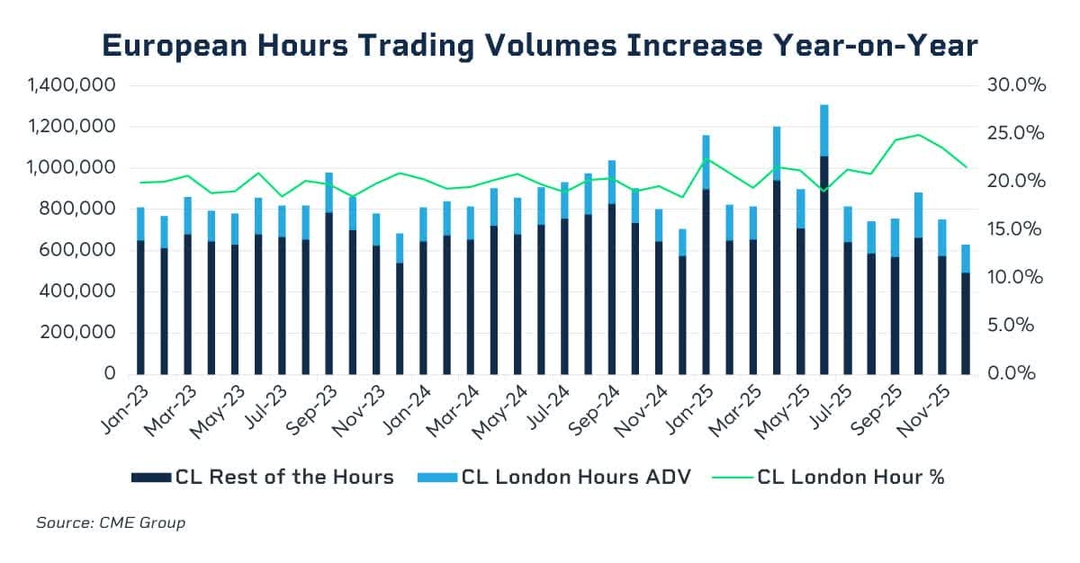
The latest data from CME Group shows that there is a growing volume of NYMEX WTI Crude Oil futures being traded during non-U.S. hours. Trading volumes during the London day and before the U.S. trading session reached around 200,000 barrels per day in 2025, which is an increase of 16% from 2024 levels. Importantly, there were three months in 2025 where volume traded in European hours exceeded 200,000 contracts per day, with volumes reaching around 25% of the total volume traded. The inclusion of WTI in the Dated Brent basket is one reason behind the WTI volume increase in European hours, analysts say.
The boom in exports to Europe has also given rise to increased trading of CME Group WTI Midland quality futures, priced as a basis to NYMEX WTI at Cushing. Trading in the Argus WTI Houston vs. NYMEX WTI crude oil futures (NYMEX HTT) during the European morning hit a new high in October 2025, up more than three times the prior high. The growth signals increasing liquidity and interest from regional refiners in managing quality and location risk around WTI Midland.
The Rise of Grades: Hedging a Differential to WTI
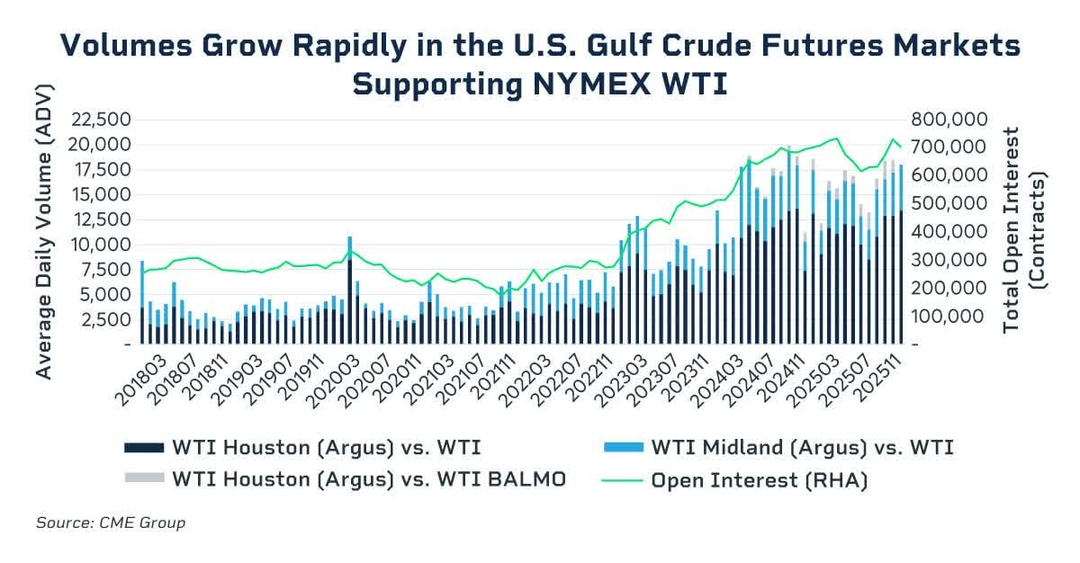
The role that WTI Midland is playing in the North Sea price assessment process has been increasing for the past several months, with a higher proportion of U.S. crude cargoes setting the price of Dated Brent compared to other grades in the North Sea. Traded volumes in WTI Midland and WTI Houston vs NYMEX WTI have continued to increase sharply since U.S. crude oil was permitted for export in 2016, highlighting the growing appetite for risk management tools for managing price volatility along the U.S. Gulf Coast. All of these products are tied back to NYMEX WTI crude oil futures, which has attracted the interest of international markets.
Advertisement
The latest data shows that total volume of the WTI Houston and WTI Midland products vs NYMEX WTI has increased from around 15,900 contracts per day in 2024 to around 18,000 contracts per day in 2025. This represents an increase of around 14% year-on-year. Open interest, a key measure of the success of a futures contract, reached around 705,000 contracts at the end of December 2025, which is close to an all-time record level.
These developments are helping to elevate WTI Midland to one of the leading globally significant swing barrels, especially for Northwest European refiners. The light sweet nature of WTI Midland is one reason why the crude grade has become a popular choice for European refiners. Typically, European refiners hedge their index purchases of WTI Midland from the Gulf Coast by buying NYMEX WTI plus the Argus WTI Houston (HTT) differential and selling NYMEX Brent futures.
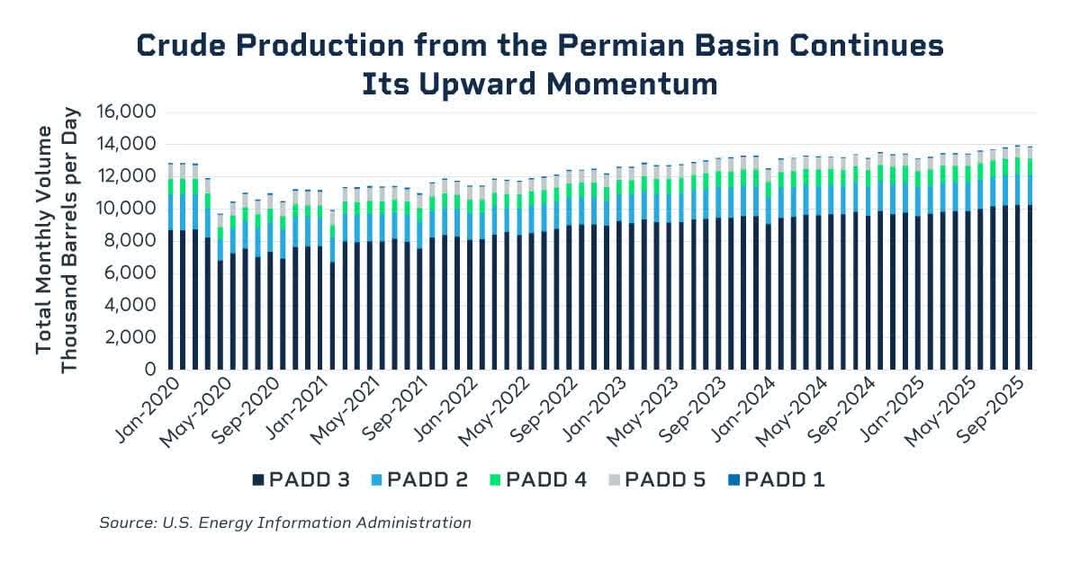
U.S. Gulf Coast PADD III: Crude Production Achieves Record Output
The shale revolution has been one major factor contributing to the rise in output. The latest data from the U.S. Energy Information Administration shows that total U.S. crude production across the five key Petroleum Districts reached around 14 million barrels per day. Crude production in the crucial Petroleum Administration for Defense District (PADD III), which includes the Permian Basin crude WTI Midland, reached over 10.2 million barrels per day, an all-time high level during Q4 2025.
Growth in International Use of NYMEX WTI Continues
The increasing production of U.S. crude has been beneficial for the global oil markets and has allowed the U.S. to play a more pivotal role in the pricing of crude oil globally. Its export volumes have risen sharply in recent years and more cargoes are heading to Europe and Asia, which has brought more traders into the market to trade the price of WTI crude oil. The international adoption of NYMEX WTI as a global benchmark is expanding with many more refiners across Europe using it to price crude cargoes into the region. As higher volumes of U.S. crude oil exports are refined outside the U.S., the adoption of the U.S. benchmark continues to grow.
Markets rarely offer clarity. But every once in a while, if you step back and listen closely to the data, the message becomes hard to ignore.
Over the past few months, Indian equities have undergone a meaningful correction, with the Nifty 50 declining nearly 14.5% from its peak. Much of this weakness has unfolded amid rising geopolitical tensions in the Middle East, adding to global risk aversion. Such drawdowns naturally create discomfort, they test sentiment and shake conviction. But they also serve another purpose: they reset valuations and quietly build the foundation for future opportunities.
From where I stand, this phase is less about panic and more about perspective.
ETMarkets.com
One of the most insightful indicators we track is the Sensex-to-Gold ratio, which compares equities to a traditional store of value. As of March 2026, this ratio has moved back to its historical support levels that, in previous cycles, have often preceded phases of equity outperformance. I would refrain from making bold calls, but when a time-tested relative valuation metric signals that equities are becoming inexpensive versus gold, it deserves attention.
Live Events
Majority of NSE Stocks Trade Below 52-Week Lows
ETMarkets.com
Note: The 52-week low count is presented on a net basis (i.e., after deducting stocks hitting 52-week highs) across all NSE-listed stocks
The second signal comes from market stress indicators. In March 2025, over 927 stocks across the NSE universe hit their 52-week lows, reflecting widespread pessimism. What followed was telling: the Nifty delivered 5% returns in one month and 12% over three months. However, it is equally important to acknowledge that extremes do not always mark immediate bottoms. In March 2020, when over 1,000 stocks hit 52-week lows, the market continued to correct in the near term before eventually recovering.Today, in March 2026, we are witnessing a similar—if not deeper—setup, with nearly 948 stocks at 52-week lows. This suggests that while the market may still remain volatile in the near term, such extreme readings have historically created favourable forward return probabilities over a slightly longer horizon.
Advertisement
Majority of NSE Stocks Trade Below Key Moving Averages
ETMarkets.com
Note: Percentages represent the proportion of stocks trading below their respective DMAs across NSE-listed stocks.
Market breadth further reinforces this view. Currently, over 81–89% of stocks are trading below their key moving averages (4, 20, and 50 Week MA). These are not ordinary levels they reflect broad-based capitulation and deep pessimism.
From a mean-reversion perspective, such extreme compression in breadth has typically been followed by phases of normalization and recovery rather than extended declines.
When we step back and connect these dots
Relative valuations turning favourable (Sensex vs Gold)
Majority stocks trading near 52-week lows
Majority stocks trading below their key moving averages
The data collectively suggests that the risk-reward balance is gradually tilting toward the upside.
That said, it is important to remain grounded.
Advertisement
Geopolitical uncertainties and global macro risks remain key overhangs. Whether it is rising bond yields, policy shifts, or international conflicts, these factors can influence markets in the near term and potentially delay recovery. At the same time, risks to corporate earnings, amid margin pressures, global slowdown concerns, and inflation, remain an important variable to monitor.
So, to be clear, we are not calling it a market bottom. But what we are observing is equally important: The correction has meaningfully improved valuations, and the weight of evidence is turning constructively in favour of equities.
A Message to Investors
Corrections are uncomfortable by design; they create doubt and test patience. But historically, some of the most rewarding investment decisions are made during such phases, when sentiment is weak but underlying data begins to stabilize.
The signals today are not opinions, they are reflections of market behavior. Stay disciplined. Stay diversified. Avoid the urge to time the exact bottom.
Advertisement
If your investment horizon extends beyond the near term, the current environment calls for measured, systematic participation, not reactionary decisions. Because in markets, opportunity rarely announces itself loudly. It usually emerges quietly hidden within the noise.
Equity mutual funds experienced significant losses last week, with top performers shedding up to 6%. While global markets like Nasdaq and S&P 500 also declined, some Asian indices saw gains. Conversely, specific funds focused on metals, energy, and technology delivered positive returns.
The Bihar government is preparing to list its power transmission company on the stock market in a move aimed at enhancing public participation in the state’s growth, a senior official said.
In a video interview with PTI, Bihar Energy Secretary Manoj Kumar Singh said, “We are planning to list our transmission company on the stock exchange and have issued an Expression of Interest (EoI) to onboard merchant bankers.”
Bihar State Power Transmission Company Ltd (BSPTCL) is set to become the first state-owned transmission utility to go public, with the listing proposed on the NSE.
Singh noted that the size of the issue will be determined after the merchant bankers are appointed. “Once they are onboard, they will guide us through the IPO process and assess how much capital can be raised from the market,” he said.
Advertisement
Explaining the rationale, Singh described listing as a natural step for a profitable business. “Our transmission company has been consistently profitable for over a decade. We want the public to also share in this growth journey,” he added.
Live Events
The funds raised from the IPO will be used to strengthen Bihar’s transmission infrastructure to meet future power demand. BSPTCL has outlined an ambitious expansion plan worth Rs 16,194 crore to enhance network capacity, improve intra-state transmission corridors, and handle increasing power loads. The plan also includes upgrading substations and high-voltage transmission lines to reduce losses, improve grid reliability, and support the integration of new generation capacity, including from renewable energy sources.According to Singh, Bihar recorded a peak power demand of around 8,800 MW last year, which is expected to rise to about 9,500 MW this year.
By 2030, peak demand is projected to cross the 13,000 MW mark, driven by growth in commercial and industrial establishments.
While Singh did not specify a timeline for BSPTCL’s listing, he indicated that the government may also consider listing its power distribution companies — North Bihar Power Distribution Company Limited (NBPDCL) and South Bihar Power Distribution Company Limited (SBPDCL) — in the future.
“We will begin with the transmission company. Once its revenue stream stabilises, we may consider listing the discoms in the next two years,” he said.
Advertisement
Providing an overview of the sector’s performance, Singh highlighted that both the transmission and distribution companies are financially strong, with significantly lower AT&C losses (Aggregate Technical & Commercial losses) compared to many other states.
An improvement in AT&C losses indicates improved operational efficiency, higher financial viability, and a narrower gap between the cost of supplying power and revenue earned (ACS-ARR gap).
For FY25, BSPTCL reported a total income of Rs 1,968 crore and a profit after tax (PAT) of Rs 286 crore. NBPDCL posted a total income of Rs 17,448 crore with a PAT of Rs 1,339 crore, while SBPDCL recorded a total income of Rs 19,108 crore and a PAT of Rs 665 crore.


 ETMarkets.com


 News Videos3 days ago
 Sports6 days ago
 Sports6 days ago
 Business7 days ago
 Tech6 days ago
 Tech6 days ago
 Business2 days ago
 News Videos6 days ago
 NewsBeat1 day ago

 Business7 days ago
 Sports6 days ago
 Tech5 days ago


 Fashion5 days ago
 Business5 days ago
You must be logged in to post a comment Login