
Business
STAG Industrial’s Growth Outpaces Its Multiple (NYSE:STAG)

urfinguss/iStock via Getty Images

The Buy Thesis
STAG Industrial (STAG) is in a sweet spot for AFFO/share growth. Mark-to-market on its existing portfolio keeps organic growth flowing at 3%-5% while higher cap rates have turned acquisitions and developments immediately accretive. STAG is designed as an acquisitive company, so the higher transaction volume outlook for 2026 bodes well for their relative growth rate.
Between the various levers, we see annual AFFO/share growth of about 9%. That is excellent growth relative to a 17X AFFO multiple, positioning STAG to outperform the market.
Let us begin by discussing the shifting dynamics of the industrial real estate environment and then estimate how that translates into AFFO/share growth for STAG specifically.
Industrial real estate environment
The industrial landscape is changing rapidly with the following moving parts:
- Leasing dynamics
- Market asking rents
- Mark-to-market
- Transaction volumes and cap rates
- Developments
Leasing dynamics
Following the demand surge of the pandemic, leasing was extremely landlord favored causing market rental rates to surge as much as 50% from 2021-2024.
In response to the higher rental rates, developers started building a massive wave of industrial properties with particular emphasis on large footprint (> 100,000 sf) logistics facilities. As this wave delivered, it has slightly outpaced net absorption such that national vacancy rates have ticked up to over 7%.
Note that this just over 7% vacancy is in-line with historical norms and has taken leasing discussions to a more balanced place. Asking rents have stopped surging, ranging from moderately up in low supply submarkets to moderately down in higher supply submarkets.
To understand how rental rates impact AFFO/share of the industrial REITs, we must distinguish between asking rent and current rents.
Mark-to-Market is subsiding but remains a huge force in 2026
While asking rents have flattened out, industrial leases tend to be quite long such that many of the existing contracts are still at rental rates far below market rates.
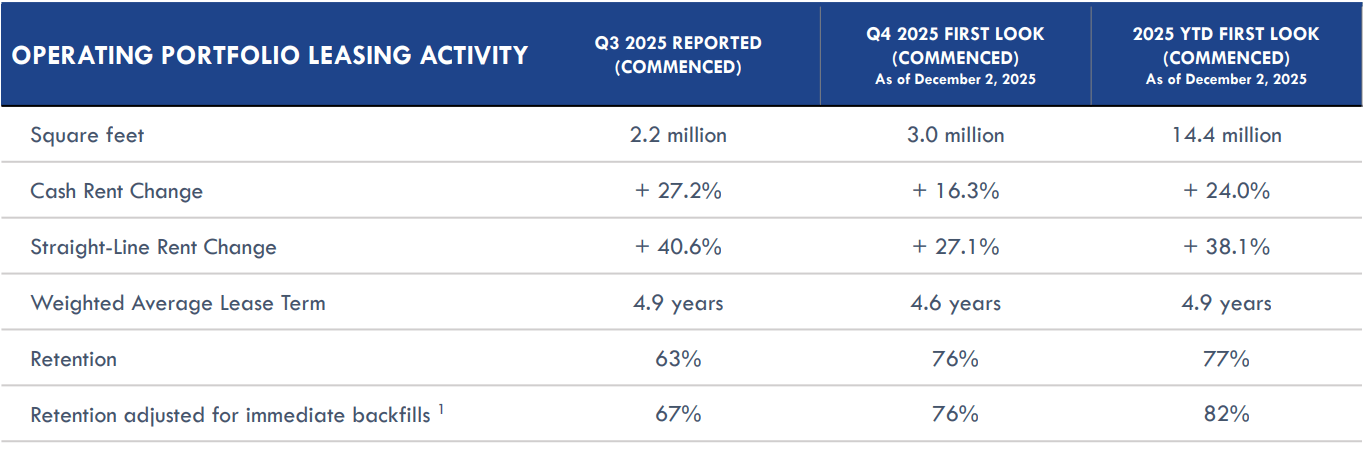
STAG, for example, is signing new leases at 38.1% higher rates than expiring leases (GAAP) in 2025 with data released through 12/2/25.
STAG
This of course does not mean that market rates are increasing by 38%. Rather, that market rates have increased by a total of 38% since the expiring leases were originally signed.
However, the impact to FFO and AFFO will be the full difference in lease rates. FFO of the new lease will be based on revenue 38.1% higher than the previous lease while AFFO will be based on revenue 24% higher than the previous lease as FFO and AFFO use GAAP and cash accounting, respectively.
So while market rates have flattened, the industrial REITs still have a significant runway of increases to rental income as their legacy leases roll and get marked to the now higher asking rates.
Bill Crooker, STAG’s CEO, discussed the cadence of mark-to-market on the 3Q25 earnings call: “we’re guiding to 18% to 20% cash leasing spreads for next year. And if you look at where they were a few years ago, were I think 30% and then went to 24% this year, and 18% to 20% next year. And if you look at where our mark-to-market has been in those years, it’s similar to what our escalators have been. So you haven’t been driving additional mark-to-market opportunities. So naturally, that similar type of degradation and spreads will happen.”
Thus, while STAG’s same-store NOI growth is guided to be 4.0%-4.25% in 2025, we anticipate it will be closer to 3.5% in 2026. In 3Q25, STAG’s cash NOI runrate was $161 million.
STAG
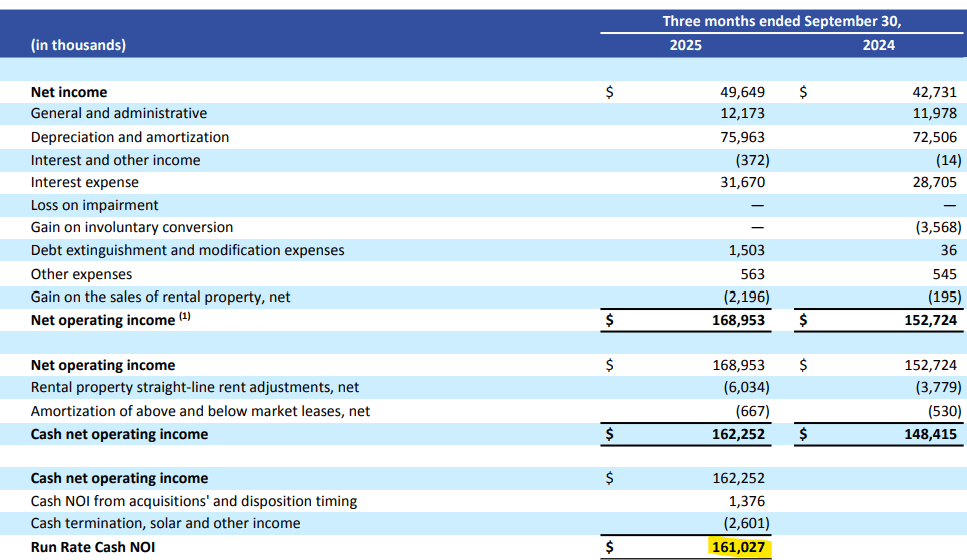
Thus same-store NOI growth of 3.5% would be an extra $5.6 million quarterly or $22 million annually. That represents about $0.12 of AFFO/share growth.
Transaction volumes and cap rates
Cap rates for industrial properties were exceedingly low, often in the 4% range. This is because both buyers and sellers were aware that the existing rents were far below market rates. Thus, they were pricing the assets on market rates rather than current rental streams.
This pricing dynamic made acquisitions difficult for the REITs because buying assets at cap rates in the 4s would be flat to slightly dilutive to AFFO in the immediate term. Purchases could still be accretive in the longer run because of the growth embedded in the assets, but it did significantly reduce acquisition volumes. Most industrial REITs had light purchase activity in most of 2025.
Recently, however, cap rates have started to rise a fair amount into the mid 6s. There is of course a range around that based on asset quality, location and type. At the now higher cap rates, acquisitions have been unlocked for the REITs from an accretion perspective. Indeed, acquisition volumes have started to pick up in recent months and forward 2026 pipelines.
Bill Crooker discussed the uptick in acquisition opportunity on the 3Q25 call:
“One other change in terms of deploying capital, we’re seeing a great opportunity to deploy capital on acquisitions right now, which is not what we saw earlier this year”
STAG’s 2025 acquisition guidance is $350-$500 million. That was a low acquisition year. Over the past 5 years STAG has averaged ~$700 million in acquisition volume.
I would anticipate 2026 to be closer to that $700 million figure.
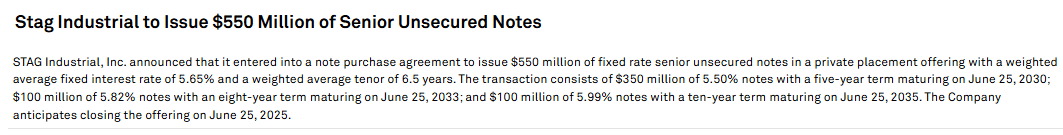
With that in mind, let us take a look at STAG’s spreads.
Cap rates for STAG’s types of assets are around 6.5% which compares favorably to their cost of capital.
- 5.86% cost of equity (17.05X forward AFFO)
- 5.65% cost of debt
S&P Global Market Intelligence
So that is a 75 basis point spread on going in cap rates. In addition to the immediate accretion, STAG is getting built-in growth as these new properties come with escalators.
Some of the acquisitions will be funded by free cashflow as STAG has over $100 million in FCF after paying dividends.
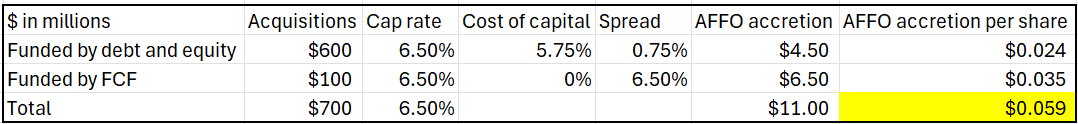
Thus, we calculate the net acquisition accretion as follows.
2MC
Developments
In addition to acquisitions picking up, development volume looks healthy for STAG. Within STAG’s in-construction pipeline, 5 of the assets are to be delivered at the end of 2025 or early in 2026. As such, they will get close to a full year of cashflows from them.
S&P Global Market Intelligence
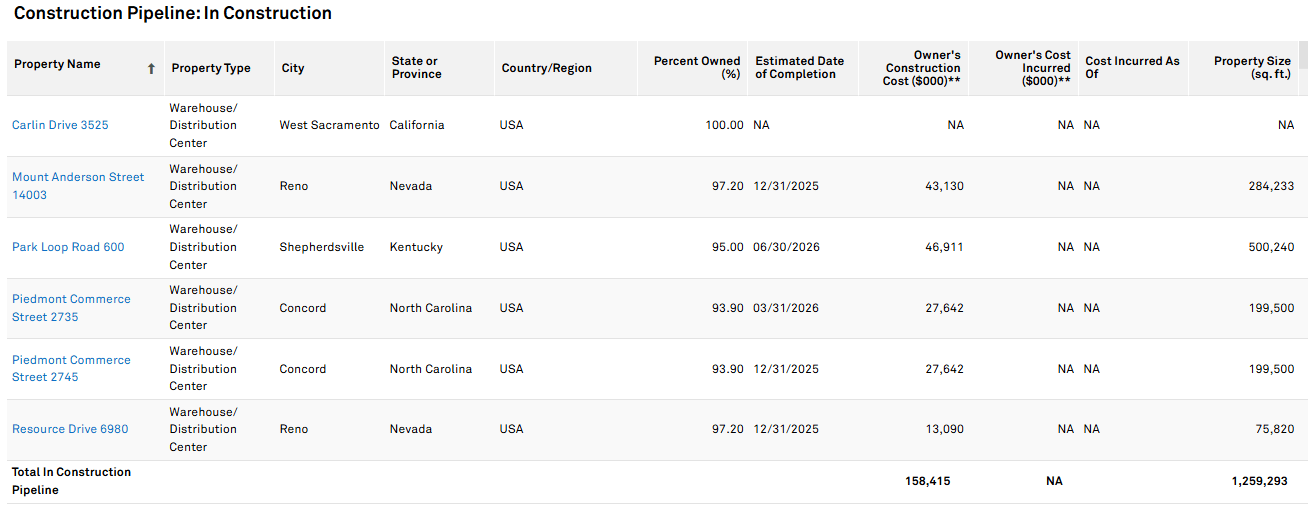
STAG targets 7% yields on developments, although some have reached stabilized yields above 9% as noted by Crooker on the 3Q earnings call:
“We leased the remaining 91,000 square feet in our Nashville development. This project is now 100% leased with a cash stabilized yield of 9.3%. We stabilized this transaction 210 basis points higher than our initial underwriting and 6 months ahead of schedule. Including this transaction, our completed developments are currently 88% leased. I’m happy to announce a recently signed build-to-suit project on a fully entitled 40-acre parcel of land located in Union Ohio. We’ll develop a Class A 349,000 square foot warehouse with our development partner. The building is scheduled to be completed in Q3 2026. Upon completion, the building will be fully leased for 10 years with 3.25% annual lease escalations to a strong credit tenant. The project is estimated to cost $34.6 million and is expected to have a stabilized yield of 7%.”
If we assume the 7% figure and the same 5.75% cost of capital as earlier, that is a 125 basis point spread on $158 million of developments that will hit around the start of 2026. This represents about a penny per share of AFFO accretion.
Summary of growth levers
Based on our calculations above:
- $22 million or 12 cents per share accretion from same-store NOI growth
- $11 million or 6 cents per share accretion from acquisitions
- $2 million of 1 cent per share accretion from developments
That totals to $0.19 of AFFO/share accretion.
STAG is expected to earn $2.13 per share of AFFO in 2025. So the extra 19 cents represents growth of about 9%.
Note that these calculations are on a run-rate basis. So while we expect STAG’s AFFO runrate to increase by 19 cents per share in 2026, much of the acquisition and NOI accretion will be spread throughout the year such that the actual calendar year 2026 will not get to enjoy the full 19 cents of accretion.
Consensus estimates call for STAG growing AFFO/share by 10 cents in calendar year 2026, another 17 cents in calendar year 2027, followed by an additional 19 cents in 2028.
S&P Global Market Intelligence
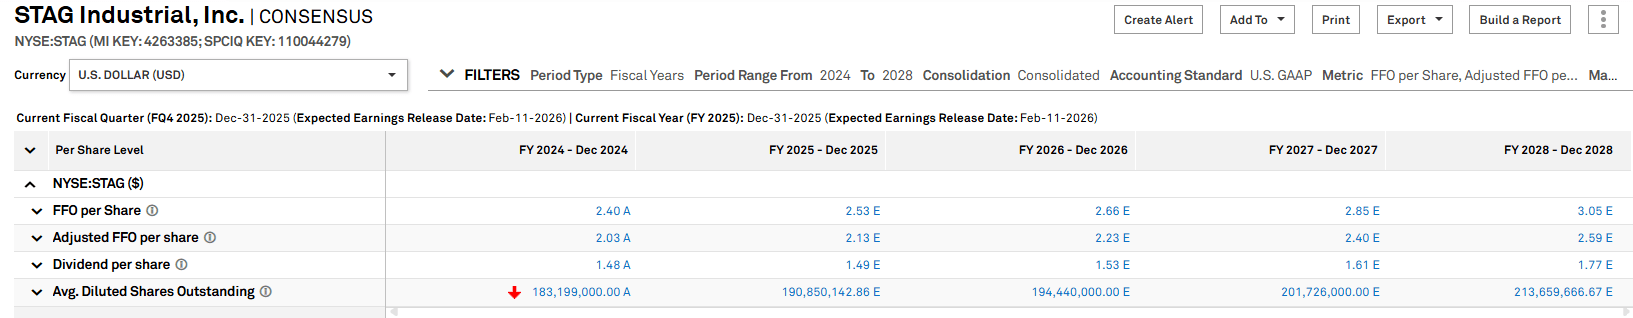
In my opinion, STAG’s growth will come in slightly ahead of the consensus figures.
Either way, that is excellent growth for a company trading at 17X AFFO.
Risks and key factors to watch
Logistics real estate has been strong the past 10 years on the boom in e-commerce. Online sales have continued to climb as a percentage of overall sales.
FRED
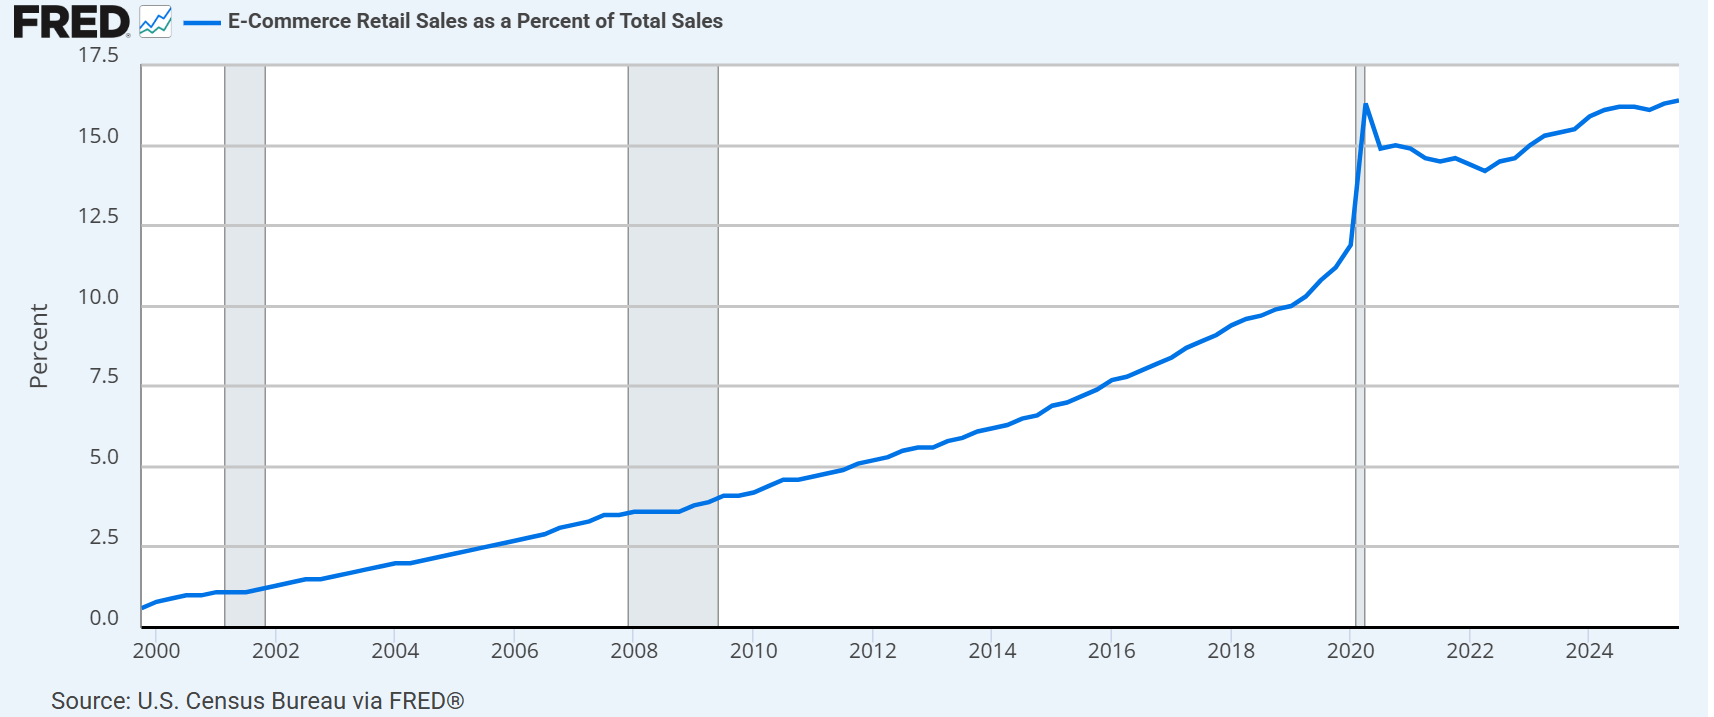
Each online sale requires substantially more logistics warehousing than brick-and-mortar retail sales.
It is broadly expected that e-commerce will continue to take market share. The health of the industrial real estate sector is somewhat dependent on this figure continuing to move up and to the right.
On the negative side, businesses have been running lighter on inventory. Efficiencies have allowed inventory to sales ratio to drop to less than 1.4X.
FRED
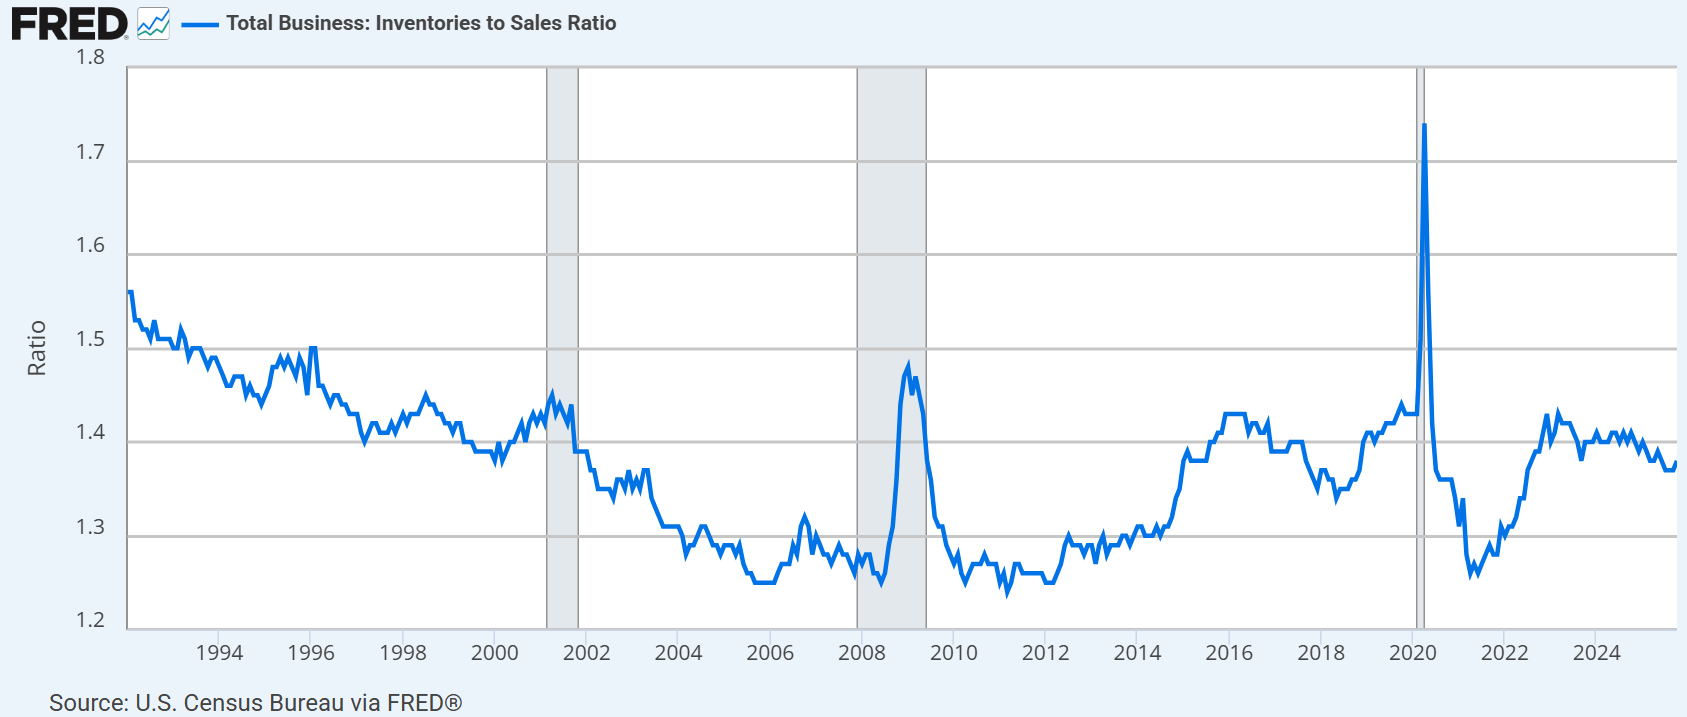
Less inventory means less need for warehousing.
I will be keeping an eye on both inventory levels and e-commerce market share.
Summary of buy thesis
STAG is positioned for roughly 9% growth in AFFO/share runrate. Combined with a freshly raised 4% dividend yield that would imply 13% annual return assuming flat trading multiple.
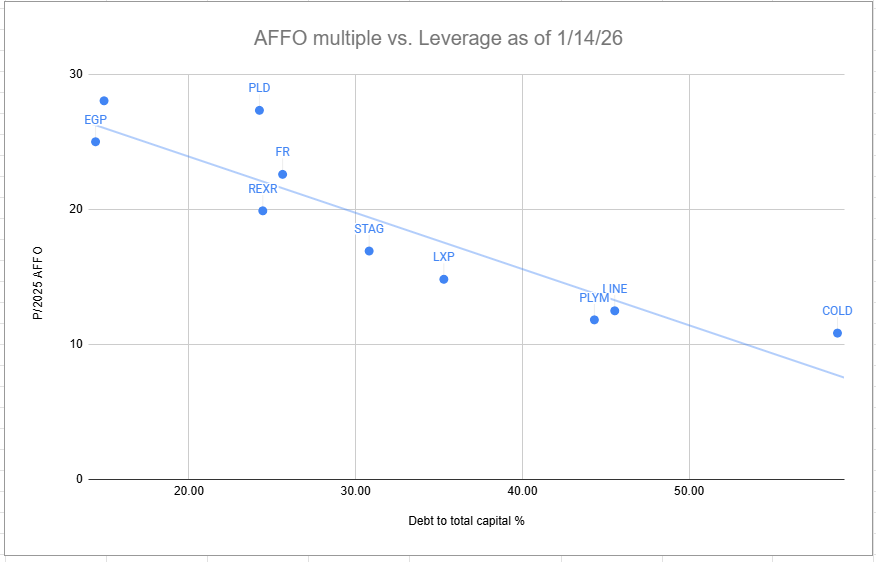
I view that as a significantly outsized return relative to risk as STAG runs a clean balance sheet at around 5X debt to EBITDA and a BBB credit rating. It is a well-managed company and currently trading at a significant discount to fair value. In my opinion, STAG should trade closer to 20X AFFO. STAG is discounted to its sector peers on a leverage neutral basis.
Portfolio Income Solutions
It is also discounted to consensus NAV of $44.24.
Overall, STAG strikes me as a blue chip style investment with high return potential. We have been long STAG for many years and it is a key part of the 2nd Market Capital High Yield Portfolio (2CHYP) in Portfolio Income Solutions.


