
Business
What Is Risk? | Seeking Alpha

da-kuk/iStock via Getty Images

The risk that matters most is the risk of permanent loss [of capital]. – Howard Marks
The many varieties of risk
“Risk” is a funny word. In the context of investing, it is used constantly; however, if you ask somebody to define what he or she really means, you are likely to be met with plenty of hesitation. “Risk” is one of those words we all use every day without giving too much thought to what it actually means.
When I think about risk, though, one definition towers over and above all the other ones. To me, when investing, “risk” is mostly, but not exclusively, about the risk of permanently losing your capital. Whichever of those silos above you think offer the best description of risk, in almost all cases, the risk of a permanent loss of capital hovers above it. In the following, I will talk about how the risk of that can be minimised.
How to measure risk
When professional investors manage risk, two measures of risk tend to dominate:
- (equity) beta; and
- value at risk (VaR).
Allow me to spend a minute on how to define the two terms. Equity beta is a measure of the sensitivity of a stock (or portfolio) relative to movements in the equity market. If you assume the equity market is represented by S&P 500, an equity beta of 1 suggests the stock in question will move in line with S&P 500, whereas an equity beta suggests the stock in question is more (less) volatile than S&P 500.
The beta can be measured against other benchmarks as well – doesn’t have to be against the equity market. If, for example, you wish to measure the sensitivity to commodity prices, you calculate the commodity beta, etc, etc.
VaR is a bit more complicated. It is a measure of the maximum expected loss over a given time horizon and at a pre-defined confidence level (typically 97.5% or 99%) assuming normal market conditions . The latter is a very important assumption.
The primary problem with both of those measures is that they are akin to rear-mirror viewing. One cannot be sure that history will repeat itself, and both measures depend, to a significant degree, on historical patterns being repeated. That said, there isn’t much you can do to improve the analytical outcome. One option is to introduce a Month Carlo model when calculating the VaR, which will eliminate the dependence on history, but that won’t protect you against every possible outcome.
Every day, we calculate the equity beta on every single holding in our fund, and we calculate the portfolio VaR. In terms of the latter, we work with a self-imposed limit of 3%; i.e. we aim to keep the portfolio’s 97.5% 1-day VaR below 3%.
How you should manage risk
Most private investors don’t have the tools, nor the time, to spend hours every day on risk management, so a more pragmatic approach is warranted. I suggest the following approach: identify a handful or two of indicators which, historically, have led to the party coming to an abrupt end. To me, the ten most important ‘end of secular bull market’ indicators are listed in Exhibit 1 below.
Exhibit 1: End of secular bull market indicators
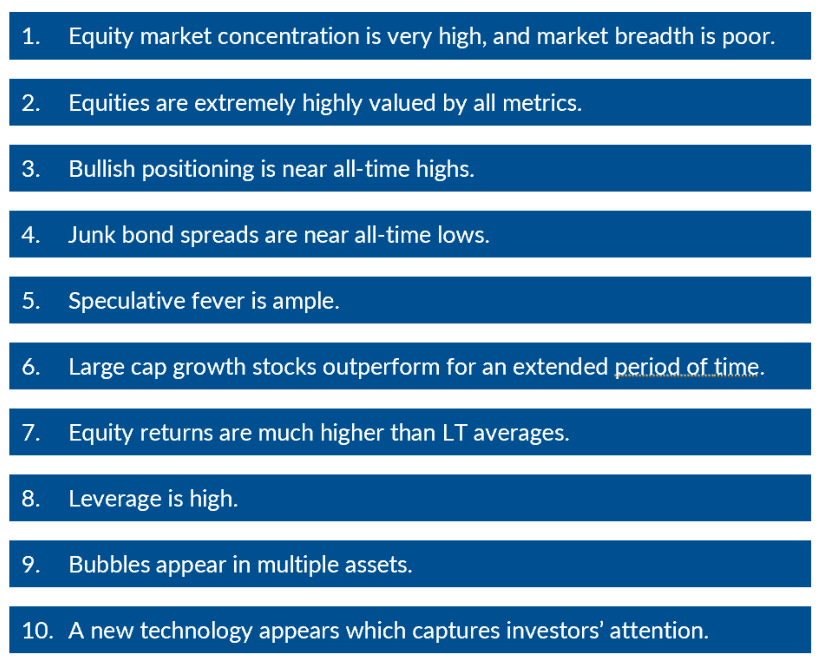
Sources: The Felder Report, Absolute Return Partners LLP
I work with these indicators in a rather simple way. Essentially, the more boxes I can tick, the more likely, I believe, it is for the secular bull market to come to an end rather soon. Now to the serious part: All ten boxes are currently ticked off! That tells me that the end might not be that far away. Three caveats:
1. Secular bull markets rarely end ‘just’ because equities are expensive. Some sort of catalyst shall be required.
2. When going through this exercise, you may end up with a different set of indicators than me but that matters less. Choose those that you are comfortable with and that have worked for you over the years.
3. Timing is the most difficult part of an exercise like this, and it is easy to be (too) early – in fact so early that it poses real career risk to professional investors, and that is probably why many prefer to stay on the train until it is too late to get off without an injury or two.
Re the last point, I learnt in 1990 when Tokyo Stock Exchange crashed, and again in 2000 when the same happened in New York, that most investors prefer to participate in the party to the very end, knowing very well that they may end up with plenty of (rotten) egg on their face.
Nothing has convinced me that investors have changed even the slightest. Momentum continues to drive markets forward, whatever asset class you look at, and the crowd mentality is stronger than ever. That is sort of a “if my neighbour got rich on gold, why shouldn’t I do the same?” mentality, which is very dangerous.
Allow me to finish this month’s Absolute Return Letter by sharing a chart from Goldman Sachs (GS) which shows how abundant speculative fever currently is (#5 on the list above). The chart was produced last October, i.e. it only provides 2025 data through September, but there is no reason to believe that anything happened in 4Q25 which would change the picture.
Exhibit 2: Price return on various US equities (Note: 2025 to 30 September)
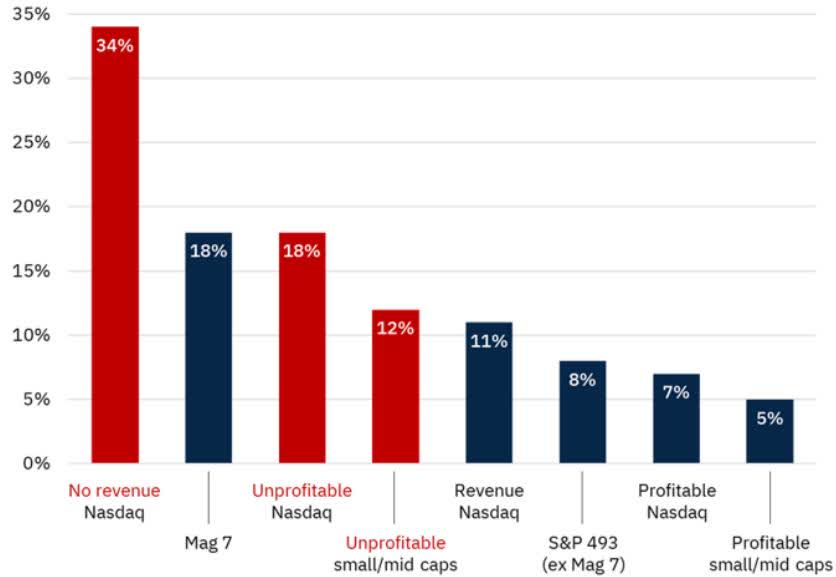
Source: Goldman Sachs Global Investment Research
Now to my point: If Nasdaq stocks with no revenues delivered the highest return to US investors in Q1-Q3 last year, and if unprofitable Nasdaq stocks came joint second, isn’t that about as strong a signal you can get that speculative fever is ample?
I could indeed provide plenty of other charts to support the issues I listed in Exhibit 1 but will only do one more – leverage is high (#8). Exhibit 3 below is testament to the fact that it is not only retail investors who get carried away from time to time. As you can see, in recent years when equity returns have been particularly strong, what have hedge funds done? Piling on ever more leverage, is the answer. This can only end in tears.
Line chart showing Hedge fund borrowings by source from 2013 to 2025.
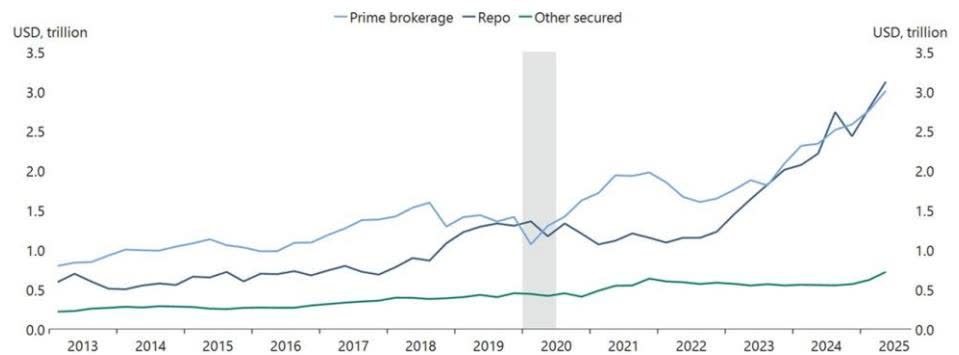
Source: Apollo Global Management
Final few words
In the fund we manage, we are, at least to a degree, caught in the same dilemma. It is easy to see (many) equities are overvalued, but by going too conservative you risk missing out on returns. Consequently, we remain nearly fully invested but with a defensive twist. We hold large positions in low beta equities and in certain commodities which tend to do much better than equities when stocks decline. Most importantly, we hold plenty of gold.
Rather surprisingly, our ‘defensive’ approach still led to extraordinary returns in 2025. We finished the year delivering +29.24% net to USD investors. That is obviously very pleasing; however, at the same time, I find it uncharacteristically worrying. If you deliver almost 30% to your investors, do you in fact take more risk than you think you do? Finding the answer to that question has kept us very busy in January.
Niels
Editor’s Note: The summary bullets for this article were chosen by Seeking Alpha editors.

Business
Oil Prices Plunge Below $95 as US-Iran Ceasefire Sparks Relief Rally in Volatile Energy Markets

NEW YORK — Oil prices tumbled sharply Wednesday after the United States and Iran announced a two-week ceasefire that raised hopes the partially reopened Strait of Hormuz could ease the worst global supply disruption in decades, sending benchmark crude below $95 a barrel for the first time in weeks.

West Texas Intermediate crude for May delivery fell as much as 18% intraday before settling around $92-94 per barrel in electronic trading, while international benchmark Brent crude dropped below $93. The dramatic reversal came after days of volatility that saw prices spike above $115 amid fears of prolonged closure of the critical waterway, which normally carries about one-fifth of the world’s oil and significant liquefied natural gas supplies.
As of mid-afternoon Wednesday, April 8, 2026, WTI was trading near $93.50, down sharply from Tuesday’s close above $110, according to futures data. Brent hovered around $92.70, reflecting a steep one-day decline of more than 15% in some contracts. The plunge followed President Donald Trump’s announcement late Tuesday of a fragile agreement allowing limited “safe passage” for approved vessels under Iranian oversight.
“This is classic ceasefire relief selling,” said one veteran energy trader in New York. “The market had priced in prolonged chaos. Any sign of de-escalation triggers a violent unwind.”
Geopolitical Shock Drives Earlier Surge
The sharp moves cap a turbulent period triggered by joint U.S.-Israeli strikes on Iran that began in late February. Iran retaliated by effectively blockading the Strait of Hormuz, attacking or threatening merchant vessels and slashing flows through the narrow chokepoint between the Persian Gulf and the Gulf of Oman.
Daily transits dropped more than 90% at times, removing roughly 20 million barrels per day of crude and products from global markets. Prices rocketed from the low $70s in early February to peaks near $120 in March, with some refined products like diesel and jet fuel briefly exceeding $200 in spot markets.
The disruption triggered emergency measures worldwide. Asian importers, heavily dependent on Gulf supplies, scrambled for alternatives, hoarded fuel and in some cases rationed supplies. U.S. gasoline prices climbed toward $4 per gallon in parts of the country, while airlines and shipping firms faced soaring fuel costs that rippled into consumer prices for goods from food to electronics.
Analysts at firms like Goldman Sachs and Macquarie had warned of potential spikes to $150 or even $200 if the strait remained closed into summer. The International Energy Agency cut its 2026 demand growth forecast by hundreds of thousands of barrels per day, citing flight cancellations, industrial slowdowns and conservation efforts.
Ceasefire Brings Cautious Optimism
The two-week pause, coordinated through back-channel diplomacy involving Oman and other regional players, allows selective transits under a “permission-based” system. Ship-tracking data Wednesday showed a modest uptick in movements, though volumes remained far below normal.
Trump described the deal as a foundation for broader negotiations, while Iranian officials emphasized it was conditional on halting further strikes. Shipping executives remained wary, noting sky-high insurance premiums and the risk of renewed incidents.
“Even limited reopening is a game-changer,” said an analyst at S&P Global. “Every additional tanker that clears the strait reduces the immediate supply shock and gives markets breathing room.”
U.S. officials downplayed the need for American naval escorts, urging allies to help secure routes. Russia and China, which had blocked stronger U.N. action, expressed support for the pause while continuing to criticize Western involvement.
Economic Ripple Effects and Demand Destruction
The price surge had already begun curbing demand. Early data showed softening consumption in Europe and Asia, with some manufacturers cutting shifts due to higher energy costs. Fertilizer prices, closely tied to natural gas, threatened agricultural output and food inflation.
In the United States, the Energy Information Administration noted rising inventories despite the global crunch, thanks to robust domestic production exceeding 13 million barrels per day. However, the global nature of oil markets meant U.S. consumers still felt the pain at the pump and in broader goods prices.
The plunge Wednesday eased some pressure but left prices well above pre-conflict levels. Analysts expect continued volatility as traders assess whether the ceasefire holds and how quickly full flows can resume.
“Demand destruction is real,” one economist noted. “If prices stay elevated even at $90-100, it could shave growth off global GDP while pushing inflation higher — a stagflationary mix central banks dread.”
Market Mechanics and Benchmarks
Oil prices are set in futures markets, with WTI reflecting U.S. supply dynamics and Brent serving as the global reference. Wednesday’s drop came amid thin trading volumes typical of volatile periods, amplifying swings.
OPEC+ has spare capacity, particularly in Saudi Arabia, but questions remain about how quickly it can ramp up and whether fiscal pressures limit output. U.S. shale producers can respond but face lags in drilling new wells.
Longer-term forecasts vary. Some banks project Brent averaging near $100 for the second quarter before easing later in 2026 if disruptions resolve. Others warn of renewed spikes if talks collapse.
Broader Energy Landscape
The crisis has spotlighted vulnerabilities in global energy infrastructure. Natural gas prices in Europe also swung wildly, though less dramatically than oil. Renewable energy advocates pointed to the episode as evidence for accelerating the transition away from fossil fuels, while oil industry leaders stressed the need for diversified supplies and resilient chokepoints.
For ordinary consumers, the swings translate into uncertainty. Higher fuel costs feed into everything from grocery bills to airfares. Truckers and farmers, already squeezed, monitor every tick of the market.
In shipping hubs from Singapore to Rotterdam, operators recalculate routes around Africa when Hormuz access is restricted, adding weeks and costs to journeys.
Outlook Hinges on Diplomacy
As the ceasefire window begins, attention turns to Friday talks potentially hosted in Pakistan and ongoing naval patrols. Shipping groups press for clear protocols to avoid miscalculations that could reignite conflict.
For now, the sharp drop provides temporary relief. Yet few expect a swift return to pre-crisis prices of $70-80. The memory of the Hormuz shock — the largest supply disruption in modern history — will likely keep a risk premium embedded in oil for months.
Energy ministers from consuming nations have discussed coordinated releases from strategic reserves, though such moves remain on hold pending clearer signals from the region.
In trading rooms and boardrooms worldwide, the message is caution. “This ceasefire is fragile,” one veteran commodities strategist said. “The market is pricing hope today. Tomorrow it may price fear again.”

Stratford-Upon-Avon Foodbank, which is part of the Trussell Trust, is preparing to move to a larger unit within the Precision Business Centre on Masons Road. The building will act as a community hub – housing a warehouse, distribution sessions, and support services under one roof for the first time.

Form 8K Patriot National Bancorp Inc For: 8 April

IG Group schedules AGM for May 19, sets seven-month reporting period
Business
LaGuardia Airport TSA Lines Shorten to Under 15 Minutes as Staffing Stabilizes Post-Shutdown Chaos

NEW YORK — Travelers at LaGuardia Airport faced relatively manageable security wait times Wednesday as TSA staffing levels continued to recover from a recent federal funding lapse that triggered some of the longest lines in the airport’s history earlier this spring.

As of mid-morning on April 8, 2026, official airport data showed general security lines averaging between 4 and 14 minutes across terminals, with TSA PreCheck lanes moving even faster at 1 to 7 minutes. Terminal A reported the longest general wait at about 14 minutes, while Terminal C offered some of the quickest screening at around 4 minutes for standard passengers and just 1 minute for PreCheck.
The improvement marks a welcome shift from March, when a partial government shutdown and delayed TSA paychecks led to officer shortages, absenteeism and security lines that snaked for hours at LaGuardia and other New York-area airports. At the peak of the crisis, some passengers at LaGuardia’s Terminal B endured waits exceeding three or even four hours, prompting widespread frustration, missed flights and emergency measures including temporary deployment of other federal personnel.
Port Authority of New York and New Jersey officials and the Transportation Security Administration have attributed the recent easing to restored funding and stabilizing workforce levels. “TSA staffing is beginning to stabilize, but wait times remain subject to fluctuations based on passenger volume,” the LaGuardia Airport website cautioned travelers Wednesday. “Please allow extra time.”
Current Conditions at LaGuardia Terminals
LaGuardia operates three main terminals serving a mix of domestic and limited international flights. Real-time monitors Wednesday morning painted a picture of moderate activity rather than the bottlenecks seen weeks earlier:
- Terminal A: General line approximately 14 minutes; TSA PreCheck around 7 minutes.
- Terminal B: General line about 9 minutes; PreCheck roughly 6 minutes. This terminal, a hub for airlines including American, Delta and Southwest, has historically seen heavier crowds.
- Terminal C: General line near 4 minutes; PreCheck as low as 1 minute, making it the fastest option for many travelers.
Hourly forecasts from monitoring sites suggested potential spikes during typical midday rushes, with waits possibly climbing toward 15-30 minutes in the late morning and early afternoon before easing again in the evening. Early morning data from previous days showed occasional peaks near 30 minutes around 4-5 a.m. and midday, but current trends remained well below crisis levels.
Delta Air Lines’ own wait-time tracker aligned with these figures, reporting TSA PreCheck at LaGuardia around 6 minutes and regular lanes as low as 2 minutes in some snapshots early Wednesday.
Airport officials recommend checking the official LaGuardia website or the MyTSA app for the most current estimates, as times can shift rapidly with flight schedules, weather disruptions or sudden surges in passengers.
Lingering Effects of the TSA Funding Crisis
The spring 2026 TSA staffing crisis stemmed from a federal funding dispute that left thousands of officers working without timely pay. Absentee rates climbed as high as 11.7% on some days, forcing airports nationwide to operate with reduced checkpoints and longer processing times.
At LaGuardia, the impact was particularly visible. Video footage from early April showed long, snaking lines filling concourses, with passengers reporting waits of 90 minutes or more even in PreCheck lanes on busy afternoons. Some travelers described scenes of chaos, with families missing flights and business passengers scrambling to rebook.
In response, the Port Authority and TSA explored temporary solutions, including cross-training staff and, in limited cases, assistance from other agencies. President Donald Trump signed an executive action to accelerate back pay, which helped stem the exodus of officers and allowed lines to gradually shorten by early April.
By Easter weekend, many terminals at LaGuardia reported waits of just 1-3 minutes in general lanes, offering a brief respite. However, officials warned that full normalization could take weeks as recruitment and retention efforts continue. TSA has faced broader challenges in recent years, including high turnover and competition from other sectors for workers.
Tips for Smoother Security at LaGuardia
Travelers can take several steps to minimize delays amid fluctuating conditions:
- Enroll in TSA PreCheck or CLEAR: These programs consistently deliver the shortest waits. PreCheck allows eligible passengers to keep shoes, belts and light jackets on, while CLEAR uses biometric screening to skip to the front of the line.
- Arrive Early: Airport guidance suggests reaching LaGuardia at least two hours before domestic flights, or three hours for international or peak periods. Add buffer time if traveling with children, checked bags or during known busy windows (roughly 7:30-9:30 a.m. and 4:30-6:30 p.m.).
- Pack Smart: Follow the 3-1-1 liquids rule and remove electronics and large toiletries in advance to speed screening.
- Monitor Real-Time Data: Use the LaGuardia website, MyTSA app or third-party trackers like takeofftimer.com for live updates. Walk times from security to gates are also posted and typically range from 5-15 minutes depending on the terminal and gate location.
- Consider Alternatives: Some frequent flyers opt for rideshare drop-off timing or even private security fast-track services offered by certain terminals or airlines.
Despite shorter lines Wednesday, the airport urged caution. “Security wait times are significantly longer than normal” in some announcements, reflecting caution after the recent volatility.
Broader Context for New York-Area Travelers
LaGuardia’s security situation mirrors challenges at neighboring John F. Kennedy International and Newark Liberty airports, where lines have also eased but remain unpredictable. The three major New York airports handle tens of millions of passengers annually, making even modest staffing shortfalls noticeable.
Nationwide, TSA screened record numbers of travelers in recent years, with daily volumes often exceeding 2 million during peak seasons. The agency has pushed enrollment in PreCheck, which now covers millions of travelers, as a key tool for reducing congestion.
Aviation experts note that LaGuardia’s relatively compact layout compared to sprawling hubs like JFK can amplify the visibility of lines when they form. Recent terminal renovations have improved flow in some areas, but checkpoint capacity remains tied to available officers.
For international passengers or those connecting from overseas, additional CBP processing can add time after security, though LaGuardia’s international footprint is smaller than JFK’s.
Passenger Experiences and Airline Responses
Travelers shared mixed feedback on social media and forums Wednesday. Some praised quick passages through Terminal C PreCheck, while others noted minor backups at Terminal A during morning rushes. Reddit threads from recent weeks recounted everything from 48-minute standard-lane waits to near-empty PreCheck experiences, underscoring the variability.
Airlines including Delta, American and JetBlue have advised passengers via apps and emails to monitor TSA conditions and build in extra time. Some carriers have adjusted gate operations or offered rebooking flexibility during past disruptions.
Flight delays at LaGuardia on Wednesday appeared limited, though any security slowdown can cascade into gate holds and ground stops. The airport’s flight tracker showed typical midweek activity without major widespread disruptions tied to security.
Looking Ahead: Stability or New Challenges?
As TSA staffing recovers, attention turns to long-term solutions. Proposals include faster hiring pipelines, better pay incentives and technology upgrades such as advanced CT scanners that allow more liquids and electronics to remain in bags.
For now, the message from LaGuardia remains consistent: conditions are improving but not guaranteed. Passengers on Wednesday enjoyed some of the lighter waits seen in recent memory, yet the memory of multi-hour lines in March lingers.
Travelers departing later in the day or during evening peaks were advised to check updates closer to arrival. With spring travel season underway and summer vacations on the horizon, both the airport and TSA continue monitoring staffing to prevent a return to chaos.
For the latest figures, visitors should consult laguardiaairport.com or the MyTSA mobile application directly, as posted times are estimates and can evolve quickly with real-world conditions.

Mortgage rates have been rising and hundreds of the cheapest deals have disappeared over the last month.

Apple is gearing up for a significant update to its popular iPad mini lineup later this year, with reliable leaks pointing to the long-awaited addition of an OLED display, a more powerful processor and other enhancements that could make the compact tablet even more competitive against larger iPad models and rival devices.

The next-generation iPad mini, often referred to in rumors as the iPad mini 8, is expected to launch in the second half of 2026 — most likely September or October — according to multiple supply chain reports and analysts. While Apple has not confirmed any details, the rumors suggest the small but mighty tablet is poised for its biggest overhaul since the 2024 model introduced the A17 Pro chip and full Apple Intelligence support.
Industry watchers say the move to OLED could transform the 8.3-inch device into a premium portable experience, offering deeper blacks, richer colors, higher contrast and potentially improved battery efficiency compared to the current Liquid Retina LCD panel.
OLED Display: The Most Anticipated Upgrade
The standout rumor centers on the display. Several reports indicate Apple plans to equip the new iPad mini with OLED technology, possibly including ProMotion 120Hz refresh rates for smoother scrolling and gaming.
Bloomberg’s Mark Gurman has reported that the iPad mini is likely to be among the next Apple devices to adopt OLED, following the high-end iPad Pro models that debuted the technology in 2024. Korean outlets such as ET News and ZDNET Korea, along with supply chain sources, have suggested mass production of OLED panels for the mini could begin in late 2025, targeting a 2026 release.
Analyst firm Omdia initially projected OLED for the iPad mini in 2027, but more recent leaks have accelerated that timeline to as early as the second half of 2026. Samsung Display is reportedly developing sample panels, with mass production slated for its Cheonan facility. Some speculation even mentions a slight size increase to around 8.5 or 8.7 inches through slimmer bezels, though the overall compact footprint is expected to remain.
“This would be a game-changer for the iPad mini,” said one analyst who follows Apple’s supply chain closely. “The current LCD is good, but OLED would bring it closer to Pro-level visuals in a device you can hold in one hand.”
Additional display rumors include possible tandem OLED layering for brighter output and better power management, similar to techniques used in recent iPad Pro models. ProMotion support remains unconfirmed but frequently appears in enthusiast discussions and YouTube leak roundups.
Powerful New Chip and Performance Boost
Under the hood, the iPad mini 8 is rumored to feature either the A19 Pro or even an A20 Pro chip. Code references discovered in Apple software last year pointed to an A19 Pro variant for a device codenamed J510 or J511, which aligns with the next mini.
Some tipsters suggest Apple could go further with an A20 Pro, the same advanced processor expected in future iPhone models fabricated on TSMC’s 2nm process. This would deliver substantial gains in CPU and GPU performance, making the mini suitable for more demanding tasks like video editing, gaming and on-device AI features.
RAM is expected to increase as well. The current iPad mini 7 already boasts 8GB, sufficient for Apple Intelligence, but reports point to 8GB or more in the successor to support future software capabilities. Connectivity upgrades could include a newer modem for improved 5G speeds and Wi-Fi 7 support via an N1 chip.
Battery life is another area of speculation. OLED’s efficiency advantages, combined with potential chassis redesigns, might allow for similar or better endurance despite any performance bump. Rumors have also floated ideas like a “vibrating chassis” speaker system for improved audio without traditional grilles, and even enhanced water resistance.
Design: Familiar Form With Subtle Refinements
Most leaks suggest the overall design will stay close to the current model — thin, lightweight and highly portable with Touch ID in the power button rather than Face ID. The single rear camera and landscape-oriented selfie camera are likely to carry over, though minor tweaks to the aluminum unibody could appear.
Apple has shown restraint with the mini’s industrial design in recent years, focusing instead on internal upgrades. If bezels shrink for a marginally larger screen, the device could feel more modern without losing its signature one-handed usability.
Storage options are expected to start at 128GB, matching the current base model, with higher tiers up to 512GB or more. Pricing rumors are scarce, but analysts anticipate the starting point to remain around $499, though a premium OLED panel could push entry-level configs slightly higher.
Release Timeline and Market Context
Apple typically unveils new iPads in the fall, often alongside or shortly after iPhone events. With the iPad mini 7 having launched in October 2024, a roughly two-year cycle would place the successor in fall 2026 — consistent with historical patterns for this product line, which does not receive annual refreshes like the iPhone.
Some reports mention the possibility of the new mini arriving alongside an updated iPad Air that could also gain OLED. However, the base iPad and higher-end Pro models are on different timelines, with the next major Pro redesign not expected until 2027.
The timing comes as competition in the compact tablet space heats up. Android rivals continue to offer foldable or larger-screen options, while consumers weigh the iPad mini against the more powerful but bulkier iPad Air and MacBook Air for on-the-go productivity.
Apple Intelligence features, introduced on the current mini, are expected to expand with iPadOS 26 or later, benefiting from the rumored faster chip. Enhanced Apple Pencil support and potential new accessories could round out the package.
Will It Be Worth the Wait?
For owners of the iPad mini 7, the decision to upgrade will depend on how compelling the OLED and performance jumps prove. Early adopters who purchased the 2024 model for its A17 Pro chip and doubled base storage may find the current device still capable for most tasks in 2026.
Yet for readers, note-takers, travelers and casual gamers who crave better visuals and future-proofing, the rumored 2026 model sounds enticing. “If OLED and 120Hz make it in, this could feel like a whole new category of mini tablet,” one tech commentator noted in a recent video analysis.
Supply chain activity already hints at preparation. Samsung and LG are positioned to supply the OLED panels, and component testing appears underway.
Apple has a history of underpromising and overdelivering on hardware, so final specs could differ. The company is notoriously tight-lipped, often letting leaks build anticipation before official announcements.
As spring 2026 progresses, more concrete details may emerge from developers, coders and factory sources. For now, the iPad mini 8 remains one of the most discussed upcoming Apple products, with enthusiasts eagerly tracking every supply chain whisper.
Whether the rumors hold or Apple surprises with additional features, the compact tablet’s next chapter appears set to elevate its status from convenient sidekick to a more versatile everyday powerhouse.

OPINION: Time management, wellbeing and financial pressures are among the reasons students fail to finish university.

YOSEMITE NATIONAL PARK, Calif. — Yosemite National Park, one of America’s most iconic natural treasures, offers visitors in 2026 an unprecedented level of flexibility with no vehicle entry reservations required for the entire year, including peak summer months and the popular Horsetail Fall “Firefall” event.
The National Park Service announced in February that Yosemite will forgo timed-entry systems used in recent years, relying instead on real-time traffic management, additional seasonal staffing and temporary diversions when parking reaches capacity. This change, following evaluation of 2025 visitation patterns, makes 2026 an ideal time to plan a trip to the park’s granite cliffs, thundering waterfalls and ancient sequoia groves without the stress of securing advance permits.

With roughly 4 million visitors annually in recent years, Yosemite remains a bucket-list destination. Here are 10 compelling reasons to experience it in 2026, when access feels more spontaneous yet the park’s timeless wonders shine as brightly as ever.
1. Easier Access Without Reservation Hassles
For the first time in several years, drivers can enter Yosemite without booking a timed vehicle reservation, even during busy summer weekends or the February-March Firefall window. Park officials will monitor traffic and implement short-term management measures as needed, such as temporary diversions.
Visitors can purchase entrance passes online in advance through Recreation.gov for smoother arrival or buy them at the five entrance stations. This shift broadens access while the park strengthens staffing to handle crowds responsibly. Weekday visits and exploration of less-visited areas like Hetch Hetchy or the high country remain smart strategies for avoiding peak congestion.
2. Spectacular Spring and Early Summer Waterfalls at Peak Flow
Yosemite’s waterfalls roar with snowmelt, creating some of the most dramatic displays in the world. Yosemite Falls, North America’s tallest at 2,425 feet, thunders in multiple tiers, while Bridalveil Fall, Vernal Fall and Nevada Fall offer misty hikes and viewpoints.
In 2026, with roads like Glacier Point and parts of Tioga Pass opening progressively from May onward, visitors can time trips for April through June when flows often hit maximum. Early spring also brings fewer crowds than midsummer, letting hikers enjoy the mist without battling peak-season heat.
3. Iconic Granite Landmarks and World-Class Views
The park’s signature granite formations — Half Dome, El Capitan and Sentinel Rock — dominate the landscape. Sunrise at Tunnel View delivers postcard-perfect panoramas of the valley, while Glacier Point offers sweeping vistas of Half Dome and the high Sierra.
Climbers from around the globe tackle El Capitan’s sheer 3,000-foot face, providing free entertainment for spectators with binoculars. In 2026, with no entry barriers, spontaneous day trips to these landmarks become simpler, though parking management in Yosemite Valley will encourage early arrivals or shuttle use.
4. Ancient Giant Sequoias in Mariposa Grove
Walking among the Mariposa Grove’s roughly 500 mature giant sequoias feels humbling. The Grizzly Giant, estimated at more than 1,800 years old, stands as a living testament to the park’s deep time.
A free shuttle from the welcome plaza operates seasonally, and trail improvements funded by the Yosemite Conservancy continue to enhance access. The grove provides a serene contrast to the busy valley floor, ideal for families or those seeking contemplative moments amid towering trees.
5. World-Class Hiking for Every Ability
With more than 750 miles of trails, Yosemite caters to novices and experts alike. Easy valley loops, moderate Mist Trail climbs to Vernal Fall and strenuous Half Dome cables (permit required for the final section) offer options year-round.
In 2026, ongoing trail rehabilitation projects — including work near Cathedral Lakes and in the Merced River corridor — promise improved conditions. High-country areas like Tuolumne Meadows typically open by mid-June, revealing wildflower meadows and alpine lakes once snow recedes.
6. Opportunities to Witness the Rare “Firefall”
Horsetail Fall transforms into a glowing “Firefall” when sunset light hits the waterfall just right, usually in mid- to late February. In 2026, no special reservations are needed for the event, though parking restrictions and trail access rules will apply to manage crowds.
The phenomenon draws photographers and spectators, but officials remind visitors to practice Leave No Trace principles. Even outside Firefall season, sunset and sunrise light on the cliffs creates magical alpenglow moments.
7. Rich Biodiversity and Wildlife Viewing
Black bears, mule deer, bobcats and more than 400 bird species call Yosemite home. Spring and summer bring active wildlife, from birds nesting to bears foraging — though proper food storage remains essential.
The park’s varied ecosystems, from oak woodlands to subalpine forests, support diverse flora. Wildflower blooms in meadows and along trails add color, particularly after wet winters. Educational programs and ranger-led walks help visitors appreciate this ecological richness responsibly.
8. Stargazing and Dark Skies in a Pristine Setting
Far from urban light pollution, Yosemite offers excellent stargazing. The park’s high elevation and clear mountain air reveal the Milky Way in stunning detail on moonless nights.
Summer evenings in the valley or high country provide prime viewing. Rangers occasionally host astronomy programs, and the surrounding wilderness enhances the sense of isolation and wonder under vast skies.
9. Philanthropic Improvements Enhancing the Visitor Experience
The Yosemite Conservancy announced $19 million in 2026 funding for about 60 projects, including meadow restoration in the high country, trail rehabilitation spanning dozens of miles, and even an AI study on bear behavior to improve human-wildlife coexistence.
These efforts, alongside park initiatives, aim to protect resources while boosting access. Visitors in 2026 will benefit from better-maintained paths and interpretive enhancements without compromising the park’s wild character.
10. A Historic Landscape That Inspired the National Park Idea
Yosemite’s preservation story dates to 1864, when President Abraham Lincoln signed the Yosemite Grant, laying groundwork for the national park system. John Muir’s advocacy further cemented its legacy as a place of inspiration and conservation.
In 2026, amid ongoing discussions about balancing access and preservation, a visit connects travelers to this heritage. Whether camping, staying in historic lodges like The Ahwahnee or simply driving through, the park offers reflection on humanity’s relationship with nature.
Practical Tips for a 2026 Visit
Entrance fees remain required: $35 per vehicle for seven days or consider the America the Beautiful Pass. Nonresident fees may see adjustments, so check nps.gov for current rates. Lodging and camping inside the park book quickly, so reserve early through authorized channels.
Weather varies dramatically by elevation and season; pack layers and check conditions for road openings. Shuttle buses in Yosemite Valley reduce parking pressure, and apps or the park website provide real-time updates.
Wildfire risk persists in California’s dry summers, but the park maintains strong preparedness. Officials encourage flexibility, especially on weekends, and exploration beyond the valley floor to disperse crowds.
For many, 2026 represents a sweet spot: easier logistical planning combined with the park’s enduring majesty. Whether chasing waterfalls in spring, hiking high trails in summer or catching autumn colors, Yosemite delivers unforgettable experiences.
As one longtime ranger noted, “The mountains are calling — and in 2026, more people than ever can answer without extra hurdles.”

ANALYSIS: Recent data supports a push for more classrooms to keep up with population growth.

The Viral ‘Jessica’ Toddler Tantrum Hack Is Not A Long-Term Parenting Fix

Konnor Griffin extension: Pirates lock up top prospect on nine-year deal

Google Photos now saves you a precious second with a iPhone-like copy trick

Why Israel is blocking foreign journalists from entering

Bitcoin: We’re Entering The Most Dangerous Phase

Alan Cumming Brands Baftas Ceremony A ‘Triggering S**tshow’

These 6 simple rules can change your financial future #MoneyRules #FinancialFreedom #MoneyManagement

FASILITAS NUKLIR IRAN DISERANG! #trading #kriptodump #trader #forex #crypcurrencey #bitcoin #kripto

Rewire Your Happiness – Luke Belmar #motivation #lukebelmar #success
-

 NewsBeat6 days ago
Steven Gerrard disagrees with Gary Neville over ‘shock’ Chelsea and Arsenal claim | Football
-

 Business6 days ago
No Jackpot Winner and $194 Million Prize Rolls Over
-

 Fashion5 days ago
Weekend Open Thread: Spanx – Corporette.com
-

 Crypto World7 days ago
Gold Price Prediction: Worst Month in 17 Years fo Save Haven Rock
-

 Business3 days ago
Three Gulf funds agree to back Paramount’s $81 billion takeover of Warner, WSJ reports
-

 Business4 days ago
Expert Picks for Every Need
-

 Sports4 days ago
India men’s 4x400m and mixed 4x100m relay teams register big progress | Other Sports News
-

 Business6 days ago
Login and Checkout Issues Spark Merchant Frustration
-

 Tech15 hours ago
How Long Can You Drive With Expired Registration? What Florida Law Says
-
Business3 days ago
No Jackpot Winner, Prize to Climb to $231 Million
-

 Tech6 days ago
Commonwealth Fusion Systems leans on magnets for near-term revenue
-

 Fashion2 days ago
Massimo Dutti Offers Inspiration for Your Summer Mood Board
-

 Crypto World7 days ago
Ripple rolls out enterprise crypto treasury platform for corporates
-

 Tech7 days ago
Drawing Tablet Controls Laser In Real-Time
-

 Crypto World7 days ago
Why It’s Partnering, Not Issuing
-
Politics5 days ago
Wings Over Scotland | The quality of mercy
-
 Sports7 days ago
Steal Gary Woodland’s subtle power move for longer drives
-
 Tech7 days ago
Battery Tester Outperforms Cheaper Options
-

 Business4 days ago
Akebia Therapeutics, Inc. (AKBA) Discusses Pipeline Progress and Strategic Focus on Kidney Disease Treatments at R&D Day – Slideshow
-

 Fashion20 hours ago
Let’s Discuss: DEI in 2026
You must be logged in to post a comment Login