
Crypto World
$2.9B Bitcoin ETF Outflow Signals Downside as Bearish Futures Loom
Bitcoin (CRYPTO: BTC) traded below $73,000 on Wednesday after briefly retesting the $79,500 level the day prior, as a softer tech backdrop ripples into crypto markets. The move mirrors a broader risk-off tilt that has been evident in the Nasdaq, where a weak sales outlook from chipmaker AMD (NASDAQ: AMD) and softer US payroll data turned investors away from high-beta assets. The price action underscores how crypto is not insulated from macro shifts, even as it trades in a market that remains highly sensitive to liquidity and leverage dynamics.
Key takeaways
- Heavy outflows from Bitcoin spot ETFs persist, with more than $2.9 billion leaving US-listed funds across roughly 12 trading days, signaling renewed pain for leveraged long positions.
- BTC options markets show elevated hedging activity, as professional traders buy downside protection, pushing the 30-day delta skew higher and signaling skepticism about a swift bottom near $72,100.
- Leverage-driven risk outside spot markets remains a pressure point: leveraged long BTC futures liquidations totaled about $3.25 billion during the recent pullback, wiping out substantial margin and forcing rapid deleveraging.
- Industry mechanics remain a focal point: some market observers argue that crypto-exchange liquidation engines are not self-stabilizing in the same way TradFi circuit breakers are, highlighting ongoing fragility even as history suggests eventual recovery.
- Two unfounded rumors continue to circulate: a purported $9 billion Galaxy Digital Bitcoin sale tied to quantum concerns and renewed questions about Binance’s solvency, though on-chain metrics and company statements offer some counterpoints to panic.
Bitcoin (CRYPTO: BTC) slid below $73,000 on Wednesday after briefly retesting the $79,500 level on Tuesday, a retreat that aligned with a broader risk-off move in equities led by a downbeat tech sector. The downturn followed a slide in the Nasdaq, reflecting weaker near-term demand signals from major tech companies and the spillover into risk assets beyond stocks. The pressure is not purely cyclical; it is reinforced by flows that have kept outflows from spot Bitcoin ETFs elevated in recent weeks.
The persistent outflows from spot Bitcoin ETFs add a layer of complexity to the price action. The daily rhythm of fund flows has remained negative, with an average net outflow running around $243 million since mid-January. That cadence coincided with Bitcoin’s rejection at the $98,000 level earlier in the month and helped set the stage for a roughly 26% correction over three weeks. In practical terms, the cascading effect of outflows has amplified liquidity stress for leveraged traders, and unless new margin is deposited, the most aggressive 4x or higher positions may have already seen their risk exposure largely eroded.
Another thread driving narrative risk is the potential for continued volatility in the broader crypto ecosystem. The market has faced a mix of volatile events and rumors about the health of counterparties. A longstanding concern is the possibility that outsized losses from a single event could cascade through liquidity-providing venues. One notable episode cited by market observers is the $19 billion liquidation tied to a mid-October 2025 incident that reportedly originated from a performance glitch in Binance’s data feeds, which delayed transfers and fed inaccurate price signals. Binance acknowledged fault and subsequently issued compensation, but the episode left a lasting impression on risk controls across the space.
In conversations with industry participants, Haseeb Qureshi, managing partner at Dragonfly, described the October 2025 event as a case study in how liquidations can hit market-makers and liquidity providers. “Liquidation engines kept firing even when liquidity could not be absorbed, wiping out market makers and forcing a protracted recovery,” he noted. He added that while the crash did not permanently break the market, a return to normal functioning would require time and a repricing of risk for market participants who relied on aggressive leverage. The sentiment among traders is one of cautious realism: the market has recovered from prior shocks, but the path remains bumpy and contingent on liquidity and macro conditions.

Beyond pure price action, the options market provides a lens into how professionals are positioning for further downside. The 30-day delta skew for Bitcoin 25% delta puts against calls rose to about 13% on Wednesday, signaling that demand for downside protection remains elevated and that even seasoned traders are not confident a durable bottom has formed around the $72,100 level. In practice, a skew above several percent is interpreted as a signal that informed participants are bracing for additional weakness, rather than a swift reversal. The data point, sourced from Deribit through Laevitas, underlines a market that is hedging against a continued drawdown rather than embracing a V-shaped recovery—at least in the near term.
The broader macro backdrop has not yet clarified the near-term trajectory for crypto markets. A key question remains whether spot ETF outflows will persist or abate in the weeks ahead, and how that will interplay with liquidity conditions across major crypto venues. Onchain noise and counterparty concerns continue to simmer, but the market has shown time and again that it can adapt to shocks—though not without interim pain for those exposed to highly leveraged bets.
Why it matters
The current sequence of ETF outflows, leveraged liquidations and hedging activity paints a portrait of a market in transition. It highlights how entrenched leverage remains in some segments of the Bitcoin ecosystem and how quickly liquidity can tighten when risk appetite cools. For traders, the combination of elevated downside hedges and growing suspicion about the sustainability of rallies underscores the importance of margin discipline and robust risk controls. For market-makers and liquidity providers, the episode serves as a reminder that crypto markets still rely heavily on automated liquidation mechanisms that can amplify short-term moves during stress, even as the broader market has learned to rebound from past crises.
From a broader perspective, these dynamics unfold within a sector that remains highly sensitive to outside forces—tech stock sentiment, central-bank policy expectations, and regulatory developments all feed into crypto liquidity. The outflows from spot Bitcoin ETFs—paired with a demand for downside protection in options markets—suggest a risk-off impulse that could persist if macro data continues to disappoint or if equity sell-offs intensify. Yet the history of Bitcoin and other digital assets shows resilience: even after sharp declines, recovery tends to follow, driven by new demand fundamentals and tail-risk hedging strategies that gradually re-enter the market.
For users and builders, the current environment emphasizes the need for clarity around risk models, improved liquidity infrastructure, and more robust stress-testing across venues. It also underscores the value of transparent communications from major counterparties and a cautious approach to leverage, given how quickly market dynamics can shift in crypto ecosystems.
What to watch next
- Next 2–4 weeks: track spot Bitcoin ETF inflows/outflows to gauge whether the current risk-off phase persists or eases.
- Watch BTC 30-day delta skew updates for indications of whether professional hedging is cooling or intensifying.
- Monitor Binance withdrawal and on-chain reserve metrics for evidence of liquidity stress or stabilization.
- Follow public statements from Galaxy Digital and other market participants regarding structural risk and counterparty health.
Sources & verification
- CoinGlass data on Bitcoin spot ETF daily net flows and overall ETF outflows.
- Deribit 30-day delta skew (put-call) data via Laevitas, used to gauge professional hedging behavior.
- Dragonfly partner Haseeb Qureshi’s comments on liquidation dynamics and market recovery timelines.
- Galaxy Digital statements denying quantum-risk-driven sales, as reported by company or executives on X.
- On-chain metrics indicating Bitcoin deposits at Binance remained relatively stable amid withdrawal-related concerns.
Market reaction and key details
Bitcoin (CRYPTO: BTC) has faced renewed downward pressure as liquidity constraints and risk-off sentiment took hold. The failure to sustain a breakout near the $80,000 level—and the subsequent retreat to the mid-$70,000s—came amid a familiar pattern: outsized ETF outflows, a sharp squeeze on leveraged long positions, and rising skepticism among professional traders about a rapid bottom. The narrative has shifted away from a straightforward macro-driven rally toward a more nuanced story about risk management, liquidity provisioning, and the mechanics of how markets absorb shocks in a highly interconnected, cross-asset ecosystem.
Two notable developments stand out as the market adjusts: first, the swing in option hedging signals shows that seasoned traders are actively protecting against further declines, not simply chasing a rebound. The delta skew, a gauge of put versus call demand, has moved higher, highlighting the demand for downside protection in a climate where tech equities are under stress. Second, while the rumor mill churns with talk of large liquidations and counterparty concerns, on-chain and public disclosures suggest a more nuanced picture of counterparty health and liquidity at major venues. The market remains attentive to any fresh data about exchange resilience and the speed with which risk controls can recalibrate after a sell-off.
As traders weigh the near-term path, the interplay between ETF flows, derivatives positioning, and counterparty risk continues to be the defining feature of Bitcoin’s price action in the current cycle. The consensus remains unsettled: the market has a history of snapping back after downturns, but the path to normalization can be long and episodic, with interim pain for those positioned for a quick recovery. The coming weeks will be closely watched for changes in liquidity conditions, regulatory guidance, and the pace at which market participants adjust their risk tolerances in response to evolving macro signals and internal risk controls.

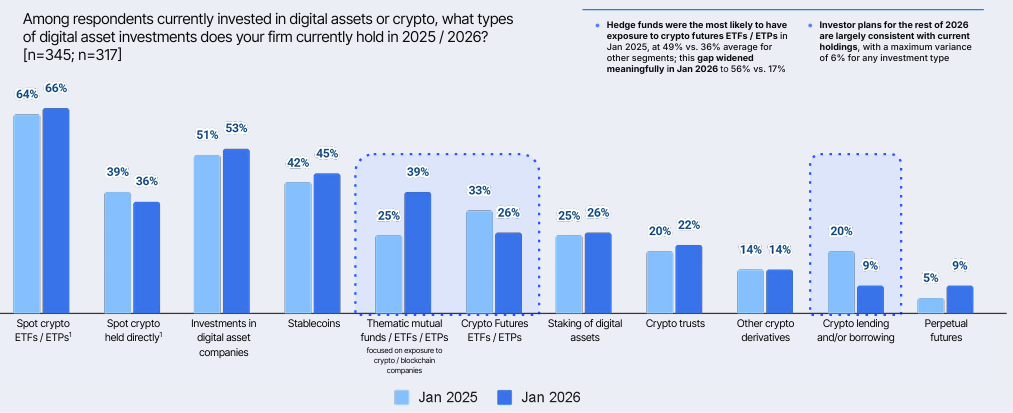
The crypto market sell-off since October hasn’t deterred institutional investors, with a new survey showing most plan to increase exposure to digital assets in the coming year.
According to a January survey of 351 institutional investors conducted by Coinbase and EY-Parthenon, 73% of respondents said they plan to increase their allocations of digital assets in 2026, while 74% expect crypto prices to rise over the next 12 months.
Two-thirds of respondents said exchange-traded products (ETPs) and other regulated vehicles have become their preferred way to gain exposure, reflecting growing familiarity with these instruments and a broader shift toward regulated access points. Regulation was also cited as a key factor attracting institutional participation.
On the regulatory front, more than three-quarters of respondents cited market structure as the most important area requiring clarity — a concern that comes as US lawmakers continue to debate legislation defining how digital assets are classified and regulated across agencies.
Market volatility, however, is reshaping how institutions approach crypto. Nearly half (49%) of respondents said recent turbulence has led them to place greater emphasis on risk management, liquidity and position sizing, rather than reducing exposure.

Related: Crypto’s 2026 investment playbook: Bitcoin, stablecoin infrastructure, tokenized assets
Stablecoins, tokenization gain traction
One of the key takeaways from the survey is growing institutional interest in emerging blockchain use cases such as stablecoins and tokenized real-world assets (RWAs).
According to the findings, 85% of respondents use or plan to use stablecoins for payments and treasury operations, with settlement and internal cash management cited as primary use cases.
Part of that momentum is being driven by US regulatory developments, with 83% of respondents saying the passage of the GENIUS Act will increase financial institutions’ willingness to engage with stablecoins. More than two-thirds (69%) said the law will drive broader adoption of stablecoin-based transactions.

Meanwhile, interest in tokenized assets continues to grow, with 63% of investors expressing interest in gaining exposure and 61% expecting tokenization to have a significant impact on market structure in the coming years.
Related: SEC’s ‘Crypto Mom’ calls for simpler disclosure rules, flags tokenization debate
XRP digital asset treasury Evernorth has submitted a key filing with the SEC, putting it a step closer to its goal of going public on the Nasdaq stock exchange.
The Ripple Labs-backed firm announced plans to go public in October as part of a merger with special purpose acquisition company (SPAC) Armada Acquisition Corp. II (Armada II).
In a statement on Wednesday, Evernorth announced that it had filed a Form S-4 registration statement with the US Securities and Exchange Commission (SEC), marking the final major regulatory hurdle before launching via a SPAC.
Evernorth eyes ticker XRPN
If the SEC approves the filing, Evernorth said it will still need final approval from Armada II shareholders for the merger, after which it can move forward with listing on the Nasdaq under the ticker XRPN.
Evernorth stated in October that it expects the merger to generate $1 billion in gross proceeds, which will be primarily used to build an XRP treasury, with a smaller portion of the funds being allocated to operating and deal expenses.
XRP treasury faces market turbulence
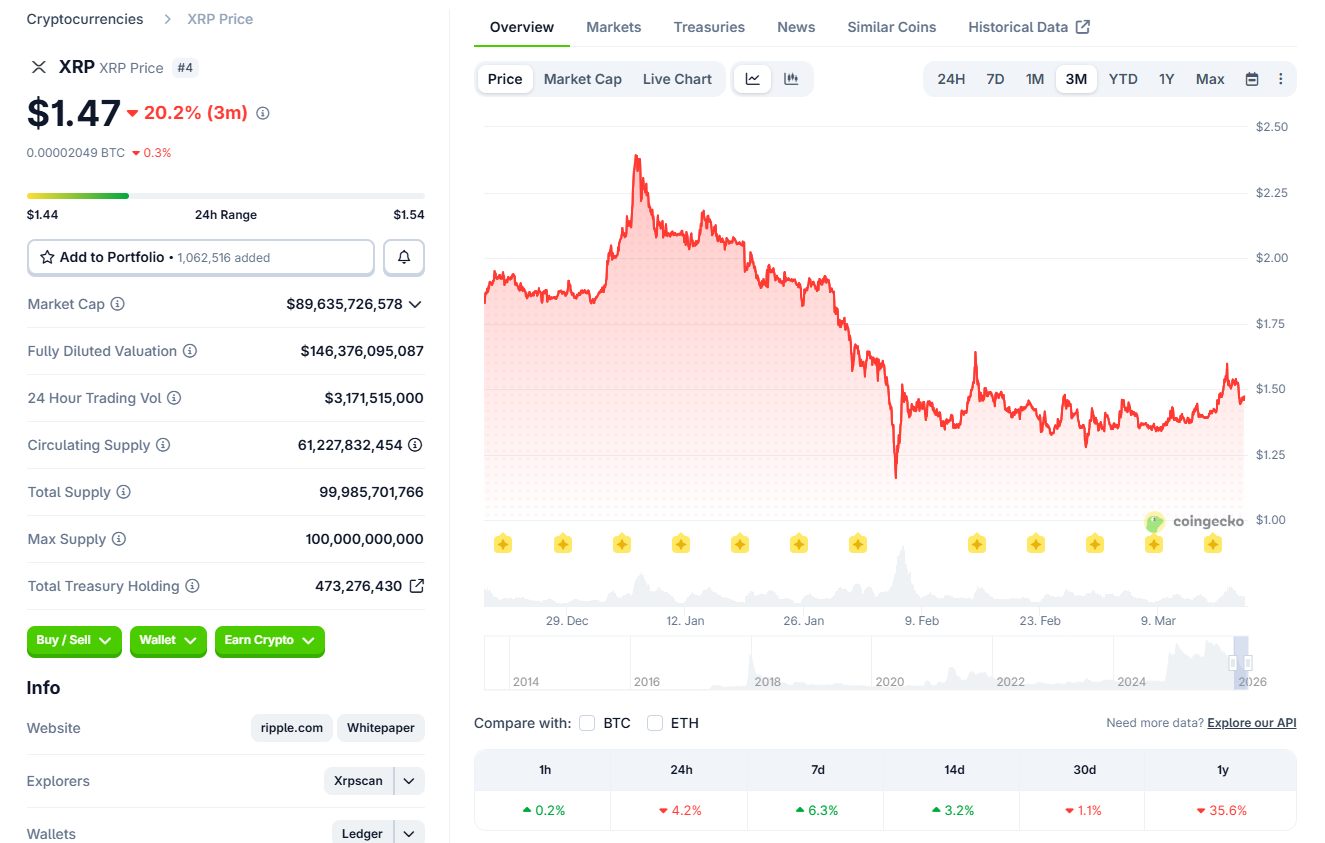
Evernorth has already begun building its XRP (XRP) treasury, with CoinGecko data showing the firm’s total treasury value is at $692.24 million, made up of 473.27 million XRP, which it made in two tranches between Oct. 20 and Nov. 4.
With an average cost per XRP at $2.54, the value of its holdings has fallen 19.1% over the past three months amid a broader crypto market downturn. At the time of writing, XRP is currently priced at $1.47.

Related: Ripple to buy back $750M in shares through April: Report
SEC provides clarity for crypto and XRP
Evernorth’s treasury plans come as XRP was among a number of tokens declared as a digital commodity in guidance published by the SEC on Tuesday.
In a notice on Tuesday, the SEC declared that generally only tokenized securities remain “subject to the securities laws.”
Other tokens used in its digital commodities example included Aptos (APT), Avalanche (AVAX), Bitcoin (BTC), Dogecoin (DOGE) and Ethereum (ETH).
“We always knew XRP wasn’t a security – and now the @SECGov has made clear what it is: a digital commodity. Grateful to the Crypto Task Force for working to deliver the clarity that markets, investors, and innovators have long deserved,” said Ripple’s chief legal officer, Stuart Alderoty via X on Tuesday.

Magazine: Big Questions: Can Bitcoin save you from the dreaded Cantillon Effect?

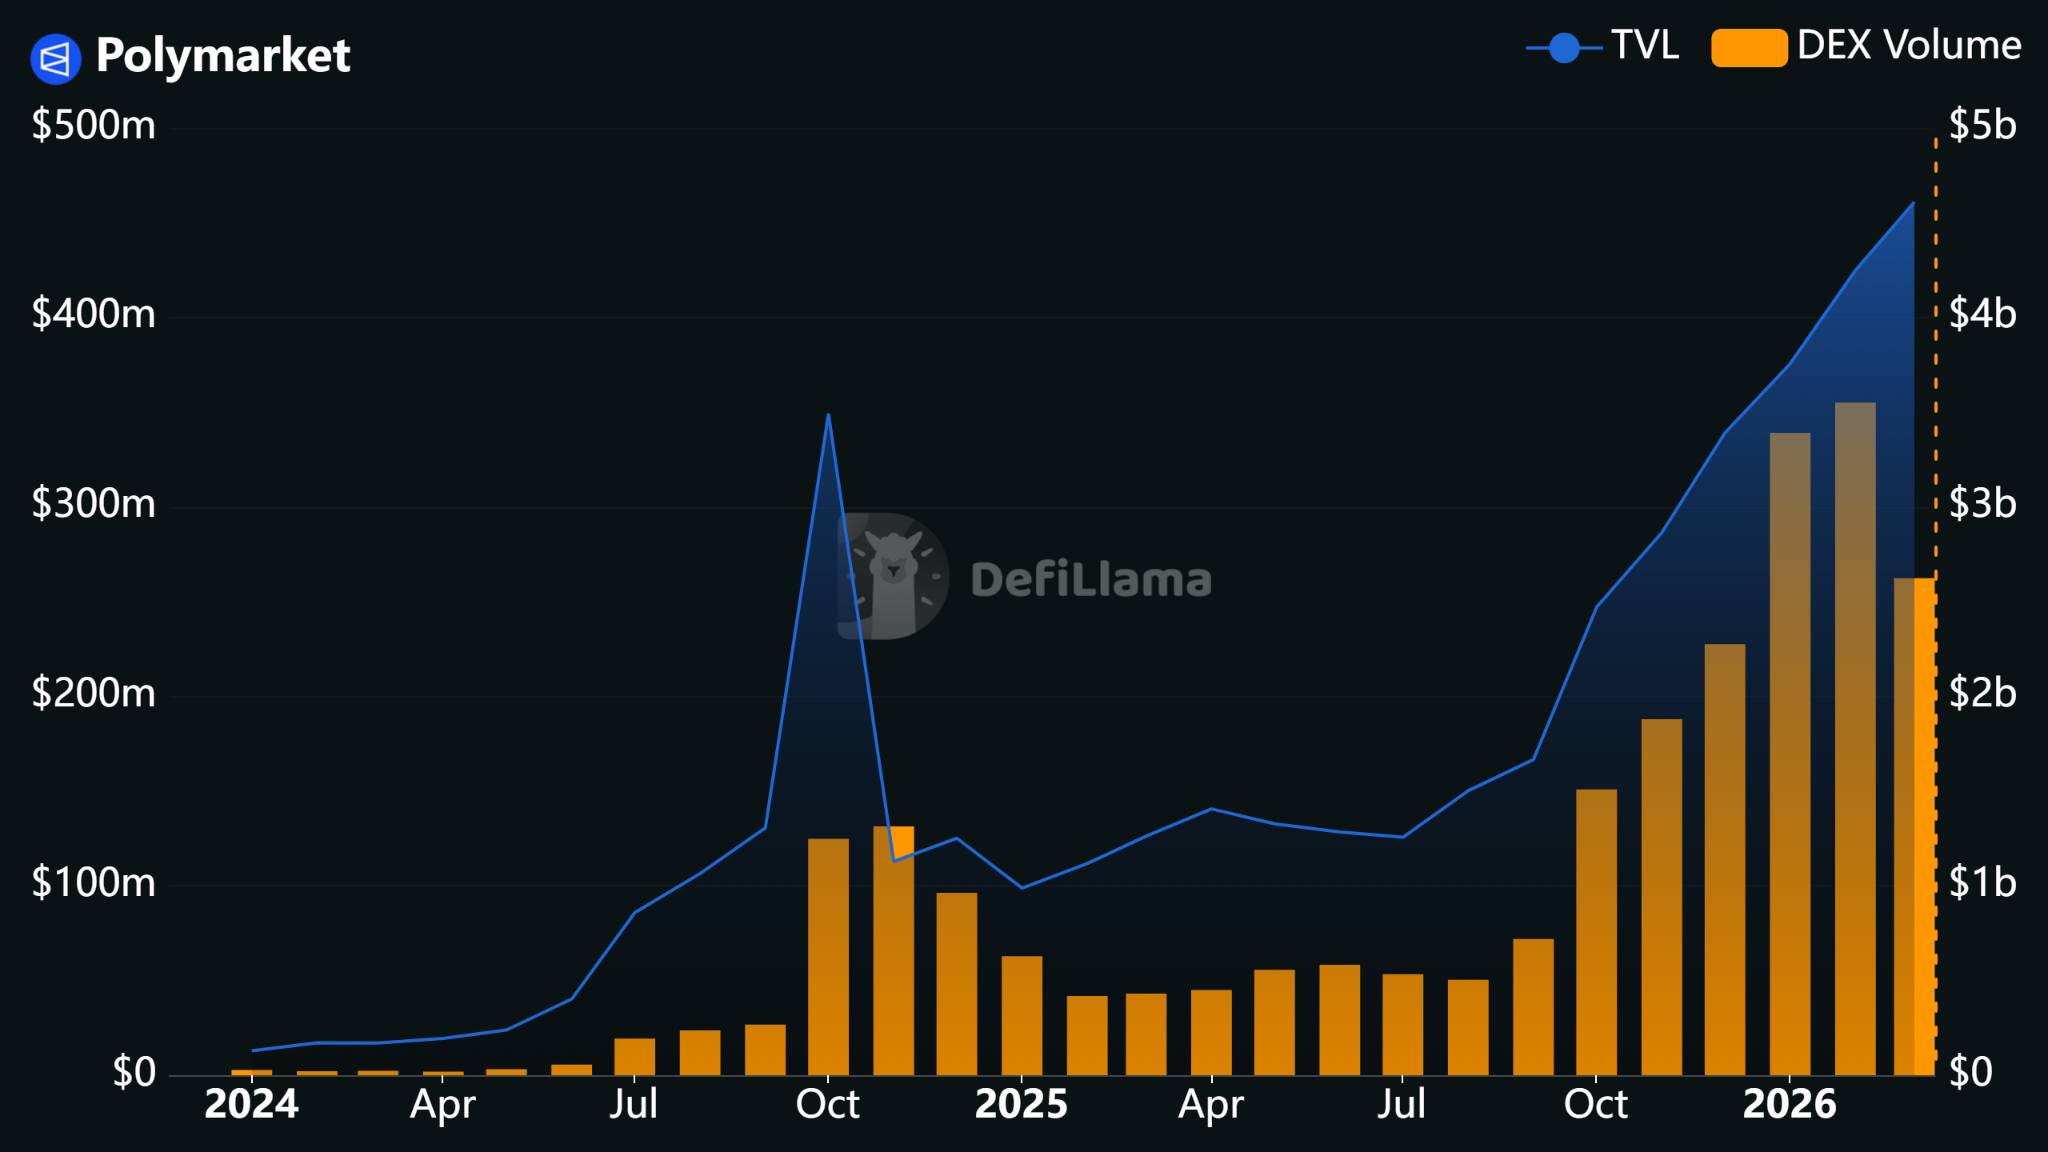
Polymarket, the blockchain-driven prediction markets platform, is acquiring Brahma, a crypto startup that builds DeFi infrastructure. The move is framed as a step to consolidate Polymarket’s stack and broaden its product suite as the two firms align on a path toward deeper on-chain and off-chain liquidity.
Brahma announced the transition on Wednesday, saying its team will dedicate its efforts to evolving Polymarket’s stack and product offerings. The company, founded in 2021, has reported processing over $1 billion in volume and asserts that its technology could help Polymarket streamline wallet creation, deposits, and token redemptions for users.
According to the announcement, the acquisition could unlock more liquidity for niche, low-volume markets on Polymarket and help the platform scale complex products for sophisticated users. Polymarket’s founder and CEO, Shayne Coplan, told Fortune that building reliable infrastructure across blockchain networks and traditional financial rails remains hard and there are no shortcuts. Financial terms of the deal were not disclosed at press time.
Key takeaways
- Polymarket is acquiring Brahma to enhance its infrastructure and product stack, with Brahma winding down its own products as the transition unfolds.
- Brahma’s core offerings—Strategy Vaults for automated DeFi strategies, Brahma Accounts (smart accounts for DeFi users), and Swype.fun (a Visa card linked to DeFi positions)—will be phased out over the next 30 days.
- The deal aims to bring more liquidity to Polymarket’s markets, particularly in smaller, harder-to-liquidate segments where users may benefit from smoother wallet creation and redemption flows.
- Polymarket has pursued aggressive expansion despite broader crypto-market softness, including partnerships and acquisitions announced in recent months.
Strategic implications of the Brahma integration
The Brahma transaction signals Polymarket’s intent to deepen technical capacity behind its prediction markets. Brahma’s experience in designing and operating scalable, user-ready DeFi infrastructure could help Polymarket reduce friction for users—potentially lowering barriers to entry and increasing throughput on low-visibility markets where liquidity is typically thin.
While the two firms have not disclosed the purchase price, the alignment comes as Polymarket has sought to diversify its toolkit beyond core prediction markets. The integration underscores a broader industry push to merge on-chain finance primitives with markets that hinge on real-world events and outcomes.
What changes for Brahma’s products and users
As part of the transition, Brahma’s three main products will be wound down over the next month: Strategy Vaults, which automate DeFi positioning; Brahma Accounts, the platform’s smart-account solution for DeFi users; and Swype.fun, a card-linked interface intended to realize DeFi positions for real-world spending. For existing users of these services, the wind-down process will be navigated in the coming weeks as the Polymarket integration proceeds.
Brahma’s team noted that its solutions were designed to meet sophisticated users’ demands, including automated strategies and streamlined access to DeFi features. The move to fold these capabilities into Polymarket could embed more robust infrastructure into the platform and potentially broaden its appeal to professional market participants and developers building on top of prediction markets.
Polymarket’s broader expansion playbook
The Brahma deal is part of a broader acceleration of Polymarket’s growth trajectory. In March, the company announced a partnership with Palantir Technologies and TWG AI to build an AI-powered sports integrity platform, signaling continued investment in data-focused, technologist-led initiatives. Earlier, Polymarket acquired Dome, a Y Combinator-backed provider of developer tools for prediction markets, and Lunch, a boutique firm focused on assembling and recruiting technical teams for startups.
Despite a tougher macro environment for crypto, Polymarket has faced regulatory scrutiny in several jurisdictions given its business model around unregulated betting on real-world events. Notably, recent coverage has highlighted how prediction markets have encountered resistance in places like Argentina, alongside ongoing debates in the United States about market design and regulation.
Polymarket’s ongoing expansion, including the Brahma acquisition, indicates a strategy focused on building a more capable infrastructure backbone and scaling its ecosystem through partnerships and targeted acquisitions. Investors and users will want to watch how the Brahma integration unfolds, how liquidity dynamics evolve on niche markets, and how regulatory developments shape the platform’s ability to deploy new features at scale.
As the integration progresses, readers should monitor whether Polymarket can successfully merge Brahma’s engineering capabilities with its existing stack, and what that means for the speed and reliability of user experiences, especially in lower-liquidity markets where liquidity depth and transaction costs can be decisive.
Twenty-one crypto organizations have signed an open letter urging US colleges to incorporate decentralized finance into their curricula, arguing that there will be massive demand for crypto talent on Wall Street.
“Our purpose with this letter is simple: to respectfully urge higher education institutions across the United States to further integrate digital assets, blockchain, and decentralized finance into their business and legal curricula,” the open letter reads, which was published on Wednesday.
The campaign was spearheaded by decentralized protocol aggregator 1Inch, with signatories including the Solana Policy Institute, Blockchain Association, DeFi Education Fund and crypto platforms like Aave, MyEtherWallet, Delphi Digital and Messari.
While 1Inch acknowledged that DeFi is taught in some schools, it argued that current curricula treat it mostly as theoretical, and that students should gain a more practical understanding of a “critical part of the global financial ecosystem.”
“It is wrong to think, as some do, that DeFi and crypto technologies lack practical uses or are somehow deviant to the public good,” 1Inch said, pointing out that stablecoins eliminate cross-border payment friction, lending protocols offer yield opportunities for investors and tokenized assets enable trading around the clock.
“The theoretical phase is over. Ideas have already become infrastructure.”
In comments to Cointelegraph, 1Inch said it is pushing for more DeFi courses to be taught in the classroom because opportunities have expanded beyond developer roles to those in more business and legal roles.
“It’s no longer just hoodies; it’s suits and ties too,” 1Inch said, noting that Wall Street firms like Goldman Sachs and PwC are on the lookout for crypto talent beyond the tech-savvy programmers.
“The aim is to build on top of these greater DeFi understanding and practical knowledge, not just among the developers of tomorrow but CEOs and CLOs.”
The open letter asks for more “foundational education” in blockchain architecture and DeFi as a core module rather than as an elective course, with the course material touching on everything from automated market makers and liquidity provision to decentralized autonomous organizations and smart contract risks.
1Inch also suggested that students engage with DeFi systems directly to “gain a real-world understanding of how DeFi works.”
The biggest Wall Street firms are seeking DeFi experts
BlackRock, Fidelity Investments, Goldman Sachs, JPMorgan and Morgan Stanley were recently seen putting out job advertisements for DeFi-related roles.
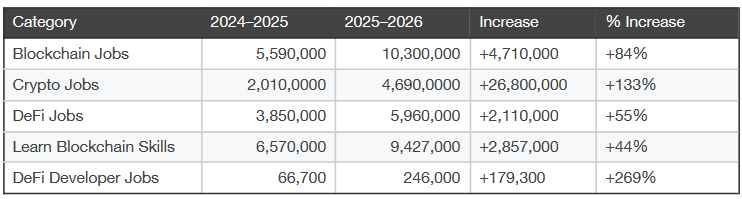
This has also been reflected in Google search statistics, said 1Inch, showing that Google search volume for “Blockchain jobs” grew 84% between 2024 and 2026.
More specialized roles are accelerating even faster, with “DeFi Developer Jobs” increasing nearly 270% to 246,000 results, 1Inch said.

Related: Columbia professor says NYSE tokenization plan reads like ‘vaporware’
DeFi has had limited exposure to some US Ivy League colleges in the past.
Massachusetts Institute of Technology ran an “MIT Digital Currency Experiment” in 2014, which involved distributing Bitcoin (BTC) to students, while it later offered courses touching on blockchain ethics and distributed ledger technology.
Harvard’s extension school also offers a blockchain innovation course, while Texas A&M offered a “Bitcoin Protocol” course to business and engineering students in 2023.
On Tuesday, Bitcoin bull Michael Saylor said the Florida Department of Education approved Saylor Academy — a non-profit education platform — to operate as Saylor University.
Saylor Academy is now Saylor University.
The Florida Department of Education has granted @saylordotorg university status—marking a major milestone in our mission to provide free, world-class higher education for all.pic.twitter.com/SbimeofUkQ
— Michael Saylor (@saylor) March 17, 2026
The move enables students to receive tuition-free master’s degrees, which include programs that teach about Bitcoin and blockchain technology.
Magazine: What’s a ‘Network State’ and are there real-life examples? Big Questions
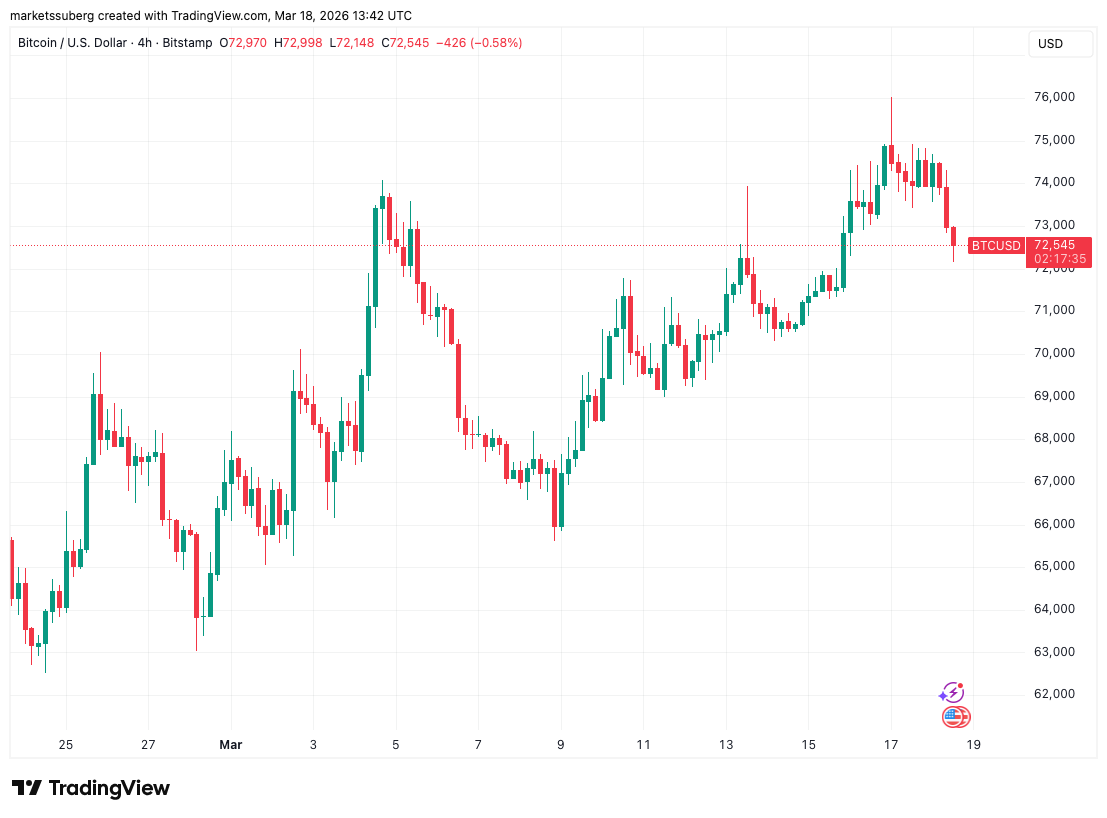
Bitcoin (BTC) slid 2.5% around Wednesday’s Wall Street open as a fresh US inflation overshoot spooked markets.
Key points:
-
US PPI inflation surpasses market expectations again, continuing its “hot” 2026 trend.
-
BTC price pressure results at the Wall Street open, as markets brace for the Federal Reserve interest-rates decision.
-
Traders see no reason to rethink their bearish stance on Bitcoin.
Fed rates “less supportive” for Bitcoin, crypto
Data from TradingView showed $72,000 coming back into focus for BTC price action after the February print of the Producer Price Index (PPI).

This came in markedly above expectations at 0.7% month-on-month and 3.4% year-on-year, extending a trend from recent months. Markets had foreseen 0.3% and 3%, respectively.
“On an unadjusted basis, the index for final demand rose 3.4 percent for the 12 months ended in February, the largest 12- month advance since increasing 3.4 percent in February 2025,” an official statement from the US Bureau of Labor Statistics (BLS) confirmed.

The timing of the release was pertinent, coming just hours before the Federal Reserve was due to release its decision on interest-rate changes.
While markets saw practically no chance of a rate cut or hike, the Federal Open Market Committee (FOMC) meeting could still spark volatility based on the tone of Chair Jerome Powell’s accompanying statement and press conference.
“Macro remains the dominant driver into what is arguably the most important central bank week of the year,” trading company QCP Capital wrote in its latest “Market Color” analysis on the day.
QCP noted that other major central bank rate moves were scheduled for the day after the Fed.
“Markets have sharply pared easing expectations as higher oil prices complicate the path for rate cuts, even as growth and labour data soften,” it continued.
“For crypto, the implication is straightforward: the rates backdrop is becoming less supportive, not more.”

Lower interest rates imply better liquidity prospects for crypto and risk assets, while a hawkish Fed tends to pressure prices.
”Caution pays” for BTC price into FOMC
Going into FOMC, Bitcoin traders were firmly risk-off.
Related: Bitcoin sparks ‘bull trap’ warning after BTC price rejects at $76K
“$BTC hovering below weekly resistance; FOMC later today – I think caution pays here,” trader Jelle wrote in his latest commentary on X.

An accompanying chart showed the risk of a fresh BTC price support breakdown, with Jelle and others having stated that Bitcoin remains in a bear market.
$BTC 1D
It looks almost exactly the same.
Bear Flag Breakdown & Retest with low volume on the upward move.
Most oversold indicators have completely reset. pic.twitter.com/NBvrE1K5Mf
— Roman (@Roman_Trading) March 17, 2026
Crypto analyst Michaël van de Poppe, meanwhile, was more optimistic, still seeing a chance of $80,000 reappearing.
“Very strong move on $BTC this month, and now it’s consolidating. Nothing wrong with that, the opposite actually,” he told X followers.
“It’s very likely that we’ll continue to test higher, as resistances are still above us.”

Van de Poppe acknowledged that he also “wouldn’t be surprised” at a test of range lows.
This article does not contain investment advice or recommendations. Every investment and trading move involves risk, and readers should conduct their own research when making a decision. While we strive to provide accurate and timely information, Cointelegraph does not guarantee the accuracy, completeness, or reliability of any information in this article. This article may contain forward-looking statements that are subject to risks and uncertainties. Cointelegraph will not be liable for any loss or damage arising from your reliance on this information.

Circle’s policy chief Dante Disparte told a United Kingdom House of Lords committee that the UK has a chance to build its crypto regime by combining the clarity of the European Union’s Markets in Crypto-Assets Regulation (MiCA) with elements of the new US stablecoin framework.
“The model is clear: take the best of both and make it distinctly British,” Disparte said during a Wednesday meeting of the House of Lords Financial Services Regulation Committee. “From Europe, take clarity, definitions, licensing, governance and strong consumer protection from the US and the landmark Genius Act.”
Disparte argued that the absence of a regulatory framework will keep stablecoin activity offshore, leaving UK users more exposed and jeopardizing London’s status as a global hub for financial innovation. The meeting was part of the House of Lords’ inquiry into growth and proposed regulation of stablecoins in the UK, with Disparte and Jesse McWaters of Mastercard scheduled as witnesses.
The UK’s Financial Conduct Authority (FCA) has been consulting on a broader crypto asset regime that is expected to come into force on Oct. 25, 2027, when companies conducting the new regulated activities will need authorization.
Trusted stablecoins “expand” markets Circle’s Disparte
Disparte also addressed concerns that stablecoins could deplete bank deposits and reduce demand for traditional lines of credit.
“The future is not banks versus stablecoins,” argued Disparte, adding that a clear regulatory framework can manage these risks without stifling innovation by adopting strong reserve and liquidity standards and encouraging bank participation.
“Our growth across currencies and jurisdictions is proof that trusted stablecoins expand markets. They do not shrink them.”
Disparte proposed four governing principles to anchor the UK’s regulatory framework: 1-to-1 reserve backing, requiring high-quality liquid reserves, enforceable redemptions and strong transparency standards.
Related: UK House of Lords presses Coinbase exec on stablecoins, KYC and bank run fears
Circle is the issuer of the world’s second-largest stablecoin by market capitalization, USDC (USDC).

The US’s federal stablecoin framework, the GENIUS Act, was signed into law on July 18, 2025. The EU’s MiCA framework, the first comprehensive regulatory framework for the crypto industry, went into effect for crypto-asset service providers on Dec. 30, 2024.
Related: UK gambling regulator weighs allowing crypto payments for online betting
Stablecoins lack clear value proposition
Mastercard’s McWaters said stablecoins lack a clear value proposition to threaten payment cards.
Stablecoins currently lack a “clear value proposition that would drive customers” to adopt them over the variety of domestic payment options available, McWaters said, while also praising their ability to accelerate cross-border transactions.

“Blockchain technology, the rails on which stablecoins run, provides a new, innovative and potentially significantly additive way of moving money, particularly in cross-border contexts,” he said.
Magazine: How crypto laws changed in 2025 — and how they’ll change in 2026
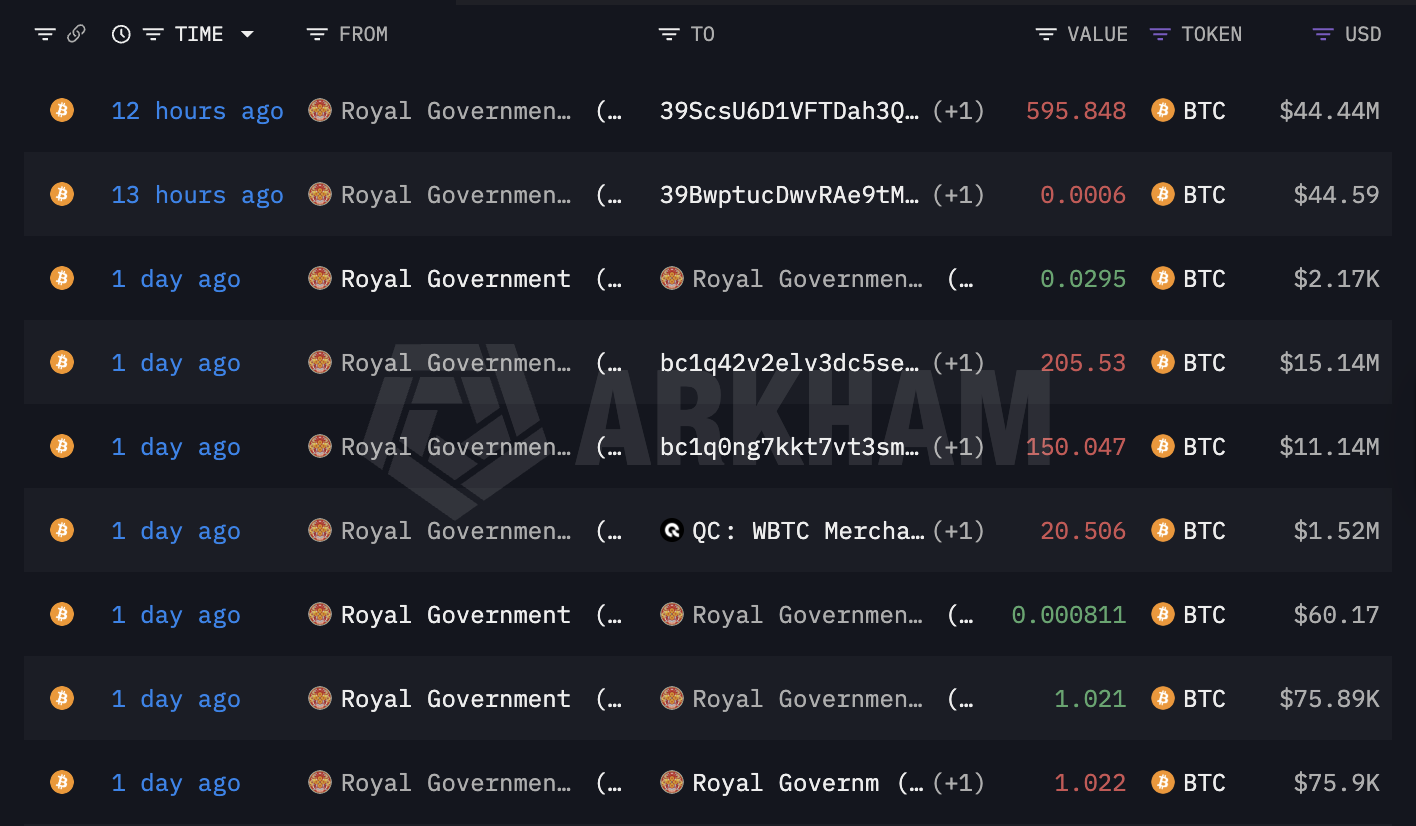
The Kingdom of Bhutan has transferred over $72.3 million in Bitcoin (BTC) from its wallets over the last 24 hours, as it continues to sell portions of its holdings.
Druk Holding and Investments (DHI), a state-owned investment company that manages the country’s Bitcoin mining operations and crypto investments, has moved more than 973 BTC over the past 24 hours, in six separate transactions, according to Arkham Intelligence.
DHI also moved more than 175 BTC, valued at $11.8 million, on March 10. “Bhutan periodically sells portions of its Bitcoin in clips of $5 million to $10 million, with a particularly heavy period of selling around mid-late September 2025,” Arkham said.
The landlocked South Asian country has adopted a national Bitcoin Development Pledge, which aims to support the Kingdom of Bhutan’s long-term economic development through its Bitcoin stash and mining operations. In December, the Kingdom said it will tap into 10,000 BTC from its stash to help build its special administrative region, the Gelephu Mindfulness City (GMC).

That leaves Bhutan holding more than 4,400 BTC, valued at over $322 million using current market prices, according to data compiled by Arkham.
Wallet addresses controlled by Bhutan have not seen BTC inflows greater than $100 million in over a year, Arkham said, raising speculation that the country has ceased or curtailed its mining operations.

Cointelegraph sought comment from DHI about its Bitcoin mining operations, but did not receive a response by the time of publication.
The country made headlines in 2024 and 2025 for mining BTC using renewable energy sources, establishing a strategic Bitcoin reserve, and adopting pro-crypto regulations.
Related: Bhutan moves $11.8M in BTC from its national stash: Arkham
Bhutan has significantly downsized its holdings since 2024
Bhutan transferred more than 284 BTC in February, valued at over $22 million, amid a broad crypto market downturn that has dragged on since the October 2025 market crash.
The crash took the price of BTC to a low of $60,000, down by over 50% from its all-time high of about $126,000, before a limited recovery to current price levels.

Bhutan held about 13,295 BTC in October 2024, when its holdings peaked, and has been selling BTC from its reserve since that time, according to Arkham Intelligence.
The 13,295 BTC reserve would have been worth over $1.6 billion at the all-time high price reached in October 2025, immediately before the market crash.
Magazine: AI may already use more power than Bitcoin — and it threatens Bitcoin mining

Bitcoin financial services firm Fold reported an 8% surge in revenue in Q4 to $9 million as it gained another 2,000 customers and rolled out more products aimed at integrating Bitcoin reward schemes into consumer spending.
The results come just weeks after it released a Fold Bitcoin Rewards Credit Card, a Visa and Stripe-powered product, offering users cashback and rewards.
During Fold’s Q4 and 2025 full-year earnings call on Tuesday, CEO Will Reeves said they believe that “Bitcoin rewards will overtake the airline miles as the preferred consumer reward in the US.”
“That means that these card programs and our card program needs to scale to millions of cardholders,” Reeves said, adding that better risk and fraud controls must be implemented before it can “really open the floodgates” for mass adoption.
Coinbase, Gemini, Swan Bitcoin and River Financial are among the other crypto platforms offering Bitcoin (BTC) credit card rewards in the US.
Despite the optimism, Fold recorded a 3% year-on-year fall in transaction volume to $215 million and an operating loss of $6 million, contributing to a full-year net loss of $69.6 million for 2025, the company reported in its latest financial statement.
However, Reeves said Fold still hit its goals in its first full year as a public company, stating:
“We continued to add customers and expand our platform while building the foundation to scale a Bitcoin-native financial services ecosystem across multiple interconnected product lines.”
Fold’s more recent products include Fold for Business, enabling companies to include Bitcoin in payroll, bonuses, and corporate financial programs.
One of its most notable partners is Steak ‘n Shake, which accepts Bitcoin and pays employees bonuses in Bitcoin.

Reeves noted that Fold has strengthened its balance sheet by “extinguishing our two outstanding convertible debt instruments.”
This “removes structural overhang and directs financing solely to the growth of our operating businesses,” he said.
“With the credit card now live, the launch of an enterprise product, and a cleaner capital structure in place, 2026 is about scaling what we’ve built across customer acquisition, engagement, cross-sell, and retention.”
Fold has been selling Bitcoin
Despite Reeves’ confidence for the remainder of 2026, Fold has nearly sliced its Bitcoin treasury in half.
Its holdings, which stood at 1,527 BTC at the end of last year, have dropped to 827 BTC as of March 17.
FLD shares continue to slide
The Bitcoin selloff comes as Fold (FLD) shares have now fallen 59% so far in 2026 and 83.8% over the last 12 months, Google Finance data shows.
Related: Bitcoiner Jack Mallers vows not to let Twenty One distract from Strike
FLD rose in after-hours on Tuesday after its results came out, increasing 13.4% to $1.27.
However, the company’s shares then fell 4.46% on Wednesday, sending its share price back to $1.07.

Magazine: Big Questions: Can Bitcoin save you from the dreaded Cantillon Effect?
A California court on Wednesday dismissed a Coinbase user’s attempt to block an IRS summons for his financial records, in at least the second such case in the past year to fail to reach trial.
Roger Metz filed a petition in the Northern District of California in May 2025 to quash an IRS summons ordering Coinbase to hand over his financial records in connection with an audit of his 2022 federal tax return.
His lawyers argued the summons violated his privacy rights, was overbroad and failed to meet basic administrative requirements.
Metz’s lawyers also contended that by the time the IRS issued the summons in 2024, he had already identified the error himself, filed an amended return, and paid the additional tax owed.
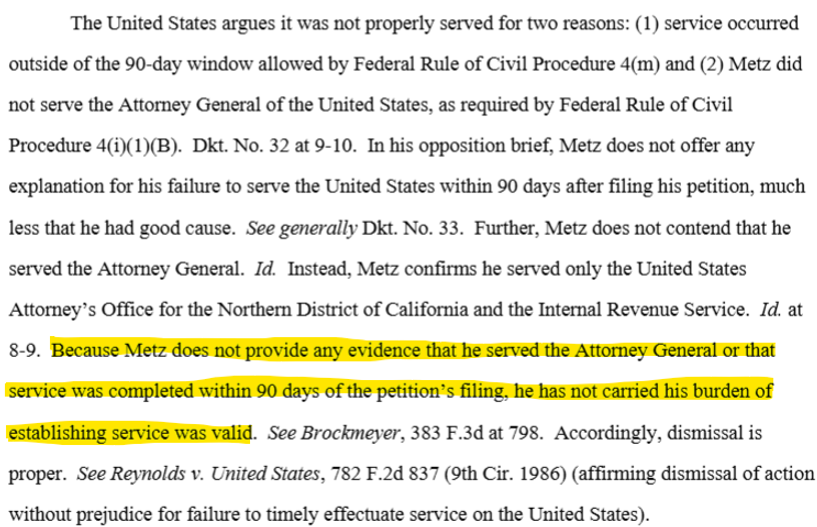
US District Judge Araceli Martínez-Olguín ruled against Metz on Wednesday, finding that he had failed to notify the required government officials of the petition within the 90-day window and dismissed the case on procedural grounds.

Under the Federal Rules of Civil Procedure, defendants must be formally notified of lawsuits to ensure they receive notice and the opportunity to respond. In this case, suing the federal government required notifying three parties within 90 days of filing: the local US Attorney for the district, the US Attorney General in Washington, D.C., and the specific agency being challenged.
Case dismissed over “insufficient service of process”
Metz acknowledged serving the US Attorney’s Office for the Northern District of California and the IRS, but admitted he did not notify the US Attorney General in Washington within the 90-day deadline, according to the court documents. Government lawyers argued it was sufficient grounds for dismissal.
“In his opposition brief, Metz does not offer any explanation for his failure to serve the United States within 90 days after filing his petition, much less that he had good cause,” Judge Martínez-Olguín said in her ruling.
“Dismissal of a case is proper when there is insufficient service of process,” she added.
The case was dismissed without prejudice, meaning Metz could file the same petition again at a later date.
Exchanges are required to share user data with tax agencies
Major crypto exchanges are legally required to collect user information and report the taxable income to the IRS, according to Miles Brooks, the director of tax strategy at tax software company CoinLedger.
Related: SEC Chair explains why NFTs fall outside of securities laws
The agency can also issue “John Doe Summons,” which are used to identify large groups of unidentified taxpayers by legally compelling crypto exchanges to turn over records for customers within specific parameters, such as those who transacted $20,000 or more between 2016 and 2020.
In a related case last year, James Harper accused the IRS of violating his Fourth Amendment rights after the agency used a John Doe Summons to collect his data from a crypto exchange. The Supreme Court declined to hear his case.
Magazine: Clarity Act risks repeat of Europe’s mistakes, crypto lawyer warns
Blockchain prediction markets platform Polymarket is acquiring Brahma, a crypto startup that provides decentralized finance (DeFi) infrastructure.
“As part of this transition, our team will dedicate itself to evolving Polymarket’s stack and product suite,” Brahma stated in an announcement on Wednesday.
Brahma, founded in 2021, says it has processed over $1 billion in volume and may be used by Polymarket to reduce friction around wallet creation, deposits, and token redemptions.
The acquisition could also bring more liquidity to niche, low-volume prediction markets on Polymarket.
“Building reliable infrastructure across blockchain networks and traditional financial rails is hard—there are no shortcuts,” Shayne Coplan, founder and CEO of Polymarket, told Fortune.
He added that the Brahma team has shown it can design, operate and scale complex products for sophisticated users. Financial details of the acquisition were not disclosed at the time.
Brahma to wind down products
In its four years of operation, Brahma has developed three main products: Strategy Vaults for automated DeFi strategies; Brahma Accounts, smart accounts for DeFi users; and Swype.fun, a Visa card linked to DeFi positions for real-world spending.
The firm stated that each product will be wound down over the next 30 days as the acquisition proceeds.
Related: Prediction markets boom on Iran bets as Congress eyes ban
Polymarket has quickly grown to a reported $20 billion valuation amid rapid growth in prediction markets.

Polymarket acquisition spree continues
Polymarket has continued to invest in expansion despite a broader crypto market decline and a surge in interest in AI.
The company announced on March 10 that it was partnering with Palantir Technologies and TWG AI to develop an AI-powered sports integrity platform.
It also acquired Y Combinator-backed startup Dome in February, which provides developer tools for prediction markets, and Lunch, a boutique firm specializing in recruiting and assembling teams for tech startups.
However, the platform has faced resistance across the globe, most recently in Argentina, over its unregulated gambling markets and war bets.
Magazine: Metaplanet’s Japan Bitcoin bet, Bithumb ordered suspension: Asia Express

Prairie View A&M bests Lehigh for 1st NCAA tourney win

Bolton to Middlebrook direct bus service announced TODAY

Hints, Answer and Strategies for Puzzle #1734 on March 19, 2026


-
 Crypto World5 days ago
HYPE Token Enters Net Deflation as HyperCore Buybacks Outpace Staking Rewards
-

 Tech3 days ago
Your Legally Registered ‘Motorcycle’ Might Not Count Under Proposed US Law
-

 Fashion5 days ago
Weekend Open Thread: Addict Lip Glow
-
Sports5 days ago
Why Duke and Michigan Are Dead Even Entering Selection Sunday
-
 Tech2 days ago
Are Split Spacebars the Next Big Gaming Keyboard Trend?
-

 Business3 days ago
Search for Savannah Guthrie’s Mother Enters Seventh Week with No Arrests
-

 Business5 days ago
US Airports Launch Donation Drives for Unpaid TSA Workers as Partial Government Shutdown Enters Fifth Week
-
Crypto World4 days ago
Coinbase and Bybit in Investment Talks: Could Bybit Finally Enter the US Crypto Market?
-

 Business3 days ago
Australian shares drop as Iran war enters third week
-

 Business5 days ago
Country star Brantley Gilbert enters growing non-alcoholic beer market
-

 Crypto World3 days ago
Crypto Lender BlockFills Enters Chapter 11 with Up to $500M in Liabilities
-

 Sports5 days ago
College Basketball Best Bets: Conference Tournament Semifinal Picks
-

 Politics20 hours ago
The House | The new register to protect children from their abusers shows Parliament at its best
-

 Business6 days ago
Trump demands Powell cut rates as Iran conflict raises energy prices
-

 Fashion3 days ago
25 Celebrities with Curly Hair That Are Naturally Beautiful
-

 Crypto World6 days ago
Senate Votes to Include CBDC Ban in Bipartisan Housing Bill
-

 News Videos12 hours ago
RBA board divided on rate cut, unusually buoyant share market | Finance Report | ABC NEWS
-

 NewsBeat6 days ago
Deane Road crash near Bolton colleges and university
-

 News Videos6 days ago
Tom Lee: The 100x Opportunity EVEN Bigger Than Bitcoin (New Ethereum Prediction 2026)
-

 Crypto World12 hours ago
Canada’s FINTRAC revokes registrations of 23 crypto MSBs in AML crackdown


You must be logged in to post a comment Login