
CryptoCurrency
3 Key Reasons Bitcoin Is Breaking Out Toward $107K Now

Bitcoin Poised to Reclaim $100,000 and Eye $107,000 Amid Bullish Indicators
Bitcoin is showing signs of a strong upward trend, supported by technical formations and positive macroeconomic signals. With bullish momentum gaining traction, the leading cryptocurrency could soon retake the $100,000 level and push toward a target of approximately $107,000 in the coming days.
Key Takeaways
- Bitcoin’s breakout is supported by bullish technical patterns and reduced selling pressure.
- Macro indicators favor a continued rally, including liquidity expansion and a divergence from gold.
- The recent bullish crossover of moving averages adds to the positive outlook.
- Long-term holders are reducing sell-offs, suggesting strengthened accumulation trends.
Technical Breakouts and Market Sentiment
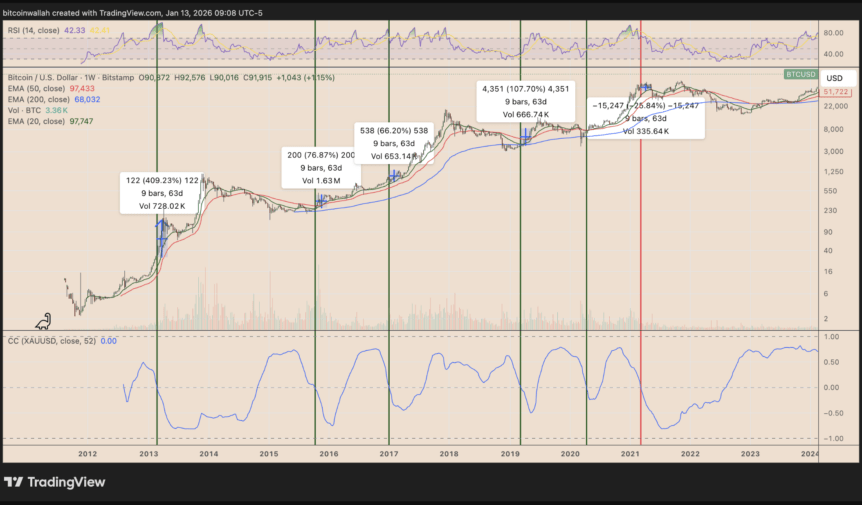
Earlier this week, Bitcoin confirmed a breakout from a multi-week ascending triangle pattern, pushing above the resistance near $95,000. After briefly retesting this level as support, the digital asset bounced higher, signaling a genuine breakout rather than a false move. This validation paves the way toward the measured upside target around $107,000, based on the pattern’s height and typical price projections. The rally aligns with an emerging bullish crossover between the 20-day and 50-day exponential moving averages, a technical signal historically associated with a 17% price increase over subsequent weeks.
This moving average crossover signals strengthening bullish momentum, especially since a similar pattern from earlier in the year resulted in a significant rally over the following month.
Institutional Support and Reduced Long-term Seller Activity
The credibility of Bitcoin’s recent rally is reinforced by a notable decline in selling activity among long-term holders. Data from CryptoQuant indicates that coins held by original Bitcoin investors—dormant for over five years—are increasingly staying off the market. The 90-day average of spent outputs peaked early in the rally but has since decreased sharply, suggesting that long-term holders are less inclined to sell now. This pattern coincides with the largest net outflows from exchanges since December 2024, further pointing to accumulation rather than distribution.
Macro Dynamics: Bitcoin-Gold Divergence and Bullish Outlook
An additional macroeconomic factor supporting Bitcoin’s positive outlook is its relationship with gold. Historically, periods of negative correlation between Bitcoin and gold have preceded significant price rallies, with average gains of 56% within two months. The current environment, characterized by abundant global liquidity and the nearing end of the Federal Reserve’s quantitative tightening, creates favorable conditions for a continued upward move. These macro signals suggest that Bitcoin may be entering a new bullish phase, supported by macroeconomic shifts and institutional interest.
Overall, technical patterns, declining long-term selling, and macroeconomic trends point to a stronger Bitcoin market. Investors should monitor these signals closely as Bitcoin edges toward key resistance levels and potential new highs.


