

CryptoCurrency
3 Meme Coins That Show Bullish Signs For February 2026

Meme coins are back on traders’ radar as February 2026 begins. The meme coin sector is up 4.2% over the past seven days, outperforming much of the broader crypto market. But this rebound is uneven. Some key meme coins to watch are flashing early reversal signals, others are riding narrative-driven momentum, and a few are showing signs of exhaustion.
BeInCrypto analysts have handpicked three such meme tokens, based on price action, timing, and early holder positioning.
Dogecoin (DOGE)
Dogecoin enters February with early signs of a momentum shift after weeks of pressure. The meme coin rebounded nearly 8% between January 25 and January 28, helping DOGE outperform the broader crypto market in the past 24 hours. On a 30-day view, Dogecoin has now erased most of its losses and is trading flat.
Sponsored
Sponsored
One on-chain metric explains why this rebound stands out.
Dogecoin’s Spent Coins Age Band has dropped sharply over the past week. This metric tracks the number of coins being moved across all holder groups and is used to gauge selling activity.
On January 26, about 158.87 million DOGE were moved. That figure has since fallen to roughly 62.28 million, a drop of over 60%.
Want more token insights like this? Sign up for Editor Harsh Notariya’s Daily Crypto Newsletter here.
This matters because the DOGE price moved higher while coin activity collapsed. If holders were eager to sell into the rebound, activity would rise, not fall. The decline suggests conviction.
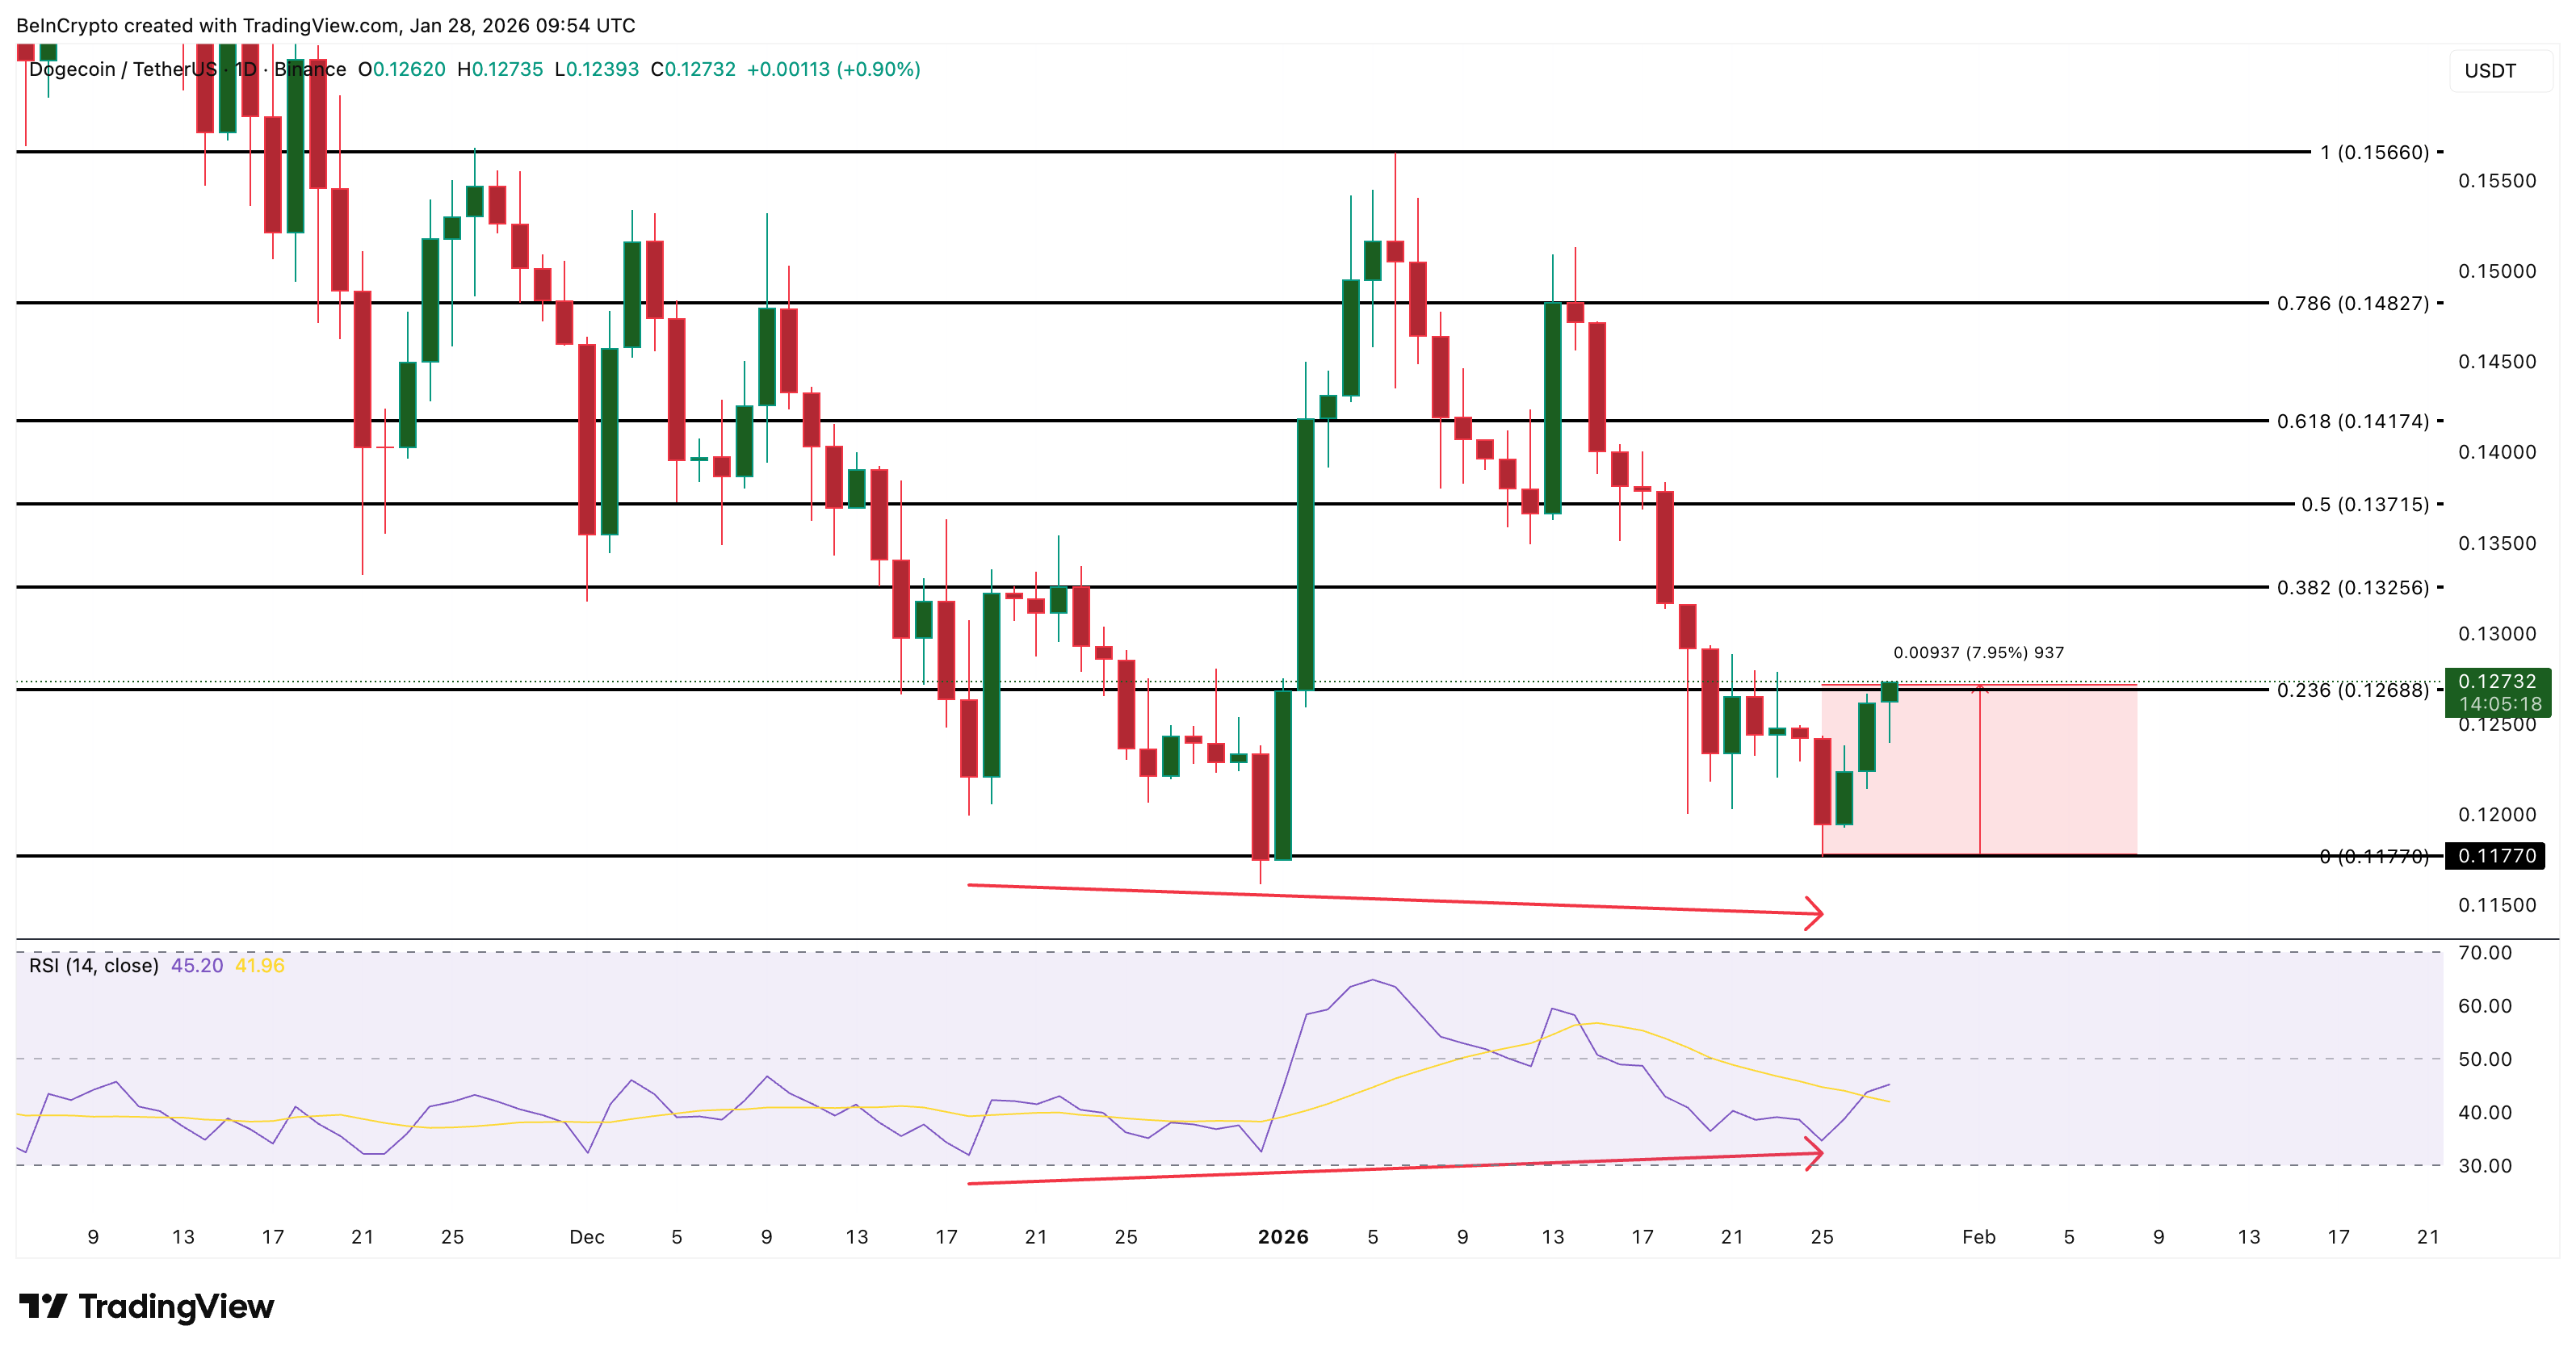
The chart supports that view. Between December 18 and January 25, Dogecoin printed a lower low in price, while the RSI formed a higher low. RSI measures momentum strength, and this mismatch signals bullish divergence.
In simple terms, selling pressure weakened before the price turned. This sign often signals trend reversals when key levels are broken.
For upside continuation, Dogecoin must clear key resistance levels. A break above $0.137, followed by $0.148, keeps the rebound intact.
Sponsored
Sponsored
A sustained move above $0.156 would shift the structure decisively bullish. On the downside, a daily close below $0.117 would invalidate the setup and reopen downside risk. Regardless of the path, DOGE has to be one of the few meme coins to watch, going into February.
Official Trump (TRUMP)
Among meme coins to watch, TRUMP stands out heading into February due to a rare mix of narrative timing and early technical recovery signals.
The immediate catalyst is external. The Melania Trump documentary is set to be released in the coming days, which could lift attention across Trump-linked tokens.
Historically, narrative-driven flows tend to concentrate first in the most socially recognized asset, positioning TRUMP as the potential primary beneficiary if speculation builds.
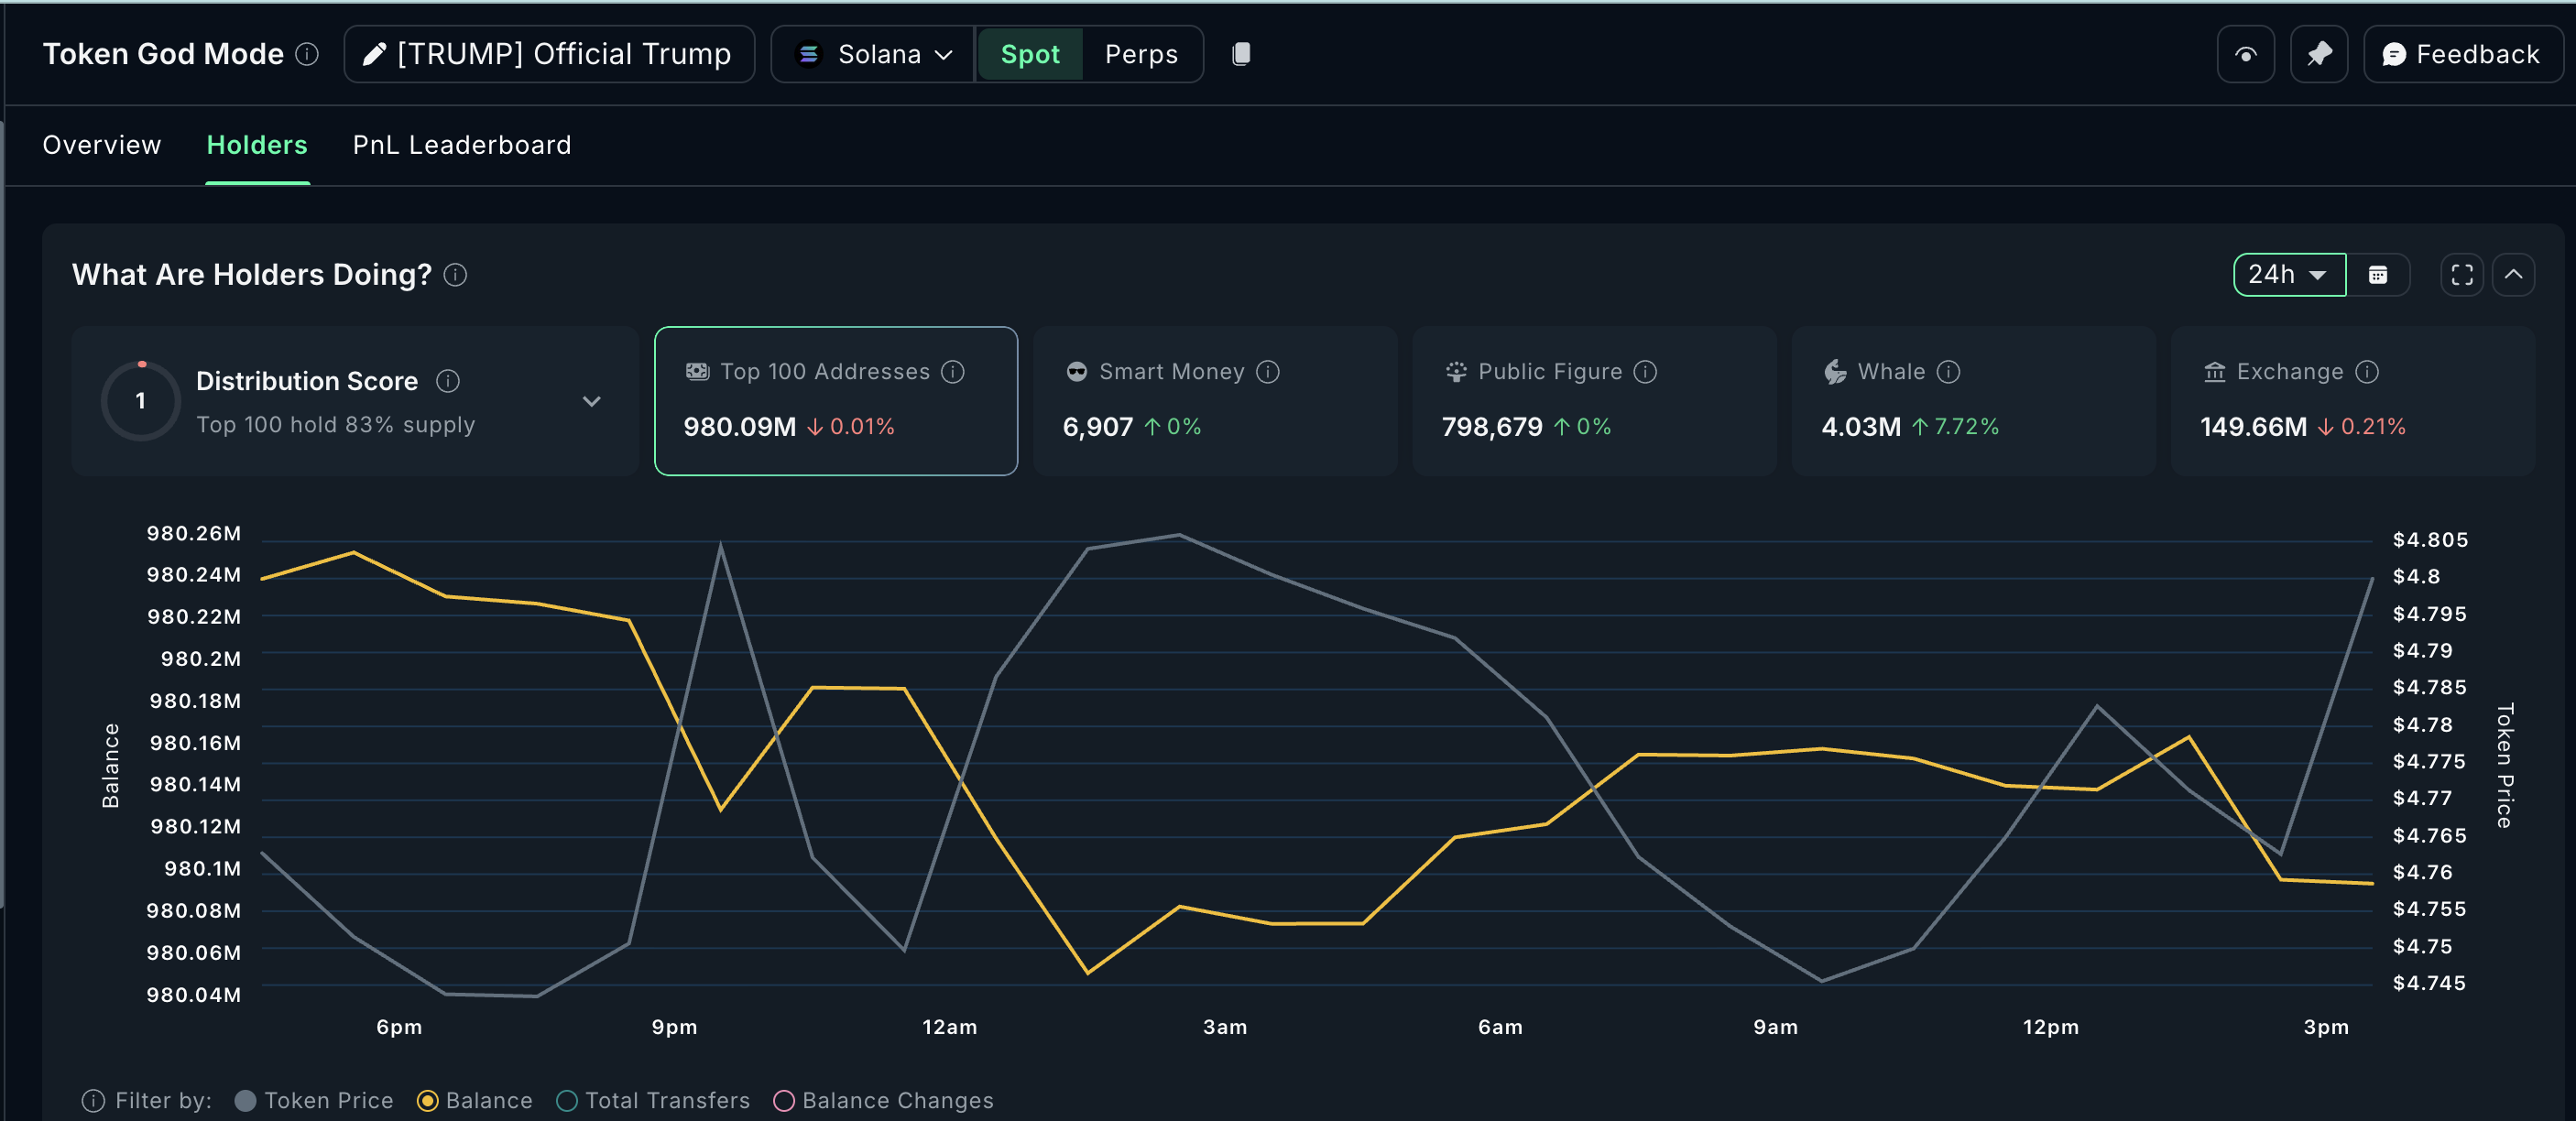
That interest is already showing up on-chain. Over the past 24 hours, TRUMP whales increased their holdings by 7.72%, signaling early positioning rather than post-event chasing. This accumulation comes while the price remains muted, suggesting anticipation.
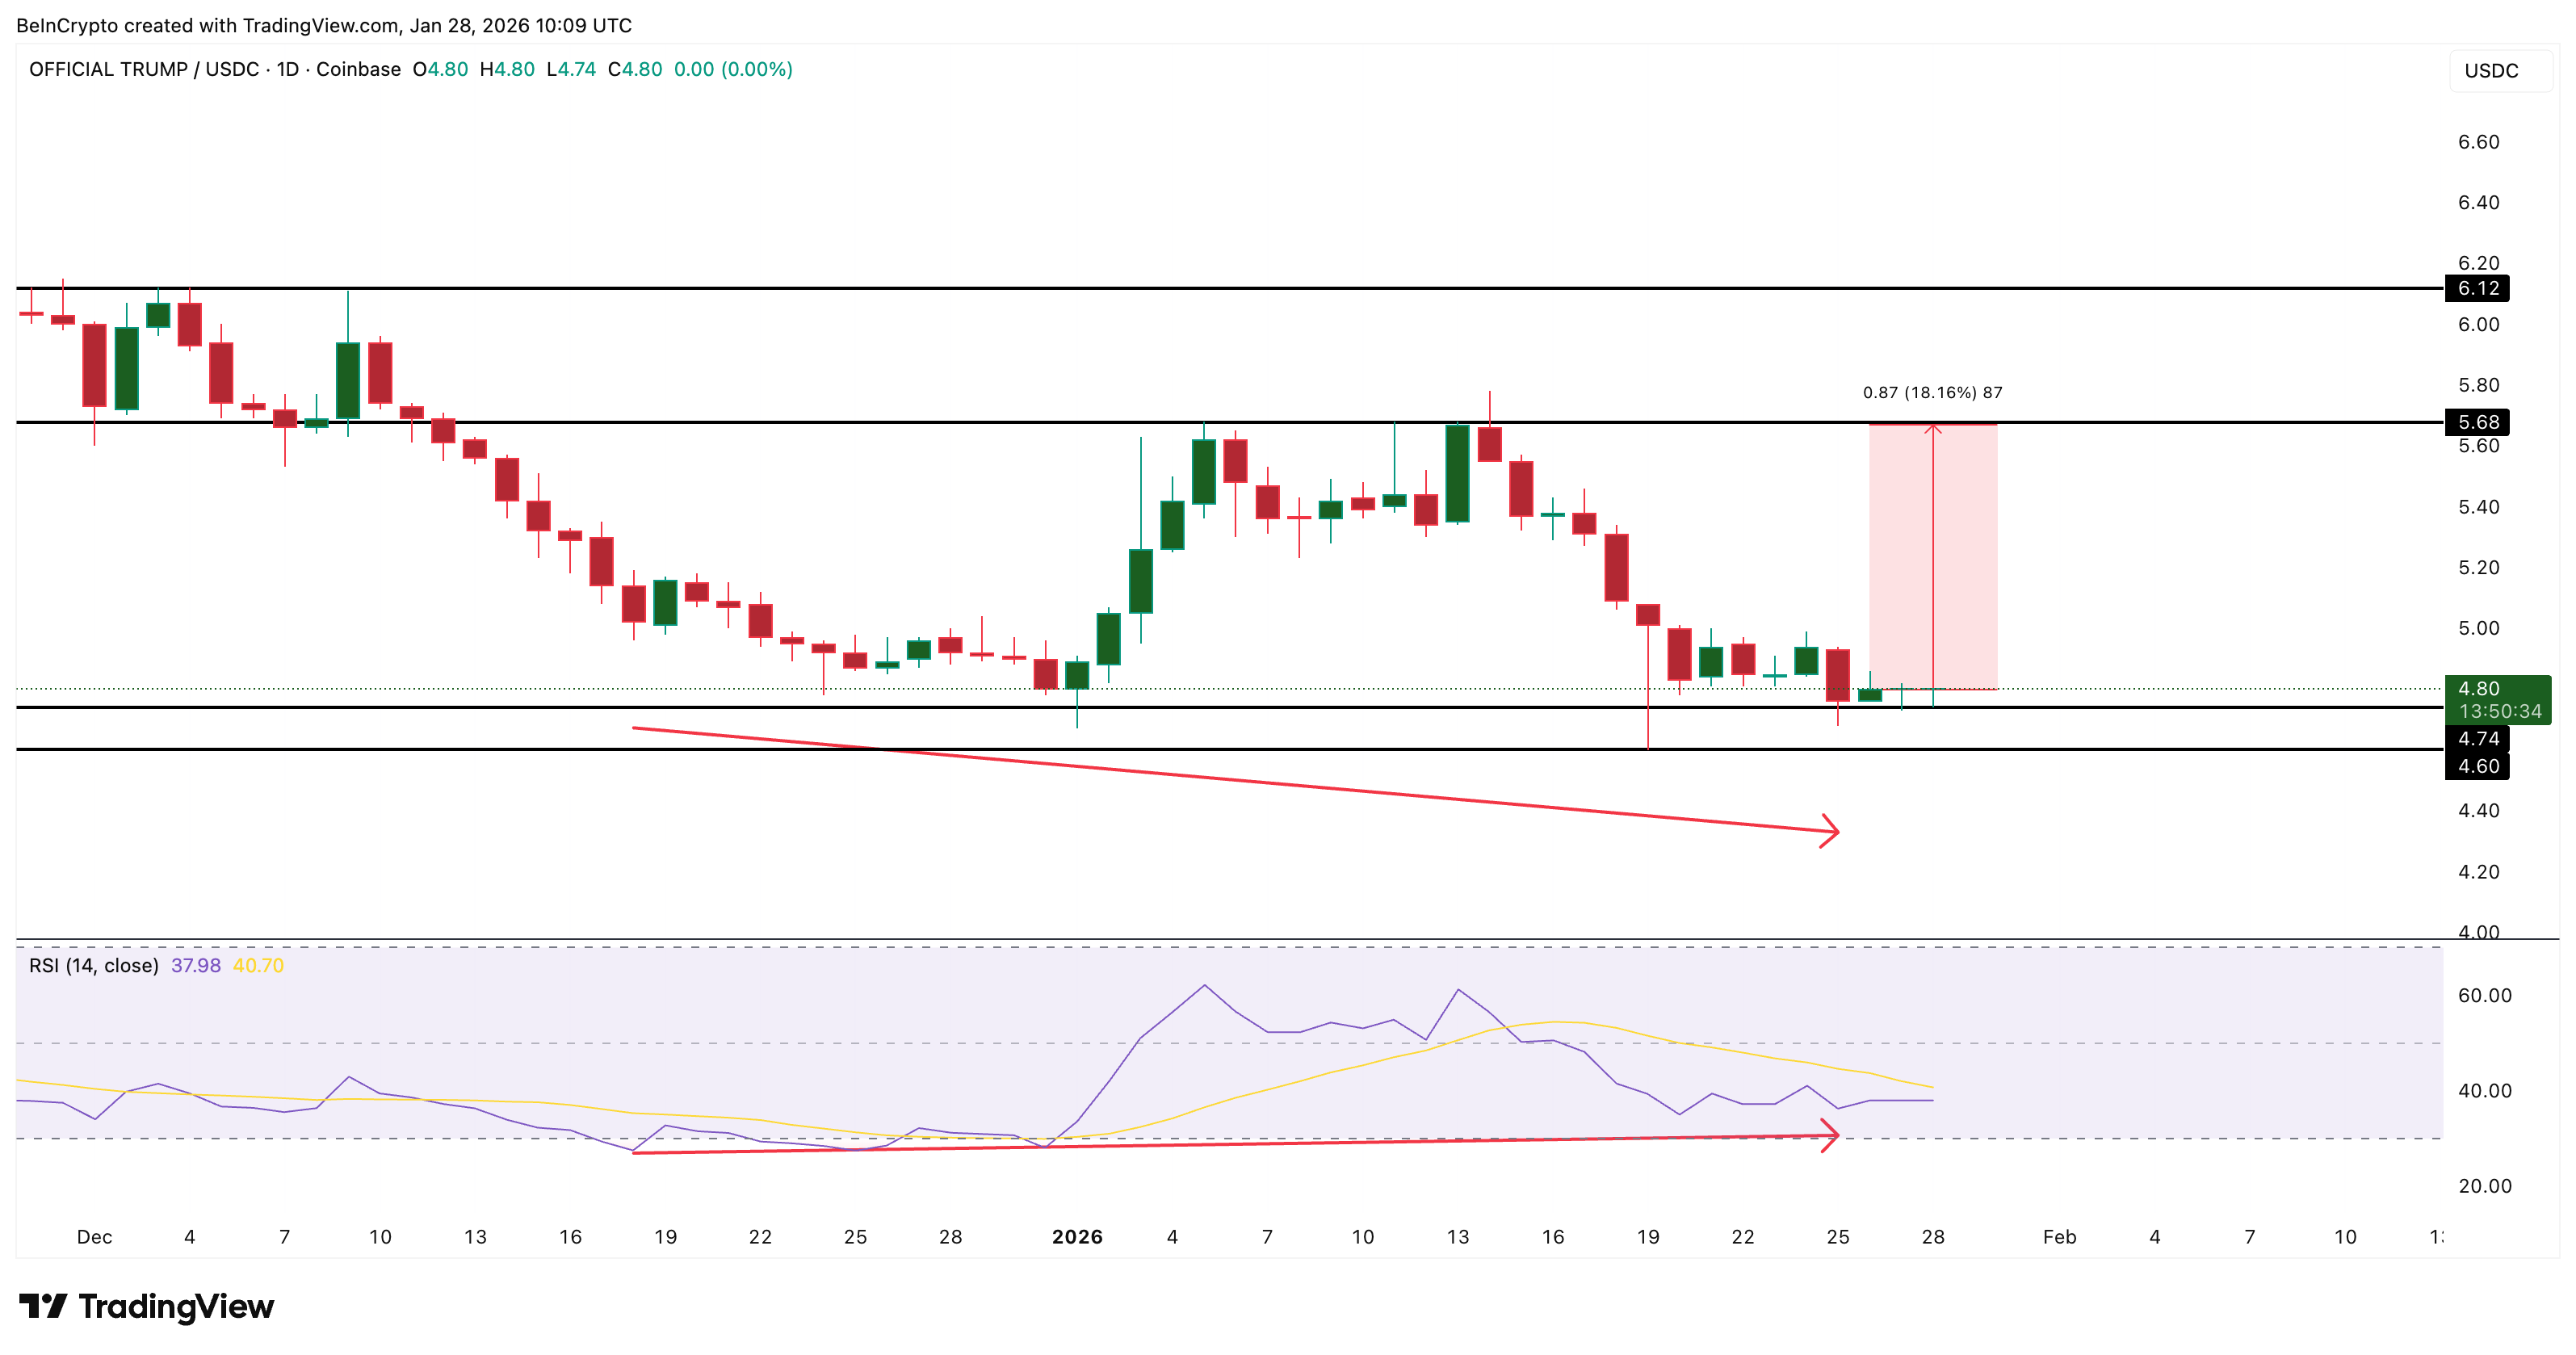
The chart supports that view. Between December 18 and January 25, the TRUMP price made a lower low, while the Relative Strength Index (RSI) printed a higher low, a classic bullish divergence.
Sponsored
Sponsored
Since then, the price has stabilized and begun forming short-range indecision candles, reflecting a tug of war between buyers and sellers.
Key levels now clearly define the setup. TRUMP must hold above $4.74 to maintain the rebound structure. A daily close below $4.60 would invalidate the bullish divergence and reopen downside risk.
On the upside, the critical hurdle sits at $5.68, a level with multiple historical rejections. Reclaiming it would require an 18% move and could open room toward $6.12.
For now, TRUMP remains a watch, not a breakout. Whales are positioning early, momentum is improving, and February’s narrative timing could decide whether this becomes a reversal or just another failed bounce.
Pippin (PIPPIN)
Among meme coins to watch heading into February 2026, Pippin stands out for one reason: strength is returning, but risk is rising with it.
PIPPIN is up more than 60% in the past 24 hours, erasing most of its January drawdown and pushing its monthly performance back to +22%. The move briefly pushed the price back toward its recent all-time high near $0.55, putting the token back on traders’ radar after weeks of weakness.
Sponsored
Sponsored
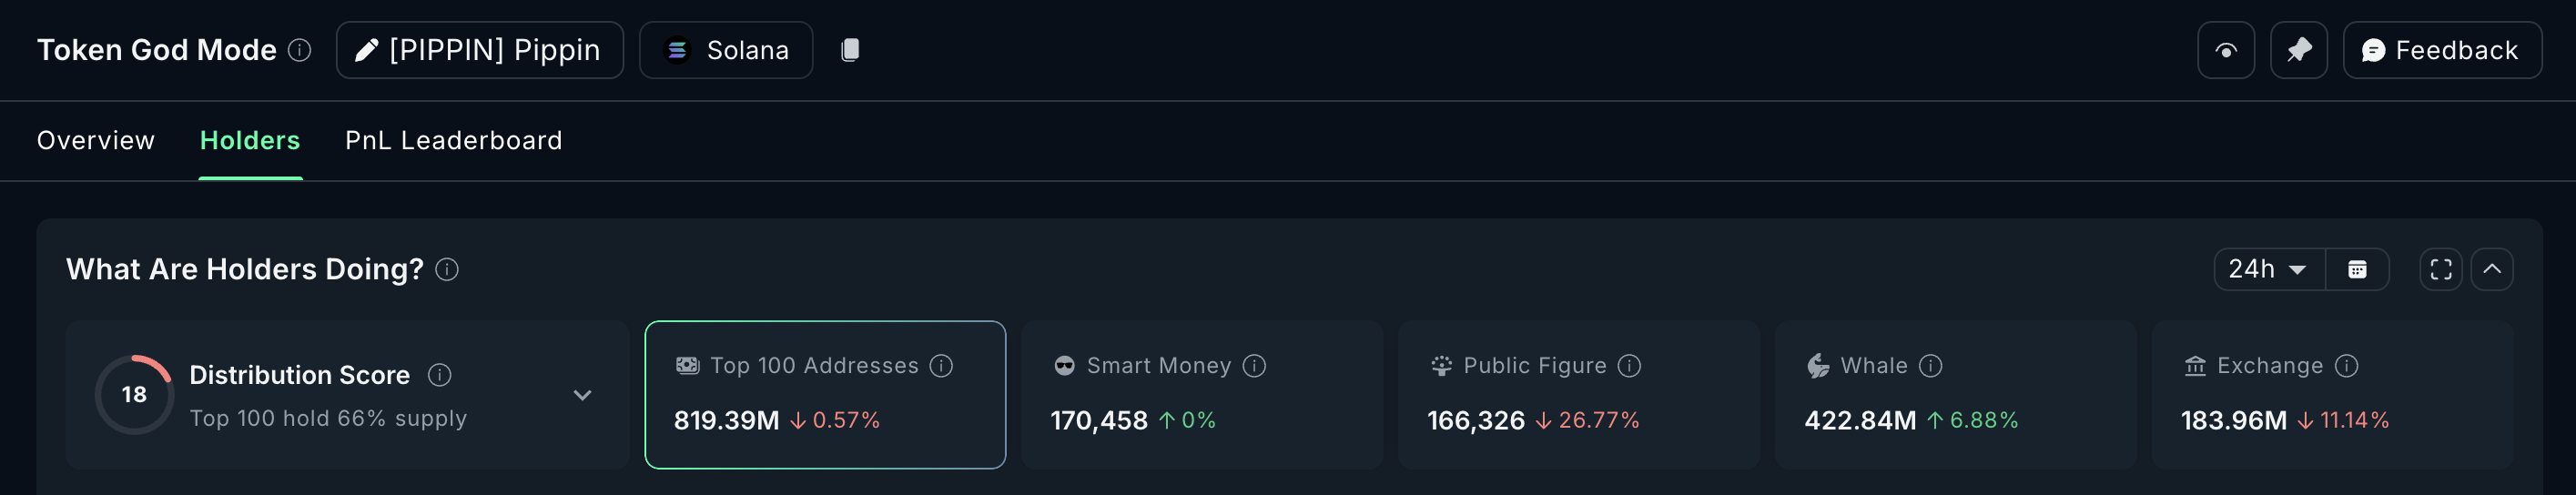
Whale behavior explains part of that rebound. Over the past 24 hours, Pippin whales increased their holdings by 6.88%, signaling confidence that the rally may continue rather than fade immediately. This accumulation suggests that larger players are betting that momentum can overcome near-term technical risks.
The chart, however, shows why February comes with a technical risk.
PIPPIN is forming a head-and-shoulders structure, with the latest push toward $0.55 shaping the right shoulder. At the same time, between January 4 and January 28, the price is on its way to print a higher high, while RSI has formed a lower high. That mismatch creates a bearish divergence, often seen when upside momentum begins to weaken even as price continues to rise.
This does not guarantee a reversal, but it raises caution.
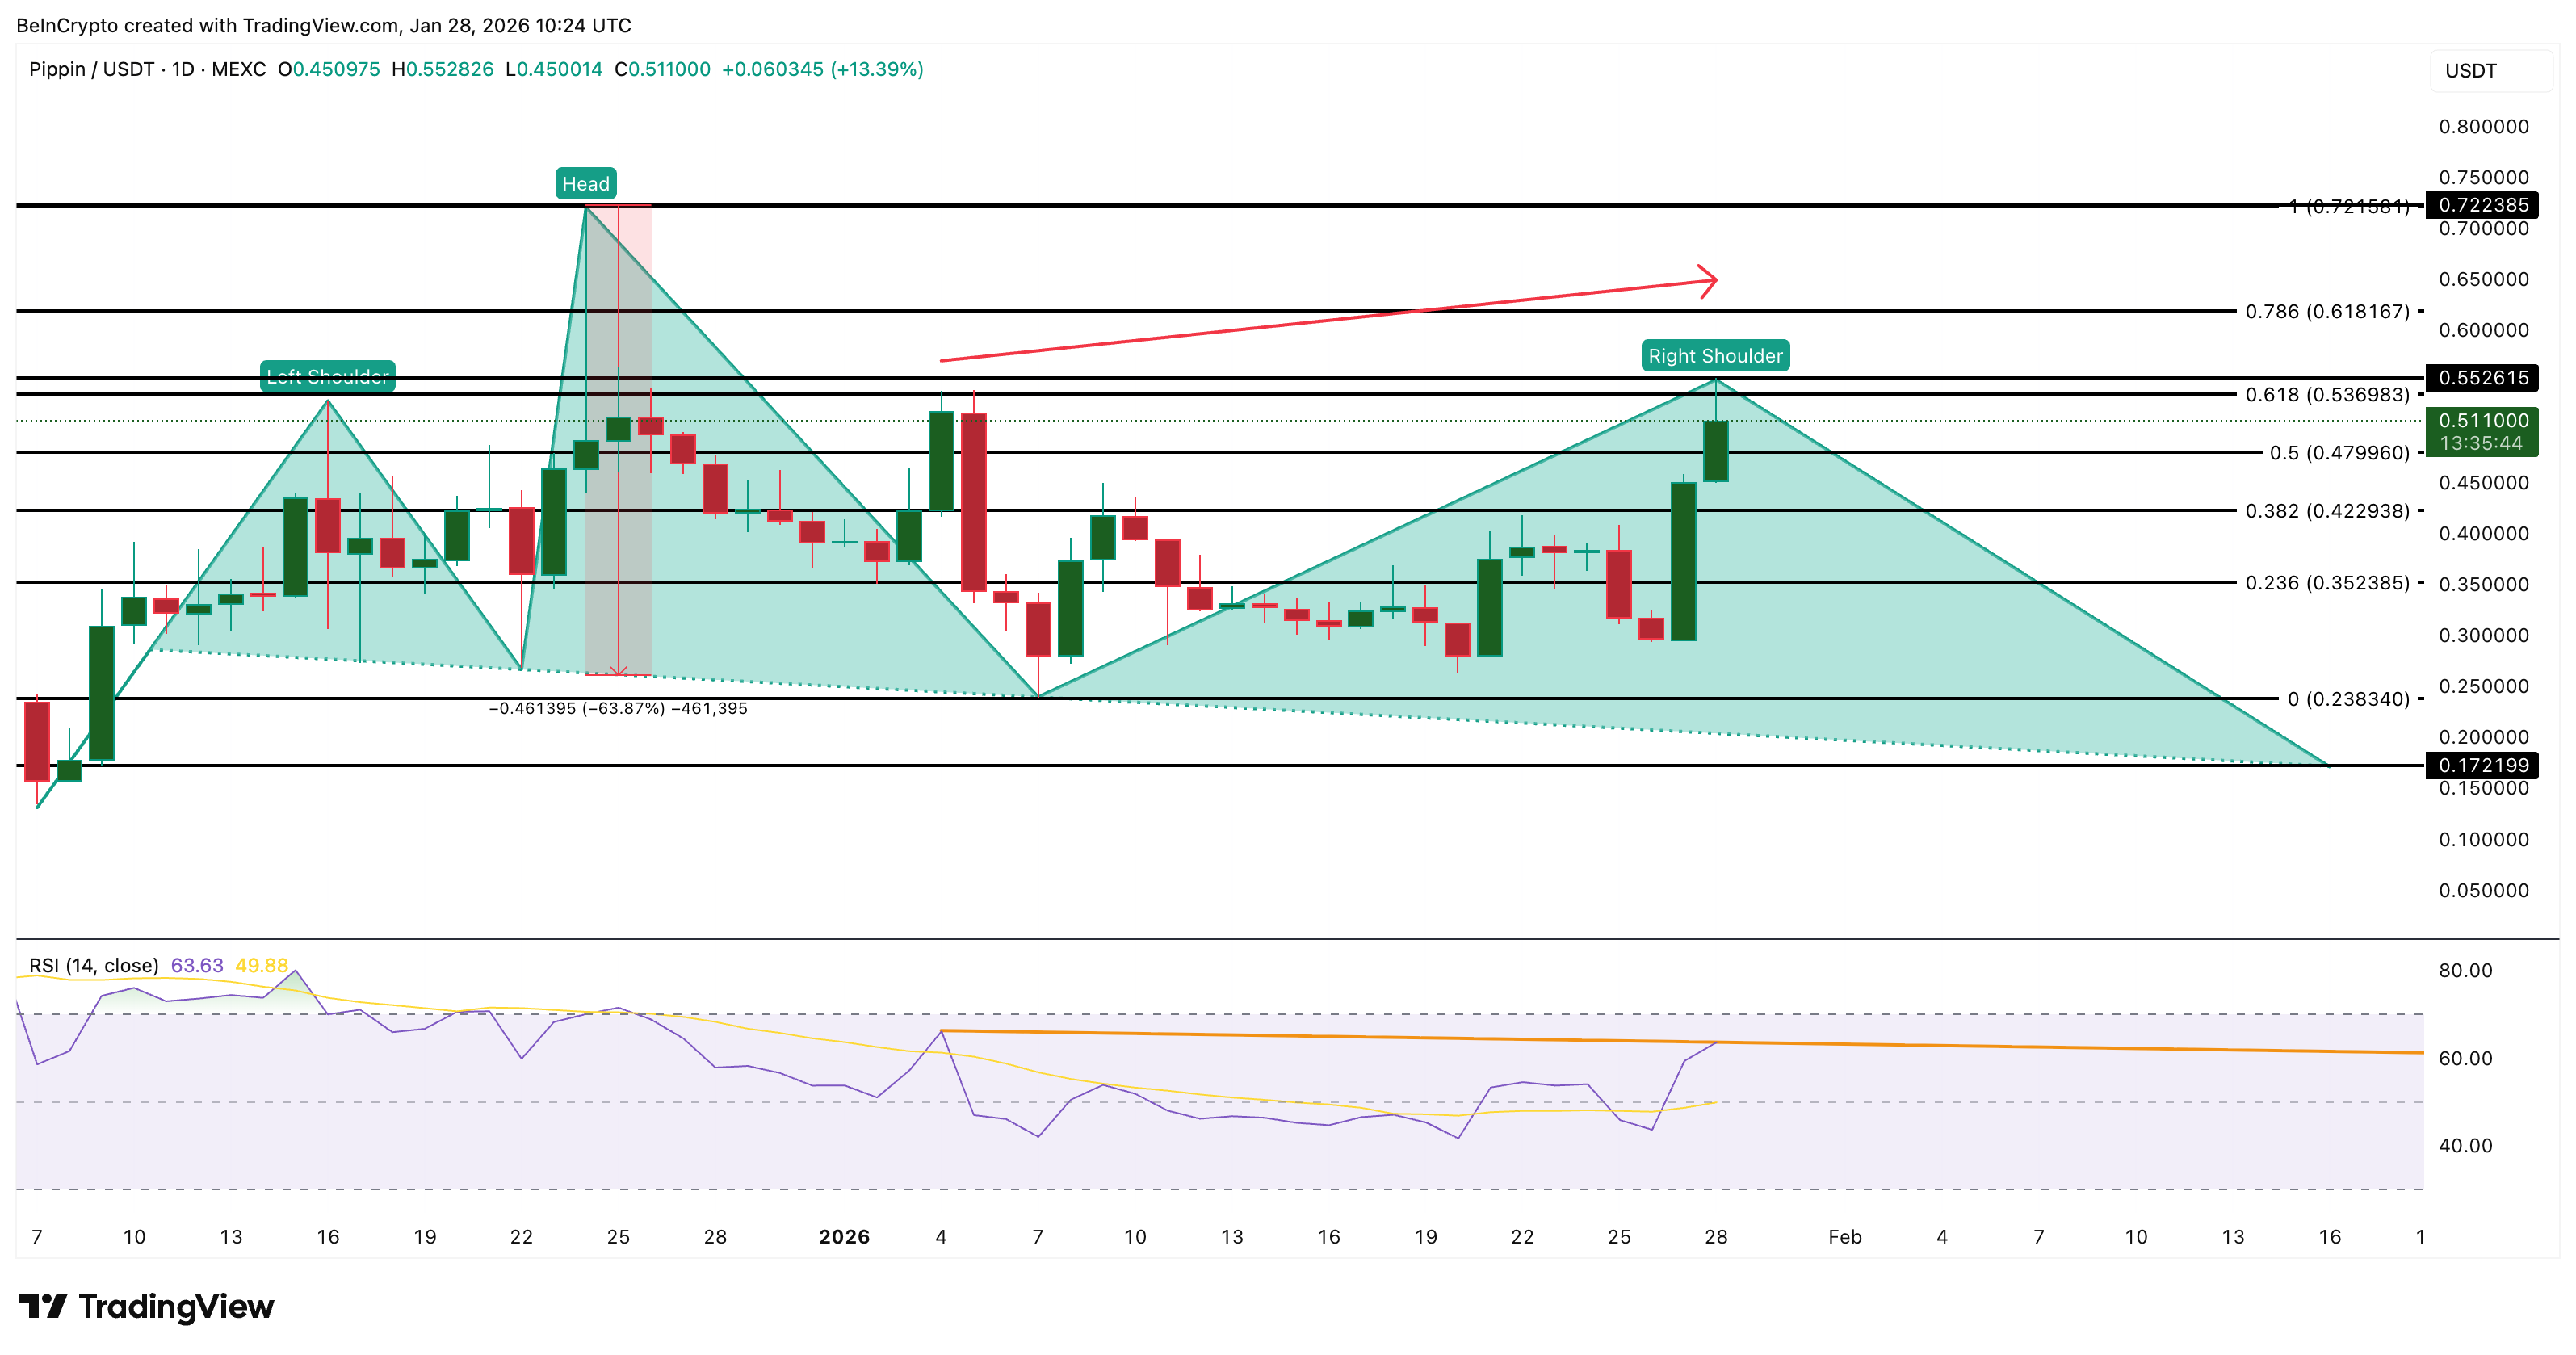
Key levels now matter. If Pippin holds above $0.55 and pushes higher, the bearish setup weakens sharply. A strong breakout toward $0.72 would invalidate the pattern entirely and open fresh upside.
On the downside, failure to hold $0.42 could trigger a deeper pullback toward $0.35, with major structural risk only appearing if price falls toward the distant neckline near $0.17.
In short, whales are buying strength, not fear. But February will test whether Pippin’s rally continues or exhausts.


