
Crypto World
3 reasons behind the bullish reversal


Disclosure: This article does not represent investment advice. The content and materials featured on this page are for educational purposes only.
Crypto market rebounds as buying surge drives total capitalization toward $2.4 trillion.
Summary
- Capital rotation from BTC and ETH is lifting utility plays like Mutuum Finance, now with $20.6m raised.
- Mutuum’s V1 testnet enables non-custodial lending, letting users borrow against ETH, USDT, LINK, and WBTC.
- Lenders earn via mtTokens while borrowers receive debt tokens, powering a decentralized credit market model.
The cryptocurrency market has experienced a decisive shift in momentum over the last 24 hours. After weeks of horizontal trading and minor corrections, a wave of buying pressure has pushed the total market capitalization toward the $2.4 trillion mark. This reversal is characterized by a sharp increase in trading volume across both centralized exchanges and decentralized protocols.
Market data shows that the “Fear & Greed Index” has jumped from a state of extreme fear to a neutral-to-positive reading in a single session. This rapid change in sentiment follows a period of heavy liquidations that effectively cleared out over-leveraged short positions. With the market “cleaner” from a structural standpoint, the path of least resistance has moved to the upside, bringing the $70,000 price target back into focus for the world’s biggest crypto.
Crypto market surges as bitcoin eyes $70k
Bitcoin (BTC) is currently leading the charge, trading near $66,200 after a nearly 8% single-day gain. The asset is now within striking distance of the psychological $70,000 barrier, a level it has not firmly held since early February. This move has triggered a “halo effect” across the altcoin market, where several top-tier assets are outperforming Bitcoin on a percentage basis.
Solana (SOL): Known for its high beta to market moves, SOL jumped 13% on February 25, reaching an intraday high of $89 as it tests key resistance zones.
Ripple (XRP): Rebounding from recent lows, XRP added 8% to its value, supported by increased clarity in ongoing regulatory discussions.
Dogecoin (DOGE): The leading memecoin saw a 9% spike, reflecting a return of retail speculative appetite as the broader market turns green.
3 reasons why the crypto market is surging
Record ETF Inflows: US-based spot Bitcoin ETFs recorded over $506 million in net inflows on February 25 alone. This represents the strongest single day of institutional buying since early 2026. This “smart money” accumulation provides a solid floor for the price and offsets selling pressure from short-term traders.
Short Squeeze and Liquidations: The sudden price jump forced the closure of over $571 million in bearish short positions. As these traders were “squeezed” out of their bets, they were forced to buy back Bitcoin and Ethereum, creating a feedback loop that accelerated the upward price movement.
Sparkling Retail Interest in Utility Protocols: There is a noticeable shift in how retail investors are allocating their capital. Instead of chasing high-risk memecoins, many are moving into utility-driven protocols that offer functional financial services. This new wave of interest is focused on platforms that provide financial tools, such as decentralized lending.
Profit reallocation and the rise of utility protocols
Historically, bullish periods in the crypto market follow a specific pattern. Once large-cap assets like Bitcoin and Ethereum finish their initial rally, investors and traders often reallocate their profits into cheaper sectors.
This “capital rotation” is currently favoring new utility protocols that show significant momentum. A prime example of this trend is Mutuum Finance (MUTM). This Ethereum-based project is building a non-custodial lending and borrowing ecosystem designed to help long-term holders unlock the value of their assets without selling them.
Mutuum Finance is already proving its concept with a recently launched protocol version that has attracted the attention of over 19,000 investors. The project has successfully raised over $20.6 million in funding, signaling strong confidence from its community. Currently, the MUTM token is priced at $0.04, reflecting a steady growth phase as the project prepares for its full mainnet transition.
The design and functionality of the V1 protocol
The Mutuum Finance V1 protocol is currently live on the Sepolia testnet, allowing users to interact with a fully functional decentralized credit market. The system is designed to handle high-value assets, including USDT, ETH, LINK, and WBTC.
Lending and mtTokens: When a user supplies assets to the protocol, they receive mtTokens. These interest-bearing receipts represent the user’s share of the liquidity pool. For example, if a lender deposits 1,000 USDT, they receive 1,000 mtUSDT.
As borrowers pay interest, the value of these tokens grows automatically; if the pool earns 5% interest, those 1,000 mtUSDT become redeemable for 1,050 USDT after one year, providing the lender with a passive yield.
Borrowing and Debt Tokens: Borrowers can use their deposited assets as collateral to take out loans. This process generates debt tokens, which track the borrower’s liability within the system. For instance, if a user provides $2,000 in ETH as collateral to borrow $1,000 in stablecoins, the protocol issues 1,000 debt tokens to their account.
Because the system is non-custodial, the user retains full control of their funds through smart contracts, and they simply need to return the value represented by those 1,000 debt tokens plus interest to unlock their original collateral.
A user provides more collateral than they borrow to maintain ownership of their assets while gaining liquidity. By borrowing instead of selling, a user keeps 100% of any future price increases on that collateral and avoids the capital gains taxes triggered by a sale.
Top assets eyeing new highs
As the market stabilizes, top cryptocurrencies like BTC, ETH, and XRP are eyeing significant technical milestones. Bitcoin is currently focused on flipping the $70,000 resistance into a support level, which many believe would trigger a run toward its previous all-time highs. Ethereum is similarly eyeing the $2,100 mark, supported by the technical upgrades outlined in the recent “Strawmap” roadmap.
At the same time, Mutuum Finance is moving forward with its official roadmap plans with a focus on facts and technical milestones. The next crypto stages include the integration of Layer 2 (L2) scaling to reduce transaction costs and the implementation of a buy-and-distribute mechanism. This model will use protocol fees to support the MUTM token’s ecosystem directly.
Disclosure: This content is provided by a third party. Neither crypto.news nor the author of this article endorses any product mentioned on this page. Users should conduct their own research before taking any action related to the company.

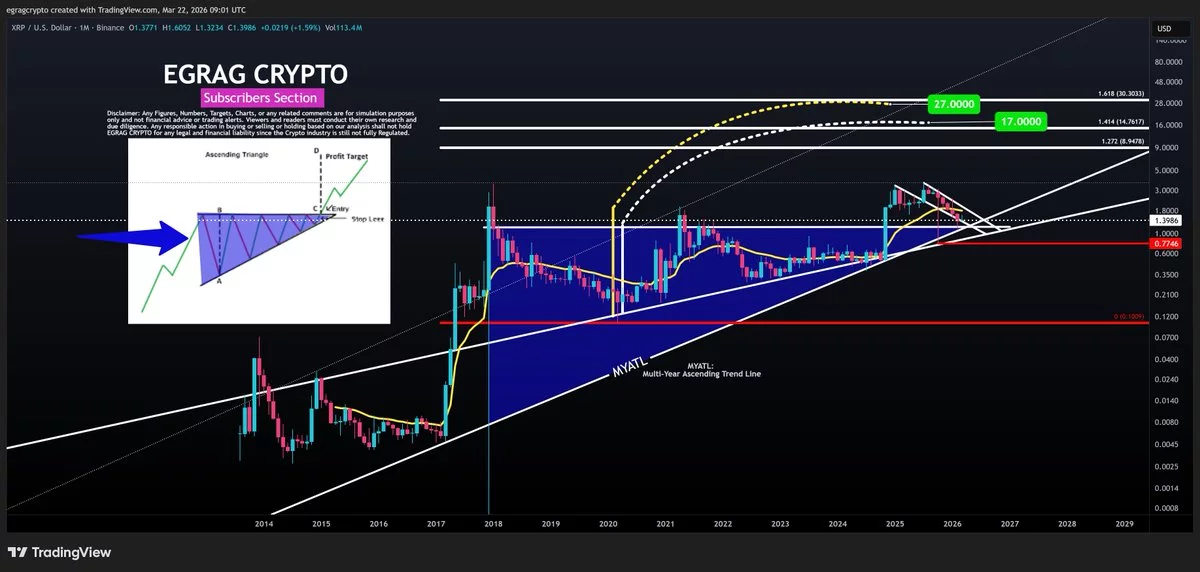
Ripple’s (XRP) price has recently slipped after a failed recovery attempt, with high-volume selling pushing the token back toward a key support level of $1.40. The token has struggled with a broader corrective phase since its peak in mid-2025, with rallies consistently failing to build momentum.
Summary
- XRP’s price drops to $1.40, facing a broader corrective phase since mid-2025.
- Retail investors continue to support XRP, while institutional interest remains cautious.
- XRP’s price action depends on upcoming regulatory developments and macroeconomic conditions.
XRP’s price is currently $1.40, experiencing a 3% decline over the past 24 hours. The cryptocurrency’s market cap stands at approximately $86 billion.
Despite some short-term attempts at recovery, XRP remains trapped in a larger corrective phase. The latest pullback comes after a brief rebound in mid-March, which failed to surpass the $1.60 mark.
XRP’s price struggles are compounded by macroeconomic factors, with the Federal Reserve’s recent policy stance influencing broader market sentiment. This has led to a cautious trading environment for many cryptocurrencies, including XRP. While the asset’s technical structure shows some resilience, traders are closely monitoring whether XRP can stabilize or continue to fall within its established range.
Retail adoption and institutional caution
While institutional interest in XRP remains cautious, the cryptocurrency continues to see strong support from retail investors. According to crypto analyst Egrag Crypto, XRP is currently in the retest phase of a macro ascending triangle, and the pullback in price is seen as confirmation rather than weakness. Egrag highlights a bullish long-term view, with potential price targets for XRP reaching $8, $17, and $27, provided the trendline holds.

Retail demand is becoming a key driver of XRP’s growth, with blockchain data showing a strong retail presence. Analysts are optimistic about the asset’s future potential, especially as macroeconomic factors and regulatory clarity evolve. However, skepticism remains within institutional circles, reflecting the more conservative approach from major investors.
XRP’s exchange activity signals resilience
Despite recent price declines, XRP continues to show resilience, with activity on top crypto exchanges, particularly Binance, signaling sustained demand. Data from CryptoQuant shows a modest shortage of XRP reserves on Binance, dropping to $2.79 billion as of March 22.
This suggests that traders are either holding onto their XRP or buying more, rather than selling off their holdings. XRP’s performance on exchanges indicates that the asset has not lost its appeal to investors, even amid the broader market downturn.
Moreover, XRP’s price action will likely depend on upcoming regulatory developments and broader market conditions. Analyst X Finance Bull points out that various catalysts, including the potential passage of the CLARITY Act and growing institutional interest, could provide upward momentum for XRP. However, the asset’s performance will continue to be shaped by both retail sentiment and institutional caution, creating a complex market dynamic moving forward.
Disclosure: This article does not represent investment advice. The content and materials featured on this page are for educational purposes only.
Bitcoin faced a retreat after a brief surge tied to geopolitical jitters, slipping back in line with the broader risk-off tone that has weighed on US equities in recent sessions. The move underscores a renewed relationship between BTC and traditional markets as macro headwinds persist.
As of Sunday, BTC/USD traded around $68,700, down about 5.7% for the week, while the S&P 500 finished the period down roughly 1.9%. The renewed correlation with equities adds a layer of caution for traders who had hoped for a decoupling amid persistent inflation, elevated oil prices, and a less favorable outlook for aggressive monetary easing.
Key takeaways
- Bitcoin’s recent uptick in correlation with the S&P 500 has historically preceded deeper price declines, with average drawdowns near 50% since 2018.
- The BTC-SPX relationship has tightened again, with the 20-week rolling correlation easing to about 0.13 after previously flirting with negative territory.
- Absent fresh buying by major strategic holders, Bitcoin remains vulnerable to a broader risk-off sell-off that could pull BTC lower along with equities.
- Analysts have pointed to downside targets around $34,350 if the historical pattern repeats; some projections still contemplate a Bitcoin bottom in the $30k–$40k range in the longer run, depending on macro developments.
Correlation with equities reemerges as a market signal
The renewed BTC-Stock connection is being watched closely by traders and analysts. A rising 20-week correlation between BTC and the S&P 500 suggests that Bitcoin may be increasingly swept up in risk-off dynamics that pressure equities, rather than acting as a separate flight-to-safety vehicle. The latest reading sits near 0.13, a rebound from a period when the metric briefly hovered around negative territory, underscoring how quickly Bitcoin can move in step with the stock complex during macro stress.
Historically, patterns where BTC begins to track the stock market more closely have tended to precede larger corrections in Bitcoin’s price. Tony Severino, a market analyst, described the dynamic as a warning sign that a broader stock-market pullback could pull BTC lower as well. While past performance is not a guarantee of future moves, the implication for traders is clear: macro headwinds can reassert themselves and pull the crypto cycle back toward the risk-off regime seen in prior cycles.
From a price perspective, the research across periods since 2018 points to severe downside when the BTC-SPX correlation strengthens after a long stretch of independence. If the current pattern holds, a hypothetical 50% decline from the present level would place Bitcoin near $34,350—a level some analysts have flagged as a plausible target if weaker macro conditions persist and risk assets continue to slide.
Macro backdrop and the path to a potential bottom
The renewed risk-off tone is reinforced by macro indicators that weigh on Bitcoin’s near-term trajectory. Elevated oil prices, ongoing inflation pressures, and a less-than-dovish stance on rate expectations all contribute to a bearish tilt for both stocks and risk assets, including BTC. In this environment, the likelihood of a policy shift that would spur a quick re-acceleration in risk appetites appears constrained in the near term, adding another layer of complexity for traders trying to gauge the timing of any meaningful crypto upcycle.
Market observers have revisited historical analogs where Bitcoin’s price action lagged turns in the equity market. In 2020 and 2022, for instance, Bitcoin’s declines often followed shifts in equity correlations after bullish false starts that briefly lifted BTC before selling pressure resumed. The current backdrop—tighter correlations paired with macro headwinds—suggests investors should brace for a broader test of BTC’s resilience if risk appetite remains elusive.
Strategic holdings pause compounds caution
The intraweek dynamic around strategic Bitcoin buyers adds another dimension to the risk calculus. Strategy (the firm behind the STRC vehicle) has not executed fresh BTC purchases through its STRC listing this week, per data tracked by STRC.LIVE. This follows a March 16 action in which the firm declared a buy that added 22,337 BTC worth about $1.57 billion, lifting its total holdings to roughly 761,068 BTC. That purchase had coincided with a period when Bitcoin outperformed US stocks, contributing to a temporary resilience in the crypto market.
With no new buys this week, Bitcoin’s near-term outlook hinges more on external risk appetite than on the stabilizing force of large, long-duration demand from major corporate buyers. In a risk-off regime, the absence of fresh strategic accumulation could leave BTC more exposed to downdrafts in the broader market, rather than benefiting from any immediate, independent crypto-driven catalysts.
As the market weighs macro signals and evolving correlations, investors are paying closer attention to how BTC behaves as equities navigate volatility. The question remains whether Bitcoin can reassert its own narrative—an inflation hedge narrative or a technology-led growth story—or if it continues to ride the coattails of stock-market dynamics until macro headwinds ease.
This article does not constitute investment advice. Readers should conduct their own research and consider their risk tolerance before making trading decisions.

Bitcoin and most altcoins experienced a decline in value following recent geopolitical developments, with Bitcoin facing rejection at $71,000.
Summary
- Bitcoin and altcoins see sharp declines, while SIREN surges 90% in 24 hours.
- Ethereum, XRP, and Solana follow Bitcoin’s downward trend, losing significant value.
- The crypto market cap drops $200B as macroeconomic factors weigh heavily on prices.
The broader cryptocurrency market, including Ethereum, XRP, and other major tokens, followed Bitcoin’s downward trend. Meanwhile, one altcoin, SIREN, managed to defy the market slump with a significant surge.
Bitcoin’s price faced significant volatility this week, with a high of $76,000 on Monday after it broke above $74,000. However, its upward momentum was short-lived, and the price quickly returned to $74,000 by Wednesday.
Volatility spiked ahead of and after the Federal Open Market Committee (FOMC) meeting, with Bitcoin falling by $3,000 before the event. After the Federal Reserve decided to leave interest rates unchanged, Bitcoin briefly bounced back to $72,000.
However, hawkish comments from Fed Chairman Jerome Powell regarding no rate reductions in 2026 led to another drop, with Bitcoin reaching a three-week low of around $68,000. Despite efforts to recover, the cryptocurrency is still struggling to regain stability.
Altcoins follow Bitcoin’s decline
Ethereum has experienced a decline of over $300 since its peak of $2,400, dropping below $2,100. XRP also saw a sharp drop, rejected at $1.60, and now struggles below $1.40. Other prominent altcoins like Solana (SOL), Cardano (ADA), Dogecoin (DOGE), Binance Coin (BNB), and Chainlink (LINK) are all down by 2-4% in the past 24 hours.
One of the worst performers in this market downturn has been HYPE, which lost almost 5% of its value and now trades around $38. ZEC (Zcash) also experienced a significant drop, shedding 7% of its value. Other altcoins such as AAVE, DOT, and SUI are down by 3-4%.
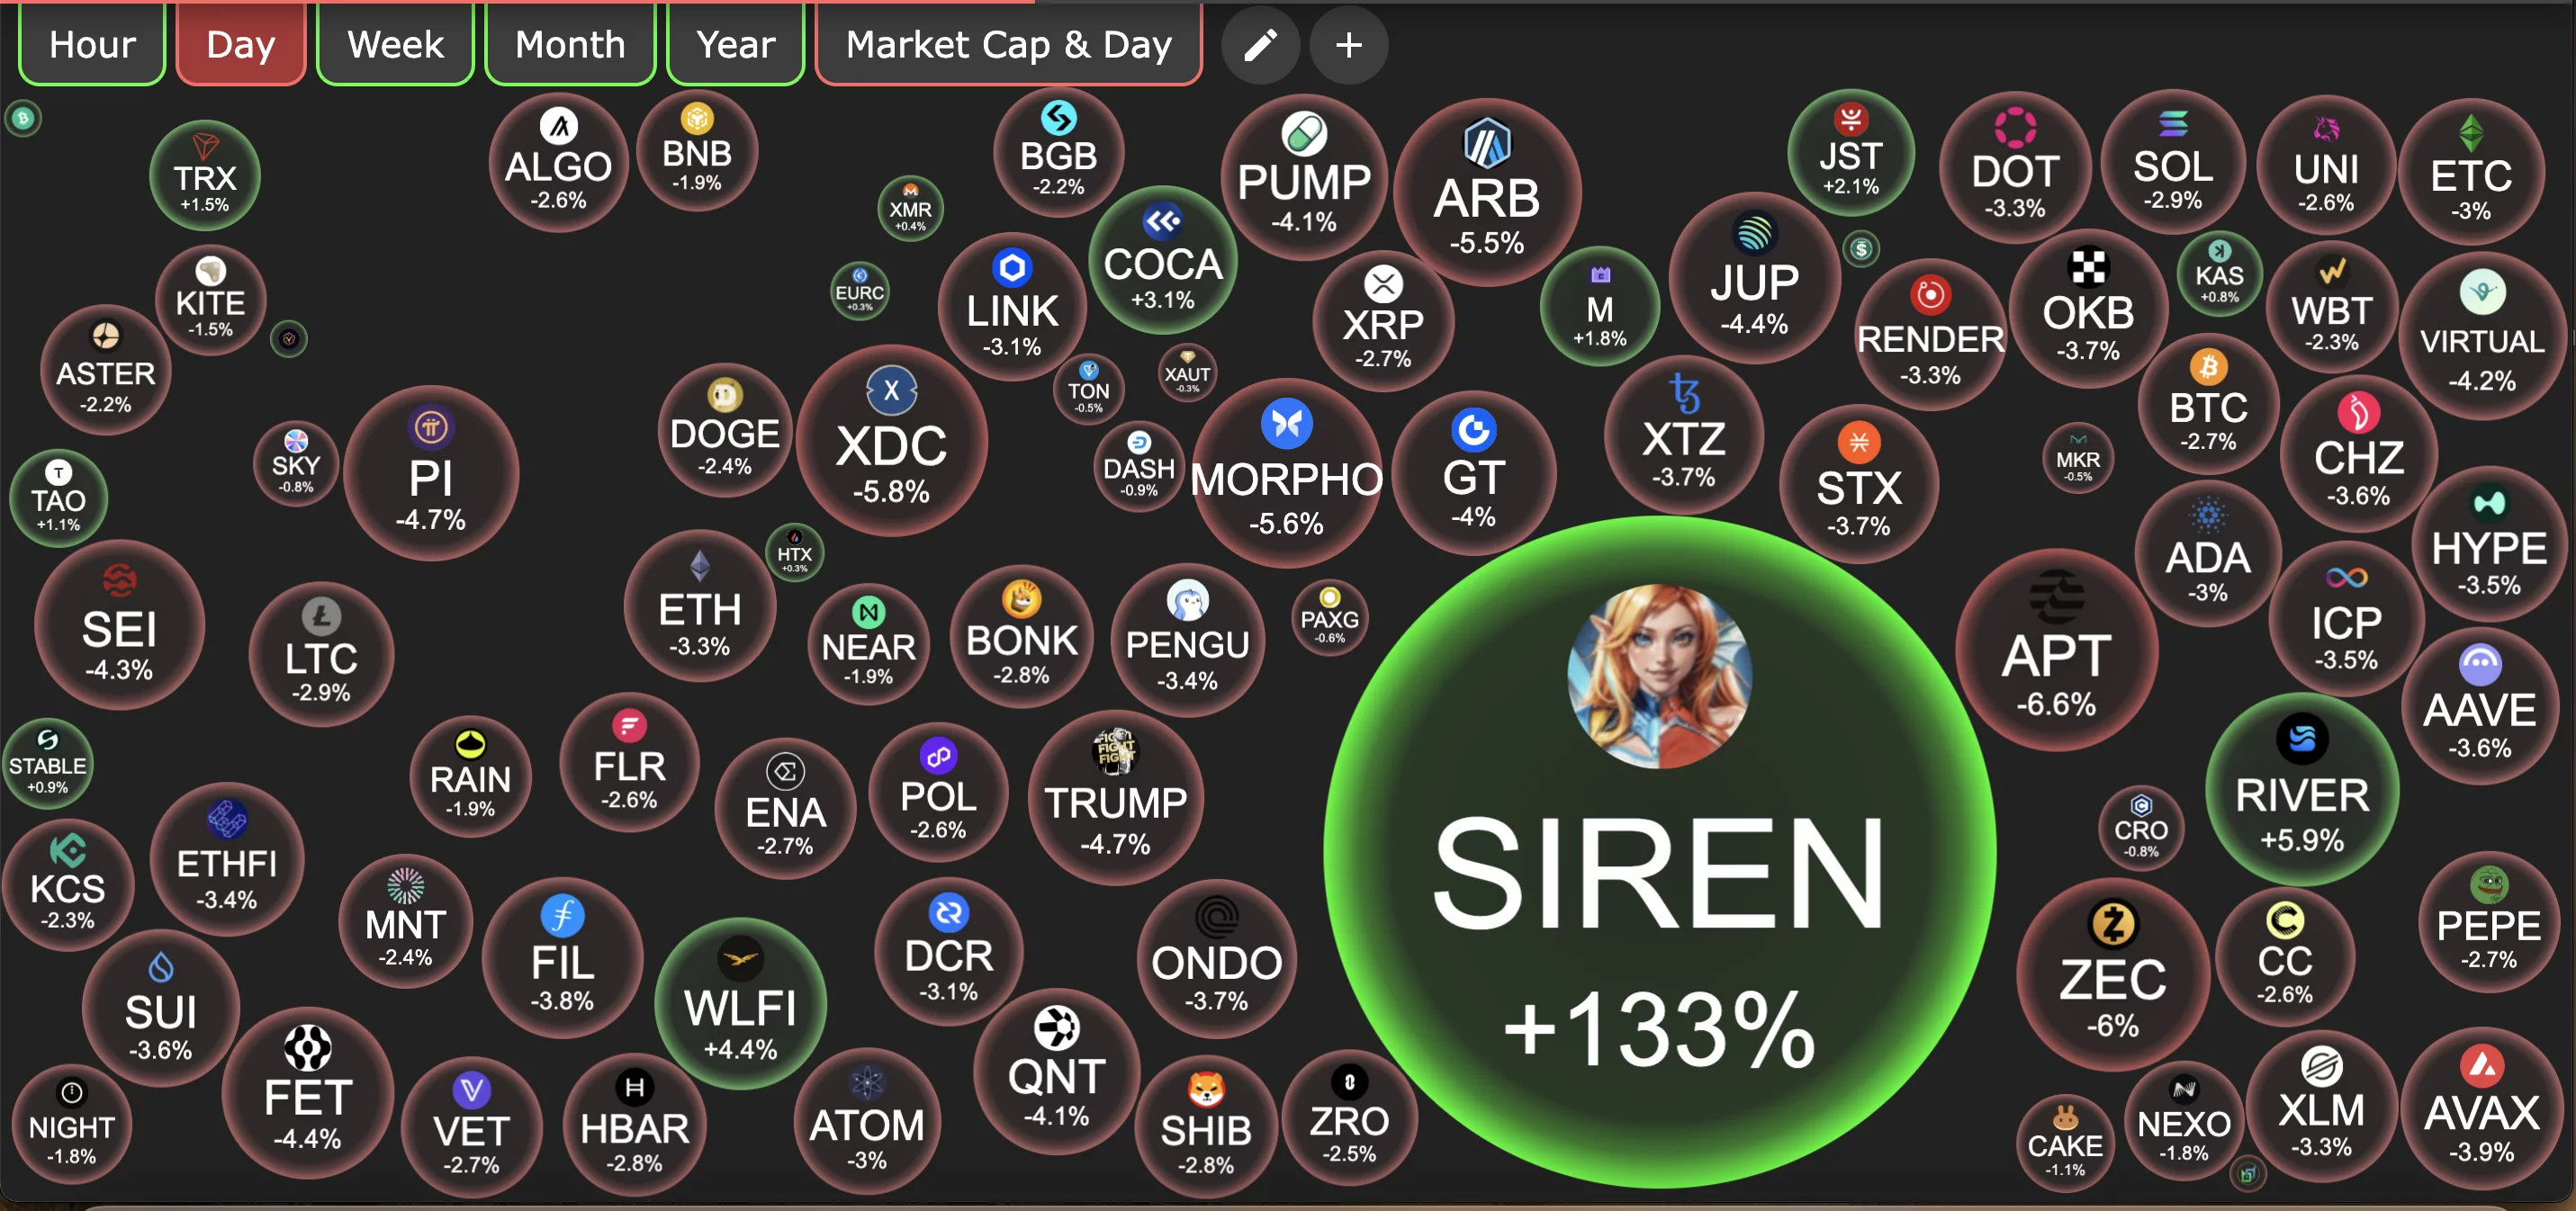
SIREN defies the market slump
While the majority of the crypto market faced losses, SIREN, an AI-focused cryptocurrency operating on the BNB chain, saw a remarkable surge. The token skyrocketed by 90% in the past 24 hours, reaching a new all-time high of over $1.70.
SIREN’s performance stands in contrast to the broader market slump, making it one of the standout performers during this period of market uncertainty.
Moreover, the total cryptocurrency market cap has taken a hit, shedding nearly $200 billion since Wednesday morning. As of the latest data, the total market cap stands at $2.43 trillion. This decline is a direct result of the drop in Bitcoin and altcoin prices, which have been influenced by both macroeconomic factors and market sentiment following the FOMC meeting.
Disclosure: This article does not represent investment advice. The content and materials featured on this page are for educational purposes only.

A new report from 10x Research reveals that the cryptocurrency market is currently seeing a divide in capital flows between retail and institutional investors. While institutional capital continues to support assets like Solana (SOL) and Ethereum (ETH), the XRP ecosystem is experiencing strong growth driven by retail adoption.
Summary
- XRP’s growth is largely driven by strong retail demand, with limited institutional involvement.
- Institutional capital favors Solana and Ethereum, with XRP receiving cautious interest.
- XRP Ledger sees growing retail participation, with 5.66M wallets holding under 100 XRP.
According to the 10x Research report, XRP’s price action is mainly supported by “strong retail demand and expanding utility.” The XRP ecosystem is seeing increasing adoption, with retail investors leading the charge in its growth.
While institutional interest in XRP remains cautious, retail investors continue to push the asset forward. The XRP Ledger (XRPL) is developing real-world use cases, but the absence of significant institutional flows reflects a more conservative stance from Wall Street.
Institutional capital continues to be a driving force for other major cryptocurrencies, particularly Solana and Ethereum. According to the report, institutional interest in Solana remains strong, as shown by its $20 million in ETF net flows for the week, while Ethereum has seen institutional outflows of $60 million.
In contrast, XRP ETFs only saw a modest $0.6 million in positive flows, reinforcing the notion that institutional investors are still cautious about XRP despite its growing retail base.
In addition, XRP’s strength is being supported by growing on-chain retail adoption. Blockchain analytics firm Santiment reported that the XRP Ledger recently reached a new milestone, with 5.66 million wallets holding under 100 XRP. This surge in retail participation signals that the XRP ecosystem is attracting more users despite the lack of significant institutional investment.


Ripple’s CTO emeritus David Schwartz recently engaged in an interesting exchange on X, responding to a post about XRP with a meme and supporting comments.
Summary
- David Schwartz responded to Solana with a meme, fueling the ongoing XRP-Solana rivalry.
- XRP’s integration on Solana through wrapped tokens highlights growing blockchain collaboration.
- XRP Ledger sees increased activity, but AI tools may cause failed transactions and higher fees.
Meanwhile, the interaction occurred after a statement from Solana Foundation President Lily Liu, which sparked reactions from the crypto community, particularly surrounding the future of blockchain gaming.
The conversation began when Solana’s official X account responded to a tweet from the Solana Foundation President, Lily Liu, who had stated that blockchain gaming was “not coming back.” In response, an X user jokingly announced they were switching chains and asked for a recommendation. Solana’s official account replied, saying,
“we hear XRP is nice this time of year.”
This prompted Ripple CTO emeritus David Schwartz to engage with the tweet from XRP-friendly exchange Bitrue. Bitrue had shared Solana’s tweet, and Schwartz responded with a GIF meme saying, “You’re goddamn right,” further fueling the ongoing discussion about XRP and Solana’s relationship. This playful back-and-forth highlighted the ongoing rivalry and camaraderie between the two blockchain ecosystems.
In December 2025, XRP made its way onto the Solana blockchain via Hex Trust’s wrapped XRP (wXRP) token. This move allowed XRP to be traded alongside the Ripple USD stablecoin (RLUSD) on the Solana network, marking a significant step in the collaboration between the two blockchains. The integration also raised curiosity about how these ecosystems could coexist and complement each other.
Schwartz’s response reflects the growing relationship between the two projects. Despite the ongoing competition in the blockchain space, it appears that XRP and Solana are finding ways to collaborate and engage with each other’s communities.
XRP Ledger activity and AI coding
Meanwhile, XRP Ledger (XRPL) has seen a spike in activity recently, with XRPL validator Vet suggesting that increased use of AI tools and scripts might be contributing to the rise in transactions. While this increase in activity is positive, Vet pointed out that it often results in complex queries or failed transactions, which can overload public infrastructure.
One user experienced a costly mishap, spending over $2,000 in transaction fees due to failed XRP Ledger transactions. Vet cautioned that while AI tools may improve efficiency, users should remain cautious and oversee their transactions to prevent potential issues.
VanEck, a prominent investment firm, has observed a shift in the Bitcoin (BTC) options market, highlighting growing defensive positioning from investors. The recent surge in put option demand and the drop in call option premiums signal a cautious outlook for Bitcoin’s price. This trend reflects investor concerns about macroeconomic factors and market volatility.
Summary
- Bitcoin’s put/call ratio hits 0.84, showing increased demand for downside protection.
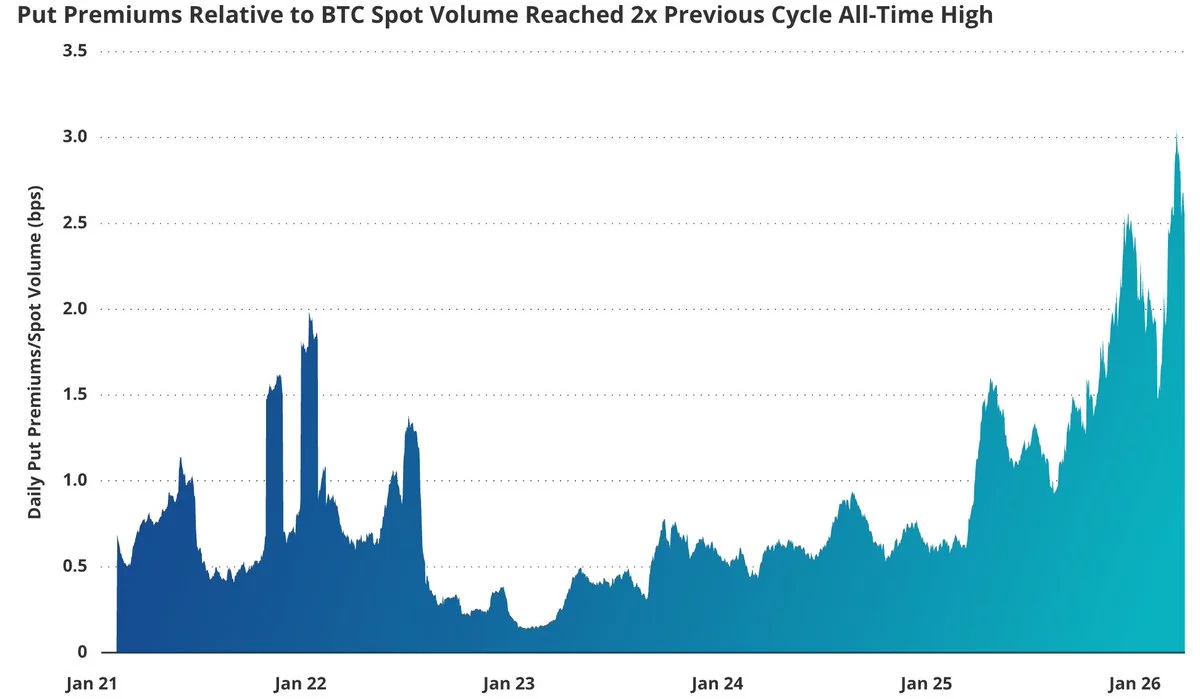
- Put premiums hit record highs, signaling growing caution in the market.
- Despite price declines, Bitcoin shows signs of stabilization with reduced volatility and leverage.
In early 2026, the Bitcoin options market has shown signs of heightened caution. VanEck’s analysis reveals that the put/call open interest ratio has risen to 0.84, the highest level since June 2021, reflecting stronger demand for downside protection.
Over the past 30 days, investors spent approximately $685 million on put options, signaling their concern for further price declines. Meanwhile, premiums on call options fell about 12%, to around $562 million, suggesting that bullish sentiment has waned.
This shift in sentiment coincides with a 19% decline in Bitcoin’s price over the last month. Despite this drop, spot prices have stabilized, and the market has entered a phase of consolidation, with volatility decreasing from 80 to 50. The drop in futures funding rates, which fell from 4.1% to 2.7%, further suggests that leverage in the market has cooled.

VanEck’s report indicates that the demand for downside protection is at its highest level in recent cycles. The put premiums relative to spot volume have reached an all-time high, with put premiums three times higher than levels seen during the market stresses of mid-2022. This suggests that investors are willing to pay a premium to hedge against further price drops, signaling a defensive stance.
The options skew, where put options are more expensive than call options, reflects this growing concern. As of March 2026, the cost of protecting against price drops is significantly higher than the cost of betting on price increases, with implied volatility on puts averaging 66, which is 16 points higher than realized volatility. Historically, this type of skew has often been seen before Bitcoin’s price rebounds.
Industry trends and network activity
Despite the heightened caution in the options market, other indicators show that the Bitcoin market is stabilizing. On-chain activity, such as transaction volume and daily active addresses, has declined, reflecting a more subdued speculative environment. However, long-term holder selling seems to be slowing down, which could be a positive sign for the market’s stability.
Bitcoin’s price recently surged to $70,000 before correcting, indicating potential signs of a cyclical bottom. VanEck’s CEO, Jan VanEck, has suggested that this may signal a recovery for Bitcoin, as the market adjusts to lower volatility and reduced leverage.
Bitcoin (BTC) erased much of its US-Iran war-driven gains this week, moving back in sync with the broader downtrend in risk assets, mainly US equities.
Key takeaways:
-
Bitcoin’s positive flip in S&P 500 correlation has historically preceded average declines of around 50% since 2018.
-
BTC is exposed to a broader risk-asset sell-off due to rising macro pressure.
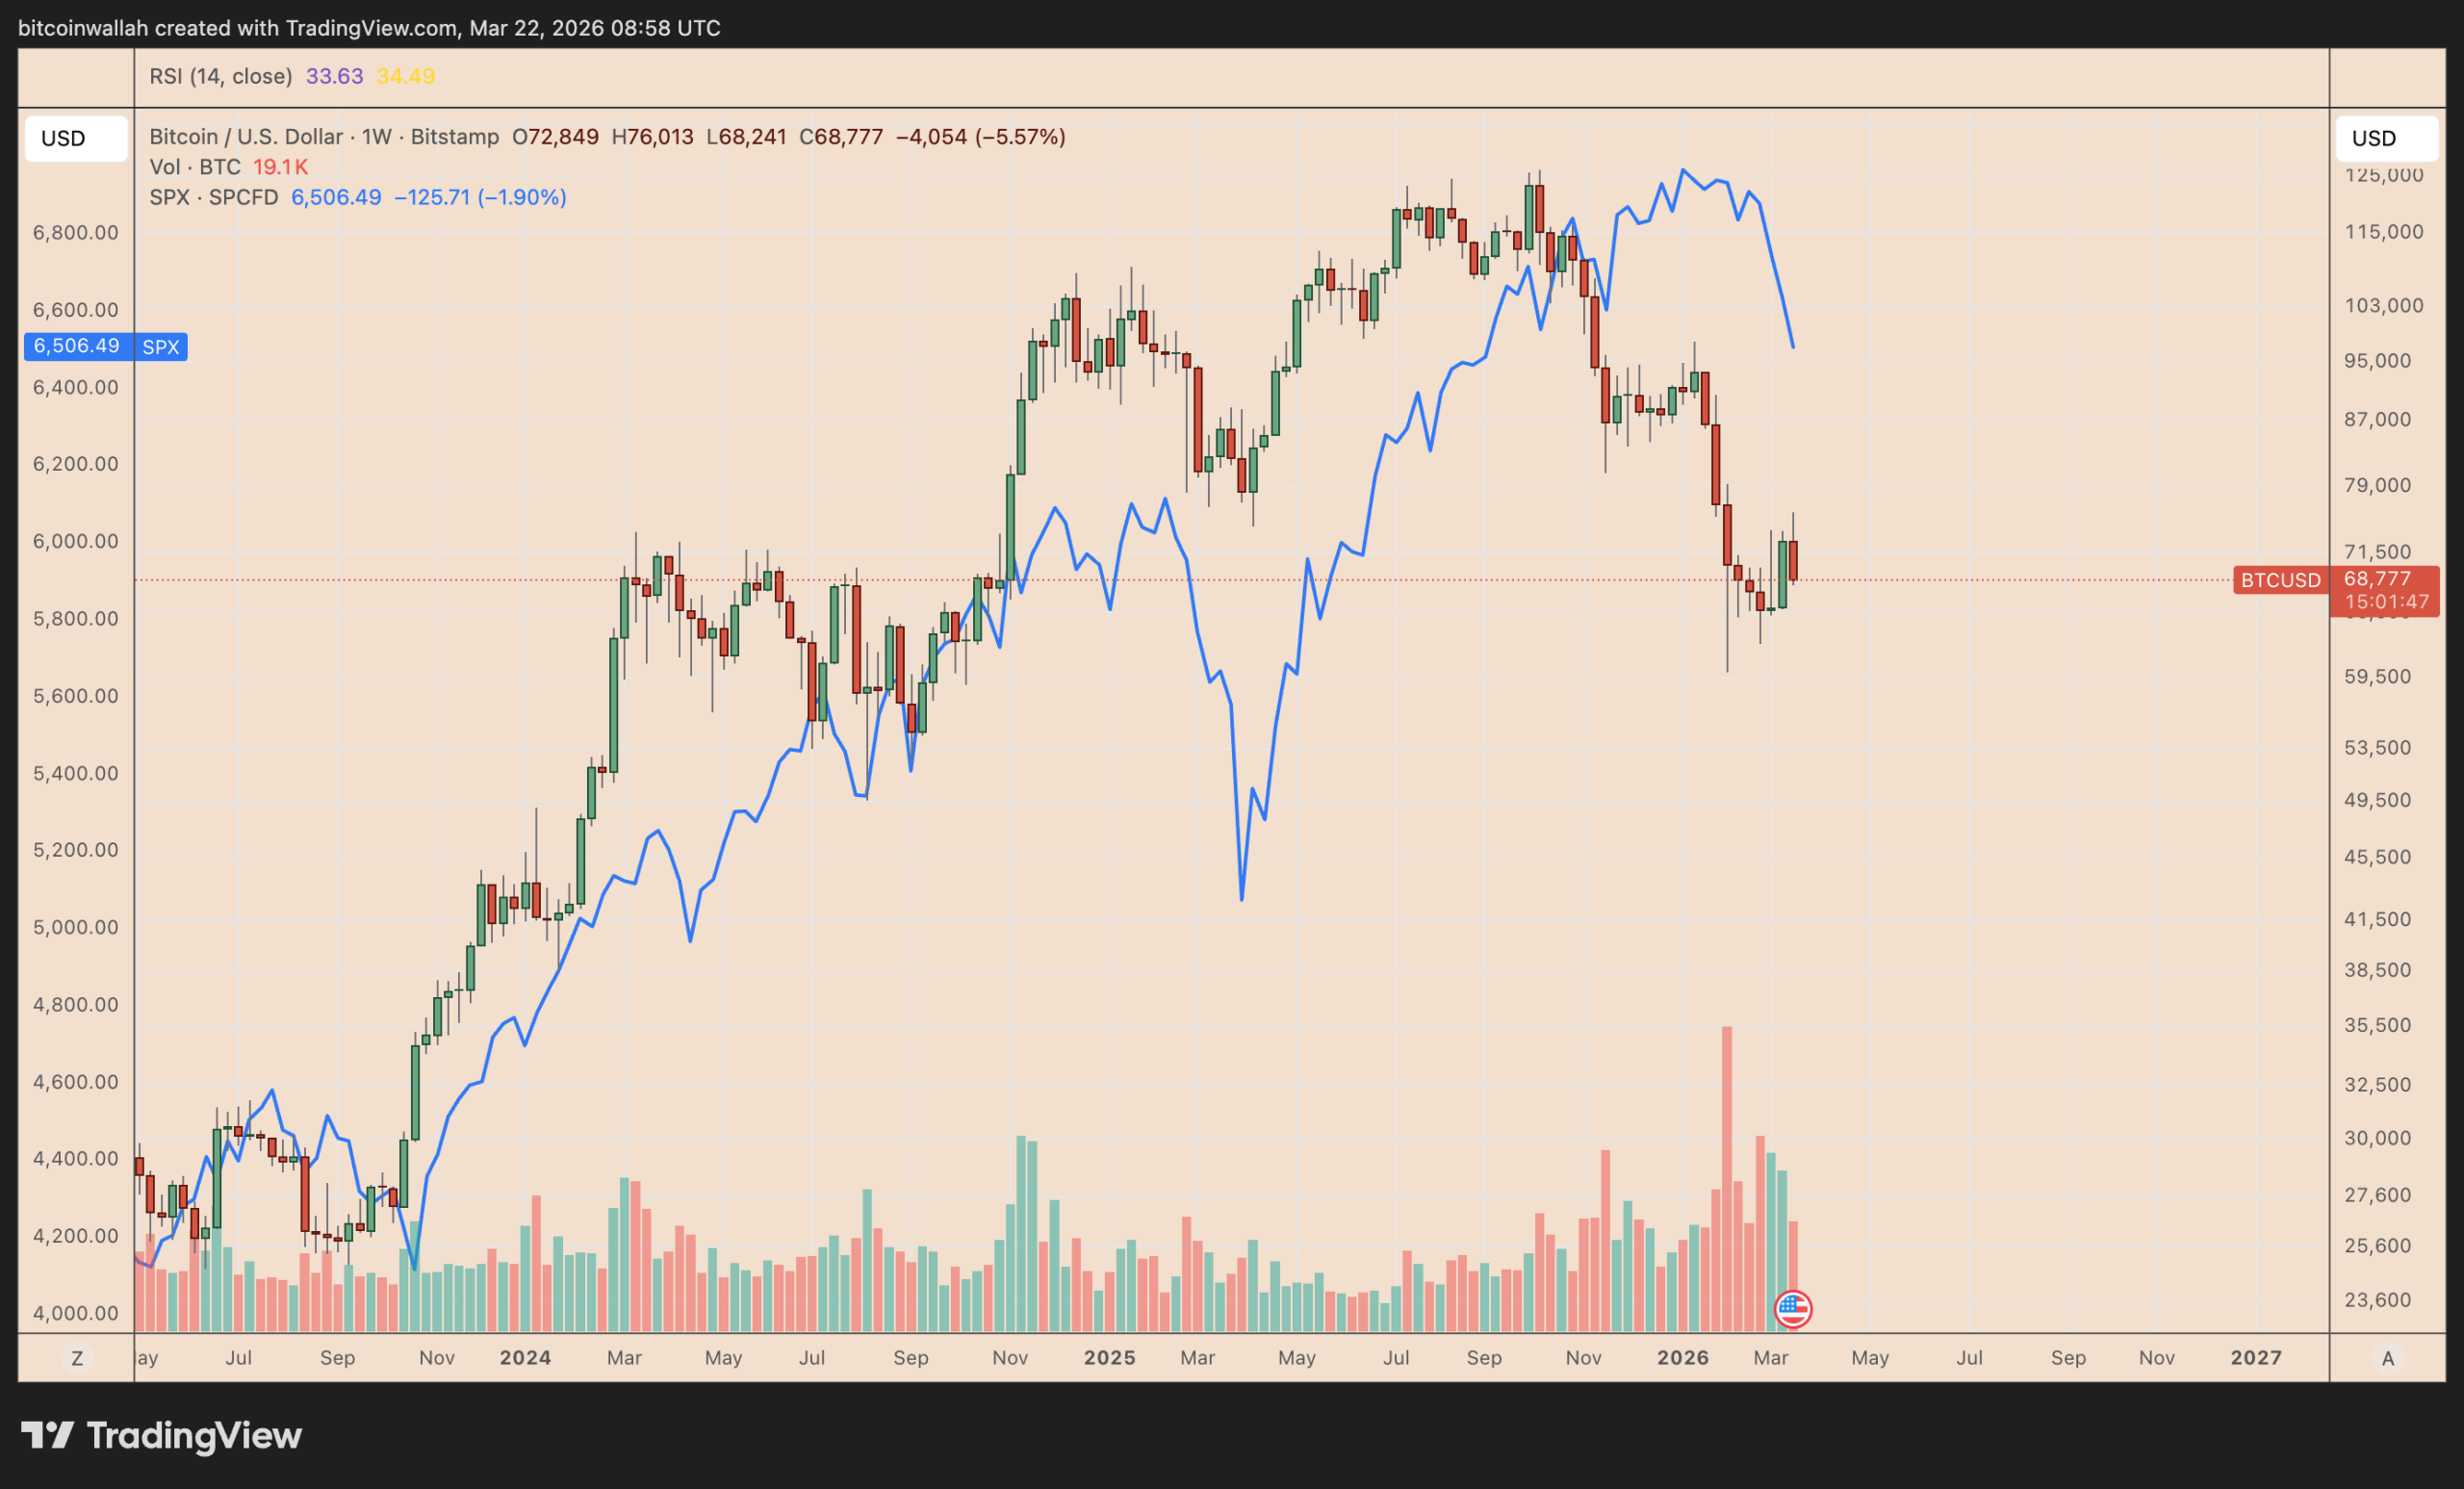
As of Sunday, BTC/USD had fallen 5.65% week-to-date to about $68,700, while the S&P 500 (SPX) closed the week down 1.90%.

That renewed correlation is now signaling a greater risk of further downside in the Bitcoin market.
BTC drops 50% on average when it starts following stocks
The bearish warning for Bitcoin comes from a weekly correlation metric comparing BTC and the S&P 500 (SPX), the US equity benchmark index.
As of Saturday, the 20-week rolling correlation between BTC and SPX was 0.13, up from its recent nadir of around -0.5.

Since 2018, such sharp recoveries in BTC-SPX correlation have been preceding broader Bitcoin market declines, averaging at about -50%.
“It is a warning sign that the stock market is going to collapse and take BTC with it,” said analyst Tony Severino.

A 50% drop from Bitcoin’s current price would imply a downside target of roughly $34,350 if the historical pattern repeats. Multiple analysts have projected Bitcoin to drop as low as $30,000–$40,000 in 2026.
In 2020 and 2022, Bitcoin’s declines lagged by several months, unfolding after classic “bull traps” in which BTC rallied alongside rising SPX correlation before reversing and wiping out those gains.
Related: Bitcoin options signal fear even as BTC ETF outflows remain relatively low
Macro conditions, such as elevated oil prices, inflation, and lower odds of the Federal Reserve cutting interest rates, support the bearish outlook for Bitcoin and equities over the coming months.
Strategy pause adds to cautious outlook
Bitcoin’s renewed correlation with equities is also coinciding with a pause in corporate accumulation.
Strategy (MSTR), one of the largest Bitcoin holders, hasn’t bought BTC via the sales of its STRC preferred stock this week, according to data resource STRC.LIVE.

Its last acquisition, announced March 16, added 22,337 BTC worth $1.57 billion, bringing total holdings to 761,068 BTC. Bitcoin rallied by around 10.50% in the same period, beating US stocks.
Strategy’s STRC-fueled buying helped support Bitcoin’s rally during the US–Iran war. With no fresh purchases this week, BTC is more exposed to the potential sell-off in stocks.
This article does not contain investment advice or recommendations. Every investment and trading move involves risk, and readers should conduct their own research when making a decision. While we strive to provide accurate and timely information, Cointelegraph does not guarantee the accuracy, completeness, or reliability of any information in this article. This article may contain forward-looking statements that are subject to risks and uncertainties. Cointelegraph will not be liable for any loss or damage arising from your reliance on this information.


In early 2026, a wave of layoffs across the crypto industry has raised concerns about the reasons behind the job cuts. While some companies cite macroeconomic factors, such as weak token prices, others frame their workforce reductions as part of a broader shift toward integrating AI into their operations.
Summary
- Major crypto firms, including Algorand and Gemini, cut staff due to market downturn and AI adoption.
- AI adoption in crypto companies leads to workforce reductions, with claims of increased efficiency.
- Job cuts across the industry mirror the challenges faced during the 2022 crypto winter.
Several major crypto firms, including Algorand, Gemini, Crypto.com, and Messari, have laid off staff in recent weeks. Algorand, for instance, announced it would cut 25% of its fewer than 200 employees, citing “the uncertain global macro environment” and the ongoing crypto downturn.
Similarly, Gemini Space Station (GEMI) announced it would eliminate roughly 200 positions in February, increasing to 30% by mid-March. Crypto.com also joined the list, trimming 12% of its workforce, about 180 employees.
In addition to these major companies, OP Labs, the team behind the Optimism layer-2 blockchain, laid off 20 employees, while PIP Labs, the team behind Story Protocol, reduced its staff by 10%. Messari, a crypto data provider that now emphasizes AI, made its third round of layoffs since 2023, though the number of affected employees was not disclosed.
Reasons for layoffs: Macro conditions or AI integration?
The official explanations for these layoffs vary. Algorand attributed its staff cuts to the broader economic conditions and weak token prices, such as its ALGO token trading at $0.09, down 98% from its 2019 peak.
However, many companies framed their layoffs as a pivot towards AI integration. Gemini, for instance, emphasized the necessity of AI, stating, “AI is now too powerful not to use at Gemini,” and warned that not adopting AI would soon be akin to using a typewriter instead of a laptop.
Crypto.com echoed this sentiment, stating that integrating AI into their processes resulted in increased efficiency, requiring fewer workers. CEO Kris Marszalek argued that companies not pivoting toward AI would fail. The shift towards AI adoption is seen as part of a broader trend in the industry, with AI being increasingly incorporated into workflows to reduce costs and improve productivity.
Consolidation and industry shrinkage
Industry observers pointed to broader trends of consolidation and cost-cutting. Entire sectors within crypto, such as restaking, decentralized physical infrastructure networks (DePIN), and layer-2s, which once boasted abundant talent, have experienced significant contraction. The reduction in these sectors’ activities has led companies to downsize and adjust to new market conditions.
Dan Escow, founder of crypto recruitment agency Up Top, noted,
“I see no real indication that these layoffs have anything to do with AI workforce replacement at scale.”
Instead, he suggested that the layoffs were primarily driven by the need for companies to cut costs and survive amidst ongoing challenges in the market.
The broader job market in crypto also reflects this downturn. New job postings on major crypto job boards dropped significantly, running at only 6.5 per day in January 2026, down approximately 80% from the previous year.
In addition, the job cuts from the companies mentioned in this article alone account for about 450 layoffs. This recent surge in layoffs follows the trend of the 2022 crypto winter, when over 26,000 job losses were tracked throughout the year.

In a development that underscores the heightened scrutiny around India’s crypto sector, CoinDCX co-founders Sumit Gupta and Neeraj Khandelwal were reportedly detained by Thane Police over allegations tied to a crypto investment fraud case. The Economic Times reported the arrest, citing local officials, while other outlets indicated the founders were summoned for questioning rather than formally arrested, illustrating the evolving and sometimes contradictory nature of the case.
The centerpiece of the case is a website alleged to imitate the CoinDCX platform and a first information report filed by a 42-year-old insurance consultant who claims to have lost about 71 lakh Indian rupees (roughly $75,000) after being lured to invest via the fake site. In a post on X, CoinDCX said the FIR was false and filed as a conspiracy by impersonators who redirected funds to third-party accounts with no connection to the exchange. The company said it is fully cooperating with law enforcement and stressed that brand impersonation and cyber fraud are growing issues for India’s digital-finance ecosystem.
Key takeaways
- Alleged arrest tied to a branded impersonation fraud case; local reporting varies on whether Gupta and Khandelwal were arrested or summoned for questioning.
- The FIR centers on a counterfeit CoinDCX site and a loss claim of about 71 lakh INR (~$75,000) from a 42-year-old insurance consultant.
- CoinDCX asserts the FIR is a conspiracy by impersonators and that funds were moved to third-party accounts unrelated to the exchange; the firm says it is cooperating with authorities.
- Scale of brand impersonation: CoinDCX said more than 1,212 impersonation websites targeting its coindcx.com domain were reported between April 1, 2024, and January 5, 2026.
Impersonation case and alleged fraud
The core allegations hinge on a counterfeit CoinDCX website designed to mislead investors and divert them to fraudulent destinations. The FIR, reportedly filed by a 42-year-old insurance consultant, claims losses of approximately 71 lakh INR. While media coverage varies on whether the founders were arrested or questioned, the episode highlights a persistent vulnerability in India’s crypto landscape: brand impersonation and fraudulent schemes that prey on users seeking mainstream platforms.
CoinDCX’s response and ongoing investigation
CoinDCX issued a statement via X denying the FIR as false and described as “a conspiracy by impersonators” the attempt to pin wrongdoing on its founders. The exchange emphasized that the funds in question were diverted to third-party accounts without any connection to CoinDCX. The firm reiterated its cooperation with law enforcement and framed the incident as part of a broader wave of impersonation and cyber fraud targeting digital finance users. The company also signaled a broader commitment to user education and awareness as part of its response strategy.
Phishing and security challenges in India’s crypto landscape
The incident arrives against a backdrop of growing concern about phishing and brand impersonation in India’s crypto space. CoinDCX has warned that impersonation and domain-squatting attacks have become increasingly common as criminals attempt to capitalize on public trust in recognizable platforms. The company said it has logged thousands of impersonation attempts, with more than 1,212 fake sites impersonating its coindcx.com domain reported across a period spanning 2024 to early 2026. The episode reflects a broader, ongoing problem of deceptive online schemes that target crypto users in India.
Broader risk environment for investors and Web3
Experts note that the Indian market is contending with a surge in online investment scams. Data cited by Insights IAS from India’s Ministry of Home Affairs indicate that investment scams accounted for about 76% of all financial losses in 2025. On a global scale, Web3 platforms faced substantial losses from hacks and exploits in 2025—reported at around $3.95 billion—underscoring the risk environment facing users and operators alike.
CoinDCX’s trajectory amid growth and scrutiny
Founded in 2018 and based in Mumbai, CoinDCX has established itself as one of India’s leading crypto exchanges. Its valuation rose to about $2.45 billion following a funding round that included Coinbase Ventures in October 2025, marking a high-profile milestone for Indian crypto infrastructure. The exchange has also faced its share of security incidents; in July 2025, attackers reportedly stole roughly $44 million from an internal operational account, a breach that CoinDCX described as one of the month’s largest losses, while stressing that customer assets remained unaffected. The episode added to concerns about internal controls and security governance within crypto firms, even as the platform continued to push for mainstream adoption and regulatory clarity.
As authorities continue to investigate the latest allegations, observers will be watching for official statements from Thane Police and any subsequent charges or clarifications. The case could influence how regulators in India approach exchange transparency, user protection, and branding risks, particularly as the country charts its path toward broader crypto participation and governance.
What remains uncertain is how the investigation will unfold and what it could mean for CoinDCX’s brand and user trust in the near term. Investors, users, and builders should monitor regulatory responses, updates from law enforcement, and how exchanges reinforce anti-impersonation measures as part of a broader push for safer digital finance in India.


Brazil’s new Finance Minister, Dario Durigan, has decided to delay a public consultation on crypto taxation.
Summary
- Brazil’s Finance Minister halts crypto tax consultation to avoid election-year controversy.
- Durigan shifts focus to tech regulation and financial reforms, postponing crypto tax issues.
- Brazil remains the largest crypto market in Latin America despite tax consultation delay.
At the same time, this move comes as the government shifts its focus toward the October presidential election. Durigan, who took office last Friday, aims to avoid controversial tax measures during this politically sensitive period.
Durigan’s decision to pause the consultation on crypto taxation is seen as part of a broader fiscal delay strategy. The consultation was expected to address the tax treatment of crypto flows, particularly those involving stablecoins.
The Brazilian central bank had recently finalized rules that brought crypto service providers under financial sector regulations, requiring them to obtain operational authorization. These rules also placed stablecoin transactions and virtual assets used for international transfers under foreign exchange market oversight.
The Finance Ministry consultation was seen as the next step in Brazil’s evolving crypto framework, but Durigan’s decision to shelve it signals that tax measures will not be a priority during an election year. The sources close to the matter indicated that Durigan aims to conserve political capital and avoid potentially divisive issues in Congress.
Instead of crypto-related taxation, Durigan’s legislative priorities will center around big tech regulation, financial institution crisis management, and the Redata data center investment program. These issues align with his broader goal of driving economic development and fostering a favorable business environment in Brazil.
The delay in the crypto tax consultation is also part of a wider pause on fiscal proposals, including a previous plan to end tax exemptions on investment securities. This proposal, which failed to gain traction in Congress last year, may be postponed until after the 2026 presidential mandate.
Moreover, Brazil remains the largest crypto market in Latin America, ranking fifth globally in the Chainalysis Global Crypto Adoption Index. The country has seen increased institutional interest in crypto, with major investments such as Paradigm’s $13.5 million Series A funding for the stablecoin startup Crown.
Despite the tax consultation being on hold, crypto service providers must still meet the compliance deadline set for November 2026.

Why You Should Always Poo Whenever You Feel The Urge To Go
Ex-Jets scout exposes Ty Simpson’s red flags for “surefire bust” comp ahead of 2026 NFL draft

Samsung stopping sales of the TriFold is actually a good thing


-

 Tech7 days ago
Your Legally Registered ‘Motorcycle’ Might Not Count Under Proposed US Law
-

 Fashion2 days ago
Weekend Open Thread: Adidas – Corporette.com
-

 Politics2 days ago
Jenni Murray, Long-Serving Woman’s Hour Presenter, Dies Aged 75
-
 Tech5 days ago
Are Split Spacebars the Next Big Gaming Keyboard Trend?
-

 Crypto World15 hours ago
Best Crypto to Buy Now: Strategy Just Spent $1.57 Billion on Bitcoin During Fear While Early Investors Quietly Enter Pepeto for 150x Potential
-

 News Videos4 days ago
RBA board divided on rate cut, unusually buoyant share market | Finance Report | ABC NEWS
-

 Crypto World16 hours ago
Bitcoin Price News: Bhutan Sells $72 Million in BTC Under Fiscal Pressure, but the Smart Money Entering Pepeto Sees What the Market Does Not
-

 Business7 days ago
Search for Savannah Guthrie’s Mother Enters Seventh Week with No Arrests
-
 Crypto World2 days ago
NIO (NIO) Stock Plunges 6.5% as Shelf Registration Sparks Dilution Worries
-

 Business6 days ago
Australian shares drop as Iran war enters third week
-

 Crypto World6 days ago
Crypto Lender BlockFills Enters Chapter 11 with Up to $500M in Liabilities
-

 Politics4 days ago
The House | The new register to protect children from their abusers shows Parliament at its best
-

 Fashion6 days ago
25 Celebrities with Curly Hair That Are Naturally Beautiful
-

 Tech2 days ago
inKONBINI Lets You Spend Summer Days Behind the Register
-

 Crypto World4 days ago
Canada’s FINTRAC revokes registrations of 23 crypto MSBs in AML crackdown
-
 Politics5 days ago
Real-time pollution monitoring calls after boy nearly dies
-
 NewsBeat4 days ago
Residents in North Lanarkshire reminded to register to vote in Scottish Parliament Election
-

 Business6 days ago
Meta planning major layoffs as AI spending and automation reshape workforce
-

 News Videos4 days ago
PARLIAMENT OF MALAWI – PAC MEETING WITH REGISTRAR OF FINANCIAL ON AMARYLLIS HOTEL – INQUIRY LIVE
-
 Crypto World7 days ago
U.S. Oil Companies Post Record Profits as Oil Prices Break $100
You must be logged in to post a comment Login