
Crypto World
3 Reasons Why Bitcoin Won’t Stay Below $80,000 for Long

Bitcoin got off to a rough start in February as negative sentiment persisted and market liquidity weakened. However, the latest data suggests that selling pressure is gradually easing, while early signs of recovery are emerging.
These signs are not yet strong enough to confirm a reversal, but they remain some of the few positive signals in this phase.
Sponsored
3 Reasons Bitcoin Could Soon Recover From Below $80,000
A recent report from BeInCrypto noted that crypto funds saw $1.7 billion in outflows last week. This reversed year-to-date inflows into net losses.
Still, early indicators suggest that selling pressure may be fading. This is evident in the Coinbase Premium Index, which measures the price difference between Bitcoin on Coinbase and other exchanges.
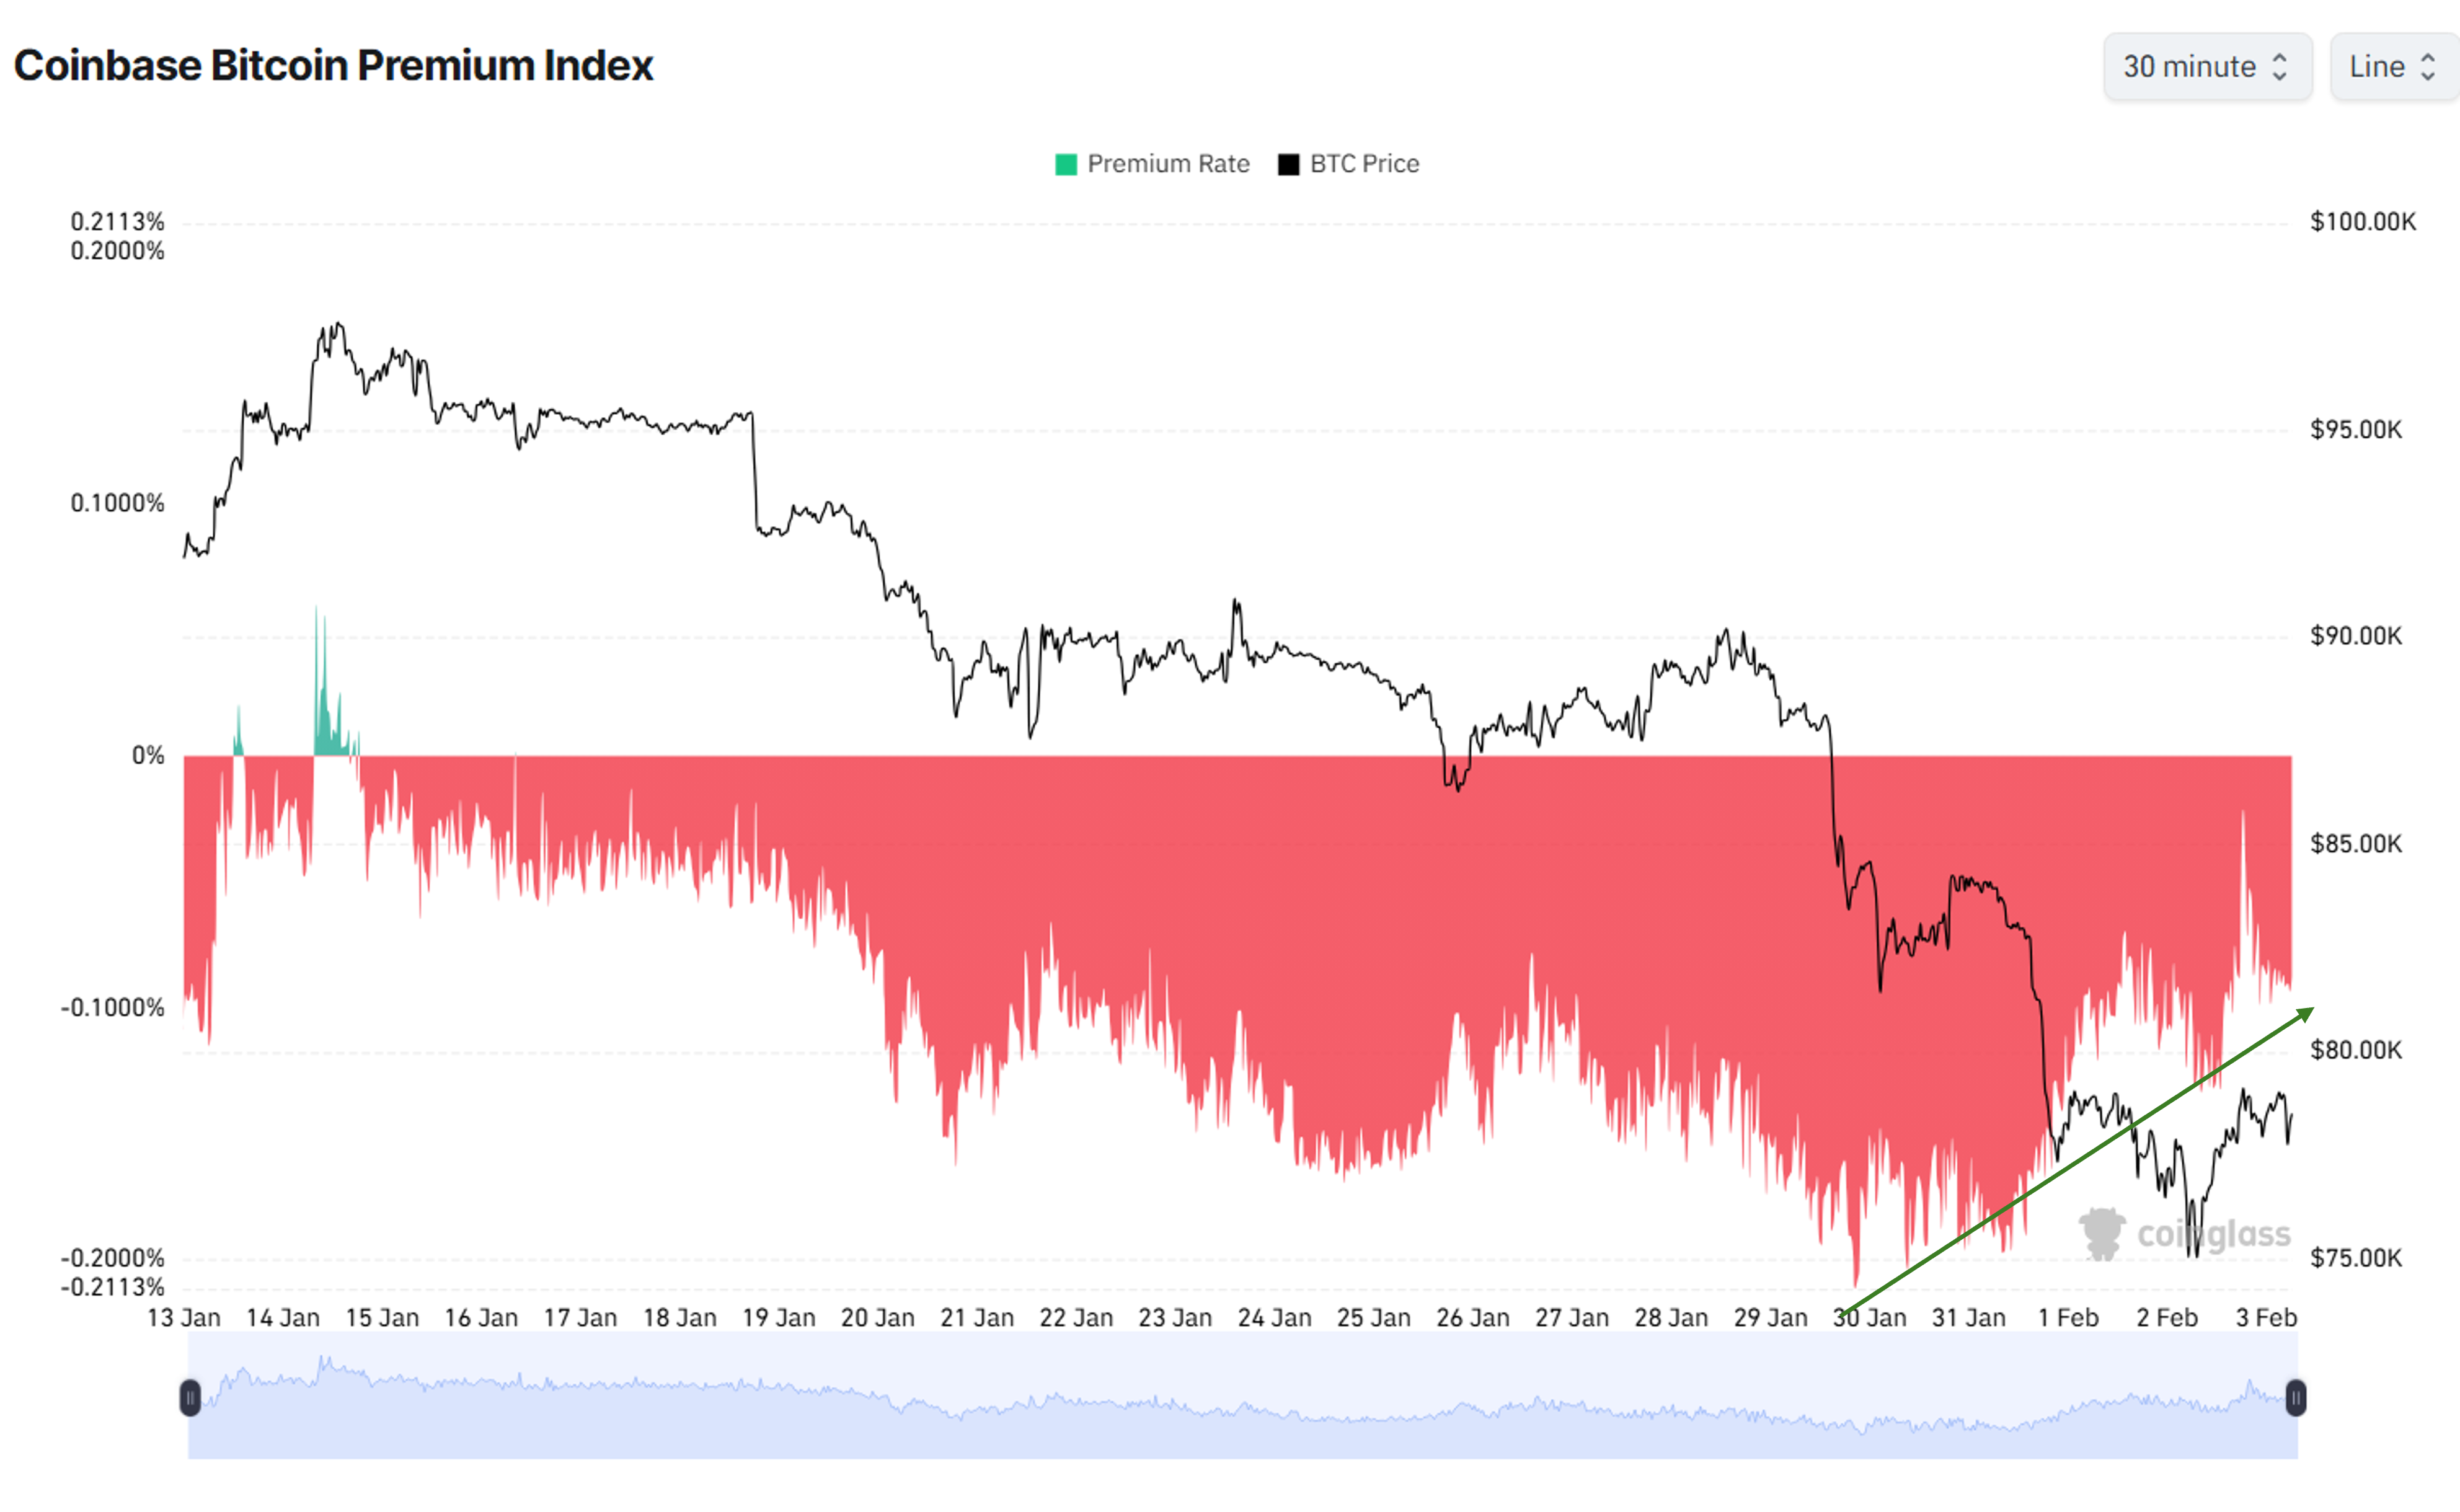
The Coinbase Bitcoin Premium is recovering, even though it remains negative. This is an early signal that buying demand from the United States via Coinbase is slowly returning. Historically, this often points to a reversal once the premium moves from negative to positive.
“Coinbase Bitcoin Premium is recovering. April 2025 lows have been taken. Not calling for a mega rally, but things are looking good for a relief rally,” investor Ted predicted.
Sponsored
Another signal that has been interpreted pessimistically is that Bitcoin is currently trading below the average cost basis of all US Bitcoin ETF funds. CryptoQuant data places this level at around $79,000.
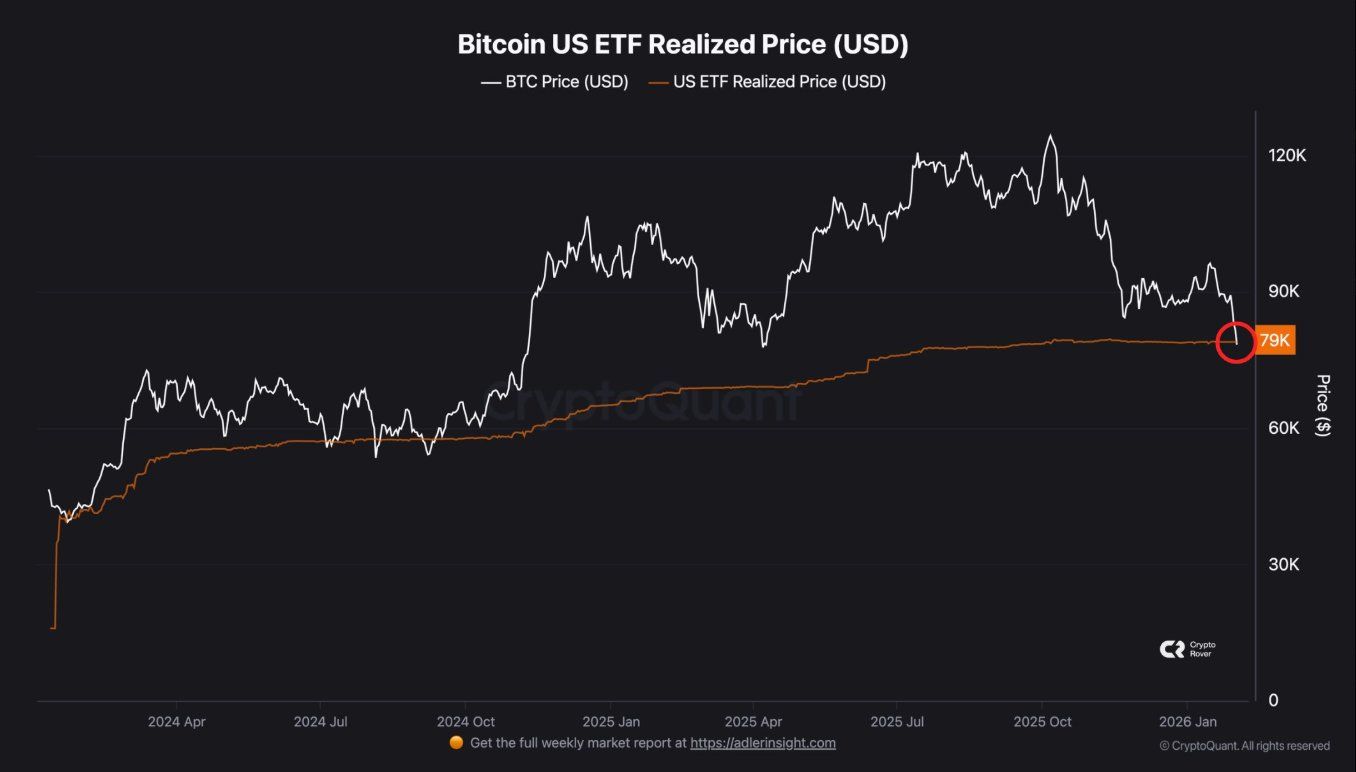
However, historical trends since the approval of US Bitcoin ETFs show that Bitcoin rarely stays below this cost level for long.
History suggests that this zone often acts as demand support before a strong rebound. Institutional investors and long-term holders typically have little incentive to sell at a loss below their cost basis.
Sponsored
The chart shows that during the most bearish phase in Q3 2024, Bitcoin tested this level multiple times. Each time, the price recovered within one to two weeks.
“If you missed the sub-$80k boat, it just came back to pick you up. You’re now buying Bitcoin cheaper than the average price of every US ETF combined. Wall Street is down 10% on their entry, while you’re just getting started. Max pain for them = Max opportunity for you. Don’t overthink the dip,” analyst Whale Factor commented.
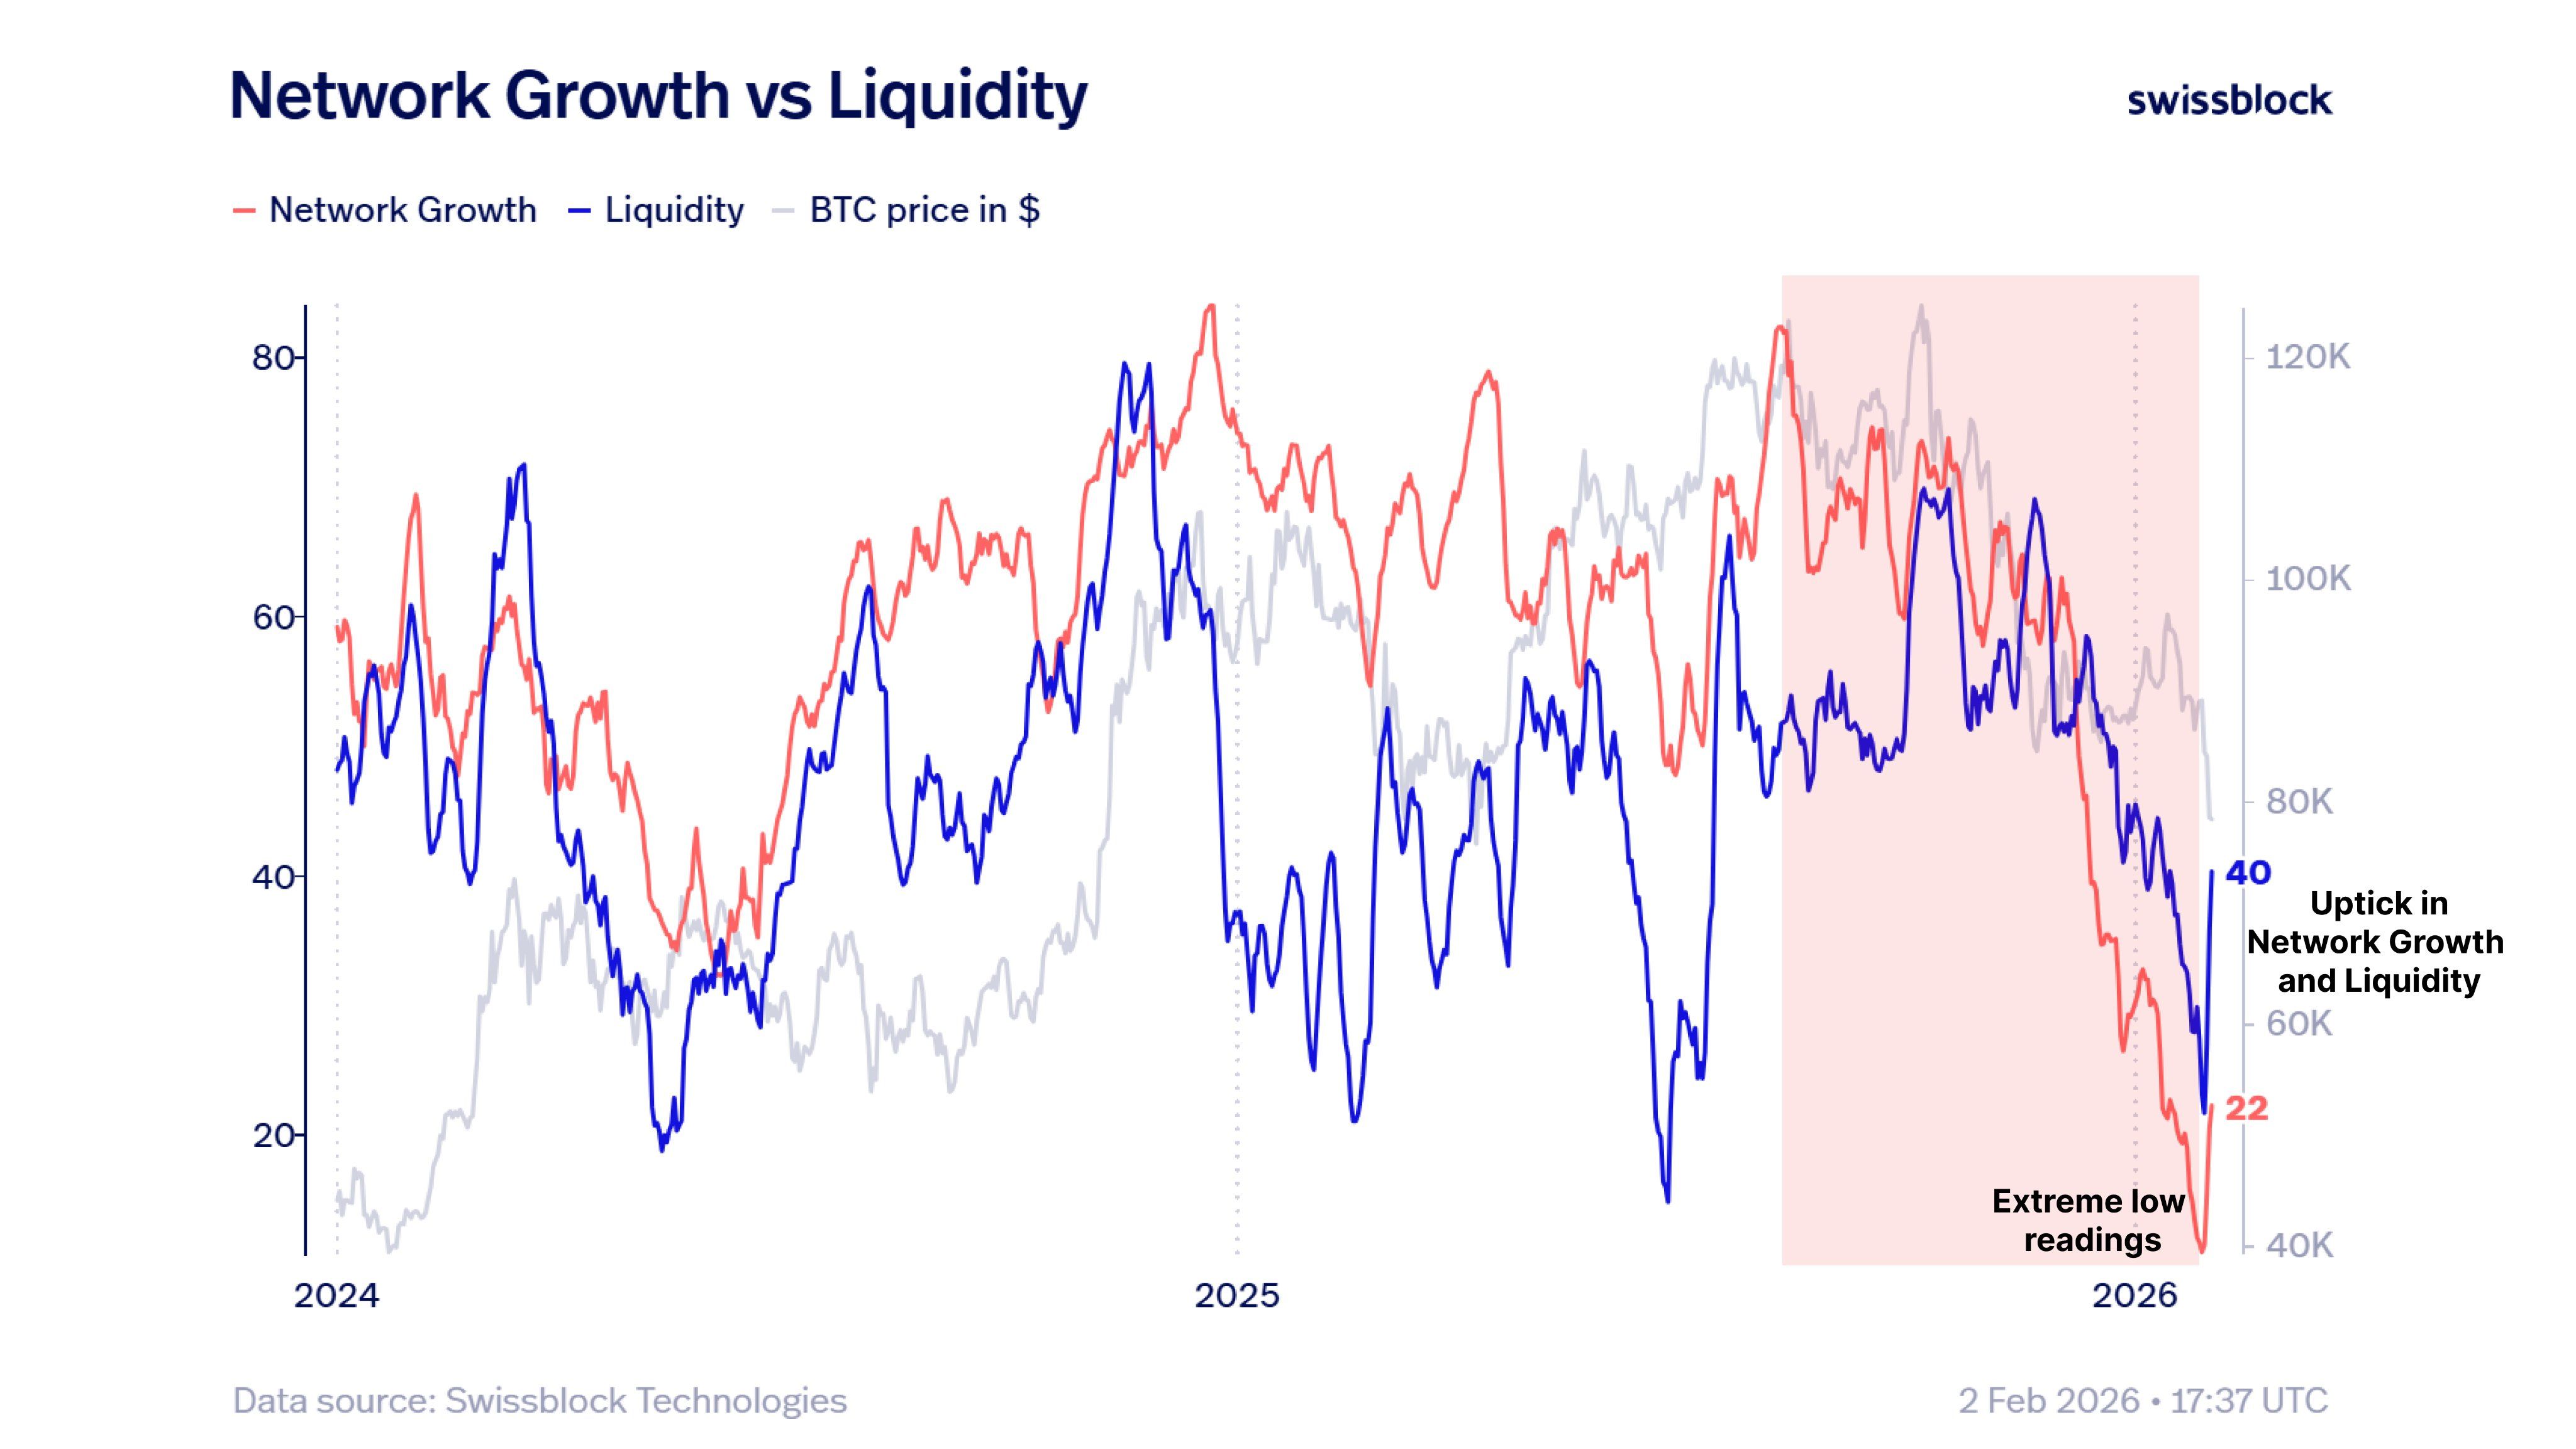
While many analysts continue to highlight negative signals, Swissblock — a Switzerland-based crypto analytics and investment firm — noted a positive convergence between network growth and liquidity that emerged in early February.
Sponsored
Swissblock noted that the last time network growth and liquidity recovered together from low levels was in 2021, just before Bitcoin reached a new all-time high. This suggests that another recovery phase could be approaching.
“Sustained growth in these indicators could be the catalyst for one last push,” Swissblock predicted.
Overall, these signs suggest that Bitcoin may not remain below $80,000 for long and could soon climb back above this level.
However, not all outlooks are optimistic. Alex Thorn, Head of Research at Galaxy Digital, warned that Bitcoin’s recent weakness could persist. The price could even fall further toward the 200-week moving average, near $58,000, in the coming weeks or months. The main drivers include declining liquidity and the lack of positive short-term catalysts.
These differing perspectives provide a broader view of the forces shaping the market. They may also help traders reduce risk while attempting to capture potential opportunities.


Alibaba and China Telecom are moving ahead with a new data centre project in southern China, powered entirely by the e-commerce giant’s in-house AI chips, as Beijing steps up efforts to build domestic computing infrastructure.
Summary
- Alibaba and China Telecom launched a 10,000-chip AI data centre in Guangdong using Zhenwu semiconductors to support large-scale models.
- The project highlights China’s push for domestic AI infrastructure amid U.S. chip restrictions and rising demand for computing power.
- Alibaba plans to expand the cluster to 100,000 chips as adoption grows across sectors like healthcare and manufacturing.
The facility, unveiled on Tuesday, will be equipped with 10,000 of Alibaba’s Zhenwu semiconductors, designed for both AI training and inference. The system is capable of supporting models with hundreds of billions of parameters, placing it among the most advanced computing setups currently in operation.
Deployed at a data centre in Shaoguan, Guangdong province, the cluster is described as a “fully domestic” project and represents the first Zhenwu-powered system of this scale in the Greater Bay Area. Alibaba said the chips can operate as a unified system, enabling the cluster to function like a single supercomputer with ultra-low latency of around four microseconds.
The rollout highlights how China’s leading technology firms are accelerating development of proprietary AI chips and infrastructure as the country pushes for self-reliance in critical technologies.
In recent years, Washington has tightened restrictions on China’s access to advanced semiconductor technologies, including AI chips produced by Nvidia. The curbs have prompted Chinese firms to speed up the development of local alternatives across both hardware and infrastructure.
Alibaba Group Holding has been advancing its chip ambitions through its T-Head semiconductor unit, while continuing to expand its position in cloud computing. The company now operates across the full AI stack, from chip design to data centre construction and model development, with services delivered through its cloud division.
Cloud computing has remained one of Alibaba’s fastest-growing segments in recent quarters, supported by rising demand for AI workloads. Across China, investment in large-scale data centres using domestic technologies has picked up pace.
A similar project went online last month in Shenzhen, where a 10,000-card cluster built on Huawei’s Ascend 910C chips began operations, signalling a coordinated effort among Chinese firms to scale local computing power.
Unlike their U.S. counterparts, companies such as Meta and Microsoft, which are expected to collectively spend hundreds of billions of dollars on AI infrastructure this year, Chinese players have taken a more targeted approach. Investment has focused on sectors expected to generate measurable returns, including industrial applications and enterprise services.
Scaling AI infrastructure for real-world deployment
The Zhenwu-powered cluster adds to growing evidence that China is shifting from experimentation to large-scale deployment of AI systems. Demand for computing power continues to rise as industries integrate AI into production and services.
According to Charlie Zheng, chief economist at Samoyed Cloud Technology Group Holdings, the rollout of domestic clusters signals a transition from “hardware replacement” to “software collaboration” across China’s AI sector.
He noted that adoption has been fastest in government services and urban governance, where requirements around data sovereignty and system security remain particularly strict.
“The sector’s rigid demand for data sovereignty and security has driven the fastest deployment,” Zheng said.
Alibaba stated that the cluster delivers around 30% higher efficiency in training and inference tasks, while single-card throughput has increased nearly tenfold. The system has already been deployed in areas such as healthcare and advanced manufacturing.
Access to the cluster is being extended to small and medium-sized enterprises through China Telecom’s platform, with usage priced on a per-card or hourly basis.
Looking ahead, Alibaba plans to expand the system to 100,000 chips, a move expected to reduce costs further and improve overall resource utilisation as demand for large-scale AI computing continues to build.

TLDR:
- Crypto scams reached a record $11.36B in 2025, marking a 22% rise from the previous year’s total.
- Americans over 60 lost $7.7 billion to cybercrime in 2025, a 37% increase compared to last year.
- AI deepfake and voice cloning scams stole an estimated $893 million from US victims during 2025.
- FBI’s Operation Level Up identified 8,000 victims and blocked over $500 million in further losses.
Crypto scams reached a record $11.36 billion in losses across the United States in 2025. The Federal Bureau of Investigation released its annual Internet Crime Report, confirming a 22% jump from the previous year.
Total cybercrime losses crossed $20.9 billion, also setting a new record high. The FBI logged over one million total complaints, averaging roughly 3,000 reports per day throughout the year.
Investment Scams and Senior Losses Drive Record Numbers
Crypto investment scams alone accounted for $7.2 billion of the total losses recorded in 2025. That figure represents the single largest share of all cryptocurrency-related fraud documented by the FBI. Overall, 181,565 crypto-related complaints were submitted to the agency during the reporting period.
Senior citizens continued to bear a disproportionate share of the financial damage. Americans over the age of 60 lost a combined $7.7 billion to cybercrime, marking a 37% increase year-over-year.
This age group remains the most frequently targeted demographic across all reported online fraud categories. The steep rise in losses among older Americans points to the growing reach of these criminal networks.
AI-powered fraud also emerged as a rapidly growing threat within the report. Deepfake technology and voice cloning tools were used to steal approximately $893 million from victims last year.
These tools give criminals the ability to impersonate trusted individuals using convincing audio and video. The use of such technology adds a new layer of difficulty for victims trying to detect fraud.
The breadth of these numbers reflects how fraud tactics continue to outpace public awareness in the crypto space. As digital asset adoption expands globally, criminal networks are scaling their operations accordingly.
Authorities continue to stress that reporting fraud promptly through IC3.gov remains a critical step in recovery efforts.
Pig Butchering Operations and the FBI’s Countermeasures
Most crypto investment scams traced back to organized crime groups operating out of Southeast Asia. These groups run large-scale schemes commonly referred to as pig butchering operations. Criminals spend weeks or months building genuine-seeming trust with targets before executing the fraud.
Initial contact is typically made through social media platforms, dating apps, and messaging services like Telegram.
Once a relationship is established, victims are directed to fake investment platforms displaying fabricated profits. When those victims eventually attempt to withdraw their funds, the money has already disappeared.
In response, the FBI launched Operation Level Up to directly address these types of investment scams. The operation has already identified more than 8,000 potential victims and prevented over $500 million in further losses.
This approach represents a more proactive stance from the agency in tackling crypto-related crime.
The FBI urges the public to treat all unsolicited investment messages with caution and skepticism. No legitimate platform or trader asks users to send cryptocurrency to an unverified wallet address. Victims and witnesses of suspected fraud are encouraged to file a report directly at IC3.gov.

Bybit blocked coordinated fake deposit attacks across multiple blockchains, saving over $1 billion in potential DOT losses. The exchange confirmed that no user funds were affected, as its monitoring systems identified and neutralized the threats in real time.
Advanced Attacks Target Deposit Systems
Bybit reported that attackers used complex transaction methods to simulate fake deposits. These methods targeted how exchanges track and confirm incoming funds. The attacks were carried out across several blockchain networks.
One method involved batch transactions. Attackers grouped multiple transfers into one operation. A large transfer failed, while smaller ones succeeded. Some systems may treat the full batch as successful.
Another method used multi-step transactions. Attackers changed ownership within the process. This created the appearance of incoming funds. However, there was no real balance increase.
These tactics are designed to trick systems that rely on logs. They do not always reflect actual asset movement. Bybit stated that its systems avoided this issue by verifying real balances.
The exchange confirmed that all attempts were stopped in real time. No incorrect credits were issued. Users were not affected at any stage of the attacks.
Sources: Bybit Debuts Yield Generating Tokenized and Bybit Ramps Up Middle East.
Multi-Layer System Enables Real-Time Detection
Bybit uses a multi-layer validation system to monitor deposits. This system checks transactions at different levels. It ensures that only real asset movements are recorded.
The first stage provides full on-chain visibility. Bybit scans blockchain data across supported networks, including complex and failed transactions.
The second stage filters transactions. It matches them with user deposit addresses. It also tracks related account structures.
The third stage focuses on validation. Each transaction is broken into smaller parts. These parts are verified independently. The system checks execution outcomes and transfer methods.
It also tracks ownership changes. This is important for networks like Solana. Balance checks confirm that assets have truly moved.
The final stage uses anomaly detection. Transactions are analyzed based on structure and risk. Alerts are triggered for unusual patterns.
David Zong, Head of Group Risk Control and Security at Bybit, said, “Our system validates transactions at every level of execution.” He added that each operation is verified independently.
Ongoing Security Measures Across Crypto Platforms
Fake deposit attacks have existed in the crypto industry for years. Earlier cases include the Mt. Gox exploit and the Silk Road bug. These incidents led to large Bitcoin losses.
The recent attacks show how methods have evolved. Attackers now adapt to modern blockchain designs. They use more complex transaction flows.
Bybit stated that its system is built to handle these changes. It focuses on transaction analysis and balance verification. Ownership tracking also plays a key role.
The exchange continues to improve its risk control systems. It aims to detect both known and new attack patterns. Real-time monitoring helps reduce risks across networks.
Bybit said its approach ensures that only valid deposits are credited. This reduces the chance of system manipulation. It also supports safer trading conditions for users.
The incident reflects ongoing efforts to secure crypto platforms. Exchanges continue to upgrade systems as attack methods change.

Zcash price shot up 25% on Wednesday, extending its monthly gains to over 60% as it continues to draw investor interest.
Summary
- Zcash climbed to $330, marking a 25% daily gain and extending its monthly rally to over 60%.
- Shielded pool holdings reached a record $5.18 billion, accounting for over 31% of circulating supply.
- A breakout from a descending triangle and bullish indicators signal potential upside toward $400.
According to data from crypto.news, Zcash (ZEC) price rose to a three-month high of $330 on Wednesday, marking gains of around 62% over the past month.
Zcash price rallied as its shielded pools continue to draw more capital from investors. Data from the Zcash dashboard show that the total amount of ZEC tokens held in shielded pools hit an all-time high of $5.18 billion on April 8. At this point, the figure translates to 31.14% of the total circulating supply.
More ZEC tokens being moved into shielded pools means a larger base of ZEC holders is using the protocol’s core privacy features. This suggests investors are increasingly eyeing Zcash as a privacy sanctuary, especially as jurisdictions around the world tighten their regulatory grip on digital asset surveillance.
The privacy token has also benefited from the broader crypto market recovery fueled by reports of a ceasefire between the U.S. and Iran.
Investors flocked back to the market as Zcash became a standout recovery play, having been one of the primary underperformers leading into April 2026.
On the daily chart, Zcash price has broken out from the upper trendline of a descending triangle pattern that has formed since December 2025. A breakout from such a bearish pattern suggests that bulls have managed to finally reclaim control over the market and are likely steering it into a new bullish phase.
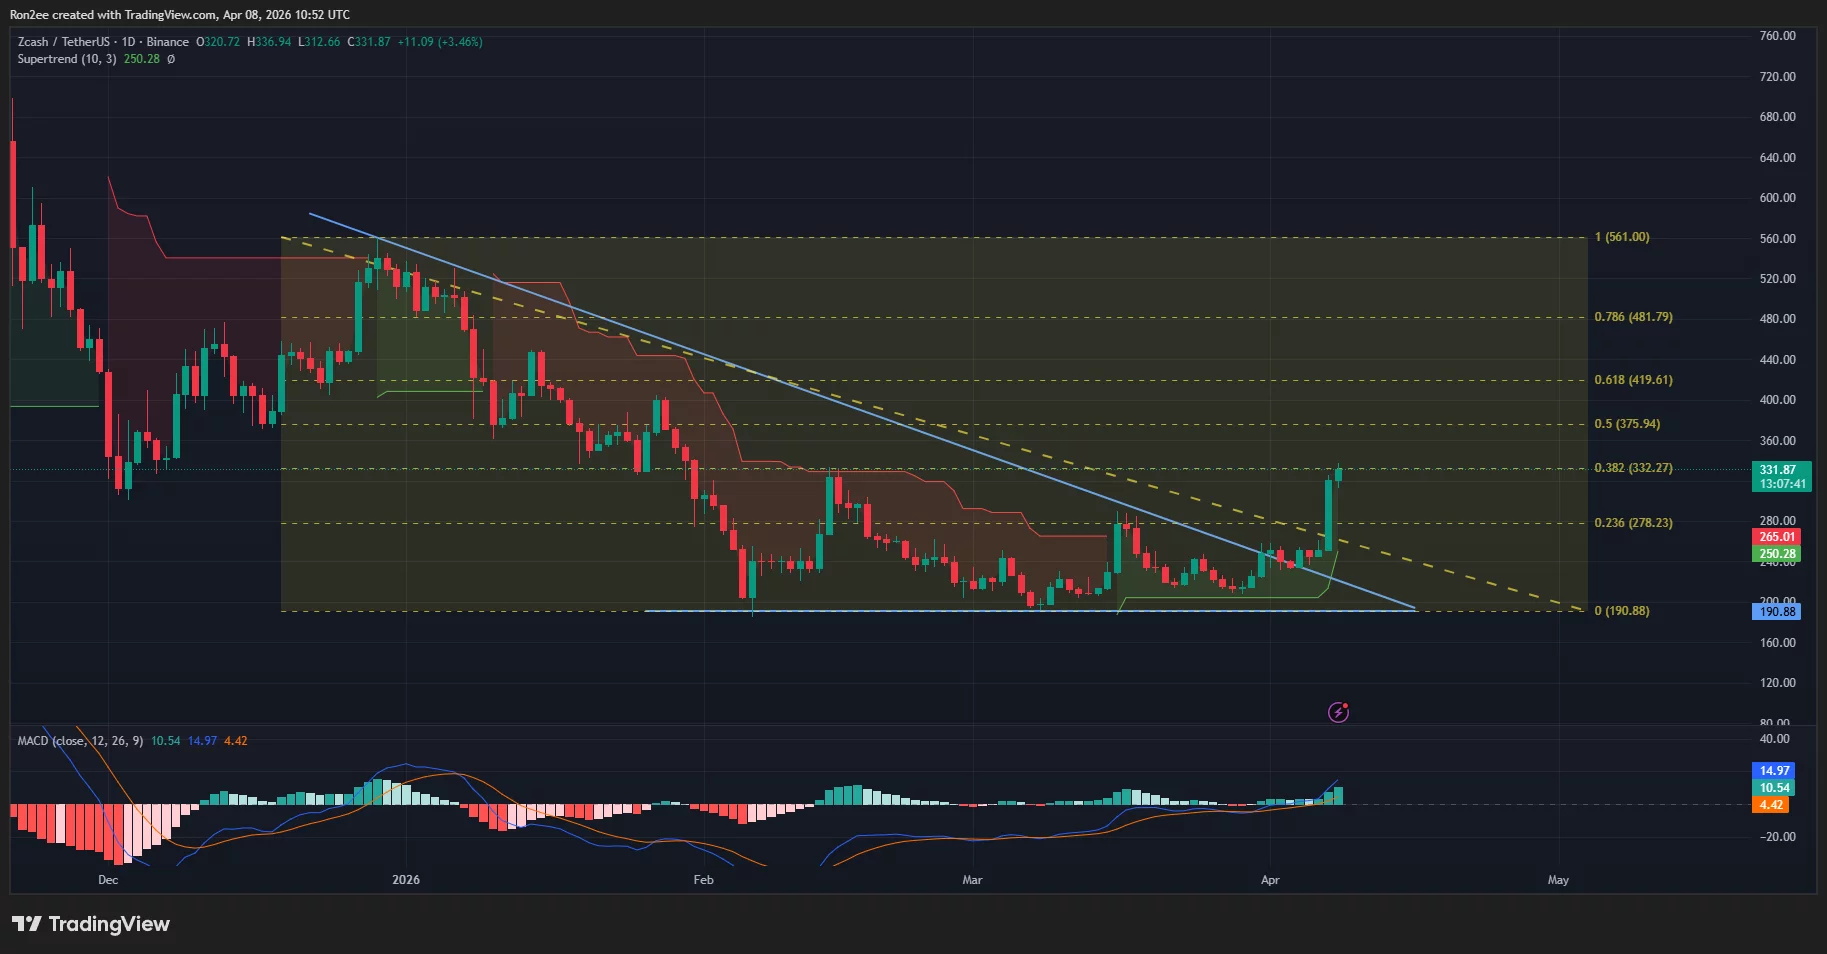
The Supertrend indicator has turned green, a sign that the prevailing trend has shifted in favor of the buyers. Also, the MACD lines have moved past the zero line and are trending upwards, which means buying momentum significantly outweighs the selling pressure. This often occurs as a cooling period before a token’s next leg higher.
At the time of writing, Zcash price was testing the 38.2% Fibonacci retracement level at $332. Above this, the 50% retracement level at $375 lies as the next key resistance level. A breakout from these levels back-to-back could fling ZEC price above the $400 psychological resistance level.
On the contrary, if Zcash price falls below the $278 support level, it could slip back towards the $190 region where it has consolidated in past sessions.
Disclosure: This article does not represent investment advice. The content and materials featured on this page are for educational purposes only.
Retail investors turned into stock sellers in March. Yet, a seasonal pattern and fresh ceasefire developments could shift momentum back toward risk assets in April.
Data cited by Global Markets Investor showed total retail purchases were nearly 50% lower than the record levels seen in January. On a weekly basis, retail inflows fell to $5.0 billion, below the 12-month average of $6.9 billion.
Retail Selling Spreads Across Stock Market Sectors
The pullback was particularly evident in single stocks, where retail investors turned net sellers, offloading roughly $1.6 billion.
Energy stocks bore the brunt of the selling pressure, logging their largest weekly outflows on record. The decline was led by heavyweight names including ExxonMobil, Chevron, and Occidental Petroleum.
Memory stocks also faced sustained selling. Micron and Sandisk emerged as the most offloaded names over the past week. This came amid rising concerns that advances in AI-driven data compression could dampen future demand for memory products.
“Excluding Magnificent 7, mom-and-pop investors were sellers across every sector except Staples, with Tech positioning at its most NEGATIVE level in 6 months,” the post added. “Retail investors are increasingly selling into every bounce.”
Follow us on X to get the latest news as it happens
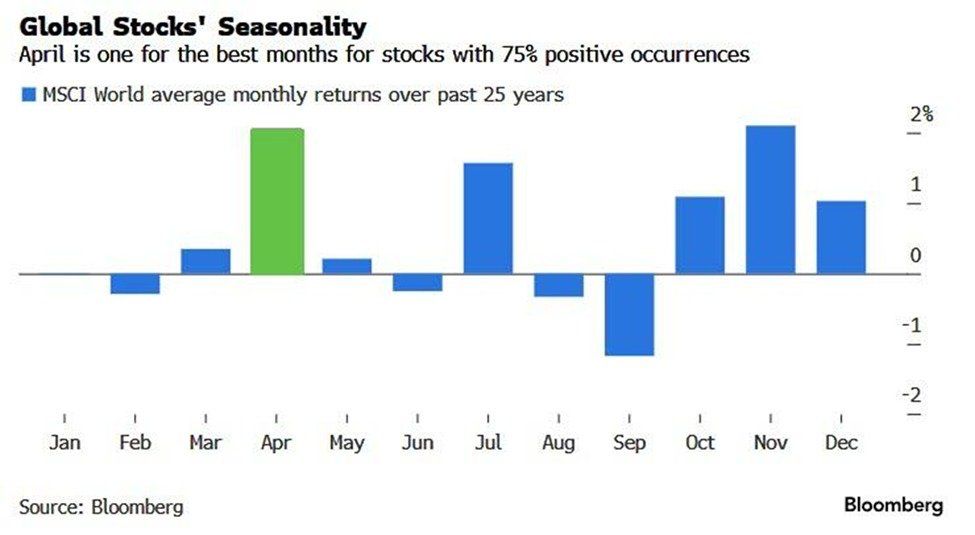
April Seasonality and a Geopolitical Wildcard
Despite the pessimism, history favors a reversal. Over the past 25 years, the MSCI World Index has returned +2.0% on average in April, the strongest month of the year, with positive returns 75% of the time.
“This has been particularly driven by US stocks, which have a ~70% weight in the index. Meanwhile, the S&P 500 has gained +1.3% on average in April since 1928, the 2nd-best month of the year after July. This is also double the overall monthly average return of +0.7%. Seasonality favors the bulls this month,” The Kobeissi Letter highlighted.
A geopolitical catalyst has added further momentum. Fresh ceasefire news is already moving markets. Gold and equities in the US and Asia are rallying, while oil is dropping on de-escalation hopes. Bitcoin (BTC) also rallied past $71,000 today as risk appetite returned on ceasefire reports.
The combination of extreme retail bearishness and strong seasonal tailwinds creates a setup where any sustained de-escalation may trigger a sharp reversal in sentiment heading into Q2.
Subscribe to our YouTube channel to watch leaders and journalists provide expert insights
The post Retail Stock Buying Drops 50% From January Highs as Sellers Take Over appeared first on BeInCrypto.

Bitcoin (BTC) staged a relief rally during Monday’s New York session, climbing to the mid-70,000s as oil prices retreated below $100 per barrel in the wake of a two-week ceasefire between the United States and Iran. BTC briefly touched about $72,760, rebounding from a dip that had stretched across the prior weeks, and traders cautioned that the momentum would need a decisive extension beyond key resistance to confirm a trend change.
Key takeaways:
- BTC surged roughly 7% to around $72,700 after news of a two-week U.S.–Iran ceasefire, signaling a temporary easing of geopolitical risk appetite.
- In the last 24 hours, roughly $431 million in short positions were liquidated across the crypto market, with BTC shorts accounting for about $214.8 million.
- Analysts warn that a sustained move higher requires a break above the $72,000–$76,000 zone; failure to clear that region could see risk-off pressure resume.
- Oil volatility accompanied the move, with WTI retreating from intraday highs around $110–$118 to the mid-$90s as the ceasefire news circulated.
Bitcoin’s rebound amid ceasefire signals
Data from market tracking and live feeds show BTC rising as much as 7.4% to approximately $72,760, erasing earlier losses that had persisted over the previous two weeks. The rebound followed President Donald Trump’s confirmation of a two-week pause in hostilities with Iran, a ceasefire conditionally linked to the “complete, immediate, and safe opening” of the Strait of Hormuz. Traders noted that geopolitics can move crypto markets swiftly, sometimes eclipsing traditional technical signals in the near term.
Despite the bounce, observers emphasized that the immediate macro backdrop remains delicate. The ceasefire is contingent on ongoing diplomacy, and any regression or stalled talks could reintroduce risk premia into crypto markets. Analyst commentary cited in market updates suggested that while the relief rally is meaningful, it does not guarantee a long-term trend reversal without sustained catalysts and a breach of key price levels.
Liquidity backdrop and macro drivers
Liquidation data painted a mixed picture of risk dynamics. In the past 24 hours, total liquidations across the crypto market reached about $431 million, with BTC short liquidations contributing roughly half of that sum at around $214.8 million. The broader market’s tilt toward short-covering helped buoy prices in the near term but did little to alter the underlying multi-week consolidation already underway.
The price move came as crude oil swung violently on the ceasefire news. Oil futures initially spiked above the $110–$118 per barrel range in response to regional tensions, but then reversed sharply, dropping as much as 16% to around $92 from an intraday high. WTI crude traded around the mid-$90s during the session, illustrating how commodity markets still interact with crypto as a proxy for macro risk sentiment.
Technical view: range, resistance, and what to watch
From a technical standpoint, the current setup remains fragile for bulls, according to market observers. A number of traders highlighted a potential bearish flag pattern on the daily chart, suggesting that upside momentum could be capped unless BTC clears the upper boundary of the immediate resistance zone. In practice, the line in the sand sits near $76,000; a decisive close above that level could reintroduce bullish momentum toward higher targets. Conversely, rejection at or near the upper boundary could invite renewed downside pressure toward the next significant support areas.
Analysts emphasized that the real test lies in the follow-through. One trader noted that even with the relief rally, “the bear-flag scenario remains a live risk until sustained footing is established above the key resistance.” Another market observer pointed out that a successful upside extension beyond $76,000 could open a path toward the high-$80,000s or low-$90,000s, while a rejection from that zone could pave the way for a renewed move toward the $60,000s region if macro catalysts turn unfavorable.
The ongoing narrative also points to a broader market context. As Cointelegraph coverage has indicated, BTC has shown a tendency to oscillate between fear and relief around pivotal macro events, with on-chain signals and liquidity dynamics feeding into the price action. The coming weeks, including key data prints and policy signals, will likely determine whether the current rebound stalls in a choppy range or evolves into a more durable uptrend.
What readers should watch next
Investors should keep an eye on several developing factors. First, the durability of the ceasefire and any tangible diplomatic progress during upcoming talks will be a clear influencer of risk appetite. Second, macro catalysts—such as the release of Fed minutes and upcoming consumer price index data—could reintroduce volatility and test the resilience of BTC’s rebound. Finally, watch for price action around the $72,000–$76,000 zone: a clear, sustained break above that band would be a meaningful sign for bulls, while a rejection could invite renewed downside pressure toward established long-term support levels.
In the near term, traders appear divided on whether the relief rally can be converted into a longer-lasting trend. The unanswered question remains: will geopolitical news continue to shape crypto markets with the same immediacy, or will domestic macro triggers begin to dominate price action as the week progresses?


South Korea’s financial regulators have ordered all domestic crypto exchanges to adopt a single, strict system for delaying withdrawals, aiming to block a surge in voice phishing scams that rely on speed.
The Financial Services Commission and Financial Supervisory Service announced the new rules, removing the discretion exchanges once had to let users bypass holding periods, local news outlets report.
In the past, platforms set their own exceptions to keep trading fast. Fraud groups learned those rules and coached victims to slip through them.
Voice phishing scams often push victims to convert cash into crypto and send it out within minutes. A delay, even a short one, can interrupt the scam by giving victims time to reconsider or allow alerts to surface before funds leave an account.
Under the new system, exchanges must apply the same criteria when reviewing withdrawal exceptions. These include account history, transaction patterns and sudden changes in behavior. Officials expect fewer than 1% of users will qualify for instant withdrawals. Platforms must also tighten identity checks and monitor fund flows more closely.
The move marks a shift from industry-led safeguards to a national standard.
In other markets such as the U.S. and Europe, withdrawal holds are common but set by individual firms. Some exchanges even let users set their own timelocks to prevent unwanted withdrawals.
The South Korean regulators did not immediately respond to CoinDesk’s request for further comment.
Crypto World
Alibaba (BABA) Shares Surge Nearly 8% Following Major AI Data Center Unveiling in China

Key Highlights
- Alibaba partnered with China Telecom to unveil a 10,000-chip AI computing facility in Shaoguan, Guangdong, utilizing Alibaba’s proprietary Zhenwu processor technology.
- This facility represents the first large-scale deployment of Zhenwu chips in China’s Greater Bay Area, capable of handling AI model training with parameters reaching hundreds of billions.
- Performance metrics show 30% improved training and inference efficiency, with individual card throughput jumping nearly tenfold compared to earlier technology.
- Expansion plans call for scaling the facility to 100,000 chips, while smaller enterprises can access computing resources through China Telecom’s service platform.
- This deployment comes after a comparable 10,000-chip Huawei Ascend 910C facility began operations in Shenzhen the previous month.
Alibaba (BABA) and China Telecom have unveiled a massive AI computing facility featuring 10,000 chips in Shaoguan, located in Guangdong province. The infrastructure relies exclusively on Alibaba’s proprietary Zhenwu AI processors, which were engineered by the company’s T-Head semiconductor division.
Alibaba Group Holding Limited, BABA
This unveiling represents a milestone as the largest Zhenwu chip deployment to date within the Greater Bay Area region. According to Alibaba Cloud, this initiative signals a transition in China’s AI computing landscape “from achieving high-end performance milestones to widespread industrial adoption.”
The facility employs an advanced high-performance networking framework that enables all 10,000 processors to function as a unified supercomputing system. Alibaba reports this configuration achieves 30% greater training and inference efficiency, while individual card throughput shows nearly a tenfold improvement over previous-generation systems.
The infrastructure supports training for AI models containing hundreds of billions of parameters — positioning it alongside the most sophisticated AI development projects worldwide.
The system maintains a latency level of 4 microseconds, which Alibaba credits to the sophisticated networking framework connecting the processors. This metric is critical for enterprise AI applications where rapid response times are essential.
Beijing’s Drive Toward Indigenous AI Computing Infrastructure
This launch aligns with a comprehensive national initiative. Beijing incorporated intelligent computing infrastructure into its 15th five-year strategic plan last month, while an AI action blueprint from the State Council issued in August emphasized optimized expansion of computing capabilities nationwide.
By the conclusion of June last year, China’s aggregate computing capacity reached 962,000 petaflops — representing 21% of global capacity, marking a 73% year-over-year increase, based on data from the China Academy of Information and Communications Technology.
The Shaoguan facility has already been implemented in healthcare and advanced manufacturing applications. Small and medium-sized enterprises can obtain computing access via China Telecom’s platform, with flexible pricing options based on card usage or hourly rates.
Alibaba has also revealed intentions to expand the facility from 10,000 to 100,000 chips. This expansion strategy targets cost reduction and enhanced resource utilization.
Industry Context: Huawei and China’s Semiconductor Competition
This announcement follows a comparable achievement from the previous month, when China’s inaugural 10,000-card intelligent computing facility — utilizing Huawei’s Ascend 910C processors — commenced operations in Shenzhen.
That facility delivers 11,000 petaflops of computing power and has been integrated with another 3,000-petaflop facility activated in 2024. Shanghai is simultaneously developing a 10,000-card facility through an INESA state-owned subsidiary, designed for compatibility with various domestic processor architectures.
While Chinese processors continue to lag behind Nvidia in individual performance metrics, Beijing’s approach emphasizes large-scale cluster infrastructure and optimized networking to narrow the performance differential.
U.S. export controls on Nvidia processors have expedited China’s domestic semiconductor development trajectory. Alibaba’s T-Head division has played a pivotal role in this effort, alongside Huawei.
BABA shares advanced 7.79% on the announcement day, with after-hours trading adding another 0.82% to its Hong Kong-listed shares (728-HK).

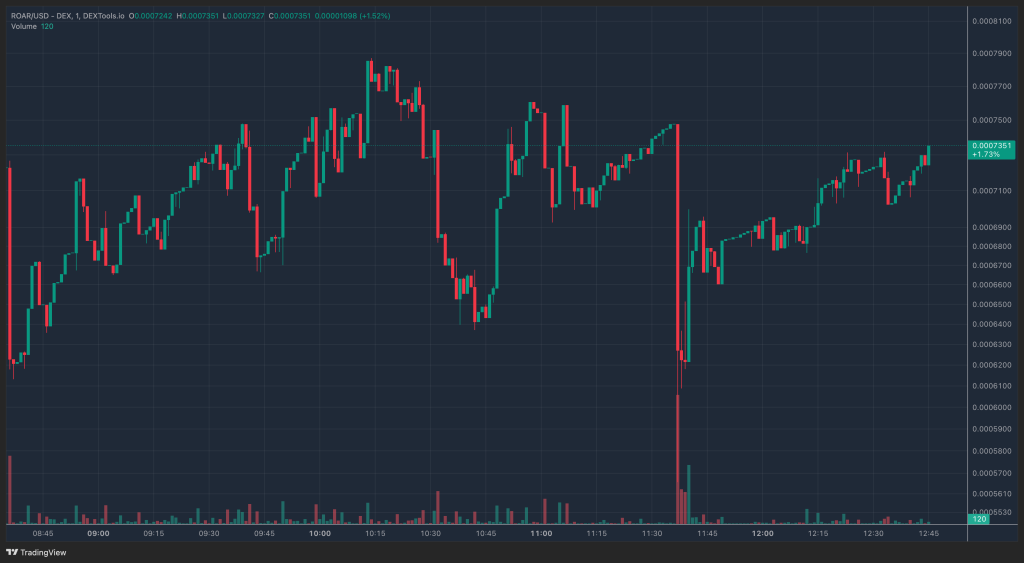
The Russian Oil Asset Reserve, known by its ticker symbol ROAR crypto, is a new meme coin token launched on the Solana blockchain in early April 2026.
It operates as a narrative-driven meme coin rather than a traditional financial instrument, with its primary appeal rooted in geopolitical storytelling around Russian energy dominance.
Marketed as a “sovereign energy protocol,” ROAR positions itself at the intersection of cryptocurrency and global oil markets, using dramatic imagery of Siberian crude reserves, pipelines, OPEC influence, and a rising Eastern alliance to attract traders seeking the next big hype cycle.
The token trades primarily on decentralized exchanges such as Meteora and other Solana-based platforms, has a fixed supply of roughly 1 billion tokens, and has no major centralized exchange listings.
At first glance, it seems harmless. But there is much to uncover about why to stay away from this coin.
What is Russian Oil Asset Reserve (ROAR Crypto)?
ROAR’s promoters paint an enticing picture. Official-looking websites describe the token as “backed by real Siberian energy in the new world order,” claiming that each unit is “conceptually pegged” to verified Siberian crude reserves and that holders gain “direct exposure to the most powerful commodity on Earth.”
Social media campaigns and influencer videos have amplified this narrative, sometimes falsely suggesting that Russian leadership or state entities are behind the project, complete with AI-generated clips purporting to show high-level endorsements.

However, these claims collapse under scrutiny. ROAR is not backed by any physical oil reserves, nor is it redeemable for barrels of Siberian crude or any other tangible commodity.
There is no legal mechanism, escrow, or audited collateral tying the token’s value to actual energy assets; the “conceptual peg” is purely marketing language with zero enforceable backing.
Independent analyses, including one of the project’s own secondary websites, explicitly state that it is a “speculative digital asset on the Solana blockchain” and “not backed by physical oil reserves or any government entity.”
Who Is Behind ROAR Crypto?
This is the exact same campaign and method that was used for previous tokens like United States RX, Golden Dome, and US Oil Reserve crypto.
All these tokens claimed to be backed by officials, but all turned out to be scams and went to zero later. This is probably the same or multiple teams following the same playbook.
They create a token, pay promoters across Instagram, TikTok, and other social platforms to push short videos and reels, and that is likely how you ended up hearing about it.
ROAR crypto is almost certainly a rug-pull scam or, at best, a low-effort meme coin riding on political sentiment, and you probably should stay away. Be aware and always DYOR.
Oil Prices Drop Amid Iran Ceasefire, Bitcoin Gains: Is New Layer 2 Bitcoin’s ROAR Crypto?
Here’s the honest tension with ROAR crypto at current levels: the upside to fair value is roughly 15–35% from here, maybe a rug pull. That’s a solid return, but it’s a very different risk profile than catching an asset at its earliest stage. Traders who rode HYPE from its lows have already captured the outsized gains.
That dynamic is exactly what’s drawing attention to Bitcoin Hyper, a presale project positioning itself as the first-ever Bitcoin Layer 2 with SVM integration, bringing Solana Virtual Machine speed and smart contract capabilities directly to the Bitcoin ecosystem without sacrificing Bitcoin’s security. The pitch for Hyper crypto is infrastructure-level: breaking Bitcoin’s three core limitations of slow transactions, high fees, and limited programmability, all at once.
The numbers are already moving. Bitcoin Hyper has raised more than $32M at a current presale price of $0.0136782, with staking rewards available to early participants. Features include sub-second transaction finality, a Decentralized Canonical Bridge for seamless BTC transfers, and low-cost smart contract execution. Recent coverage has flagged the project as one gaining traction alongside the ROAR crypto narrative.
Visit the Bitcoin Hyper Presale Website Here.
The post What Is Russian Oil Asset Reserve? Is ROAR Crypto The Next Big Thing Or Scam? appeared first on Cryptonews.


- Solana price has gained in the past 24 hours as Bitcoin retests $72,000.
- The SOL token could rally to $150 amid the US-Iran ceasefire.
- However, continued weakness could allow bears to target $70 or lower.
Solana’s latest rebound has revived bullish speculation, with decent gains aligning with an uptick for risk asset markets.
As traders digest the impact of easing geopolitical tensions amid the ceasefire between the US and Iran, the key question is whether a shift in sentiment could propel Solana to its year-to-date highs of $150.
Solana eyes $90 as geopolitical risk cools
As noted, the broader cryptocurrency market pushed higher overnight Tuesday after US President Donald Trump announced a two‑week ceasefire deal with Iran.
The news has eased fears of a deeper regional conflict, with the Pakistan‑brokered talks coming ahead of a 48‑hour deadline set by Washington.
Stocks and cryptocurrencies rose as risk sentiment changed from defensive positioning to an aggressive hunt for upside exposure.
The sharp gains saw more than $425 million in short positions liquidated in the past 24 hours, with over $100 billion added to the global crypto market capitalization.
Bitcoin edged above the $72,000 mark, and Ethereum climbed to $2,270, boosting altcoins as traders rotated capital back into major tokens and high‑beta plays. Solana’s upswing had SOL advancing to above $86.
The move toward $90 erases part of last week’s drawdown that followed the Drift Protocol exploit.
SOL price analysis
While SOL’s percentage gains pale in comparison to intraday moves of Zcash, Bittensor, and LayerZero, the uptick was still significant from a market‑structure point of view.
The recovery helped re‑establish a higher trading range, suggesting that the worst of the exploit‑driven capitulation may be over if the ceasefire holds and broader crypto inflows continue.
On the charts, SOL has recently been shadowed by a developing bear flag formation.
The classic chart pattern usually signals downside continuation if a clean break occurs, and its formation had bears threatening a drop back toward the $70 region.

The bounce to near $90 is crucial even as the bearish structure remains.
If bulls can consistently defend the $80-$85 band and convert the area into a solid demand zone, the next immediate resistance is likely to emerge around $95-$100.
This is where prior supply and key moving averages converge, and a breakout could pave the way for a higher resistance cluster in the $120-$135 zone.
Bulls can target January 2026 highs near $150.
However, if buyers fail to break and hold above the $90 level, the technical backdrop would increasingly favor an extension of the downtrend.
This outlook exposes SOL to renewed downside pressure toward $70, with critical support near $54.

How Aleksandr Loginov Is Redefining Design in the Age of AI

Alibaba launches 10,000-card AI cluster as China ramps up tech push

Wuthering Heights’ Emerald Fennell Denies Basic Instinct Reboot Rumours


![*SOLO* GTA ONLINE CAR DUPE MONEY GLITCH! [XBOX/PS/PC]](https://wordupnews.com/wp-content/uploads/2026/04/1775646733_hqdefault-80x80.jpg)

-

 NewsBeat6 days ago
Steven Gerrard disagrees with Gary Neville over ‘shock’ Chelsea and Arsenal claim | Football
-

 Business5 days ago
No Jackpot Winner and $194 Million Prize Rolls Over
-

 Fashion5 days ago
Weekend Open Thread: Spanx – Corporette.com
-

 Crypto World7 days ago
Gold Price Prediction: Worst Month in 17 Years fo Save Haven Rock
-

 Business2 days ago
Three Gulf funds agree to back Paramount’s $81 billion takeover of Warner, WSJ reports
-

 Sports4 days ago
India men’s 4x400m and mixed 4x100m relay teams register big progress | Other Sports News
-

 Business4 days ago
Expert Picks for Every Need
-

 Business6 days ago
Login and Checkout Issues Spark Merchant Frustration
-

 Tech14 hours ago
How Long Can You Drive With Expired Registration? What Florida Law Says
-
Business3 days ago
No Jackpot Winner, Prize to Climb to $231 Million
-

 Tech6 days ago
Commonwealth Fusion Systems leans on magnets for near-term revenue
-

 Crypto World7 days ago
Ripple rolls out enterprise crypto treasury platform for corporates
-

 Fashion2 days ago
Massimo Dutti Offers Inspiration for Your Summer Mood Board
-

 Tech7 days ago
Drawing Tablet Controls Laser In Real-Time
-

 Crypto World7 days ago
Why It’s Partnering, Not Issuing
-
Politics5 days ago
Wings Over Scotland | The quality of mercy
-
 Sports7 days ago
Steal Gary Woodland’s subtle power move for longer drives
-
 Tech7 days ago
Battery Tester Outperforms Cheaper Options
-

 Business3 days ago
Akebia Therapeutics, Inc. (AKBA) Discusses Pipeline Progress and Strategic Focus on Kidney Disease Treatments at R&D Day – Slideshow
-

 Sports7 days ago
Mohsin Naqvi-Led Pakistan Cricket Board Blasted By Younis Khan After 20 Million Rupees Fine On Naseem Shah
You must be logged in to post a comment Login