
Crypto World
32K BTC Leaves Exchanges in One Day

Bitcoin (CRYPTO: BTC) on-chain indicators are again drawing scrutiny as market watchers weigh the possibility of renewed accumulation. On Wednesday, exchange withdrawals surged to roughly 32,000 BTC, amounting to about $2.26 billion at prevailing prices, according to CryptoQuant data. For the week, total outflows approached 47,700 BTC — a top-tier figure over the past 12 months — with Bitfinex accounting for a sizable share, marking its largest daily outflow since June 2025. Analysts note that stablecoin flows moving into exchange wallets alongside BTC exiting venues fit a familiar pattern associated with dip-buying and repositioning into custody. While not a guarantee, the on-chain signals sketch a scenario in which institutions or large players are quietly accumulating.
Key takeaways
- Wednesday’s BTC withdrawals neared 32,000 coins, translating to roughly $2.26 billion, signaling potential large-scale buying pressure.
- Bitfinex recorded the largest daily BTC outflow since June 2025, estimated around 25,000 BTC.
- For the week through Friday, exchange netflows were negative on each trading day, totaling about 47,700 BTC, a setup some analysts consider bullish if the trend persists.
- Stablecoin activity moving to exchange wallets while BTC leaves suggests buyers are funding new positions rather than selling into the sell-side pressure.
- If netflows stay negative for another 3–5 days with no major re-entries to exchanges, the signal could qualify as “sustained accumulation,” though confirmation requires continued data.
Tickers mentioned: $BTC
Market context: The ongoing on-chain dynamics arrive amid a liquidity backdrop where traders watch risk sentiment and macro factors that influence crypto flows. Historically, sizable negative netflows indicate a reduction in immediate selling pressure on the spot market, which can support price stability or upside pressure when buyers resume activity. In this instance, the combination of large outflows and corresponding stablecoin inflows to exchanges aligns with a careful buildup rather than a rush to exit positions, underscoring how on-chain signals can precede a price response in a market sensitive to custody movements and liquidity shifts.
Why it matters
The significance of the latest data lies in the potential shift in supply dynamics. When coins depart exchanges and move toward cold storage or custodial wallets, the immediate availability of BTC for sale on spot markets contracts, which can ease selling pressure and tilt the balance toward upward price discovery if demand re-emerges. Analysts emphasize that sustained negative netflow — where more BTC leaves exchanges than re-enters — has historically coincided with periods of constructive price action, especially when accompanied by continued liquidity withdrawal from active venues.
The discussion around the anomalous 32,000 BTC outflow centers on its typical interpretation: moves associated with large spot purchases, followed by transfers to cold custody. Adler’s analysis notes that while a portion of spikes might reflect internal custody movements, the broader pattern often signals accumulation at the current price ranges. In early March 2026, a sizable liquidity inflow to exchanges — about $1.1 billion — preceded a shift in netflow dynamic, after which the net outflow eased but remained negative. The takeaway for market participants is that these sequences are not standalone events; they form part of a broader on-chain narrative about how big players manage risk, positioning, and custody as price cycles unfold.
For traders and institutions, the takeaway is to monitor whether the negative netflow persists. If the trend holds for several days, the market could be reading an elongated phase of demand absorption. Yet, even with a bullish tilt suggested by on-chain flows, price action remains contingent on broader macro cues, risk appetite, and the pace at which new buyers step in to support levels around key price anchors like $70,000. The data points themselves are descriptive — they don’t guarantee a rally — but they do illuminate where selling pressure is thinning and where buyers might be accumulating in anticipation of a future price move.
What to watch next
- Watch the next 3–5 days of net BTC exchange flows to confirm whether the negative trend persists without a substantial re-entry to exchanges.
- Monitor large transfers to cold storage or custodial services that could corroborate the hypothesis of accumulation.
- Track BTC price behavior near the $70,000 level and observe whether on-chain demand translates into sustained price support.
- Maintain awareness of additional data from CryptoQuant and CoinGlass for corroborating trends in exchange balances and netflow momentum.
Sources & verification
- CryptoQuant data on exchange netflow totals and the 32,000 BTC outflow observed on Wednesday.
- CoinGlass data confirming Bitfinex’s outflow magnitude and the weekly netflow pattern.
- Axel Adler Jr.’s analysis linking the spike to potential large spot purchases and custody movements.
- Related charts and analytical notes referenced in the article, including the linked external analysis pages.
On-chain signals point to a large BTC accumulation as exchange outflows spike
Bitcoin (CRYPTO: BTC) on-chain signals are again in focus as a wave of exchange withdrawals adds a layer of intrigue to market positioning. The data trail points to a notable transfer dynamic: a substantial portion of BTC was moved off exec-friendly venues on a single day, with Bitfinex at the center of the action. The near-32,000 BTC outflow on Wednesday stands out even within a week of elevated activity, and it coincides with stablecoin flows that move in step with the BTC exodus. Taken together, the indicators align with a familiar playbook in which buyers signal their intent by removing coins from exchanges and placing them in custody, potentially positioning for a liquidity-constrained move higher.
The analysis cites two pivotal observations: first, the single-day outflow magnitude around 32,000 BTC, and second, the week’s cumulative outflows near 47,700 BTC — figures that mark a notable milestone in the last year’s on-chain activity. The heavy involvement of Bitfinex, recorded as the exchange with the most pronounced outflow on the day, underscores the role of large venues as conduits for significant repositioning. In early March 2026, a separate liquidity event — a green bar representing roughly $1.1 billion in inflows to exchanges — was followed by a shift in netflow readings, moving to a negative but less extreme level as market participants reassessed risk and liquidity posture. The sequence implies a potential end-to-end cycle: exchanges see inflows or outflows, funds move to custody, and then the market adjusts to a thinner spot supply.
Analysts emphasize a key caveat: the observed spike is an anomalous one-day signal that warrants confirmation over several days of data. As Adler notes, the association between such spikes and large transfers to cold storage is common, but not universal. The larger question is whether the ongoing pattern of negative netflows can endure long enough to qualify as sustained accumulation. If the netflow remains negative for three to five more days without a surge of coins returning to exchanges, market observers will treat the trend as a reinforcing bullish signal — one that suggests demand is outweighing selling pressure at a time when liquidity dynamics are being recalibrated by custodial movements and macro sentiment.
On the price front, the narrative remains tethered to a price environment around $70,000, where buyers historically have shown resilience during episodes of improved on-chain conviction. While the data points do not guarantee an immediate uplift, they contribute to a broader chorus of signals that influence risk appetite and liquidity provisioning across spot markets. For investors, the takeaway is not certainty but a nuanced view: on-chain behavior is supporting a case for cautious optimism, contingent on continued outflows and the absence of a rapid re-entry of coins to exchanges.
For readers following the story closely, the implication is clear: the market is watching on-chain signals as a proxy for demand and supply. The presence of large outflows from exchanges, together with stablecoin inflows into exchange wallets, underscores a demand-side readiness among buyers who may be quietly building positions in anticipation of a future price move. The ongoing conversation around custody, liquidity, and risk sentiment will likely be amplified as data from CryptoQuant and CoinGlass continue to illuminate how these patterns evolve in the days ahead. The eventual confirmation or refutation of sustained accumulation will hinge on the persistence of negative netflows and the absence of renewed exchange-based selling pressure.

Key takeaways:
-
Bearish sentiment is rising as Bitcoin options professional traders lose confidence that the $66,000 level will hold for long.
-
The exit of David Sacks as the Crypto and AI czar and a lack of a clear US Strategic Bitcoin Reserve plan added to investors’ doubts.
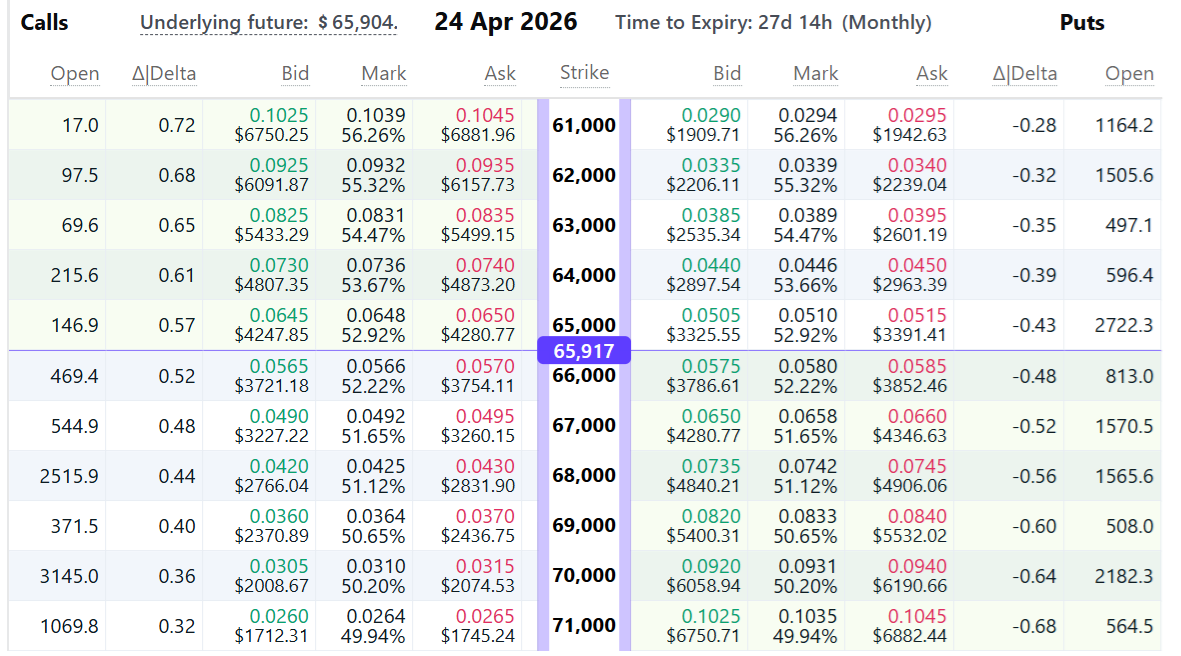
Bitcoin (BTC) fell to $65,530 on Friday, an 8% decline from the $71,300 level seen on Thursday. This move wiped out over $210 million in leveraged bullish Bitcoin futures and left most call (buy) options worthless during the $18.6 billion monthly expiry. Traders now anticipate a 53% chance that Bitcoin will stay below $66,000 by April 24.

On Friday, the April 24 Bitcoin $66,000 put (sell) options traded at 0.0566 BTC or roughly $3,730. With a 53% implied probability of Bitcoin trading below $66,000 by late April, the mood remains decidedly bearish following the increased uncertainty in the US and Israel-Iran war, pushing traders into a risk-averse mode.
US inflation threats and stalling crypto, Bitcoin legislation
Rising oil prices and a potential $200 billion in extra US military spending led investors to demand higher returns on government bonds and dragged the S&P 500 to its lowest levels since September 2025. West Texas Intermediate (WTI) oil surged to $100 on Friday, while 5-year Treasury yields reached 4.07%, up from 3.72% three weeks prior.

Inflationary fear and weaker corporate earnings perspectives alone cannot explain Bitcoin’s 20% underperformance against the S&P 500 in 2026. Other factors are likely at play, including investors’ discomfort over the lack of progress on the US Bitcoin Strategic Reserve.
David Sacks has stepped down from his role as the Trump administration’s crypto and AI czar. While Sacks remains an advisor on the President’s Council on Science & Technology, his departure follows earlier comments that inflated Bitcoin investors’ expectations. Sacks had previously hinted that the US could acquire more Bitcoin through budget-neutral methods without raising taxes.
Related: US lawmakers publish crypto tax proposal without Bitcoin tax exemption

The Bitcoin options delta skew jumped to 15% on Friday, showing that put options are trading at a significant premium relative to call instruments. In balanced market conditions, this metric usually ranges between -6% and +6%. The current level indicates a lack of conviction among whales that the $66,000 level will hold. Fear has largely dominated the Bitcoin options market since mid-January.
Bitcoin options expiry favored neutral-to-bearish strategies
Friday’s monthly options expiry at $68,610 proved unfavorable for neutral-to-bullish strategies, as 97% of call options became void. Bears gained the upper hand as put options at $69,000 or higher surpassed $2 billion in open interest. Critically, part of Friday’s downward move reflects a growing unwillingness among traders to maintain Bitcoin exposure over the weekend.

X social platform user WhalePanda, suggested that the crash in risk markets anticipates President Trump making “another dumb escalating move” after US markets close. Consequently, the current fear seen in the options market could reverse if no major geopolitical events occur before Monday.
During bearish cycles, traders often rush for the exits at the mere sight of any event that could be deemed negative. Investors should not take Bitcoin’s implied odds at face value, as these metrics are heavily impacted by recent news and headlines. However, expectations could shift more favorably if Iran effectively releases a counter-offer to the US peace proposal.
This article does not contain investment advice or recommendations. Every investment and trading move involves risk, and readers should conduct their own research when making a decision. While we strive to provide accurate and timely information, Cointelegraph does not guarantee the accuracy, completeness, or reliability of any information in this article. This article may contain forward-looking statements that are subject to risks and uncertainties. Cointelegraph will not be liable for any loss or damage arising from your reliance on this information.


a16z crypto partner Guy Wuollet says crypto is entering its “collared shirt” era, as the firm doubles down on a 10‑year infrastructure bet even while high‑profile partners exit amid a new $2b fundraise.
Summary
- a16z crypto partners have publicly reiterated a 10‑plus‑year investing horizon for the sector, comparing today’s market to the pre‑internet and pre‑AI groundwork phase.
- At the same time, named partners including Arianna Simpson and Kofi Ampadu are exiting or shifting roles, underscoring how venture talent is rotating as the industry matures.
- The crypto team is now raising roughly a $2 billion fifth fund, signaling that institutional LPs still see blockchains, tokenization, and AI‑crypto convergence as core long‑term themes.
Guy Wuollet, a16z crypto partner has published a new essay arguing that “finance is not separate from a larger vision; it is part of it,” describing blockchains as foundational infrastructure rather than a speculative sideshow. “At a16z and a16z crypto, we are looking long‑term: our fund structure is designed for a cycle of over 10 years because building new industries takes time,” the partner wrote, likening the current phase to laying railways before new categories of applications can run. The piece stressed that many breakthrough apps will only emerge once wallets, identities, liquidity, and trust mechanisms are mature, echoing a16z research that compares crypto’s timeline to the decades of work behind modern AI.
a16z crypto doubles down on long‑term thesis
That message is consistent with comments from a16z crypto general partner Chris Dixon, who recently said blockchain is “the next foundational infrastructure of the internet,” and that the industry is in a long “foundation‑building phase” similar to the 1943 neural‑net paper for today’s AI boom. Dixon has also noted that the firm has held onto about 95% of its historically invested assets because, in his words, “selling high‑quality assets too early is the worst decision in venture capital.” The stance underpins a16z crypto’s push into themes like stablecoins, tokenization, privacy, and prediction markets, laid out in a “Big Ideas 2026” roadmap that frames crypto as the plumbing for an internet where value moves as quickly as data.
The long‑term rhetoric comes as some a16z‑linked partners adjust their own career paths. Foresight News reported that Arianna Simpson, a general partner at a16z crypto, has “announced her resignation,” while fellow partner Kofi Ampadu is also leaving after the firm paused its Talent x Opportunity (TxO) program; a memo obtained by TechCrunch shows Ampadu telling staff that “closing my a16z chapter” followed four years of backing out‑of‑network founders. Those moves reflect a broader reshuffling inside top crypto VCs, as funds rebalance between seed bets, growth‑stage deals, and new AI‑crypto hybrids.
Despite the personnel churn, a16z crypto itself is pressing ahead with a fresh war chest. According to a report citing multiple insiders, the firm’s blockchain arm is targeting around $2 billion for its fifth dedicated crypto fund, on top of a broader $15 billion multistrategy raise across infrastructure, applications, and growth‑stage vehicles. Since launching its inaugural $300 million crypto fund in 2018 — in the wake of Bitcoin’s first run to $20,000 — a16z has grown that platform into a $4.5 billion vehicle and now backs projects from exchanges and DeFi protocols to gaming and NFT studios.
For builders, the message is mixed but ultimately constructive: competition for a16z checks is intensifying, even as the capital pool itself grows. On one hand, the departure of familiar faces like Simpson and Ampadu shows that even marquee crypto franchises are not immune to internal strategy shifts; on the other, a $2 billion target fund and a stated commitment to hold 95% of positions signal that LPs and partners remain aligned on treating crypto as a decade‑plus play. The firm’s research arm continues to push for clearer token rules and large‑scale DeFi adoption, arguing that “great endeavors take time” and that today’s messy, volatile years are the “groundwork” phase before a sharp inflection in usage.
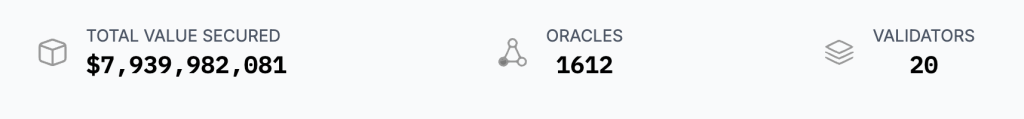
BlackRock BUIDL fund, the largest crypto tokenized onchain Treasuries vehicle with approximately $1.7 billion in assets under management, has added oracle provider Chronicle Protocol as a new verification layer, the two parties announced Tuesday.
This is a structural attestation layer designed to give institutional allocators and DeFi protocols independently verifiable, real-time proof of what backs BUIDL’s tokens.
The move signals that tokenized RWA infrastructure is converging on auditable, machine-readable transparency as a baseline requirement, not a differentiator.
Chronicle’s Proof of Asset system will source holdings-level data directly from BUIDL’s custodians and administrators, publishing continuous on-chain attestations covering the fund’s valuation, asset composition, custody verification, and data freshness. The Chronicle Dashboard makes those attestations publicly viewable in real time.
- Verification Layer: Chronicle’s Proof of Asset will provide continuously updated, independently verified holdings data for BUIDL, covering valuation, composition, custody, and asset existence — viewable on the Chronicle Dashboard.
- Institutional Context: Chronicle’s Proof of Asset currently secures approximately $5 billion in total value across funds including Janus Henderson’s Anemoy Treasury Fund and Superstate’s USTB.
- Market Signal: The integration by BlackRock and Securitize establishes a transparency benchmark for institutional-grade tokenized funds targeting DeFi and TradFi composability.
Discover: The best crypto presales gaining institutional momentum right now
What Chronicle Actually Adds to Blackrock BUIDL Crypto Architecture
Chronicle’s integration replaces a core trust assumption in tokenized fund infrastructure with a cryptographically secured, continuous data feed.
Previously, investors holding BUIDL tokens had to rely on periodic disclosures from Securitize and BlackRock to understand what backed their position. Chronicle Proof of Asset changes that by sourcing data directly from custodians, including BNY Mellon, and publishing tamper-evident attestations on-chain in near real time.
The system provides what Niklas Kunkel, Chronicle’s founder, describes as an “integrity layer” delivering “more granular and transparent data” across four dimensions: valuation inputs, holdings composition, custody confirmation, and asset existence. Daily NAV calculations and specific Treasury holdings verification flow through a 24/7 public audit trail consumable by both smart contracts and human auditors.
Securitize CEO Carlos Domingo put the operational logic plainly: “Tokenization becomes meaningful when investors and protocols can independently verify what’s actually backing the product.” That framing matters, it positions Chronicle not as an analytics add-on but as a prerequisite for BUIDL’s broader DeFi composability.
Robert Mitchnick, BlackRock’s head of digital assets, confirmed the strategic intent: “Data oracles are a critical layer of market infrastructure for tokenized assets… We’re excited by Chronicle’s ability to unlock this for platforms and allocators seeking BUIDL fund data on-chain, strengthening confidence and transparency around tokenized assets.”
That statement frames oracles as infrastructure, not feature. That distinction matters for how the market prices verification capability going forward.

Chronicle is not entering this space without a track record. Its Proof of Asset system already secures approximately $8 billion in total value, covering funds including the Janus Henderson Anemoy Treasury Fund and Superstate’s Short Duration US Government Securities Fund. Securitize has also deployed Chronicle verification for its Tokenized AAA CLO Fund. BUIDL is the largest mandate yet — and the most visible.
Discover: The best crypto to diversify your portfolio with
The post BlackRock Tokenized BUIDL Fund Adds Chronicle Verification Layer appeared first on Cryptonews.

Key Takeaways
- The New York Stock Exchange’s parent company, Intercontinental Exchange (ICE), has injected an additional $600 million into Polymarket
- ICE’s overall financial commitment to the prediction market platform now approaches $2 billion
- Competing platform Kalshi secured over $1 billion in funding at a $22 billion valuation with approximately $1.5 billion in yearly revenue
- Polymarket has purchased a regulated exchange and clearinghouse while forming partnerships with Palantir and TWG AI for trade monitoring
- Congressional members are raising concerns about potential manipulation risks in prediction markets
Intercontinental Exchange, the entity behind the New York Stock Exchange, has committed an additional $600 million toward Polymarket, a marketplace where participants wager on real-world event outcomes.
This latest capital injection comes after ICE’s initial $1 billion commitment to the platform in October 2025. The exchange operator also intends to acquire up to $40 million worth of shares from current Polymarket stakeholders. Combined, ICE’s total financial exposure to the platform now stands near the $2 billion mark.
According to ICE, this investment won’t significantly affect its financial performance or shareholder return strategies.
The complete valuation of Polymarket remains undisclosed until the ongoing funding round concludes, according to company statements.
Polymarket operates as a marketplace where participants purchase and sell contracts linked to future event outcomes. These events span everything from political elections to macroeconomic indicators such as inflation reports. Contract values fluctuate continuously based on trading behavior.
Prediction markets have rapidly evolved from an obscure sector within cryptocurrency and academic finance circles into a booming trading category. Both participant engagement and transaction volumes have experienced dramatic growth throughout the last two years.
The Competitive Landscape
Polymarket isn’t the only platform attracting substantial capital. Kalshi[[/LINK_END_1]], a rival prediction market operator, recently secured more than $1 billion in funding at a $22 billion valuation—approximately twice its prior worth.
Kalshi is reportedly generating around $1.5 billion in annual revenue, demonstrating robust market appetite for event-driven trading instruments.
The rapid expansion of both platforms has captured the attention of regulatory bodies and government officials. Concerns persist regarding whether these prediction markets remain susceptible to market manipulation or illegal insider trading practices.
Infrastructure Development at Polymarket
Polymarket has implemented measures to address potential regulatory challenges. The company acquired a fully licensed exchange and clearinghouse operation earlier this year.
Additionally, the platform formed a strategic alliance with Palantir and TWG AI. This collaboration aims to develop sophisticated monitoring technology capable of identifying questionable trading patterns and market manipulation within its sports betting markets.
These strategic initiatives indicate Polymarket’s commitment to adhering to the compliance standards typically required of regulated financial institutions.
ICE’s ongoing financial support connects Polymarket to one of the world’s premier exchange operators. The NYSE’s parent organization has previously indicated it views prediction markets as a promising expansion opportunity in derivatives trading.
Industry observers suggest these products could draw additional retail participants and enable exchanges to broaden their revenue streams amid intensifying competition in conventional futures and options trading.
Friday’s announced $600 million investment represents a portion of Polymarket’s current fundraising effort. ICE initially revealed its intention to invest up to $2 billion in the platform earlier in the year.

BTC USD has broken below the $67,000 price level for the first time since March 9, sliding by 5 big percents in 24 hours to trade at $66,300, and the macro backdrop just got considerably uglier. The 10-year U.S. Treasury yield is closing in on 4.5%, its highest level since July, draining risk appetite across crypto markets. Whether this dip finds a floor or accelerates into deeper liquidation territory is the question every trader is asking right now.
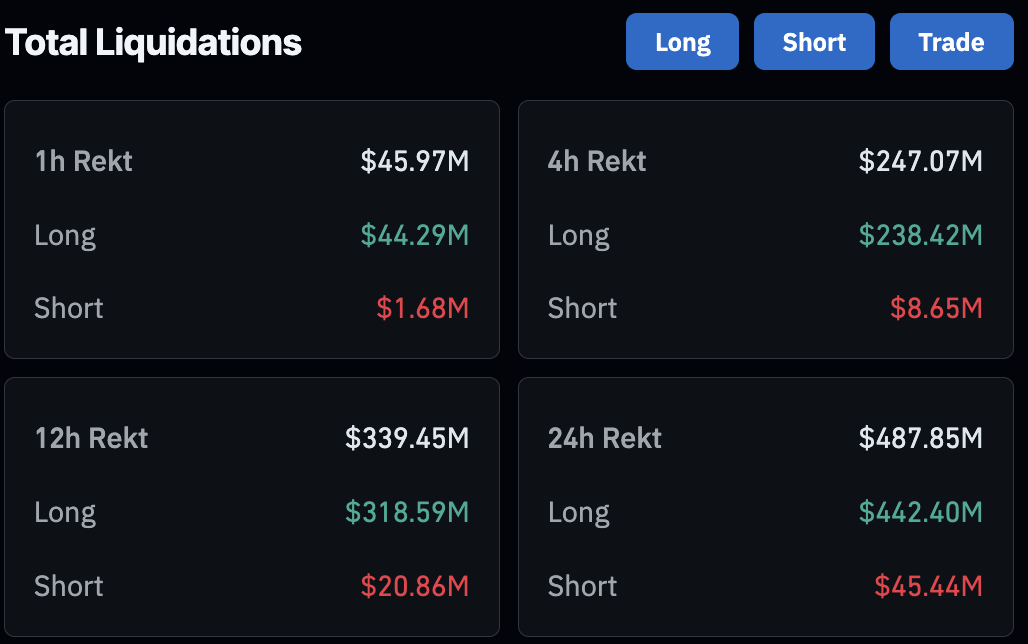
The selloff triggered close to $50 million in long liquidations in a single hour, with Coinglass data showing roughly 90% of those wipes coming from long positions. Shares of crypto-adjacent equities like Circle Internet (CRCL), Coinbase (COIN), and Strategy (MSTR) all fell in pre-market trading. Funding rates have flipped negative, meaning short traders are now paying longs: a textbook bearish signal in perpetual futures markets.

Macro conditions are compounding the pressure. The MOVE Index, which tracks U.S. bond market volatility, surged 18% in 24 hours. Oil prices, both Brent and WTI, rose 3% as Ukraine’s disruption of Russian oil flows complicated Trump’s supply-stabilization plans.
Risk assets are caught in a crossfire of rising yields, geopolitical friction, and forced crypto deleveraging. The broader BTC price outlook was already fragile heading into this week.
Discover: The best crypto to diversify your portfolio with
Can BTC USD Hold $66K Price Level? Or Is a Deeper Flush Coming?
The BTC USD price technical structure has deteriorated sharply. Key support levels sit at $68,400 has broken in a flash. All short-term moving averages are flashing SELL; the MA5 sits at $74,900, the MA3 at $78,900, both far above spot, confirming sustained downward momentum rather than a shallow correction.
The 48-hour liquidation heatmap is particularly concerning: a dense liquidity cluster sits below $66,000, which functions as a magnet for price during high-volatility episodes. The Fear & Greed Index has collapsed to 10, or Extreme Fear.

The Bernstein bottom analysis suggested structural support deeper in the range, but that thesis gets harder to hold when yields are rising, and oil is spiking simultaneously. If $66,000 breaks on volume, the next credible floor is meaningfully lower.
Discover: The best pre-launch token sales
Bitcoin Hyper Comes With Upside Potential as BTC Tests Critical Support
Spot Bitcoin bleeding through support is painful for leveraged longs. But it also historically sharpens attention toward early-stage infrastructure plays, projects that capture Bitcoin’s upside thesis without the same immediate downside exposure from macro-driven deleveraging. That’s where Bitcoin Hyper ($HYPER) is drawing interest.
Bitcoin Hyper is positioning itself as the first Bitcoin Layer 2 with Solana Virtual Machine (SVM) integration, delivering sub-second finality and smart contract capability directly within Bitcoin’s security model.
Wow! Now this looks like it'll lead somewhere nice. — Bitcoin Hyper (@BTC_Hyper2) March 26, 2026

Bitcoin just found its fast lane.  https://t.co/VNG0P4GuDo pic.twitter.com/ayZQyRm7m3
The pitch is blunt: Bitcoin is slow, expensive, and non-programmable. Bitcoin Hyper claims to fix all three simultaneously, via a Decentralized Canonical Bridge for BTC transfers and high-speed, low-cost transaction execution that reportedly outperforms Solana itself on latency metrics.
The presale has already raised more than $32 million at a current price of just $0.013 per $HYPER, plus 36% APY staking rewards for early buyers.
Traders rotating out of spot BTC exposure during macro stress periods have historically scouted infrastructure-layer presales at precisely these moments. Research Bitcoin Hyper before the current presale stage closes.
This article is not financial advice. Crypto assets are highly volatile. Always conduct your own research before investing.
The post BTC USD Price Falls Below $67K: 10-Year US Treasury Yield Approaches Yearly High appeared first on Cryptonews.

An early-stage discussion draft released by U.S. lawmakers seeks a comprehensive overhaul of how digital assets are taxed, aiming to clarify treatment across a range of activities—from stablecoins to lending and staking. Introduced as a conversation starter rather than a bill, the Digital Asset PARITY Act outlines proposed changes to the Internal Revenue Code that would reshape the tax landscape for individuals and institutions engaging with crypto in the United States.
The draft, authored by Representatives Max Miller and Steven Horsford, would set out specific rules for stablecoins, address cost-basis calculations, and establish de minimis exemptions for smaller transactions. Notably, the proposal stops short of an outright crypto tax framework and is framed as a starting point for a broader policy discussion among lawmakers, industry participants, and other stakeholders.
Conversations around the draft emphasize that if enacted, these provisions could influence onramping activity, compliance costs, and how crypto yields are reported. The document is not a bill introduced in Congress, but rather a discussion draft designed to spur debate on how the United States might modernize its tax code to accommodate digital assets.
Key takeaways
- Stablecoins may escape gains taxation if their cost basis remains within 1% of $1 (or $0.01), according to the discussion draft. This threshold would shape when gains on stablecoin holdings are recognized for tax purposes.
- Costs associated with acquiring or moving regulated dollar-pegged stablecoins would not be counted toward an investor’s cost basis, potentially lowering the taxable baseline for some trades.
- A de minimis exemption would apply to stablecoin transactions under $200, meaning those small trades would not trigger tax or reporting requirements. The act does not specify an annual cap yet.
- Income earned from lending, staking, or passive validator services would be treated as ordinary gross income in the year it is earned, measured by fair market value at the time of receipt.
- The proposal remains a discussion draft and has not been introduced as legislation; its purpose is to solicit input from lawmakers, industry participants, and the crypto community on how to overhaul crypto tax policy.
What the draft proposes and why it matters
The Digital Asset PARITY Act proposes a framework intended to bring greater clarity to how digital assets are taxed, with a focus on stabilizing tax outcomes for users who hold or transact with digital currencies that are designed to maintain a stable value. The centerpiece is a potential threshold-based treatment for stablecoins, aimed at reducing the tax friction associated with routine use of dollar-pegged tokens in everyday commerce or yield-generating activities.
Beyond stablecoins, the draft also addresses the allocation of tax burdens for earnings generated through decentralized finance (DeFi) activities. By treating income from lending, staking, and related validator services as ordinary gross income in the year earned, the proposal would require taxpayers to recognize fair market value at the time of receipt, aligning crypto income with traditional tax treatment for similar financial activities.
Officials behind the draft stress that the document is intended to catalyze cross-sector dialogue. They emphasize that any final policy will depend on congressional negotiations, administrative considerations, and input from the crypto industry and other stakeholders. The draft explicitly notes that it has not been introduced as formal legislation and invites feedback on the proposed structures.
Analysts and advocates see the bill as a reflection of the ongoing tension between fostering crypto innovation and maintaining robust tax oversight. From an investor perspective, the provisions could affect how quickly and efficiently activities such as yield farming, staking, and stablecoin usage move into formal compliance, potentially altering risk calculations and after-tax returns.
Industry responses and tensions
Reaction to the discussion draft highlights competing priorities within the crypto policy sphere. Cody Carbone, CEO of the Digital Chamber, framed the draft as a call for much-needed clarity in digital asset taxation. In a statement tied to the draft’s release, he underscored the risk of tax policy that remains ambiguous or misaligned with onshore activity, arguing that clear rules are essential for bringing more activity into the regulated economy.
“We need digital asset tax clarity or activity will never fully onshore,”
— Cody Carbone, Digital Chamber
Among Bitcoin advocates, the reaction was more skeptical, signaling concerns that the plan privileges stablecoins while bypassing a similar tax treatment for Bitcoin (BTC). The draft’s de minimis provision for stablecoins—but not for BTC—echoes ongoing debates about how decentralized, permissionless digital assets should be treated for tax purposes. Critics argue that stablecoins, being centrally issued and regulated, do not share the same decentralized attributes as BTC and should not enjoy the same exemptions.
“This is the wrong direction to go in,”
— Pierre Rochard, CEO, The Bitcoin Bond Company, commenting on the draft’s approach to de minimis relief and stablecoins
The broader policy landscape includes other proposed or pending measures, some of which contemplate various forms of tax relief or exemptions for BTC, while continuing to assess the equity of the tax treatment for stablecoins and other digital assets. Observers note that the Digital Asset PARITY Act aligns with an ongoing push to reform crypto taxation but remains a preliminary draft that will require extensive debate before any legislative action.
Context, implications, and what comes next
The draft arrives at a moment when policymakers are increasingly focused on how to create a workable tax regime for rapid innovation in digital assets, including DeFi, tokenized securities, and cross-border use cases. By proposing targeted exemptions and income-recognition rules, the authors aim to balance revenue considerations with practical usage patterns—especially for stablecoins that underpin much of DeFi liquidity, payments, and on-chain settlement.
For investors and developers, the move signals potential shifts in tax planning and compliance obligations. If adopted, the rules could influence how projects structure incentives, how wallets and exchanges report activity, and how users assess the after-tax viability of various crypto strategies. The discussion also foregrounds potential regulatory bifurcations between stablecoins and other digital assets, a theme that could shape policy debates in the coming months.
As Congress weighs the draft, stakeholders will scrutinize the mechanics of the proposed cost-basis rules, the exact thresholds for exemptions, and how these changes would integrate with existing tax provisions. The process will likely involve multiple committees, hearings, and stakeholder rounds before any formal bill could emerge. Market participants should watch for: whether the de minimis threshold for stablecoins is preserved or revised, whether BTC-specific exemptions gain traction, and how the definition of “regulated” stablecoins evolves in alignment with broader regulatory expectations.
In the near term, observers expect further commentary from industry groups, think tanks, and lawmakers as the dialogue around crypto taxation intensifies. The Digital Asset PARITY Act stands as a litmus test for how policymakers intend to reconcile traditional tax rules with the increasingly complex and transformative world of digital assets.
Readers should stay tuned for updates on whether the discussion draft progresses toward formal consideration and how the evolving policy debate will influence tax reporting, compliance costs, and the broader adoption path for digital assets in the United States.
Introduction
In cryptocurrency markets, success is rarely about prediction alone. It comes down to execution, consistency, and discipline — areas where human traders often fall short.
QBots addresses this gap by offering a fully automated trading platform designed to execute strategies with precision across the most liquid digital assets. Rather than relying on manual decisions, users can deploy algorithmic strategies that operate continuously, removing emotion from the process.
Focused on the Top 50 cryptocurrencies by market capitalisation, QBots enables users to automate trading across major global exchanges with efficiency and control.
Advanced Strategies for Every Market Condition
QBots provides a suite of strategies designed to perform across different market environments:
- Mean Reversion: Capitalises on price movements returning to historical averages, ideal for volatile and range-bound markets.
- Futures Grid Trading: Automates buying and selling within predefined price ranges, turning short-term volatility into structured returns.
- Momentum Trading: Identifies strong trends and enters positions when directional movement is confirmed.
- Dollar-Cost Averaging (DCA): Reduces timing risk by spreading entries over time, improving average entry price.
- Arbitrage & Scalping: Exploits small price inefficiencies across highly liquid pairs for frequent, short-term opportunities.
These strategies allow users to operate with a level of consistency and speed typically reserved for institutional trading desks.
Global Access with Real Execution
QBots integrates directly with leading exchanges through secure API connections. This allows users to:
- Retain full control of their funds (funds safe on mexc, bybit or binance)
- Execute trades automatically in real time
- Deploy multiple strategies simultaneously
By focusing on the most liquid assets, QBots ensures that trades are executed efficiently, with minimal slippage and strong market depth.
Built-In Risk Management
Automation without control is risk — which is why QBots incorporates:
- Customisable stop-loss and take-profit settings
- Strategy-level risk parameters
- Defined capital allocation per trade
This allows users to tailor their approach based on their risk tolerance while maintaining systematic execution.
Referral Program: Build Recurring Income
QBots also introduces a referral program designed for recurring income.
Users can invite others to the platform and earn a percentage of subscription revenue generated by their network. As long as referrals remain active, earnings continue — creating a scalable income stream alongside trading activity.
This turns QBots into not just a trading tool, but a distribution-driven ecosystem.
Additional Benefits
Users who choose to pay for QBots subscriptions using QIE tokens receive discounted pricing, adding an additional layer of value for participants within the broader ecosystem.
Conclusion
QBots represents a shift away from manual, emotion-driven trading toward structured, automated execution.
By combining institutional-grade strategies, real-time execution, built-in risk management, and scalable earning opportunities, QBots enables users to participate in crypto markets with greater consistency and efficiency.
In a market driven by speed and discipline, automation is no longer optional — it is an advantage.
Explore QBots and deploy your first automated strategy today.
Disclaimer: This is a Press Release provided by a third party who is responsible for the content. Please conduct your own research before taking any action based on the content.
Crypto World
Ethereum Price Prediction: Pepeto Targets 1000x as $14B Options Expiry Crashes BTC While ETH and BNB Slide

One hundred million Americans carry medical debt, and one emergency room visit averaging $2,700 can put a family underwater for years. A $14 billion options expiry just crashed BTC below $68,000 while oil topped $100 for the first time this cycle.
The ethereum price prediction points to respectable growth and its staying power is real, but if the reader has eyes on returns that clear every medical bill from one entry, Pepeto has raised more than $8 million with a live exchange already serving traders and 1000x potential as the Binance listing approaches.
A $14 billion options expiry on Deribit collided with the macro selloff on March 27, crashing BTC below $68,000 as oil topped $100 and bond yields spiked higher according to CryptoSlate.
The crash wiped $300 million in leveraged longs and pushed the Fear and Greed Index to 10. According to InvestingNews, BTC hit $66,400, its lowest since March 9, as Treasury yields climbed for four straight weeks.
The ETH forecast faces serious pressure in this environment, and the real returns live further down the stack in presale entries where 1000x is the math.
The Ethereum Forecast Weighed Against What This Market Actually Needs
Pepeto: The Verified Exchange With 1000x Potential Where the Next Dogecoin Is Forming
The $14 billion options expiry just proved that the biggest players in crypto can move the entire market in a single session, and the ETH forecast is just one piece of a much larger puzzle. Pepeto is the verified exchange with 1000x potential where the next Dogecoin is forming, because no project in 2026 has matched this combination of viral energy and real exchange tools.
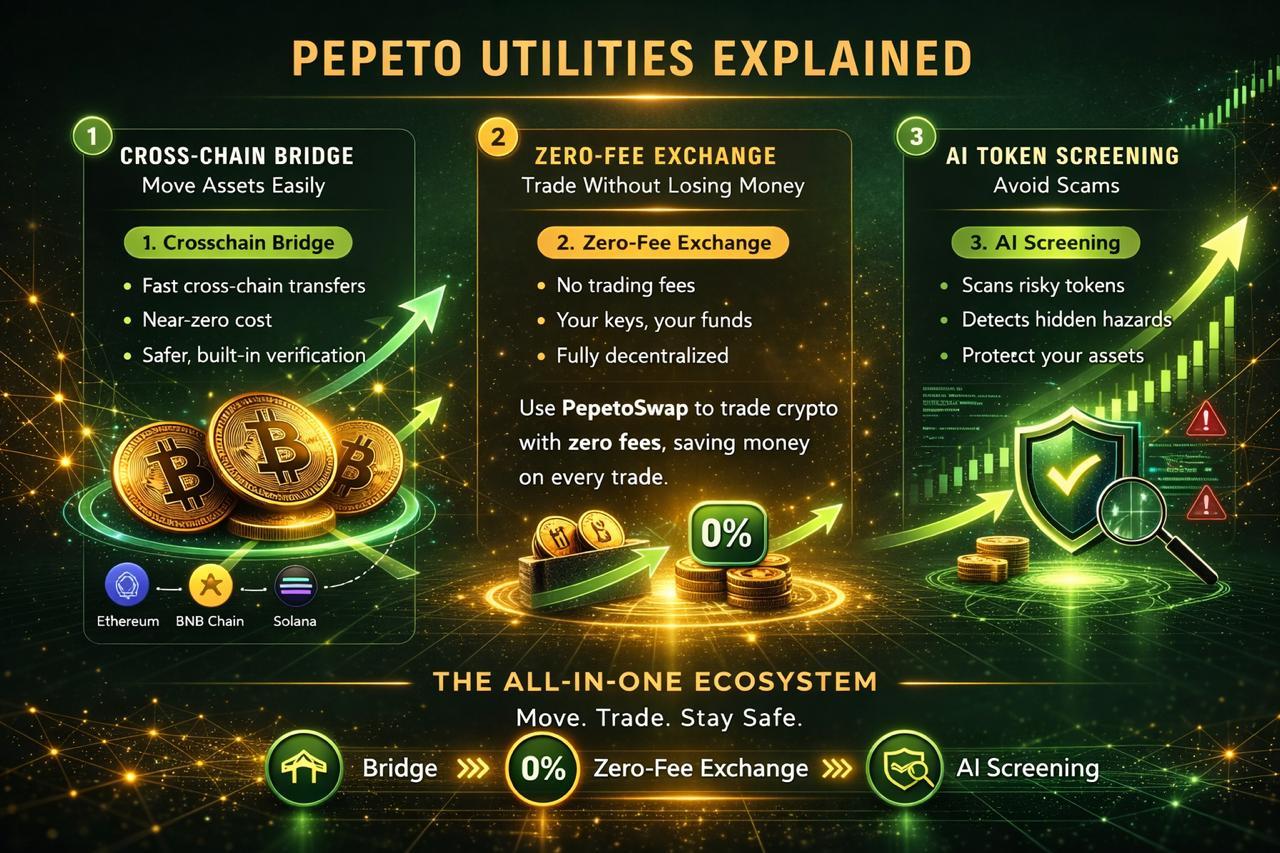
The exchange fills an urgent need for better trading protection. PepetoSwap clears every trade without charging fees so the reader’s medical bill money stays intact, the asset relay moves tokens between chains at zero expense, and the safety scanner reviews every contract before capital commits, confirmed by a SolidProof audit.
The same person who took the original Pepe token from zero to $11 billion market cap without any products constructed this exchange, and more than $8 million raised during a single digit fear reading is the conviction signal the $14 billion options expiry was designed to hide.
The wallets that entered Dogecoin early built the kind of wealth this cycle is about to produce again, and the ones entering Pepeto now are positioned for the same outcome with a working exchange behind it. Analysts project 1000x from the current entry at $0.000000186, and 192% APY staking multiplies the reader’s allocation while the listing countdown runs. The bull market is forming, and the wallets are entering with size because once the listing arrives this entry disappears permanently.
Ethereum (ETH)
ETH trades at $1,988 per CoinMarketCap, pressured by the $14 billion options expiry and over 75% leveraged positioning on Binance.
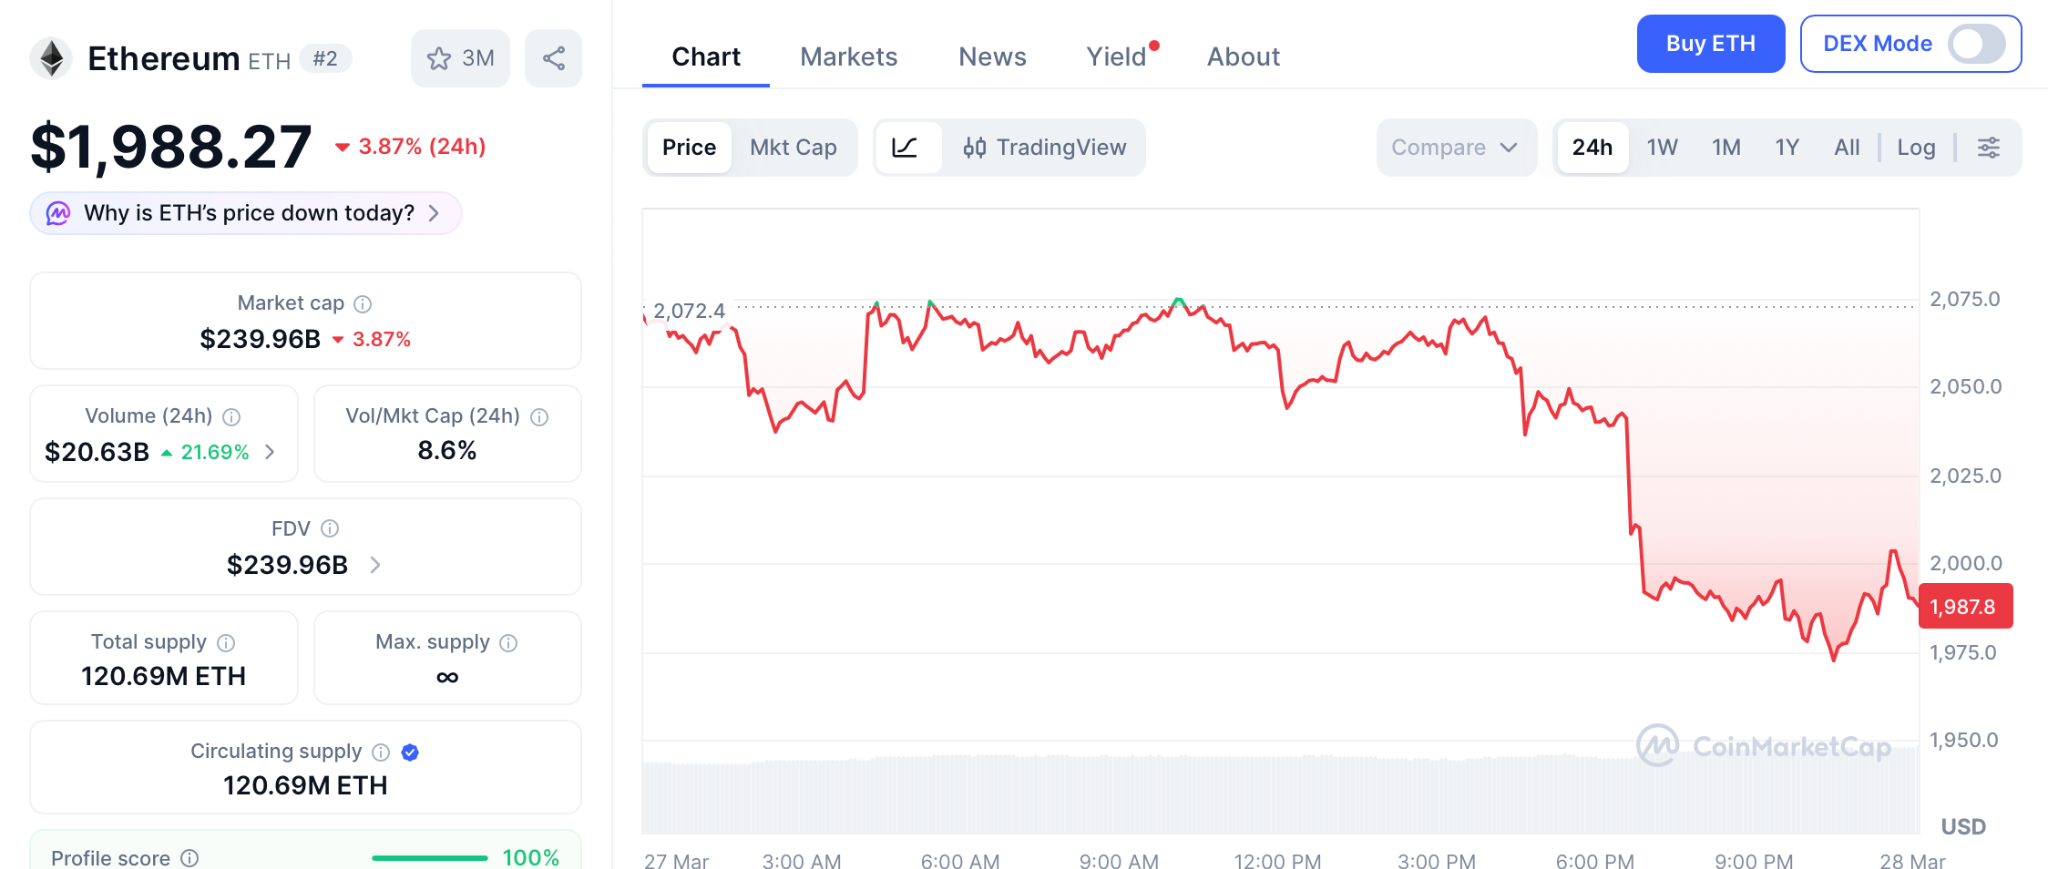
The ethereum price prediction targets $4,000 by year end, an impressive 95% ceiling, but if the reader carries $2,700 in medical debt from one ER visit, the life changing returns live in the presale entries where 1000x is still the math.
Binance Coin (BNB)
BNB trades at $610 per CoinGecko, holding steady while the broader market corrects around it. A recovery to $750 delivers 19% over months, a strong ecosystem anchor that suits patient holders.
While Pepeto at presale pricing offers the kind of return that turns a $2,700 medical emergency from a financial crisis into a rounding error.
The Ethereum Price Prediction Confirms the Bull Market and the Wallets Inside Pepeto See the Next Dogecoin Forming
The $14 billion options expiry crashed BTC below $68,000 and 100 million Americans are carrying medical debt they took on because one bad day happened at the wrong time.
The ethereum price prediction confirms the bull market is forming, but no project in 2026 has matched Pepeto’s combination of viral energy and real exchange tools, and the addresses filling this presale see the next Dogecoin forming inside it.
The Pepeto official website is where those wallets are entering with size, because once the listing arrives this entry disappears permanently and the people inside will hold the positions that turn a $2,700 ER visit from a crisis into a number they laugh about.
Click To Visit Pepeto Website To Enter The Presale

FAQs
What does the ethereum price prediction look like as the $14B options expiry crashes BTC?
The ethereum price prediction targets $4,000 by year end, but Pepeto’s presale with a verified exchange and 1000x potential offers the returns only presale entries with 1000x potential produce.
Can anything outperform the ethereum price prediction in terms of returns?
Presale entries with working products deliver the 1000x returns that only presale entries produce, and the Pepeto official website is where the 1000x entry with a verified exchange is still open.
Is the ethereum price prediction still worth following in 2026?
The ethereum price prediction matters for portfolio anchoring, but Pepeto’s presale targets 1000x with the Pepe builder and Binance listing, the kind of return that clears medical debt.
Disclaimer: This is a Press Release provided by a third party who is responsible for the content. Please conduct your own research before taking any action based on the content.


Ark Invest’s Bitcoin ETF saw one of the sharpest single‑day outflows of the month this week, as investors yanked tens of millions of dollars from spot products just as Bitcoin slid back toward the mid‑$60,000s.
Summary
- U.S. spot Bitcoin ETFs recorded about $171 million in net outflows on March 27, with Ark Invest’s ARK 21Shares fund among the hardest hit.
- Ark’s CEO Cathie Wood, long one of Bitcoin’s loudest institutional bulls, now faces a tape where her flagship crypto vehicle is bleeding capital even as she reiterates long‑term upside.
- The reversal in flows undercuts part of the “institutional floor” narrative that has supported Bitcoin since U.S. spot ETFs launched in early 2024.
The latest data show U.S. spot Bitcoin (BTC) ETFs posted a combined $171.12 million in net outflows on March 27, the largest one‑day withdrawal in more than three weeks and a stark contrast to the steady inflows seen earlier this month. According to ETF flow trackers, BlackRock’s IBIT led redemptions with roughly $41.9 million out, followed by Fidelity’s FBTC at about $32 million, while Ark Invest’s ARK 21Shares ETF saw approximately $30.5 million leave in a single session. Those exits hit as Bitcoin slipped back toward $70,000, with selling pressure from ETF desks reinforcing a broader risk‑off move across digital assets.
For Cathie Wood, the numbers add short‑term pain to a long‑running conviction trade. The Ark founder has for years argued that Bitcoin could eventually reach $500,000 if corporate treasuries and institutional allocators push even 5% of portfolios into the asset, telling CNBC at the SALT Conference that “the price will be ten‑fold what it is today” if that thesis plays out. Ark has backed that view with positioning, building exposure across vehicles such as its Next Generation Internet ETF and, more recently, via its ARK 21Shares spot product, which quickly became one of the most closely watched newcomers in the U.S. ETF lineup.
Yet the latest redemption wave shows how tactical those same institutions can be when macro conditions sour. Market data providers say investors are rotating out of risk assets on the back of sticky inflation, uncertainty over the Federal Reserve’s rate‑cut path, and escalating geopolitical tension around Iran, all of which have pushed volatility higher and forced some fast‑money players to de‑risk. “This pattern of inflows and outflows is becoming a key indicator of institutional positioning,” one ETF flow note observed, pointing out that even newer funds and smaller trusts such as VanEck’s HODL and Grayscale’s mini‑BTC product joined Ark’s ARKB in posting redemptions.
The move matters because Ark has been central to the story that spot ETFs would anchor Bitcoin with a deeper, more stable institutional base. Earlier in March, U.S. spot funds briefly flipped back to net inflows, including a day when the complex added about $167 million in fresh cash, suggesting some large accounts were willing to buy dips. That pattern appears to have reversed, at least temporarily, with several consecutive outflow days culminating in Thursday’s $171 million drawdown, undercutting the idea that ETF demand alone can offset macro shocks or positioning washes in derivatives.
Still, most analysts tracking Ark and its peers see the current outflows as tactical rather than a structural rejection of Bitcoin. Flows tend to whipsaw around options expiries, CPI releases, and geopolitical headlines, and Ark’s own research — including its latest Big Ideas 2026 report — continues to frame Bitcoin as a multi‑cycle, high‑conviction allocation rather than a quarter‑to‑quarter trade. For investors watching Wood’s ETF specifically, the question now is whether renewed inflows reappear on the next bout of weakness, or whether this week’s $30‑plus million exit marks the start of a longer period in which Ark’s name recognition is not enough to keep nervous capital from heading to the sidelines.
Bittensor (TAO) is trading at $322, down 6.97% on the session after briefly tagging $380 on March 26.
The 2-day chart shows TAO has cleared the 0.618 Fibonacci resistance zone at $306 that capped every rally for four months, but the move above it has immediately stalled.
TAO Holders’ Sentiment Drove the Breakout
The Santiment weighted sentiment chart covers March 3 through March 26, 2026. TAO sentiment spiked to above 5.0 on March 25 — the highest reading on the chart — as price surged toward $380. By March 26, sentiment had collapsed to 0.684 as price reversed sharply.
This pattern repeated twice earlier in the month. On March 13, sentiment spiked sharply before price reversed from $305 back toward $260. On March 19, another sentiment spike preceded a drop from $290 back toward $250. Each time, elevated sentiment coincided with a local TAO price top rather than sustained upside.
Want more token insights like this? Sign up for Editor Harsh Notariya’s Daily Crypto Newsletter here.
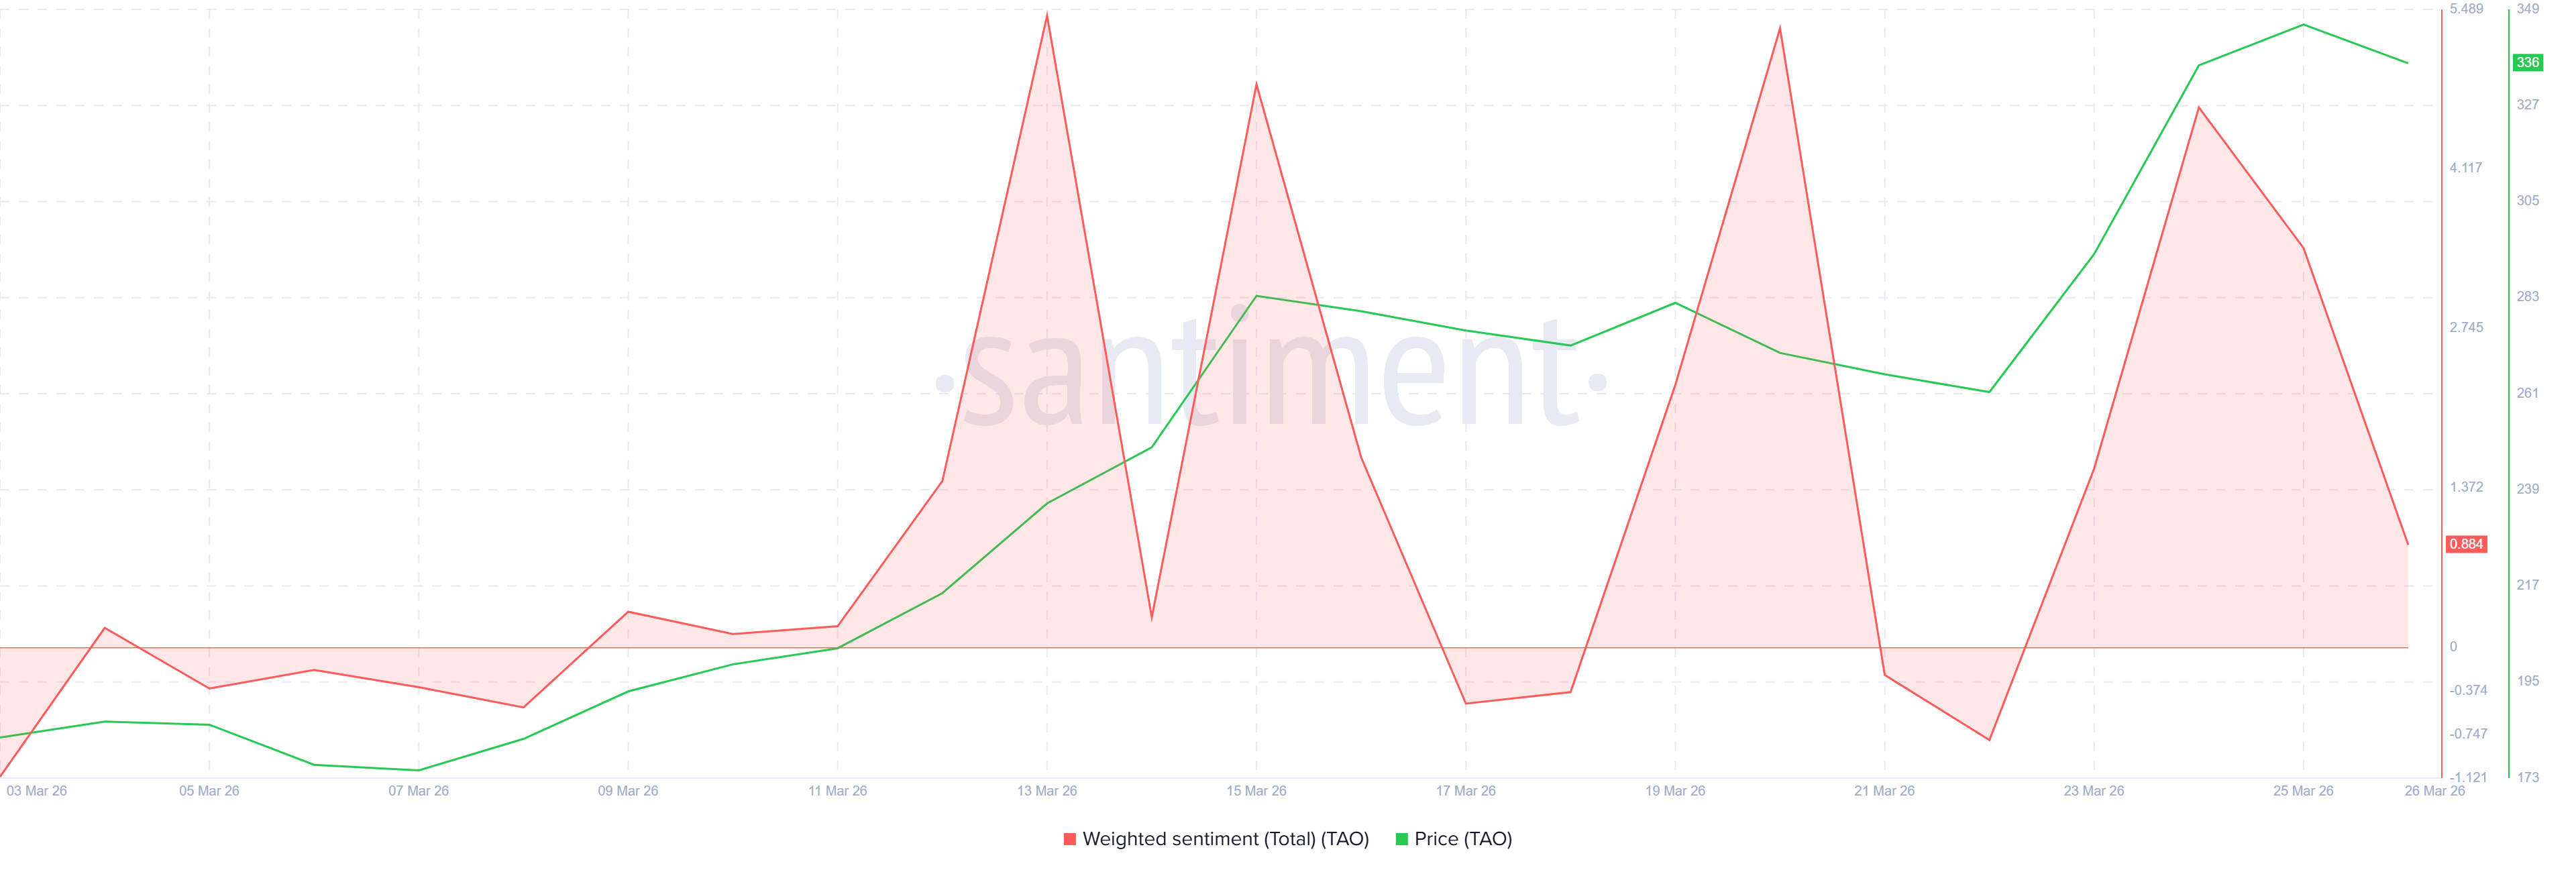
The current reading of 0.684 is not yet negative, but the trajectory from above 5.0 to 0.684 in a single session mirrors the prior reversal patterns precisely. Sentiment drove capital into TAO at elevated prices and is now retreating, removing the buying pressure that generated the move.
Breaking This Ceiling Will Prove Beneficial For TAO
The TAO liquidation heatmap covers March 26 and 27. The brightest concentration of liquidation leverage — shown in yellow on the heatmap — sits at the $364 level, with 2.98 million in liquidation leverage at that exact price. Above $364, the cumulative short liquidation leverage reaches $17.81 million.
That $17.81 million short squeeze would be a powerful catalyst if triggered. A move through $364 would force those short positions closed, mechanically driving the price toward $407 and potentially $469. However, the 2.98 million in leverage concentrated at $364 itself acts as a magnet that also absorbs buying pressure, making it a ceiling before it becomes a springboard.
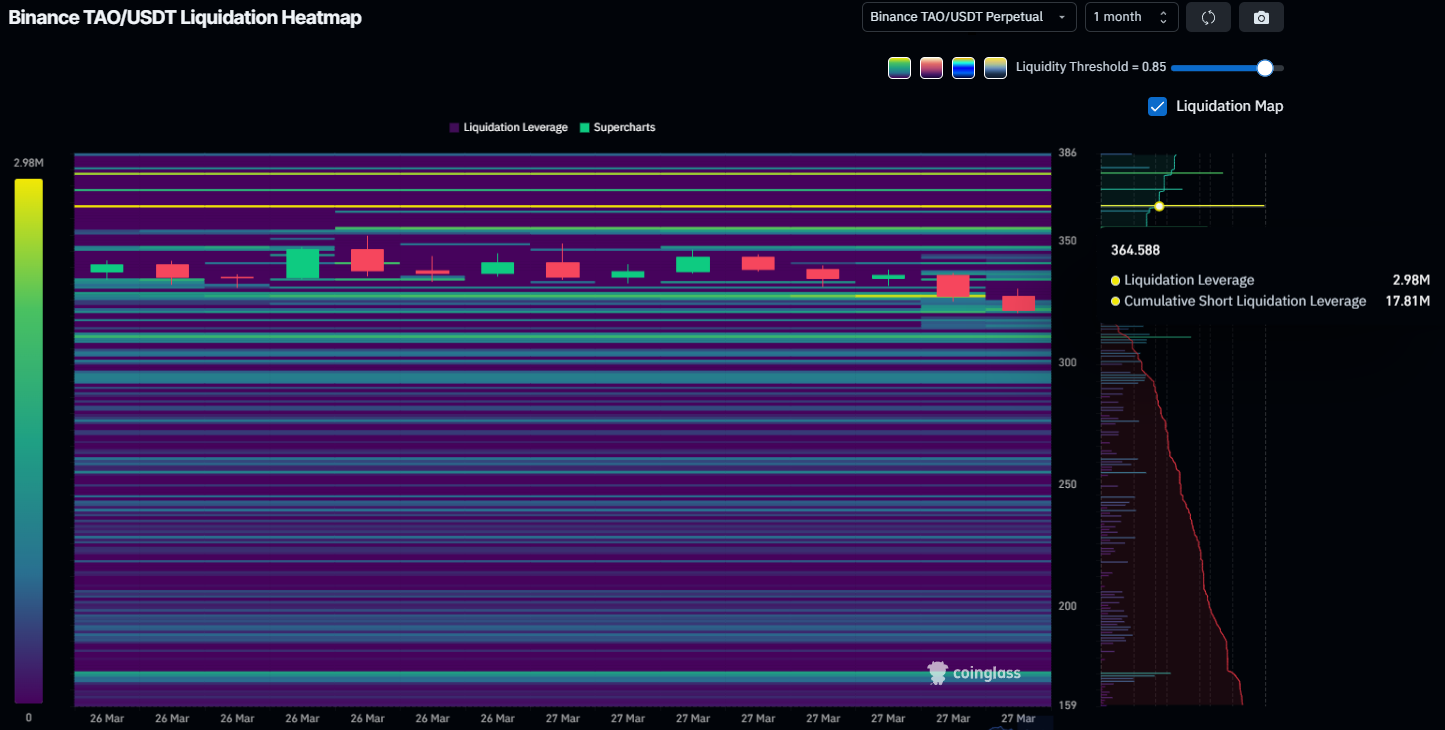
With sentiment already collapsed and price pulling back from $380 without clearing $364 on a close, the short squeeze scenario requires a fresh wave of buying that is not currently visible in either the sentiment data or the price structure.
TAO Price Prediction: Drop Back Into the $306 Zone Before Any Continuation
TAO spent four months consolidating under the red resistance zone under the 0.618 level at $306. The annotated breakout measured move shows a 20.33% gain over the past week as TAO escaped it.
MFI adds further weight to the bearish near-term outlook. MFI reached the overbought threshold last week, and every prior instance where MFI reached this zone coincided with a local price top.
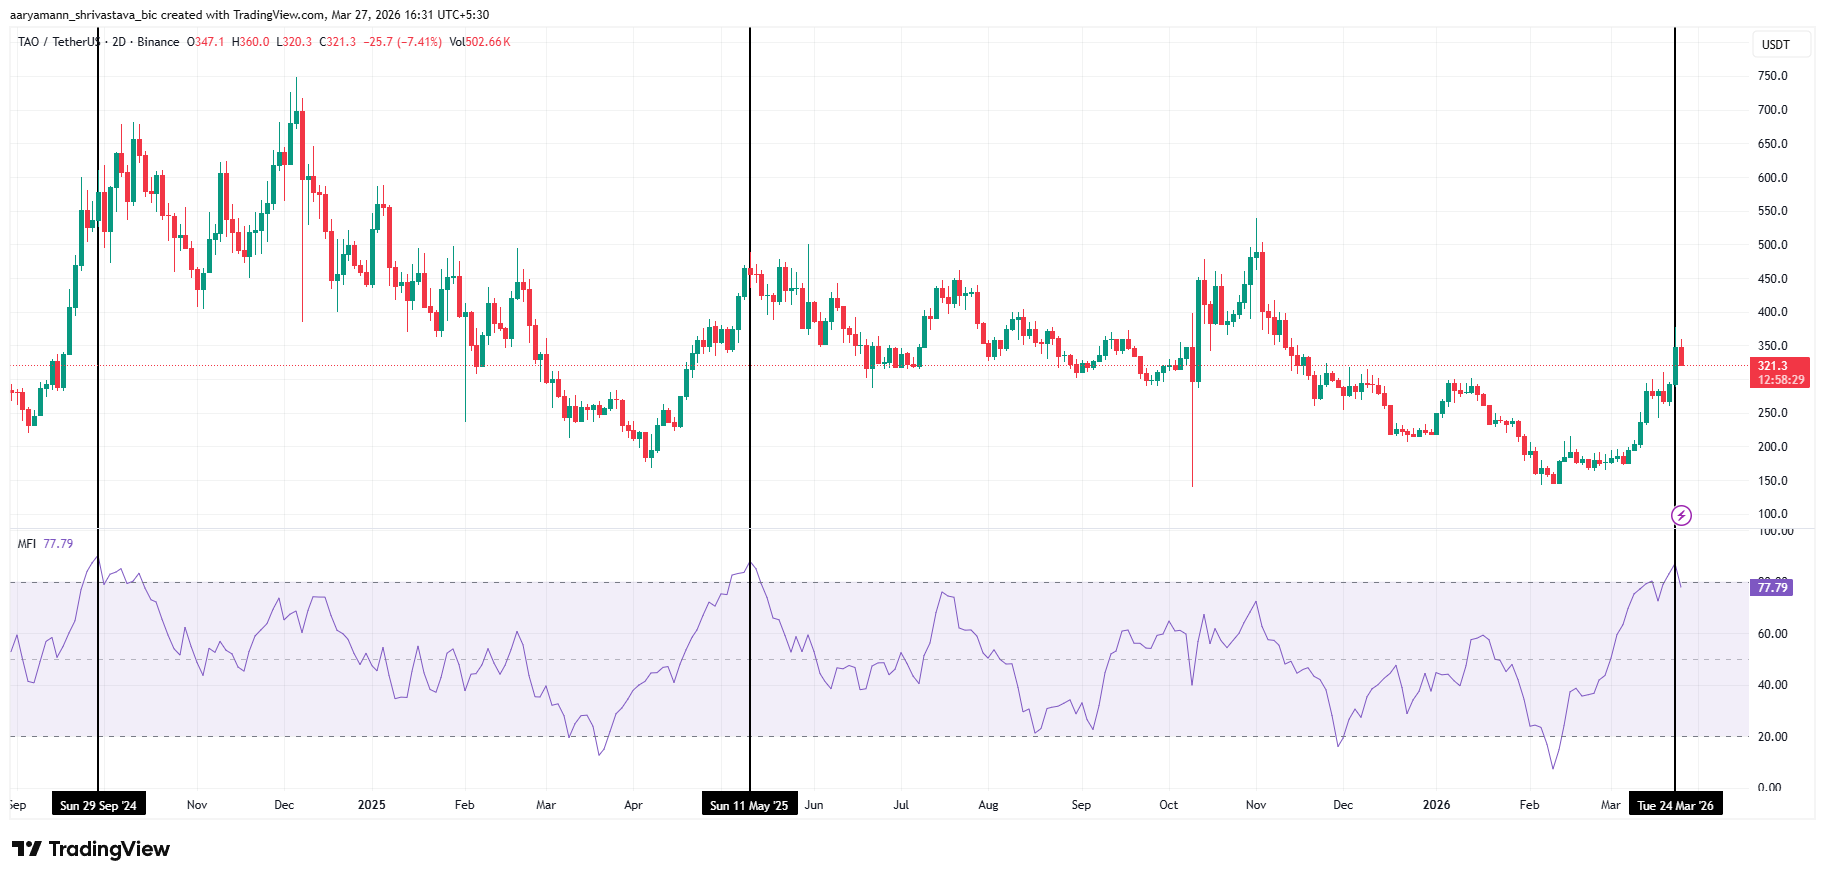
In September 2024, MFI touched the overbought threshold as TAO traded near $700. In May 2025, MFI again reached the same level before the price rolled over from $450 toward $300. The current reading at 77.79 places TAO in identical territory on both occasions that preceded significant drawdowns.
TAO at $322 is above the prior resistance zone. But, a daily close below $306 would confirm the breakout has failed and put the 0.5 level at $275 and then the 0.382 level at $243 in focus as the next support levels.
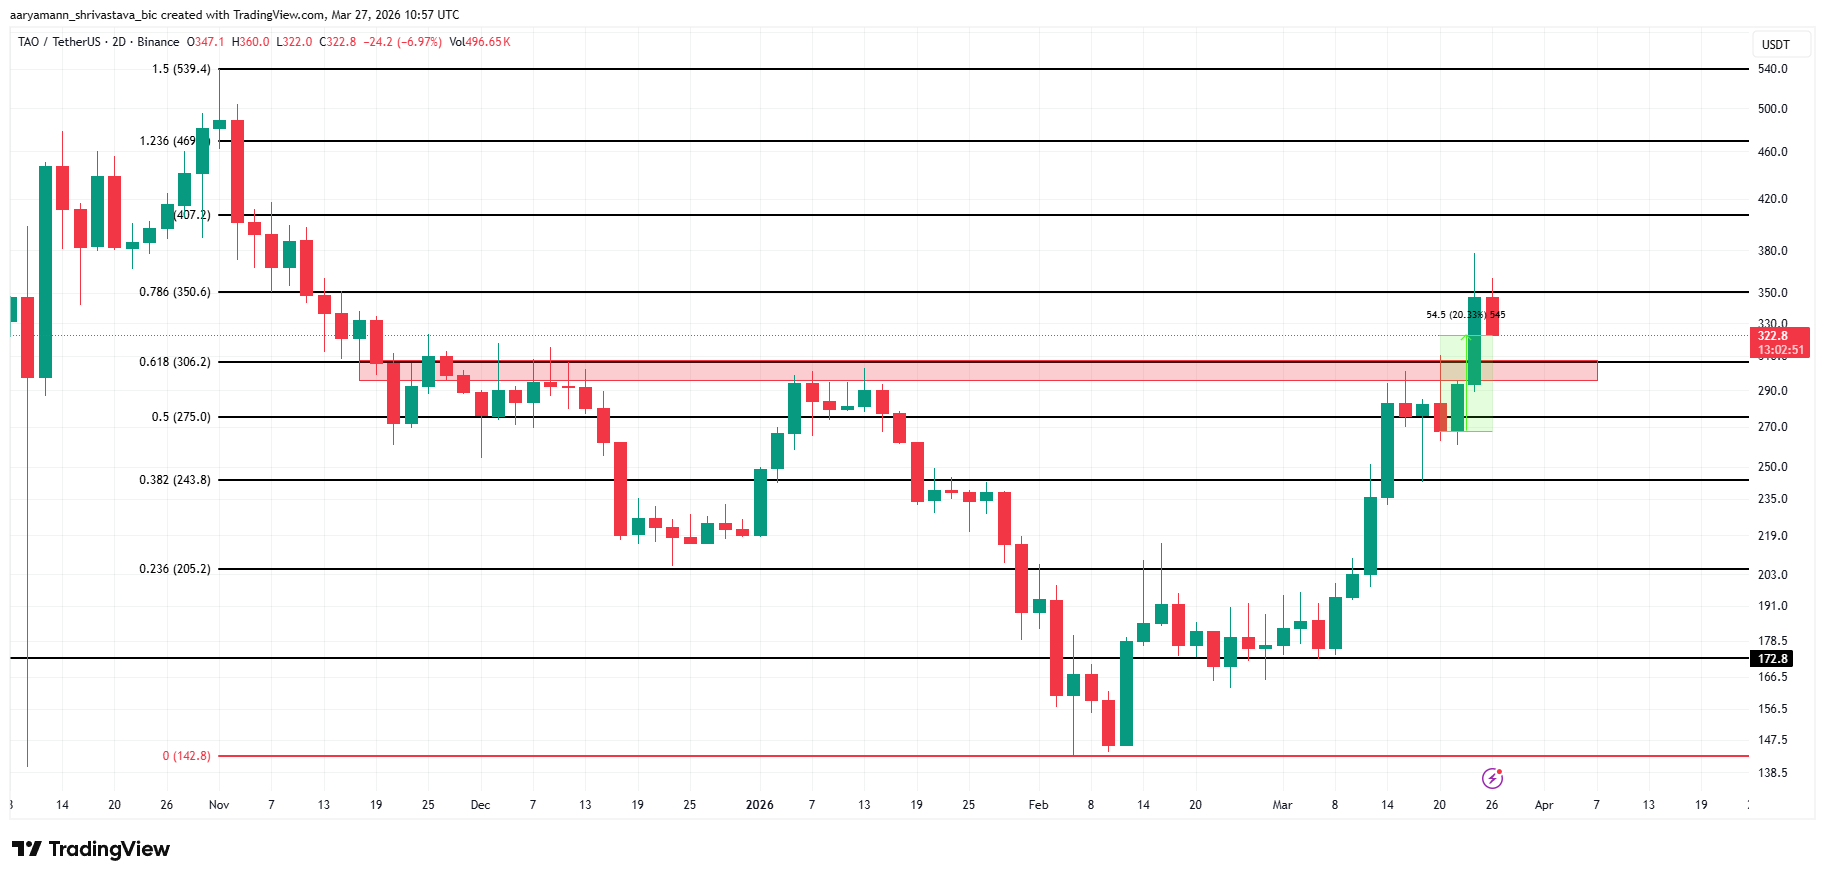
The bullish invalidation requires a 2-day close above $364. That would trigger the $17.81 million short squeeze and mechanically push the price toward the 1.0 level at $407 and then the 1.236 level at $469. Without that close above $364, the four-month resistance zone that TAO just escaped threatens to reclaim the token.
The post Bittensor (TAO) Escapes 4-Month Long Barrier, Yet Price May Not Reach $400 appeared first on BeInCrypto.

Man arrested in plot to firebomb Palestinian activist’s NYC home

Russian and Iranian foreign ministers discuss possibility of conflict settlement

Bitcoin Traders Bet On Sub-$66K BTC In April Due To Rising Fear


-
 Crypto World7 days ago
NIO (NIO) Stock Plunges 6.5% as Shelf Registration Sparks Dilution Worries
-
 NewsBeat3 days ago
Manchester United reach agreement with Casemiro over contract clause amid transfer speculation
-

 Crypto World6 days ago
Best Crypto to Buy Now: Strategy Just Spent $1.57 Billion on Bitcoin During Fear While Early Investors Quietly Enter Pepeto for 150x Potential
-

 Crypto World6 days ago
Bitcoin Price News: Bhutan Sells $72 Million in BTC Under Fiscal Pressure, but the Smart Money Entering Pepeto Sees What the Market Does Not
-

 News Videos2 days ago
Parliament publishes latest register of MPs’ financial interests
-

 Sports4 days ago
Remo Stars and Kano Pillars Strengthen Survival Hopes in NPFL
-

 Sports4 days ago
Gary Kirsten Accuses Pakistan Cricket Board Of ‘Interference’, Mohsin Naqvi Responds
-

 Business5 days ago
No Winner in March 21 Drawing as Prize Rolls to $133 Million for Next
-

 Tech5 days ago
Give Your Phone a Huge (and Free) Upgrade by Switching to Another Keyboard
-

 Tech5 days ago
AI enters the chat: New Seattle dating app relies on tech to facilitate meaningful human connections
-

 News Videos4 days ago
Ch 9 Financial Management Part 1 | Detailed One Shot | Class 12 Business Studies Boards 2026
-
Business7 days ago
Columbia Sportswear enters $500 million credit agreement with JPMorgan Chase
-

 Tech6 days ago
Today’s NYT Connections Hints, Answers for March 22 #1015
-

 Business1 day ago
Instagram, YouTube Found Responsible for Teen’s Mental Health Struggle in Historic Ruling
-

 Business6 days ago
Will Duke Basketball Win It All? Duke Basketball Enters Second Round as Third Favorite to Claim NCAA Title
-

 Sports5 days ago
2026 Kentucky Derby horses, odds, futures, preview, date: Expert who hit 12 Derby-Oaks Doubles enters picks
-
 NewsBeat5 days ago
Update on Wisbech river crash as search for teenage boy enters fifth day
-
 Entertainment4 days ago
Cynthia Bailey Dishes on ‘RHOA’ Season 17, Discusses Kandi
-
 NewsBeat2 days ago
Tesco is selling new Cadbury Dairy Milk bar and people can’t wait to try it
-

 Tech4 days ago
Samsung will soon let you control smart home devices from your car’s dashboard
You must be logged in to post a comment Login