

Crypto World
Alibaba (BABA) Stock Surges 8% on Cloud Dominance and AI Revenue Expansion

Quick Overview
- Alibaba shares rallied over 8% on Wednesday following Q4 results, even though profits fell short of analyst projections.
- A diplomatic visit by President Trump to China for discussions with President Xi Jinping boosted confidence in Chinese technology equities.
- The presence of Nvidia CEO Jensen Huang in the U.S. delegation sparked speculation about easing semiconductor trade restrictions.
- Cloud computing revenue surged 38% year-over-year to $6.13 billion, while AI-driven products maintained triple-digit expansion for the 11th consecutive quarter.
- CEO Eddie Wu projected that AI will account for more than 50% of Alibaba’s cloud revenue within the next 12 months.
Alibaba (BABA) shares concluded Wednesday’s session at $145.81, climbing more than 8%, despite delivering fourth-quarter financial results that fell short of analyst consensus estimates.
Alibaba Group Holding Limited, BABA
The e-commerce giant’s shares initially slipped approximately 2% during pre-market hours immediately after the earnings announcement. However, sentiment reversed dramatically once regular trading commenced, fueled by encouraging geopolitical developments and impressive performance in cloud computing and artificial intelligence segments.
Fourth-quarter revenue increased 3% compared to the same period last year. The modest top-line growth reflected substantial capital allocation toward AI infrastructure, cloud platform expansion, and investments in Alibaba’s express delivery operations, which promise one-hour fulfillment for customers.
Despite falling short on earnings, market participants chose to overlook the temporary profitability challenges.
Diplomatic Developments Boost Investor Sentiment
A significant driver behind Wednesday’s stock performance was President Trump’s journey to China for bilateral discussions with President Xi Jinping. The high-stakes diplomatic engagement generated expectations that ongoing trade frictions between Washington and Beijing might begin to thaw.
Adding to the positive atmosphere, Nvidia CEO Jensen Huang accompanied the American delegation. Investors interpreted his participation as a constructive indication regarding potential progress on artificial intelligence chip commerce between the world’s two largest economies — a development that would directly advantage Chinese cloud computing and AI enterprises.
Any relaxation of current semiconductor export controls could provide substantial tailwinds for Alibaba and comparable companies as they continue expanding their AI capabilities.
Cloud Computing and Artificial Intelligence Remain Growth Engines
Cloud segment revenue skyrocketed 38% year-over-year to 41.63 billion yuan, approximately $6.13 billion. Revenue generated from third-party clients expanded 40%.
Artificial intelligence-focused offerings delivered triple-digit percentage growth for an impressive 11th straight quarter. Such sustained performance momentum carries significant weight, even when overall financial metrics disappoint.
During the earnings conference call, CEO Eddie Wu informed analysts that Alibaba is transitioning its AI operations from the development phase into broader commercial deployment. Wu also projected that AI-related services will represent over half of total cloud revenue within the coming year.
The organization recently separated its artificial intelligence operations from the cloud computing division, naming Wu to lead the newly established Alibaba Token Hub business unit.
Bloomberg Intelligence analyst Catherine Lim observed that Alibaba “effectively redeployed more than 90% of its March-quarter China e-commerce profit into Qwen user acquisition and adoption” — a spending trajectory anticipated to persist through fiscal 2027.
Alibaba confirmed its commitment to investing 380 billion yuan ($53 billion) in AI initiatives through 2027.
Management also anticipates its rapid commerce division will achieve profitability by fiscal 2027.
Analyst sentiment toward the stock remains overwhelmingly positive. BABA holds a Strong Buy consensus rating, supported by 15 Buy recommendations and two Hold ratings issued over the past three months. The consensus price target stands at $186.32, suggesting approximately 30% appreciation potential from Wednesday’s closing price.


Bitcoin (BTC) hit week-to-date lows at Tuesday’s Wall Street open as analysis put $65,000 as bulls’ level to beat.
Key points:
- Bitcoin needs to revisit $65,000 for bulls to take charge, says new BTC price analysis.
- Bear market history continues to play out as BTC/USD loses key supports.
- Iran peace hopes see oil fall below $88 for the first time this month.
Bitcoin price copies bear-market history with support losses
Data from TradingView tracked 1.2% BTC price downside on the day as sell-side pressure returned ahead of key US inflation data.
A double rejection at $64,200 put BTC/USD on course for another test of the key $60,000 support level.
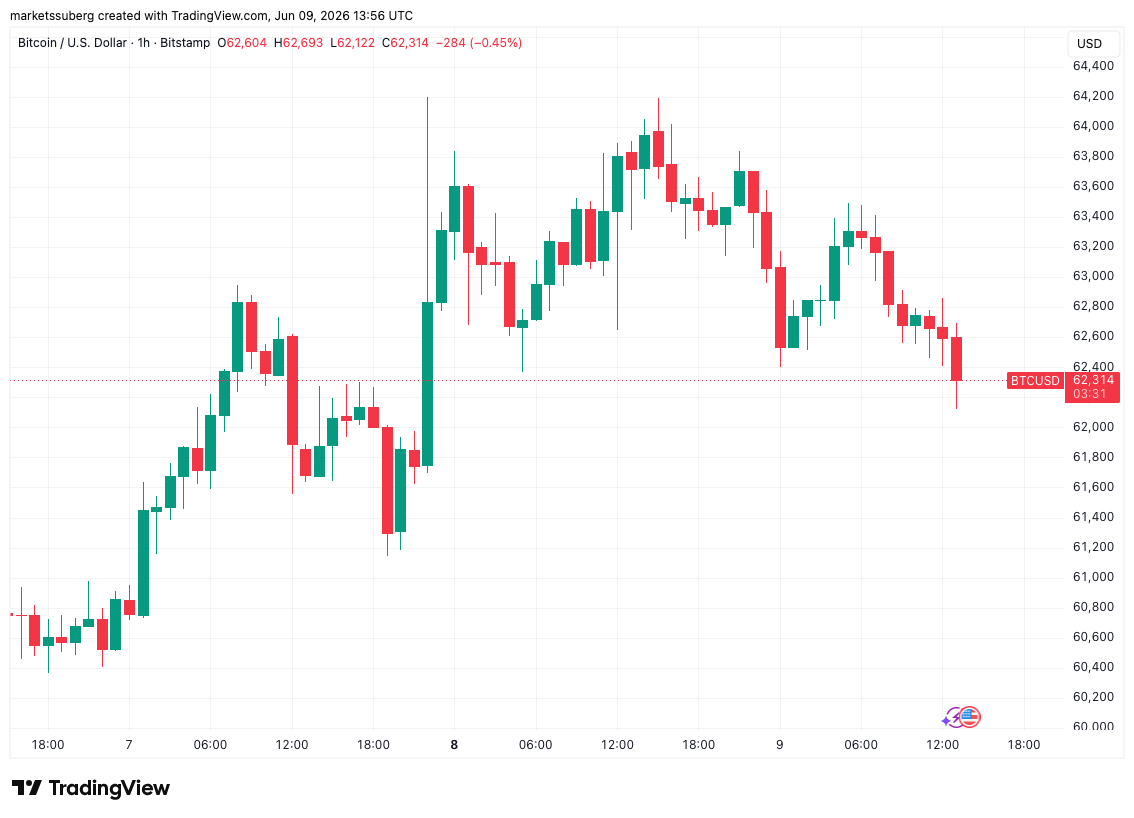
BTC/USD one-hour chart. Source: Cointelegraph/TradingView
Commenting, trader and analyst Michaël van de Poppe said that for bulls to gain the upper hand, they would need to crack $65,000.
“Bitcoin is stalling beneath $65K as breaking that level would trigger a strong run to $72-74K,” he wrote in one of his latest posts on X.
“The $65K support level was the previous level of support after the crash early in February and is now acting as the resistance to break through.”
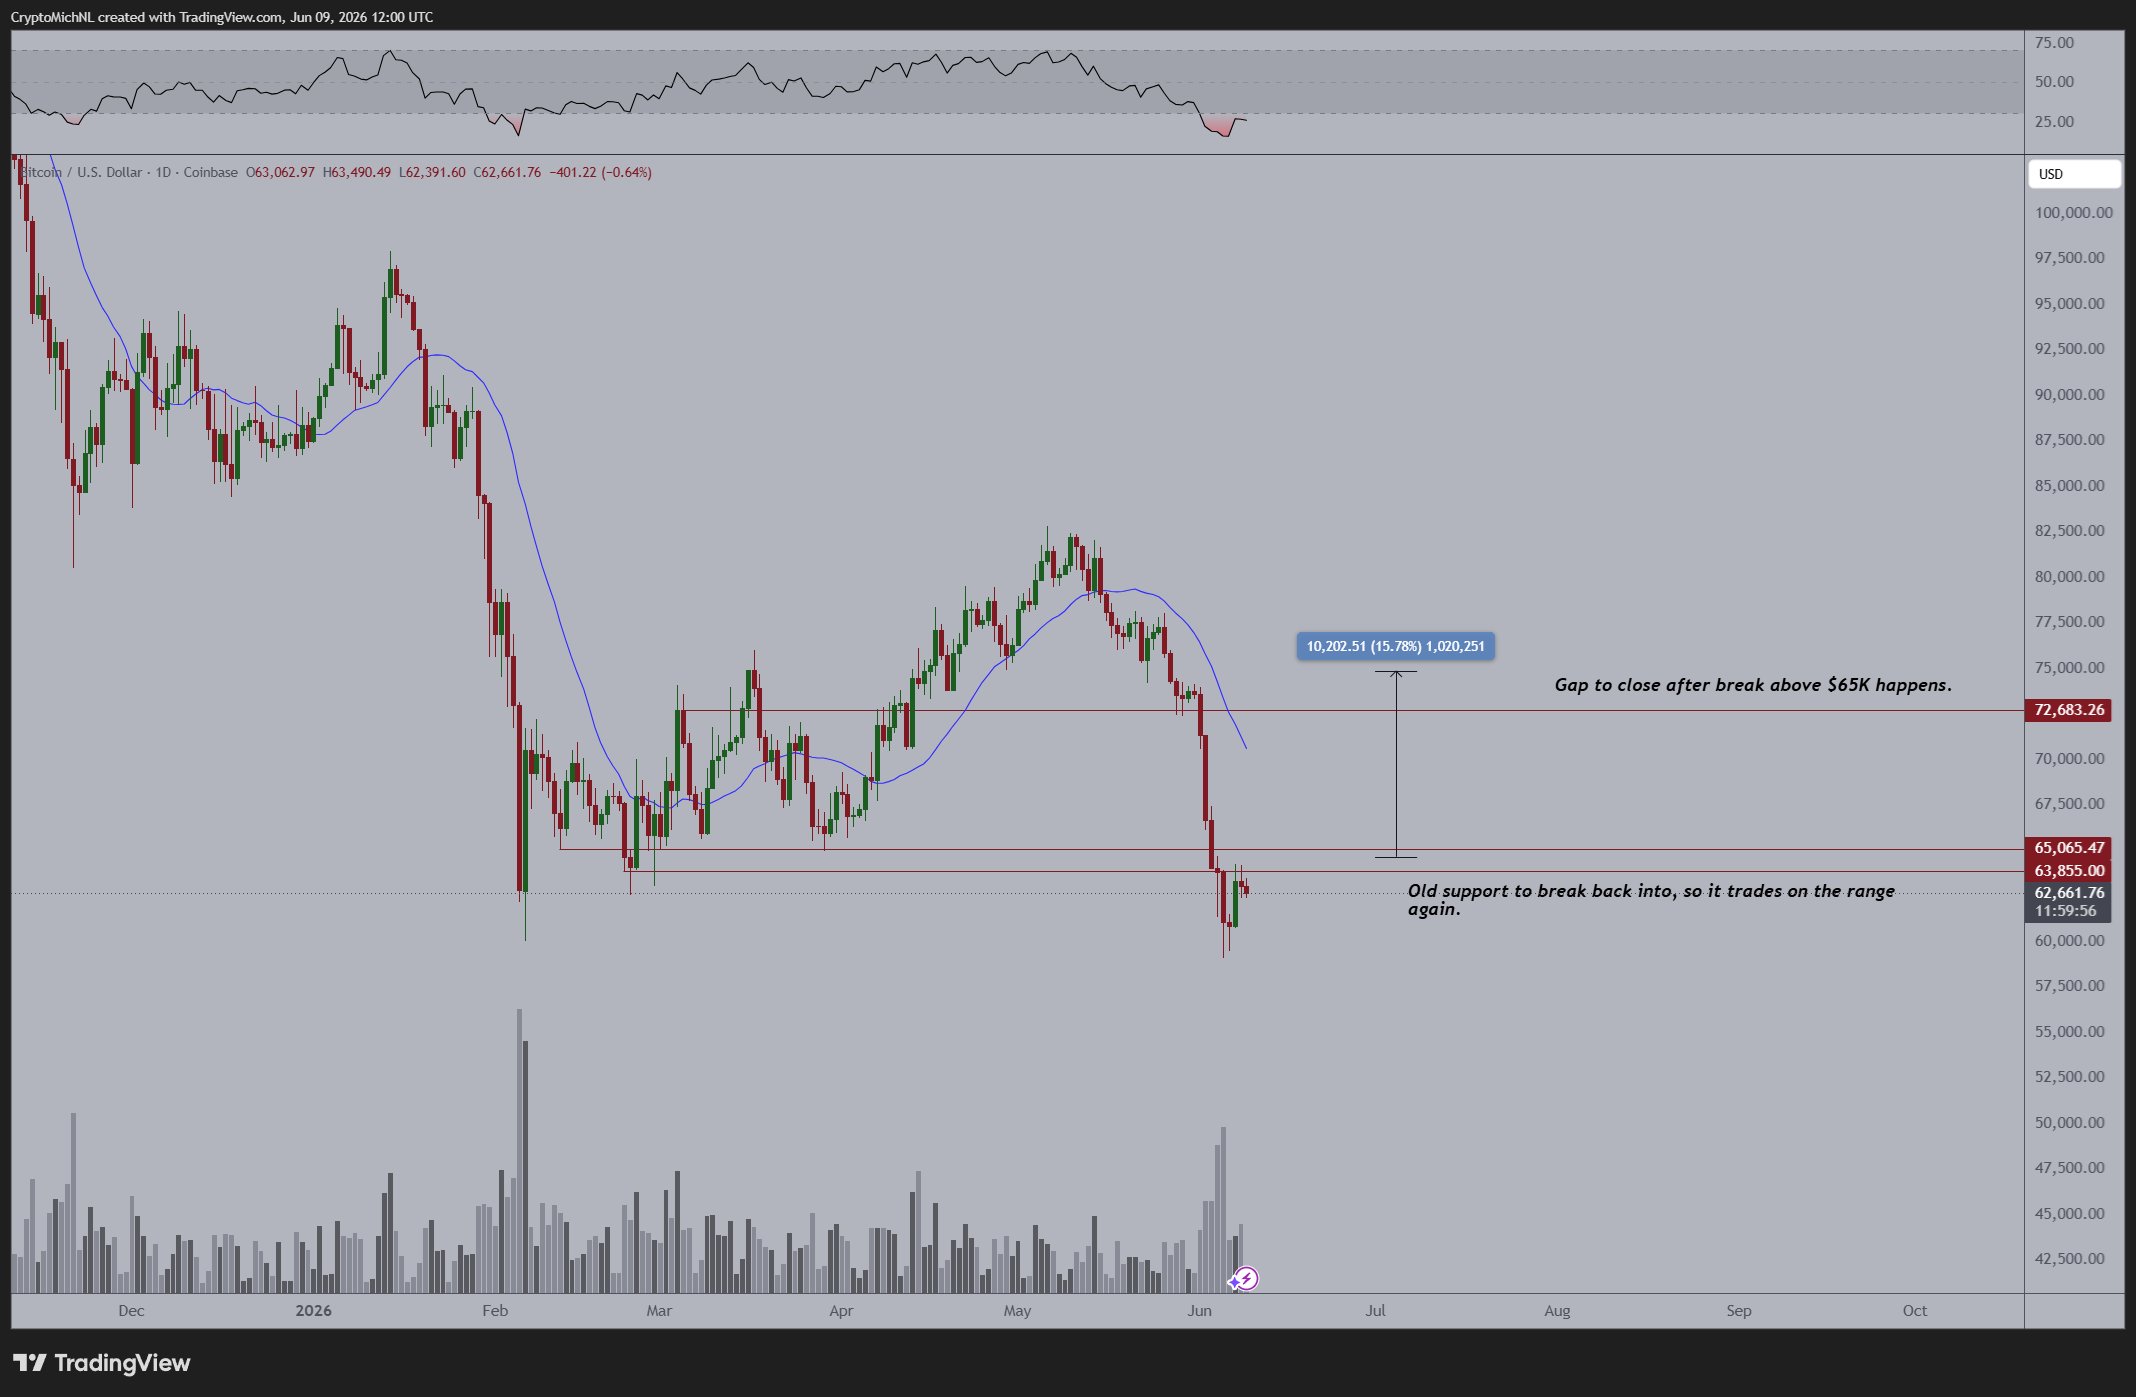
BTC/USD one-day chart. Source: Michaël van de Poppe/X
Van de Poppe called into question the validity of Bitcoin’s latest macro lows, which took the market to $59,100 last week.
“I don’t think it will take long before the markets will be doing this, as the recent selloff was relatively irrational,” he added.
In an update on the bear market, trader and analyst Rekt Capital flagged two more key similarities between current BTC price action and the road to previous cycle lows.
BTC/USD, he noted, had lost both its 50-month exponential moving average (EMA) and the support of a triangle construction — just like in 2018 and 2022.
“Now Bitcoin needs to fully confirm this breakdown to enter additional Bearish Acceleration to the downside,” he told X followers.
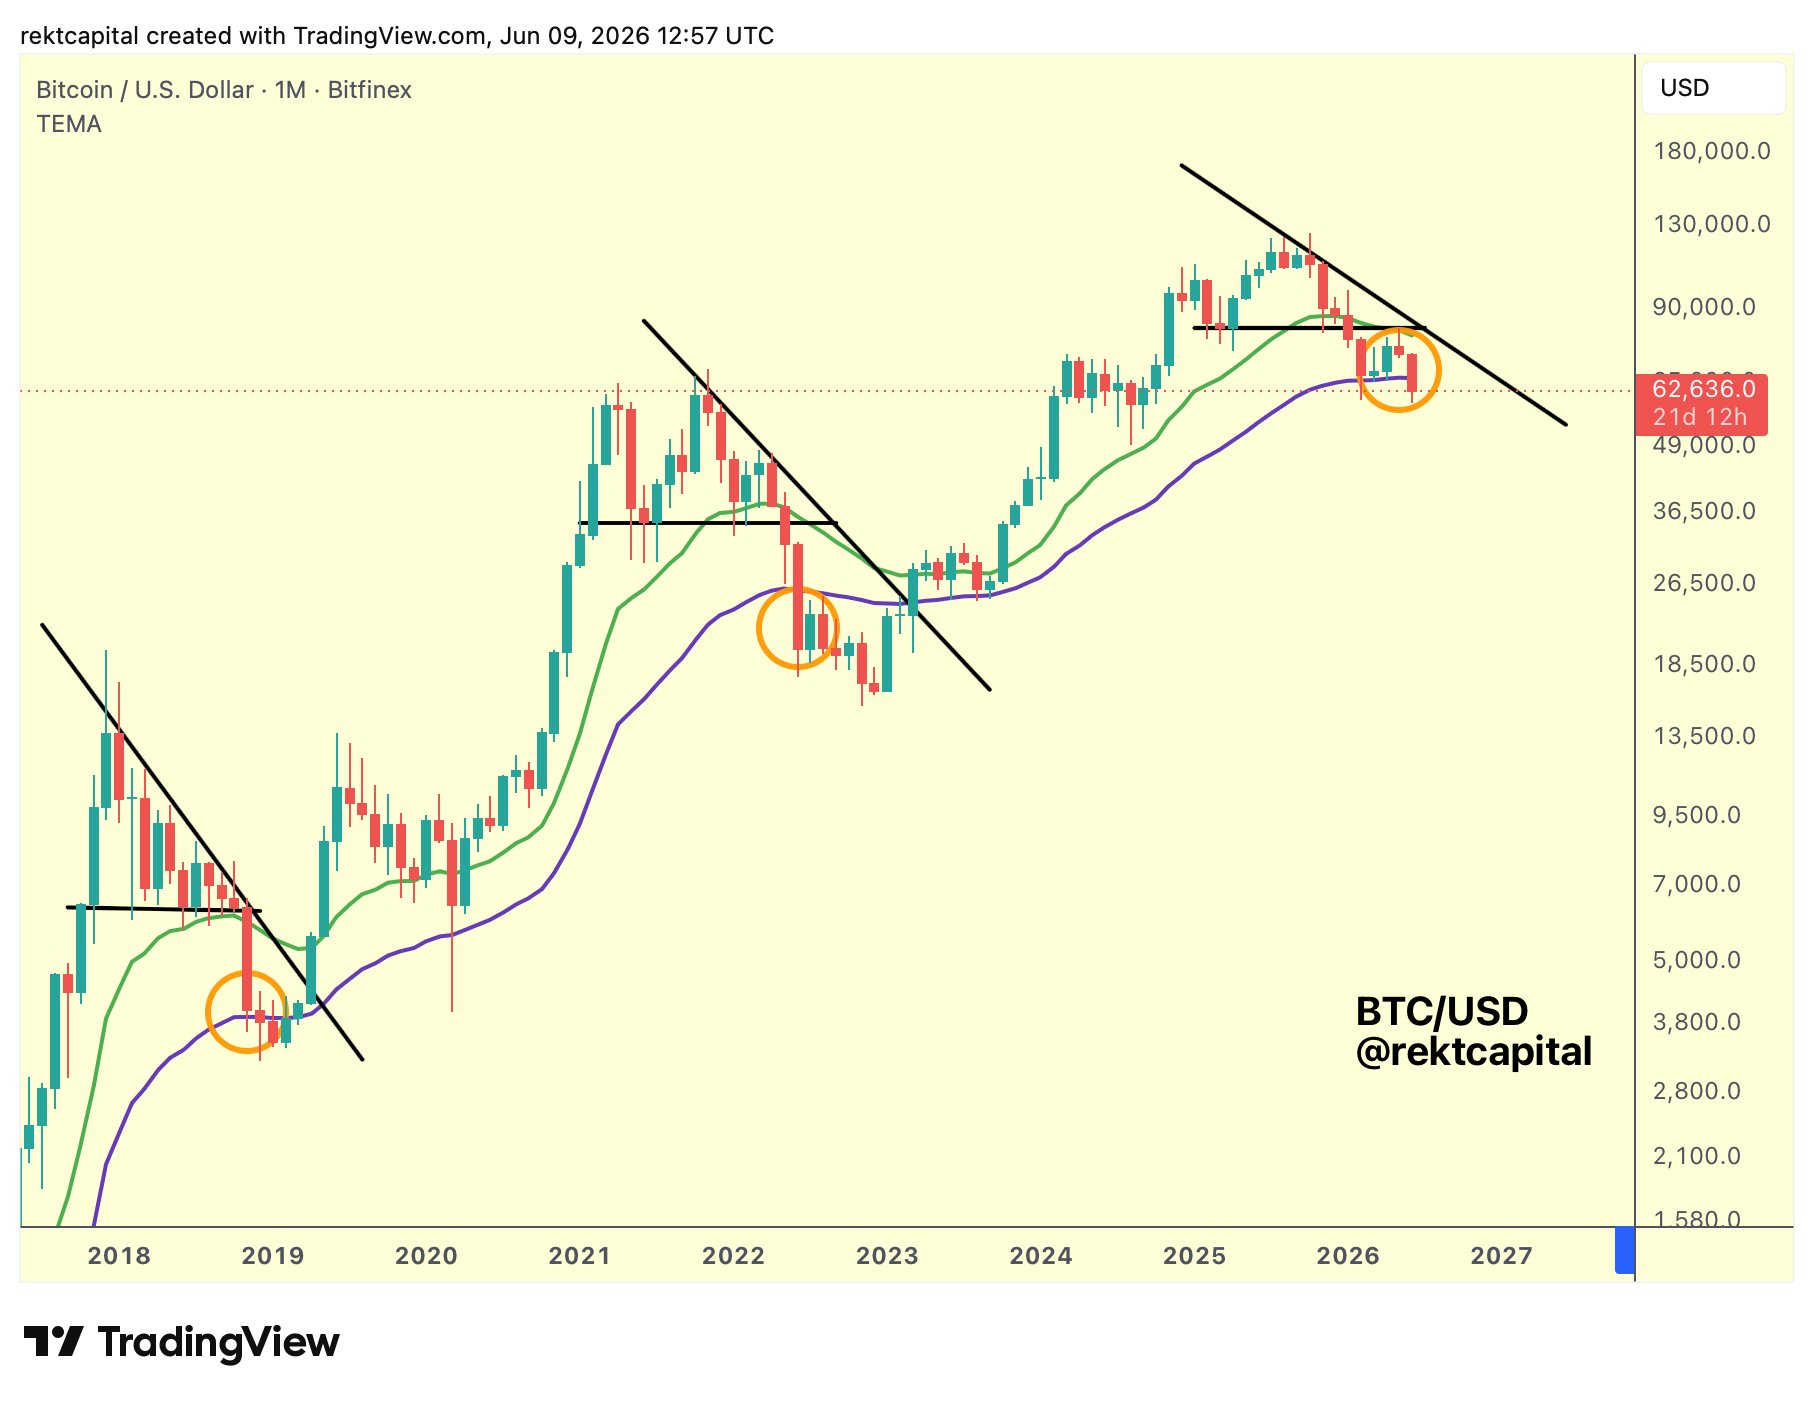
BTC/USD one-month chart with 21, 50 EMA. Source: Rekt Capital/X
Oil falls to June lows on new Iran peace momentum
Bitcoin once again diverged from US stocks on the day, heading lower while both the S&P 500 and Nasdaq Composite Index opened up by nearly 1%.
Related: Bitcoin ‘normal’ 4-year cycle puts focus on $53K low before 2028 BTC price high
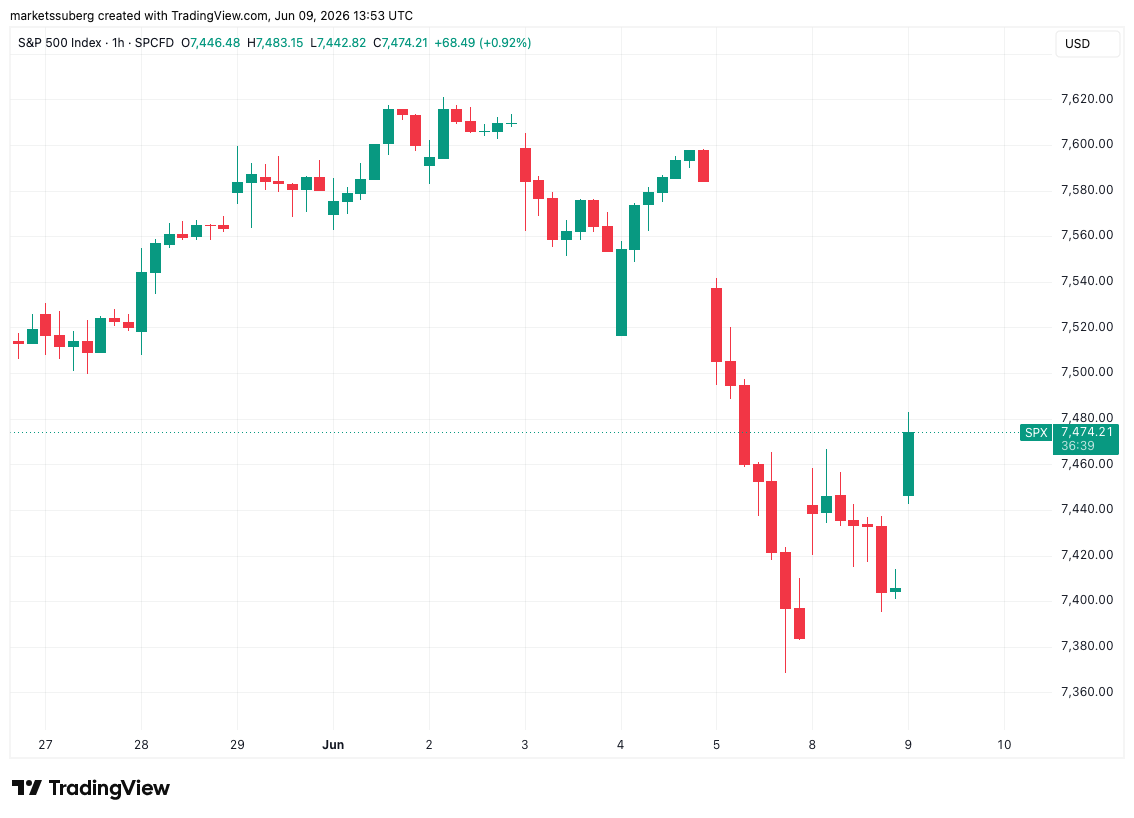
S&P 500 one-hour chart. Source: Cointelegraph/TradingView
This helped alleviate an initial drop at the start of the week after Asian markets came under pressure from a tech-stock rout.
Oil prices, meanwhile, also fell as hopes of a US-Iran peace deal steadily reemerged.
“It’ll be a total victory,” US President Donald Trump said in a telerally for Republican Senator Lindsey Graham on Monday, quoted by Al Jazeera and others.
“It’ll happen very soon, and oil prices will come tumbling down.”
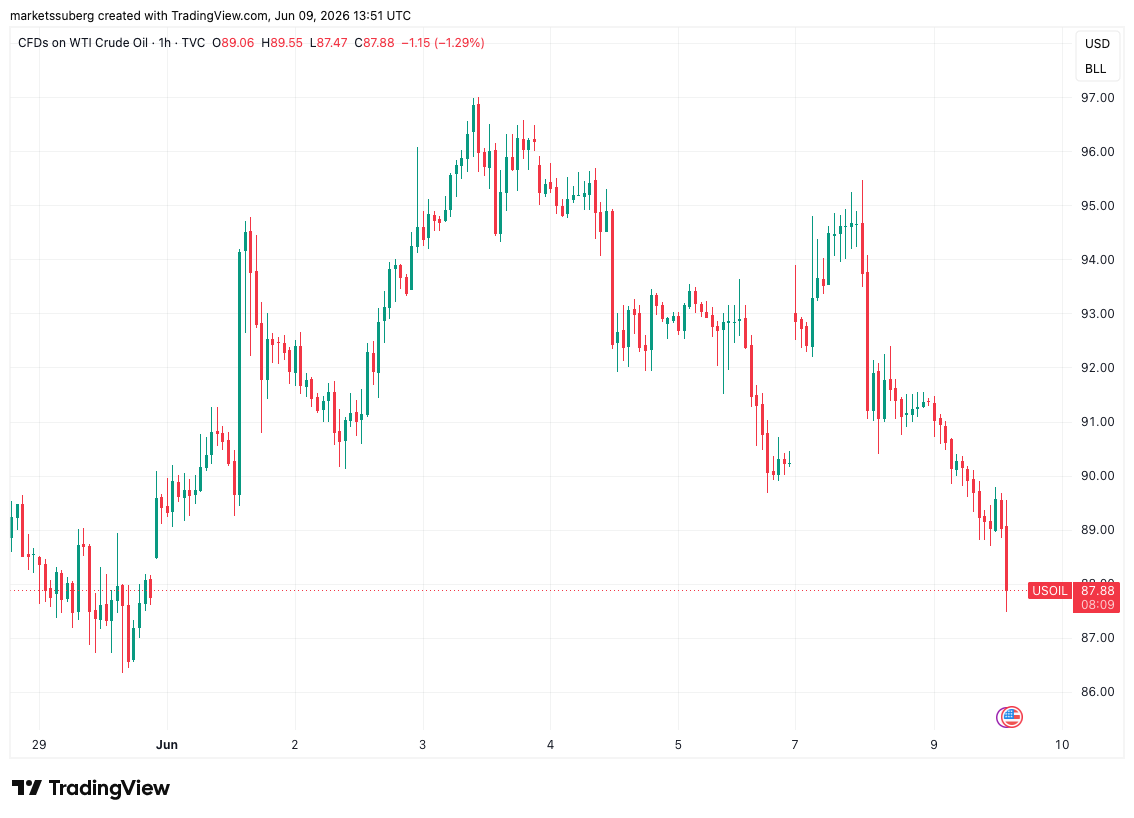
CFDs on US WTI crude oil one-hour chart. Source: Cointelegraph/TradingView
WTI crude dropped under $88 per barrel, reaching its lowest level since May 29.
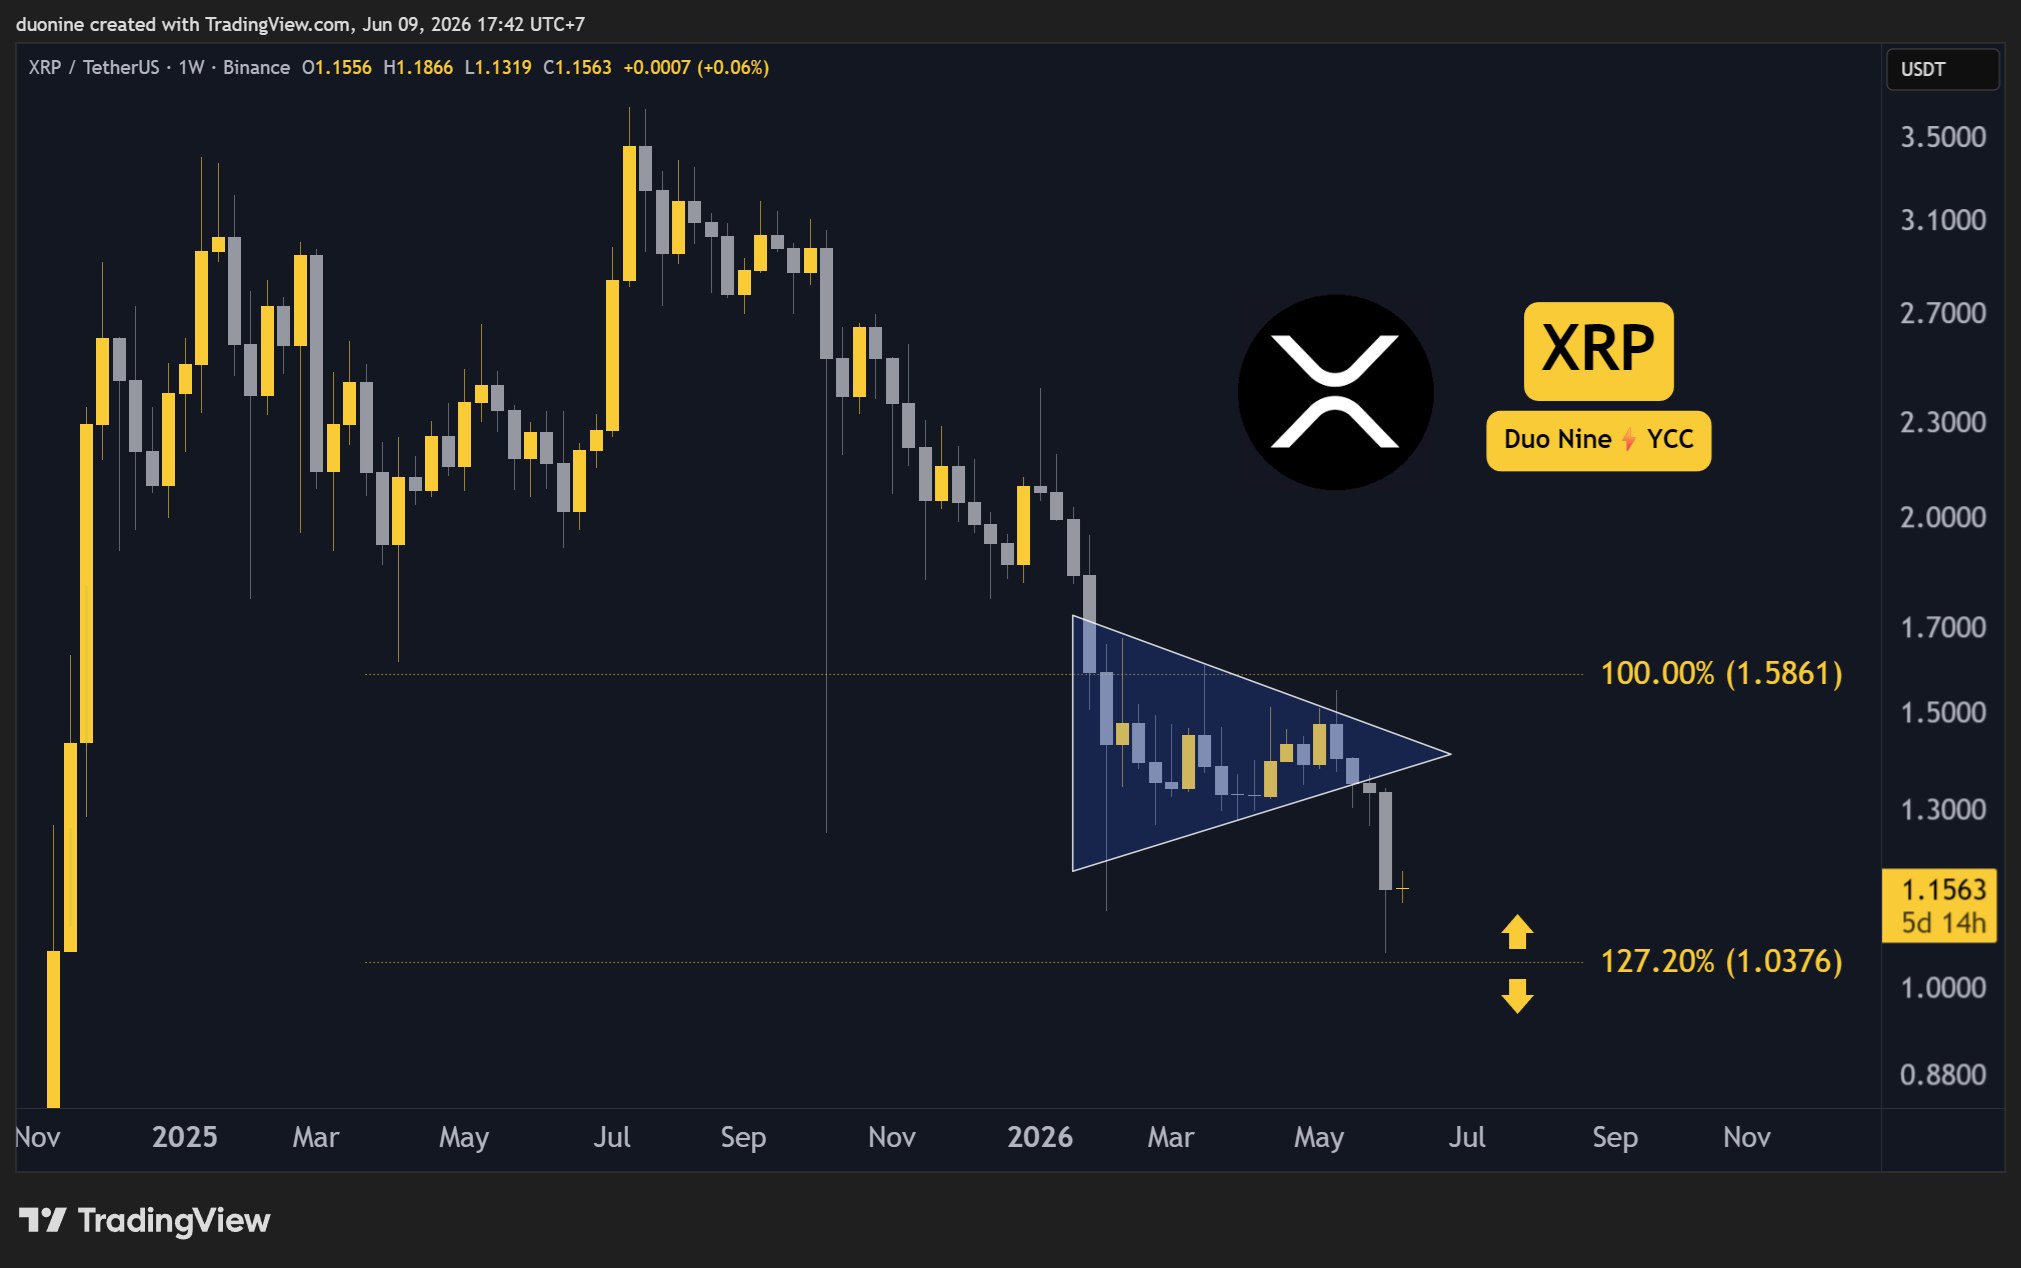
XRP is down 8% on the weekly chart as bears just tested support at $1.
Ripple (XRP) Price Predictions: Analysis
Key support levels: $1
Key resistance levels: $1.4, $1.6, $2
Price Hits $1
In the past week, XRP fell to $1 after sellers took over the price action. After testing this key psychological level, this cryptocurrency entered a short-term bounce that briefly rallied to $1.18.
Given that XRP made a lower low and the downtrend was reconfirmed, there is a high chance the current support will come under significant pressure in the future. Any weakness there could see buyers retreat even lower, with the next target for sellers found at $0.80.
Sell Volume Increases
With this latest move, the sell volume made a higher high not seen since early February when the price nearly hit $1 as well. This reconfirms the bearish bias because it shows sellers have conviction.
The biggest question is if XRP can hold here or if it’s just a matter of time before $1 also turns into resistance as the price seeks lower levels to attract buyers. However, this could take some time since the chart looks oversold right now.

Daily RSI Oversold
With this latest price drop, the daily RSI reached oversold territory after falling below 20. This suggests that sellers may have become greedy here and could be punished with a more sustained bounce before they regain control.
The moving average on this indicator is also falling. This suggests the RSI could reach oversold levels again later. If at that point it makes a higher low, that could signal a major reversal will follow.

The post Ripple (XRP) Price Predictions for This Week (June 9) appeared first on CryptoPotato.


Arthur Hayes published a macro thesis Monday arguing that Bitcoin's next major rally will not begin until AI stocks collapse, because the capital wave funding data-center construction and three pending mega-IPOs has absorbed the very liquidity Bitcoin requires to advance. In a lengthy essay titled… Read the full story at The Defiant

Bitcoin price extended its decline on Tuesday after U.S. President Donald Trump announced a military response against Iran, triggering a broader risk-off move across global markets and adding fresh pressure to an already fragile crypto sector.
Summary
- Bitcoin price fell to an intraday low of $60,892 after Trump ordered a military response against Iran.
- More than $664 million in crypto positions were liquidated as traders reduced risk exposure.
- Glassnode says over 8 million BTC are now underwater while ETF outflows and extreme fear continue to weigh on sentiment.
According to data from crypto.news, Bitcoin (BTC) price fell to an intraday low of $60,892 on June 9 before recovering slightly to trade around $61,813 at press time. The bellwether asset remained down 3% over the past 24 hours, while weekly losses widened to 14% as traders continued reducing exposure to risk assets.
Trump’s Iran response triggers risk-off move across markets
The latest wave of selling followed a sharp escalation in tensions between Washington and Tehran. In a June 9 Truth Social post, Trump said an American Apache helicopter patrolling the Strait of Hormuz had been shot down and declared that the United States “must, of necessity, respond to this attack.” U.S. Central Command subsequently launched retaliatory strikes against Iran.
Iranian Deputy Foreign Minister Kazem Gharibabadi disputed the accusation, saying Iranian forces had not intentionally targeted the aircraft and suggesting the incident occurred amid heightened military activity in the region.
The exchange has raised fears that the fragile ceasefire established earlier this year could unravel, increasing the risk of a broader regional conflict.
Markets quickly shifted into defensive mode following the developments. Gold price climbed 1.8% as investors sought traditional safe-haven assets, while concerns about potential supply disruptions pushed WTI crude oil prices up 3.5%. Equity markets also weakened, with both S&P 500 and Nasdaq futures trading lower as investors moved away from higher-risk assets.
The selloff accelerated across crypto derivatives markets as leveraged positions were forced to close. According to CoinGlass data, total liquidations reached $664.86 million over the past 24 hours. Bitcoin traders accounted for $124.22 million of those losses, highlighting the intensity of the decline.
Derivatives data suggests some speculative excess has been flushed from the market. Bitcoin open interest slipped 0.25% to $45.13 billion as traders reduced leverage and risk exposure. While the decline was relatively modest, it indicates participants remain cautious amid heightened uncertainty.
ETF outflows and extreme fear deepen Bitcoin’s decline
Beyond the geopolitical shock, Bitcoin continues to face pressure from weakening institutional demand. Data from SoSoValue shows U.S. spot Bitcoin exchange-traded funds have suffered heavy outflows in recent weeks, with investors withdrawing roughly $4.4 billion between May 15 and June 8. The sustained capital flight points to a broader decline in institutional risk appetite toward Bitcoin.
The absence of fresh capital entering the market has become a growing concern for analysts. As per a report by crypto.news, trading firm Wintermute warned that current conditions make it difficult to identify a durable market bottom because inflows remain insufficient to absorb ongoing selling pressure.
The firm noted that Bitcoin’s volume profile contains a significant liquidity gap between $50,000 and $59,000, potentially leaving the asset vulnerable to sharp moves lower if support levels fail.
On-chain metrics also point to increasing stress among investors. According to Glassnode, nearly half of Bitcoin’s circulating supply was in profit at the cycle peak. Following the recent correction, however, more than 8 million BTC are now underwater.
“Today, that figure has fallen sharply as over 8M BTC sit underwater, highlighting the scale of the recent market reset.”
Investor sentiment remains deeply negative despite Bitcoin’s rebound from intraday lows. The Crypto Fear & Greed Index rose slightly to 10 from 8 a day earlier but remained firmly in the “Extreme Fear” zone, underscoring persistent concerns over macroeconomic uncertainty, ETF outflows, and escalating geopolitical risks.
With institutional demand weakening, leverage being unwound, and geopolitical tensions adding another layer of uncertainty, traders are closely watching whether Bitcoin can hold above key support levels in the days ahead.
A sustained break below the recent intraday low of $60,892 could expose the psychologically important $60,000 level, while Wintermute’s identified liquidity gap between $50,000 and $59,000 suggests downside risks could accelerate if sellers regain control.
Below that zone, the next major support area sits near $50,000, a level that could attract renewed buying interest after the recent market reset.
Disclosure: This article does not represent investment advice. The content and materials featured on this page are for educational purposes only.

TLDR
- Polymarket traders price a 60% chance of a June 9 Claude Mythos release.
- Cumulative Polymarket odds rise to 92% for release by July 31.
- Kalshi’s “Before July 1” contract stands at 43% probability.
- Total prediction market volume exceeds $2.2 million across platforms.
- Anthropic restricted the Mythos preview to about 50 vetted partners.
Prediction markets on Tuesday showed a 60% chance that Claude Mythos becomes public by June 9. Polymarket traders also priced a June 10 release at 19% while assigning 11% odds to no launch by June 30. Combined trading volume across related contracts has surpassed $2.2 million as rumors of an imminent rollout circulate online.
Anthropic Timeline Odds Diverge Across Platforms
Polymarket’s single-day contract placed a 60% probability on a June 9 release. In contrast, traders assigned 19% odds to June 10 and 11% to no release by June 30. That contract recorded $42,212 in trading volume by Tuesday morning.
A broader Polymarket market tracking cumulative odds showed higher confidence. Traders priced an 81% chance of release by June 10 and 86% by June 12. The probability rose to 89% by June 15 and 90% by June 30, while July 31 reached 92%, with $1,578,682 in volume.
Kalshi reflected lower expectations for a near-term launch. The “Before July 1, 2026” contract stood at 43% implied probability after a 30% confidence drop. Traders linked the decline to speculation that Anthropic may release the model under another name such as “Claude Fable.”
Kalshi’s broader “Before October 1” contract held at 73% probability. Total trading volume for that event reached $607,723. Together, prediction markets have accumulated more than $2.2 million tied to the Claude Mythos timeline.
Model Capabilities and Controlled Access
Anthropic introduced Claude Mythos Preview on April 7, 2026, and placed it above the Opus tier. The company restricted access to about 50 vetted partners at launch. Executives cited misuse risks, especially regarding cybersecurity capabilities.
According to a June 8 Axios report, the model can convert a new vulnerability into a working exploit in 31 minutes. Security researchers previously required weeks to complete similar tasks. Under Project Glasswing, partners reported identifying over 10,000 high or critical vulnerabilities between April and May.
Anthropic stated in a May 28 Reuters report that it planned to release Mythos “in the coming weeks.” The company also launched Claude Opus 4.8 as its flagship general-purpose model. A May 22 Project Glasswing update said the firm expects public release “once we’ve developed the far stronger safeguards we need.”
On June 1 and 2, Anthropic expanded Project Glasswing access to ENISA and about 150 organizations. These groups spanned more than 15 countries and included power, water, and healthcare operators. As of Tuesday morning, Anthropic’s newsroom and @AnthropicAI account showed no public release announcement.
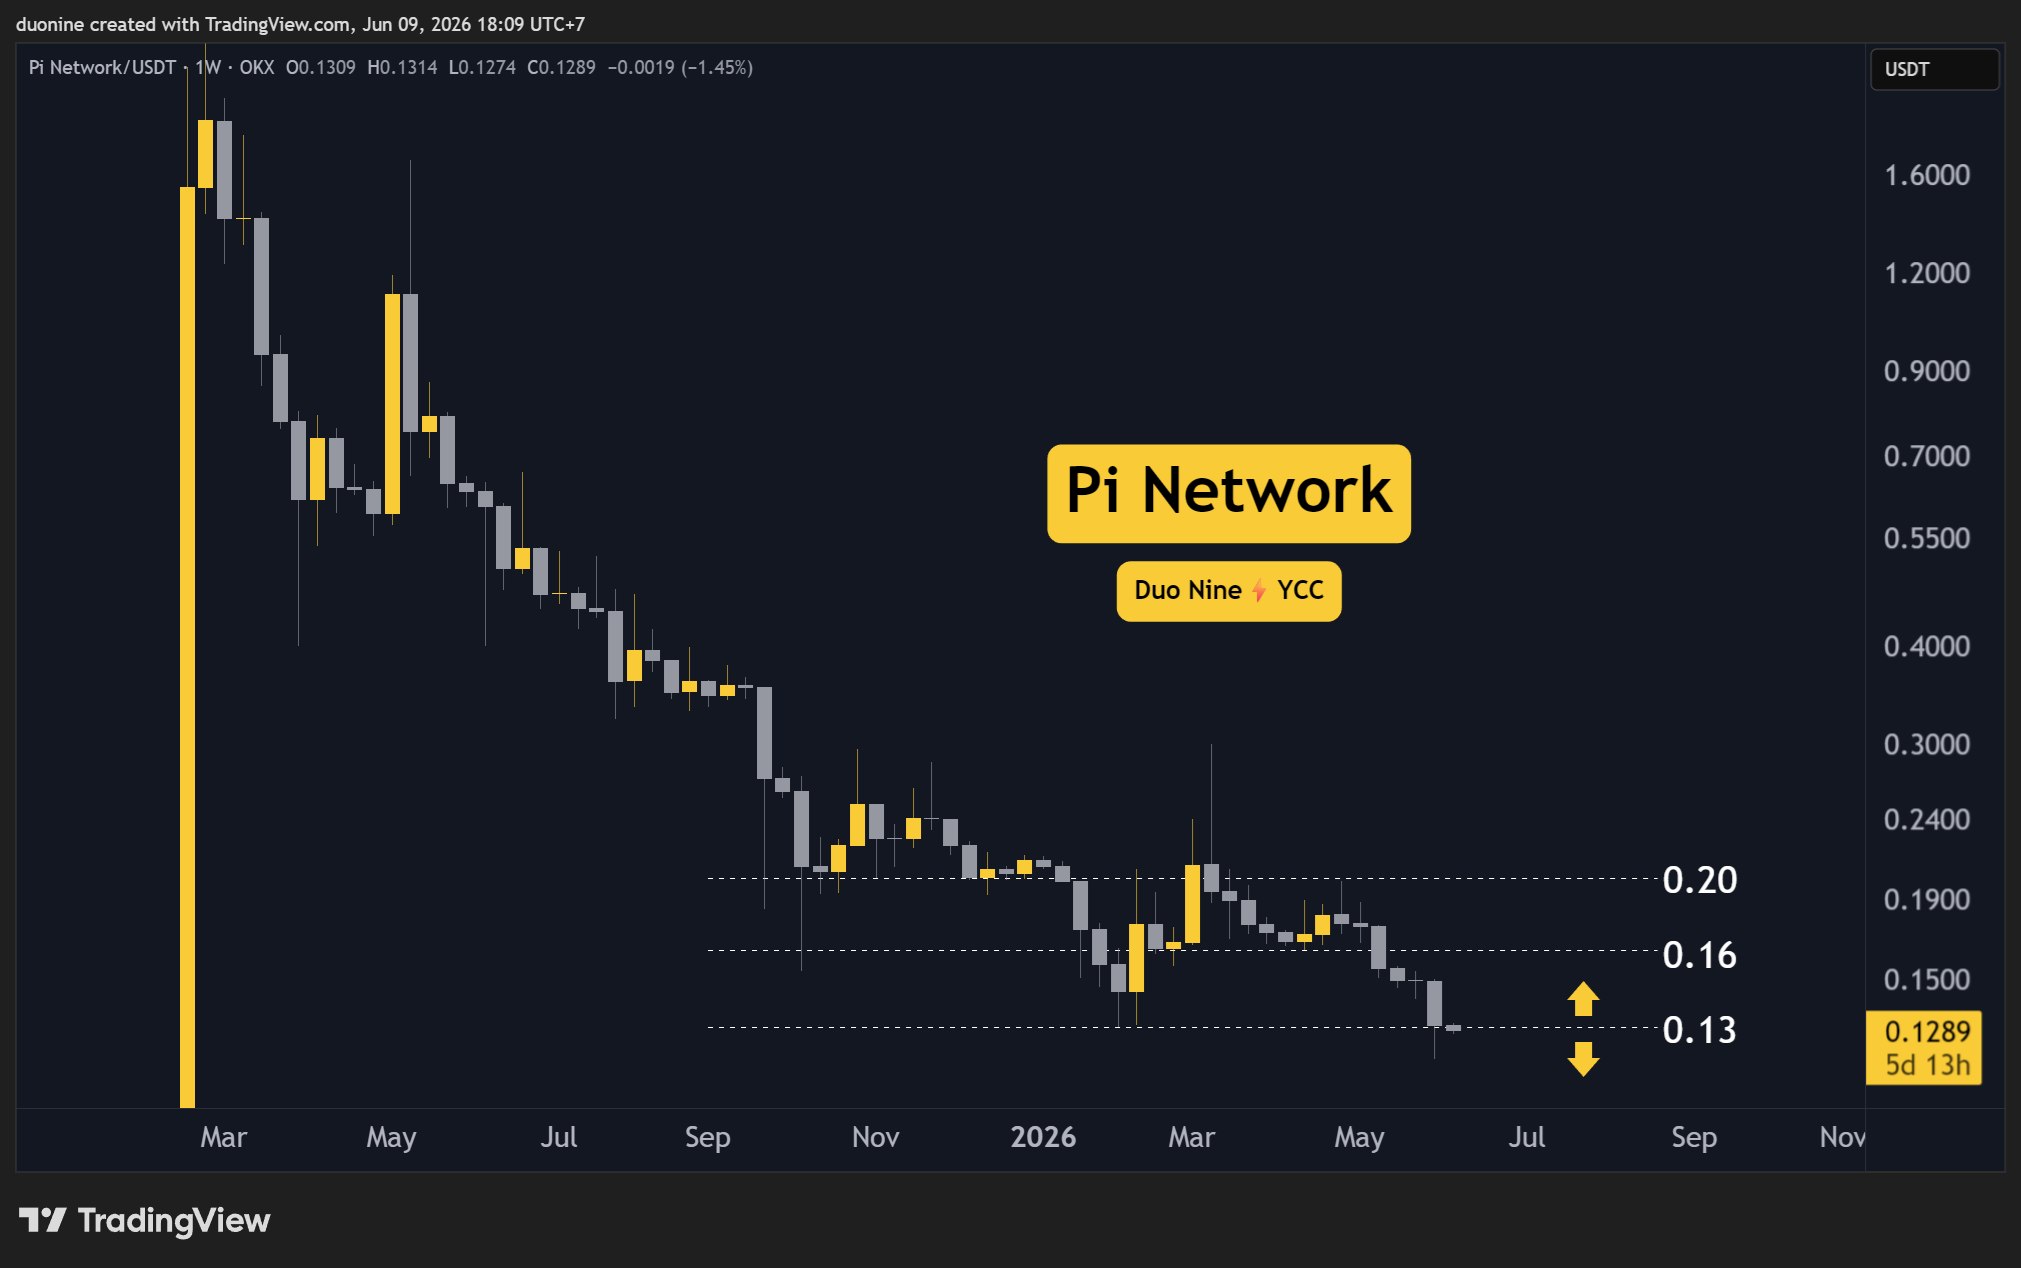
PI crashed another 10% this week and lost support at $0.13.
PI Network (PI) Price Predictions: Analysis
Key support levels: $0.10
Key resistance levels: $0.13, $0.16
PI Loses Key Support
After some hesitation, PI could no longer hold at $0.13 and fell under this level, which is currently acting as key resistance. If nothing changes in the coming days, this cryptocurrency will make new lows again.
The most likely target for sellers is 10 cents, which will act as a magnet for the price. This means buyers will have a tough time going forward, especially if they fail to reclaim $0.13.
Bearish Momentum Intensifies
Another concerning development is evident in the volume profile, which has seen sustained selling with higher highs since mid-May. This peaked last week when the price broke below $0.13.
Buyers returned somewhat earlier this week, but they only briefly revisited $0.13. At the time of this post, bulls and bears are fighting at this key level, and the winner will decide where PI goes next.

Daily RSI Shows a Bullish Divergence
The only positive aspect of this most recent price action is that the daily RSI made a higher low. This could be interpreted as a bullish divergence that may materialize later. For that to happen, PI has to bottom somewhere under $0.13 and then begin a recovery.
Until then, PI may remain in a downtrend with new lows likely. That could be a good opportunity for buyers, but only if a recovery follows. Otherwise, best to wait this out longer.

The post Why is the Pi Network (PI) Price Down This Week? (June 9) appeared first on CryptoPotato.

Bitcoin’s recent selloff has yet to establish a durable market bottom as institutional demand remains absent and capital continues to leave spot Bitcoin ETFs, according to a new market note from Wintermute.
Summary
- Wintermute says Bitcoin’s recent decline reflects a lack of institutional demand rather than isolated market events.
- Spot Bitcoin ETFs extended a 13-session outflow streak, shedding roughly $4.37 billion since mid-May.
- CryptoQuant data suggests capitulation may be approaching, with 50% of Bitcoin supply now sitting at a loss.
According to data from crypto.news, Bitcoin (BTC) traded near $61,828 on Tuesday, down 3.18% over the past 24 hours and more than 14% over the past week after falling to its lowest level since September 2024. The broader cryptocurrency market also remained under pressure, with total market capitalization dropping 2.8% to $2.21 trillion.
According to CoinGlass data, more than $1.78 billion in leveraged positions were liquidated over the past day as long traders absorbed most of the losses. Total crypto derivatives open interest stood at around $103.5 billion, while daily futures trading volume reached $173.8 billion.
According to the latest weekly note from algorithmic market maker Wintermute, the recent correction differs from previous pullbacks because institutional demand continues to deteriorate rather than stabilize. The firm argued that the market remains vulnerable to further downside as large buyers have yet to return in meaningful size.
Wintermute said attention surrounding Strategy’s sale of 32 BTC between May 26 and May 31 has overshadowed the broader issue facing the market. While the transaction itself was relatively small, the firm believes the real driver of weakness has been a retreat by U.S. institutional investors that previously helped fuel Bitcoin’s rally earlier this year.
ETF flows continue to point lower
Wintermute’s concerns are reflected in spot Bitcoin ETF flows, which have experienced persistent redemptions over the past several weeks.
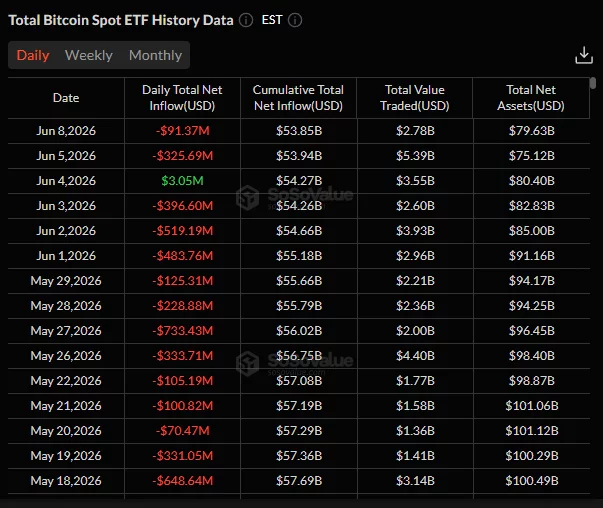
Data from SoSoValue shows U.S. spot Bitcoin ETFs recorded a net outflow of $91.37 million on June 8, reversing the modest inflows seen earlier in the month. Between May 15 and June 3, the funds endured a 13-session outflow streak that erased roughly $4.37 billion from the sector before briefly stabilizing on June 4.

The first week of June alone accounted for approximately $1.72 billion in net outflows. BlackRock’s IBIT led the withdrawals, losing about $1.38 billion, while Fidelity’s FBTC recorded outflows of roughly $201.9 million.
The sustained selling has significantly reduced assets held by the ETF sector. Total net assets across U.S. spot Bitcoin ETFs fell from more than $100 billion in mid-May to approximately $79.6 billion by June 8.
Wintermute also pointed to a negative Coinbase premium and weakening over-the-counter activity as evidence that U.S.-based institutions are reducing exposure. According to the firm, institutional desks have adopted a more cautious near-term stance and are using periods of liquidity to trim positions.
Macro headwinds weigh on risk assets
The firm’s outlook comes as financial markets adjust to stronger-than-expected U.S. economic data. The latest nonfarm payrolls report showed the U.S. economy added 172,000 jobs in May, well above market expectations. At the same time, services-sector inflation accelerated, reinforcing expectations that the Federal Reserve may keep interest rates elevated for longer.
Markets are now assigning roughly a 98% probability that the benchmark federal funds rate remains unchanged through the end of 2026, while the U.S. 10-year Treasury yield has climbed to around 4.57%.
Wintermute said the combination of higher yields and fading momentum in the AI-driven equity rally has reduced investor appetite for speculative assets, including cryptocurrencies.
CryptoQuant sees signs of capitulation
Not all market indicators point to further downside, however. CryptoQuant analyst Gaah recently noted that Bitcoin Supply in Loss MA7D has climbed to 50%, its highest level of 2026. Historically, readings above that threshold have coincided with periods of market capitulation and the formation of major cycle bottoms.
The analyst noted that the last time the indicator reached similar levels was in November 2022, shortly after Bitcoin fell below $20,000 during the post-FTX bear market.
Wintermute acknowledged that some longer-term investors are gradually accumulating Bitcoin at current levels, viewing the correction as an attractive long-term opportunity. Still, the firm maintains that a lasting recovery requires renewed institutional demand.
Looking ahead, Wintermute identified the upcoming SpaceX IPO on June 12 as a potential gauge of broader market risk appetite. Until spot Bitcoin ETF inflows return and institutional buyers re-enter the market, however, the firm argues that a durable Bitcoin bottom remains unconfirmed.
Disclosure: This article does not represent investment advice. The content and materials featured on this page are for educational purposes only.

XRP is sitting on one of the most critical technical levels of this entire correction, with traders now debating whether the token will slip lower or form a clean double bottom and trigger a fresh recovery.
Price projections are coming as Japan’s SBI Shinsei Bank will let customers convert part of their deposit interest into Bitcoin, Ethereum, or XRP.

Why XRP Sits at a Critical Decision Zone
A double bottom is a technical pattern in which the price tests a support level twice and then bounces, signaling a potential trend reversal. XRP is now testing exactly that kind of zone after a long correction phase across the market.
As of early June 2026, XRP traded near $1.09 on major exchanges like Coinbase. That level aligns precisely with the 0.786 Fibonacci retracement, a zone many analysts view as a potential turning point for the next major move.
Analyst EGRAG CRYPTO clearly framed the dilemma. XRP is sitting in a macro decision zone, and a strong monthly close above $1.40 would confirm the bottom is already in near $1.05, as per the broader market structure.
Reclaiming the $1.61-$1.65 zone would signal the start of a true bullish recovery. Failure to hold momentum, however, could open the door to another retest of the $0.80 support level across the coming weeks.
Cryptoanalyst CasiTrades highlighted the importance of the $1.09 test. Key resistance levels to watch include $1.19 and $1.27, with a decisive break higher likely confirming the correction is finally over for XRP.
A clear rejection of those resistances would change the picture. It could pave the way for a deeper move into the $0.90 to $0.85, making the next few daily closes especially important for short-term traders.
The Analyst called this one of the most important moments of the entire correction. The market reaction from here will dictate the next major leg, whether that means a structural recovery or a continuation of the broader bearish trend.
What Other Analysts Expect for XRP
ChartNerdTA echoed the cautious optimism, referencing longer-term structures across the daily and weekly charts. The analyst acknowledged the possibility of a deeper pullback toward the $0.70 to $0.84 range based on previous Gaussian channel projections.
Even with that risk, macro support still shows signs of accumulation according to ChartNerdTA. The current price action is viewed as a potential inflection point rather than confirmed capitulation, leaving room for a constructive setup if buyers defend the level.
“From $1.45 in April to $1.04 in June, $XRP still has the historical 3 month upper regression band that has marked all prior cycle lows in its sights. Reminder: we are now in the territory where placing all our eggs in one basket is a risk,” ChartNerdTA said.
On-chain and derivatives data add another layer to the analysis. Analyst Kripto Messi pointed to XRP Open Interest metrics, noting historical patterns in which OI moving-average crossovers have preceded major corrections, followed by powerful recoveries.
XRP price behavior also remains heavily influenced by broader market liquidity, Bitcoin dominance, and ongoing regulatory clarity.
The token has shown resilience, holding key Fibonacci supports amid macro pressures across the broader corrective structure.
A failure to reclaim the $1.27 to $1.30 resistance soon could embolden bears across the entire crypto market. Bullish confirmation, on the other hand, requires sustained volume, a clear break above near-term resistance, and a shift in overall market sentiment.
Long-term targets discussed by analysts remain ambitious. They range from multi-dollar levels to even double-digit projections, all contingent on breaking out of the current range and confirming a structurally new, sustained uptrend.
SBI Shinsei Bank to Reward Depositors with Bitcoin, Ethereum, and XRP Vouchers
Price projections are coming as SBI Shinsei Bank, a subsidiary of Japanese financial giant SBI Holdings, has announced plans to launch a new service this fall that will allow customers to receive 20% of their deposit interest in the form of vouchers redeemable for Bitcoin (BTC), Ethereum (ETH), and XRP.
According to Nikkei, the program enables depositors to convert a portion of their accrued interest into crypto vouchers, with amounts calculated based on market prices at the time of payout.
To redeem the vouchers, customers must open an account with SBI VC Trade, the group’s licensed cryptocurrency exchange subsidiary. This structure helps the bank maintain regulatory compliance while offering exposure to digital assets.
The initiative reflects SBI Holdings’ long-standing commitment to integrating blockchain and crypto. The group has been a pioneer in Japan through SBI VC Trade and its strategic partnership with Ripple, including the joint venture SBI Ripple Asia, focused on cross-border payments using XRP.
The post XRP Hits Most Critical Level Yet Amid Big Announcement from SBI Shinsei Bank appeared first on BeInCrypto.

Leveraged funds and asset managers have raised combined Japanese yen (JPY) short positions to $11 billion, the highest level since July 2024.
This suggests that investors are betting against the currency despite Japan’s intervention. Short exposure has now climbed for three straight weeks.
Tokyo Spends Massive Sum to Slow the Yen Slide
Short positioning added $5 billion over the three-week stretch. The data points to expectations of further weakness.
The bearish sentiment comes despite Japan’s efforts. The yen’s decline pushed Tokyo to step in recently. The currency slipped past 160 per dollar in late April, the same level that prompted record dollar-selling intervention in 2024.
Between late April and late May, authorities deployed 11.73 trillion yen, or about $73.6 billion. The sum set a record for any month-long stretch and topped the 9.79 trillion yen spent in 2024.
The move worked briefly. On April 30, the yen swung from 160.725, a near two-year low, to 155.50. It moved toward 155 by May 6 before resuming its slide.
The relief faded fast. The yen weakened back toward 160 in early June, pressured further by the Middle East conflict.
Follow us on X to get the latest news as it happens

Rate Gap Keeps Pressure on the Currency
The Kobeissi Letter explained that the wide interest rate gap between Japan and the United States remains the main structural driver. The Bank of Japan holds its policy rate at 0.75%, far below US levels.
That differential rewards traders who borrow cheap yen to buy higher-yielding assets. This strategy, known as the carry trade, has weighed on the yen for years. When those positions unwind, investors often reduce risk exposure, a dynamic that could pressure assets such as Bitcoin (BTC).
Finance Minister Satsuki Katayama signaled that authorities remain prepared to act.
“As for foreign exchange, we continue to maintain our stance that we stand ready to take appropriate action at any time, as needed,” Katayama said.
The Bank of Japan meets on June 16 and may raise its rate to 1%. A hike could narrow the gap and test the conviction behind the record short position.
Subscribe to our YouTube channel to watch leaders and journalists provide expert insights
The post Institutional Investors Drive Yen Short Bets to Highest Level Since 2024 appeared first on BeInCrypto.

The Ether (ETH) futures market saw its open interest (OI) on Gate.io fall by 45% to levels last seen in April 2025. At the same time, nearly 480,000 ETH left Binance, OKX, Gemini and Bitfinex over the past few days, reducing the exchange-held supply.
The combined shift highlights a market with less leverage and declining exchange balances, placing greater focus on the $1,500 support zone, which some analysts view as critical to preventing a deeper move toward $1,000.
Ether open interest falls across exchanges
Ether’s futures market has undergone a broad reset during the recent sell-off. Crypto analyst Amr Taha noted that total ETH open interest across exchanges has dropped 25%, to $12.6 billion from $16.6 billion in May, with several major trading platforms now at levels last seen in April 2025.
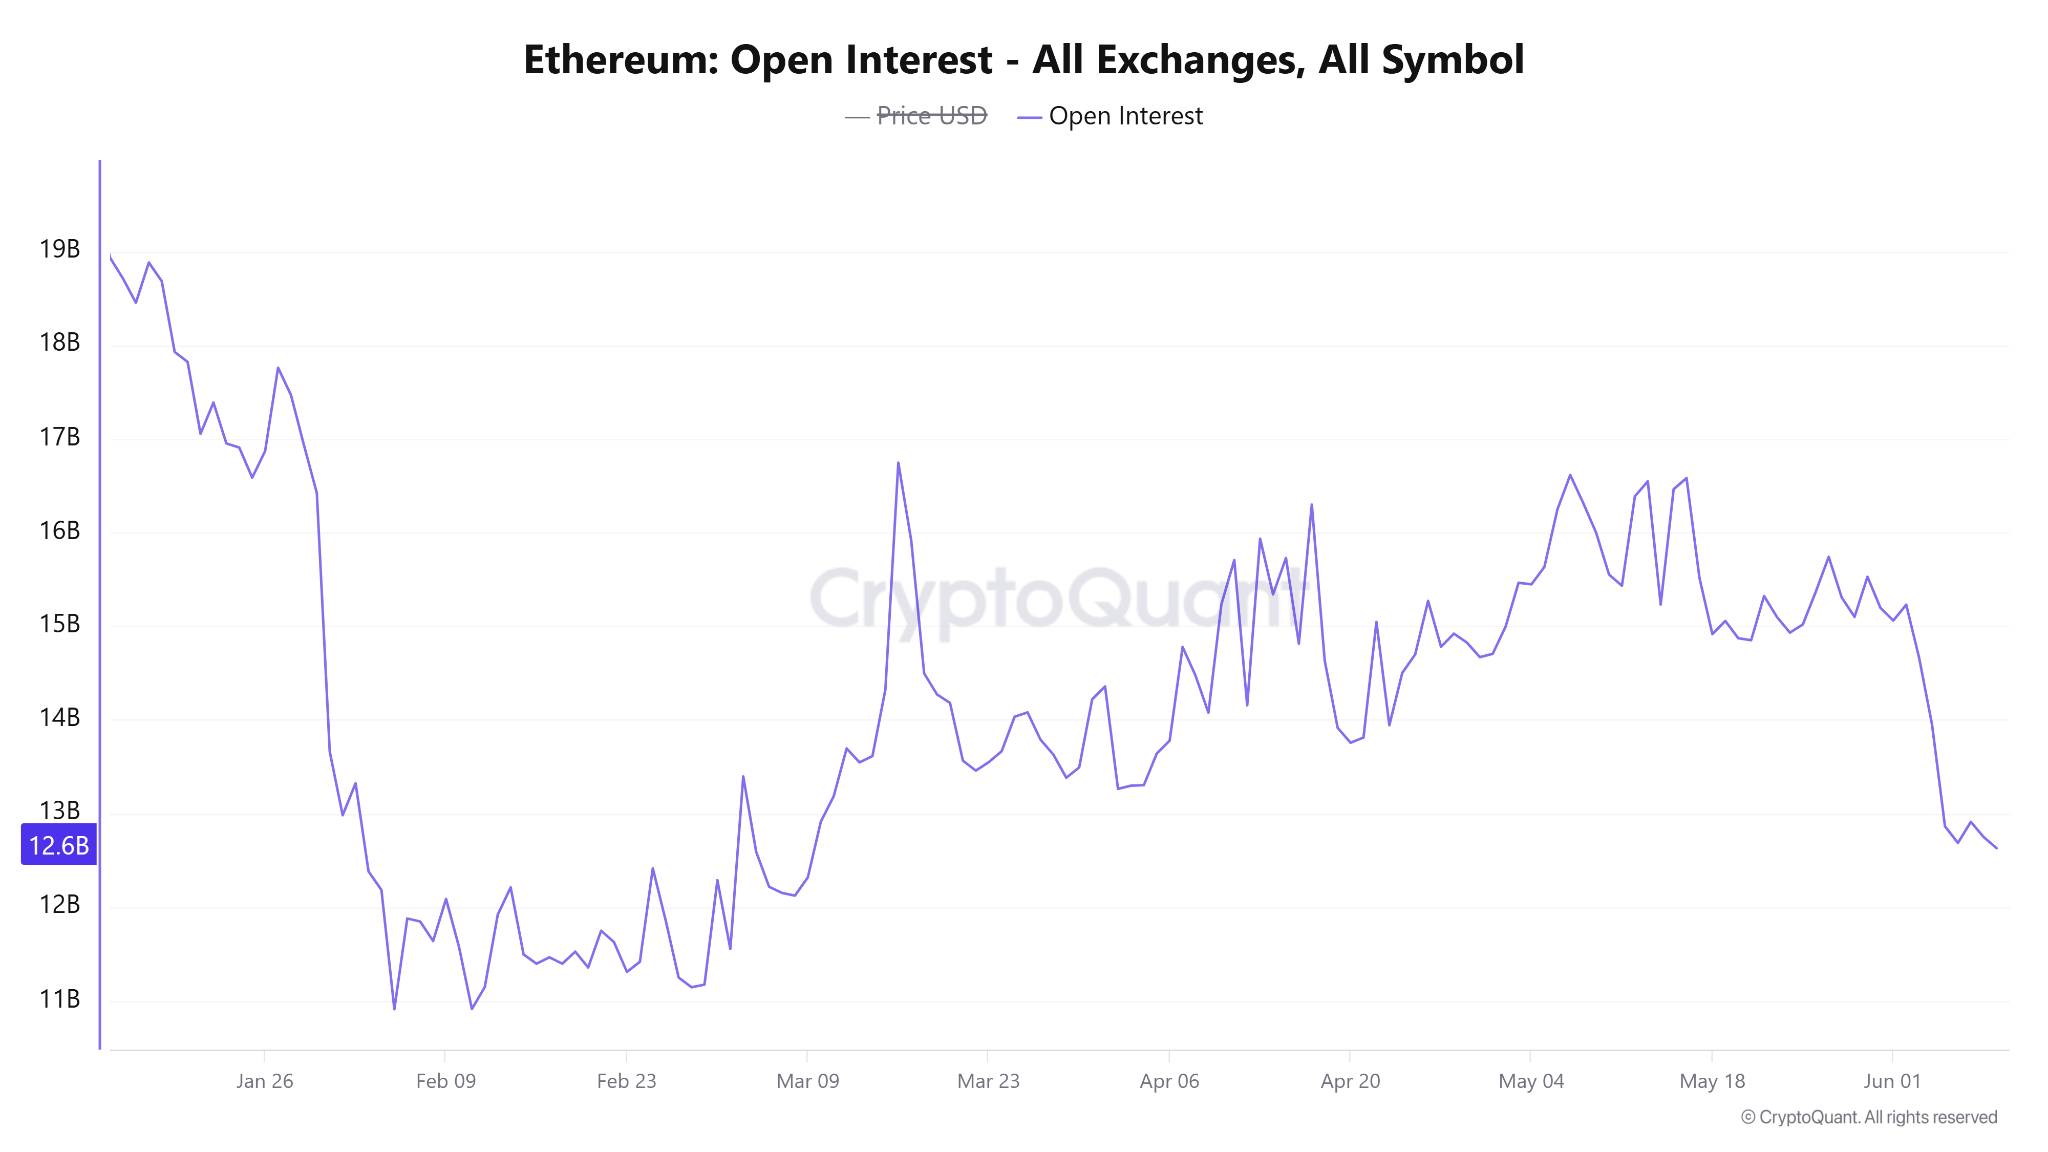
Ether open interest. Source: CryptoQuant
Gate.io recorded the largest decline. ETH open interest fell to $2.68 billion on June 9 from $4.84 billion on May 7, a drop of about 45%. The figure is now nearly identical to the $2.67 billion level recorded on April 11, 2025.
Bybit has followed a similar path. ETH OI currently stands near $805 million, close to the $795 million recorded in early April 2025. The move points to a significant reduction in leveraged positions that accumulated during the latter stages of 2025 and early 2026.
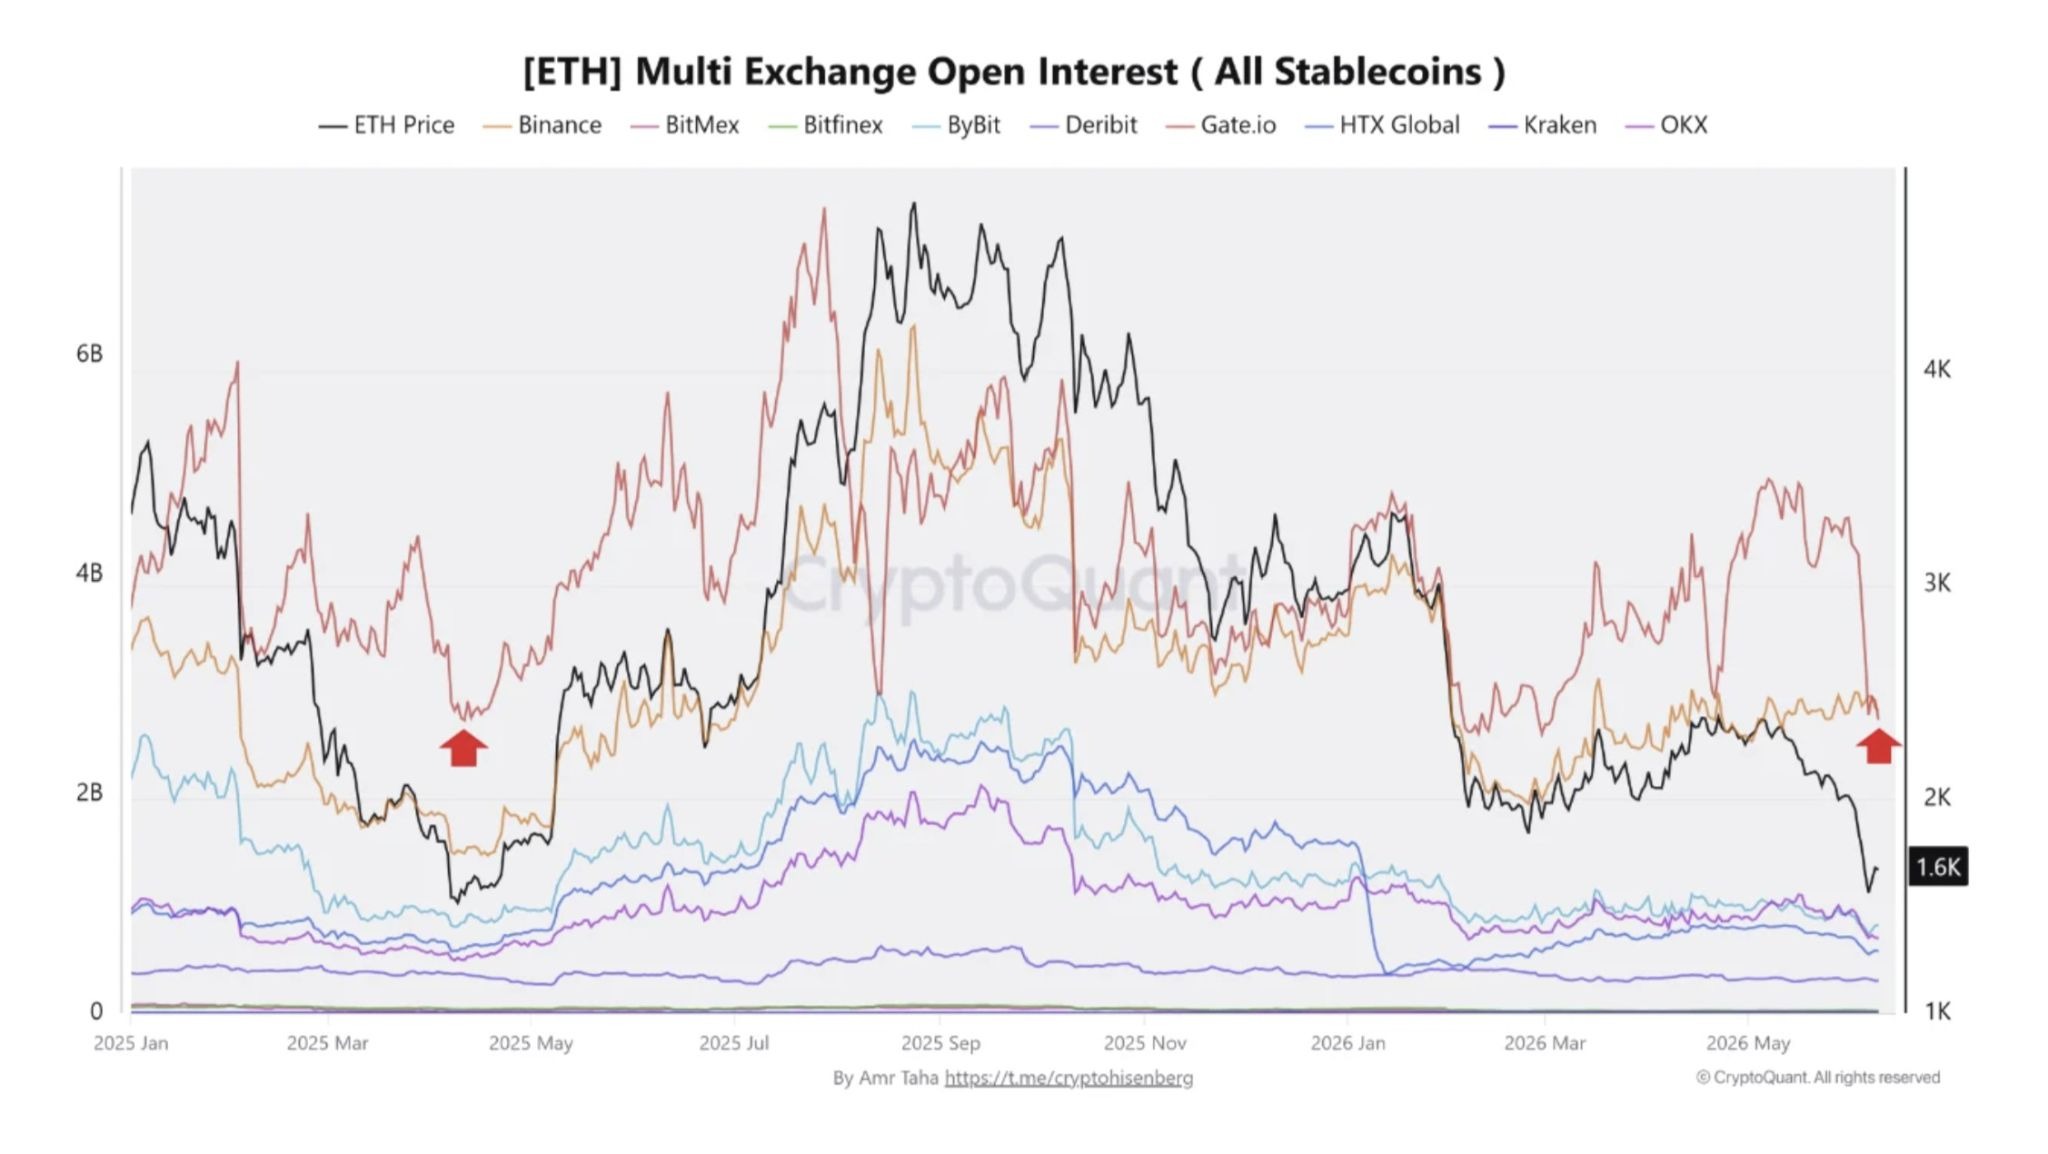
ETH open interest on multiple exchanges. Source: CryptoQuant
However, Binance presents a different picture. ETH open interest remains near $2.76 billion, holding within its recent range. The funding rates have also turned negative on the exchange, with the latest reading near -0.0047, showing short traders are paying a premium to maintain their positions.
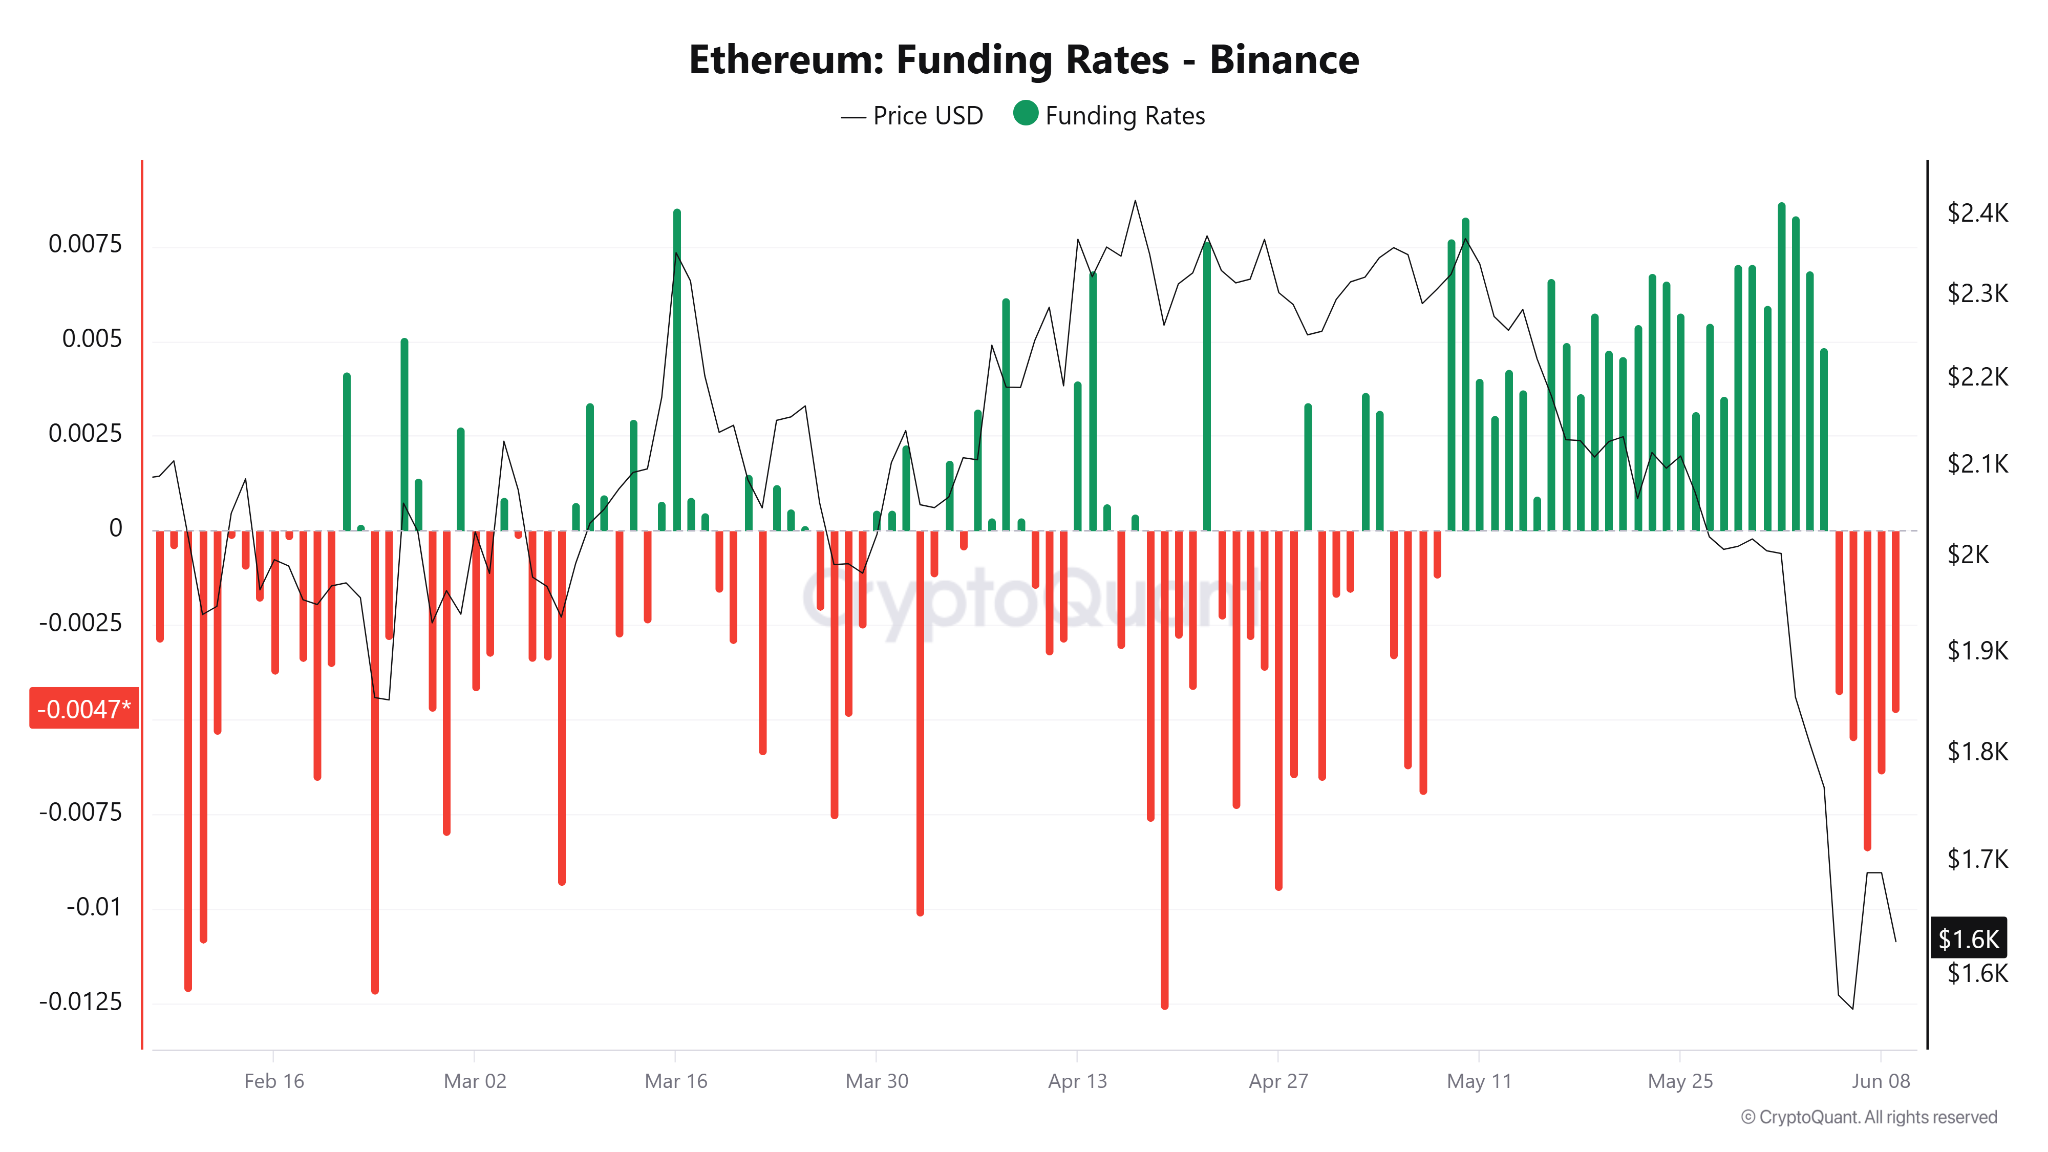
ETH funding rate on Binance. Source: CryptoQuant
The divergence is notable. Gate.io and Bybit have already seen a major leverage reset. Futures traders on Binance remain active, but the negative funding points to a cautious sentiment.
Related: Bitmine boosts Ethereum treasury to 5.54M ETH, nearing 5% supply target
ETH supply drop meets key support at $1,500
Ether exchange reserves also posted a notable decline in early June. Across Binance, OKX, Gemini and Bitfinex, tracked ETH balances fell by 480,000 ETH over the past few days.
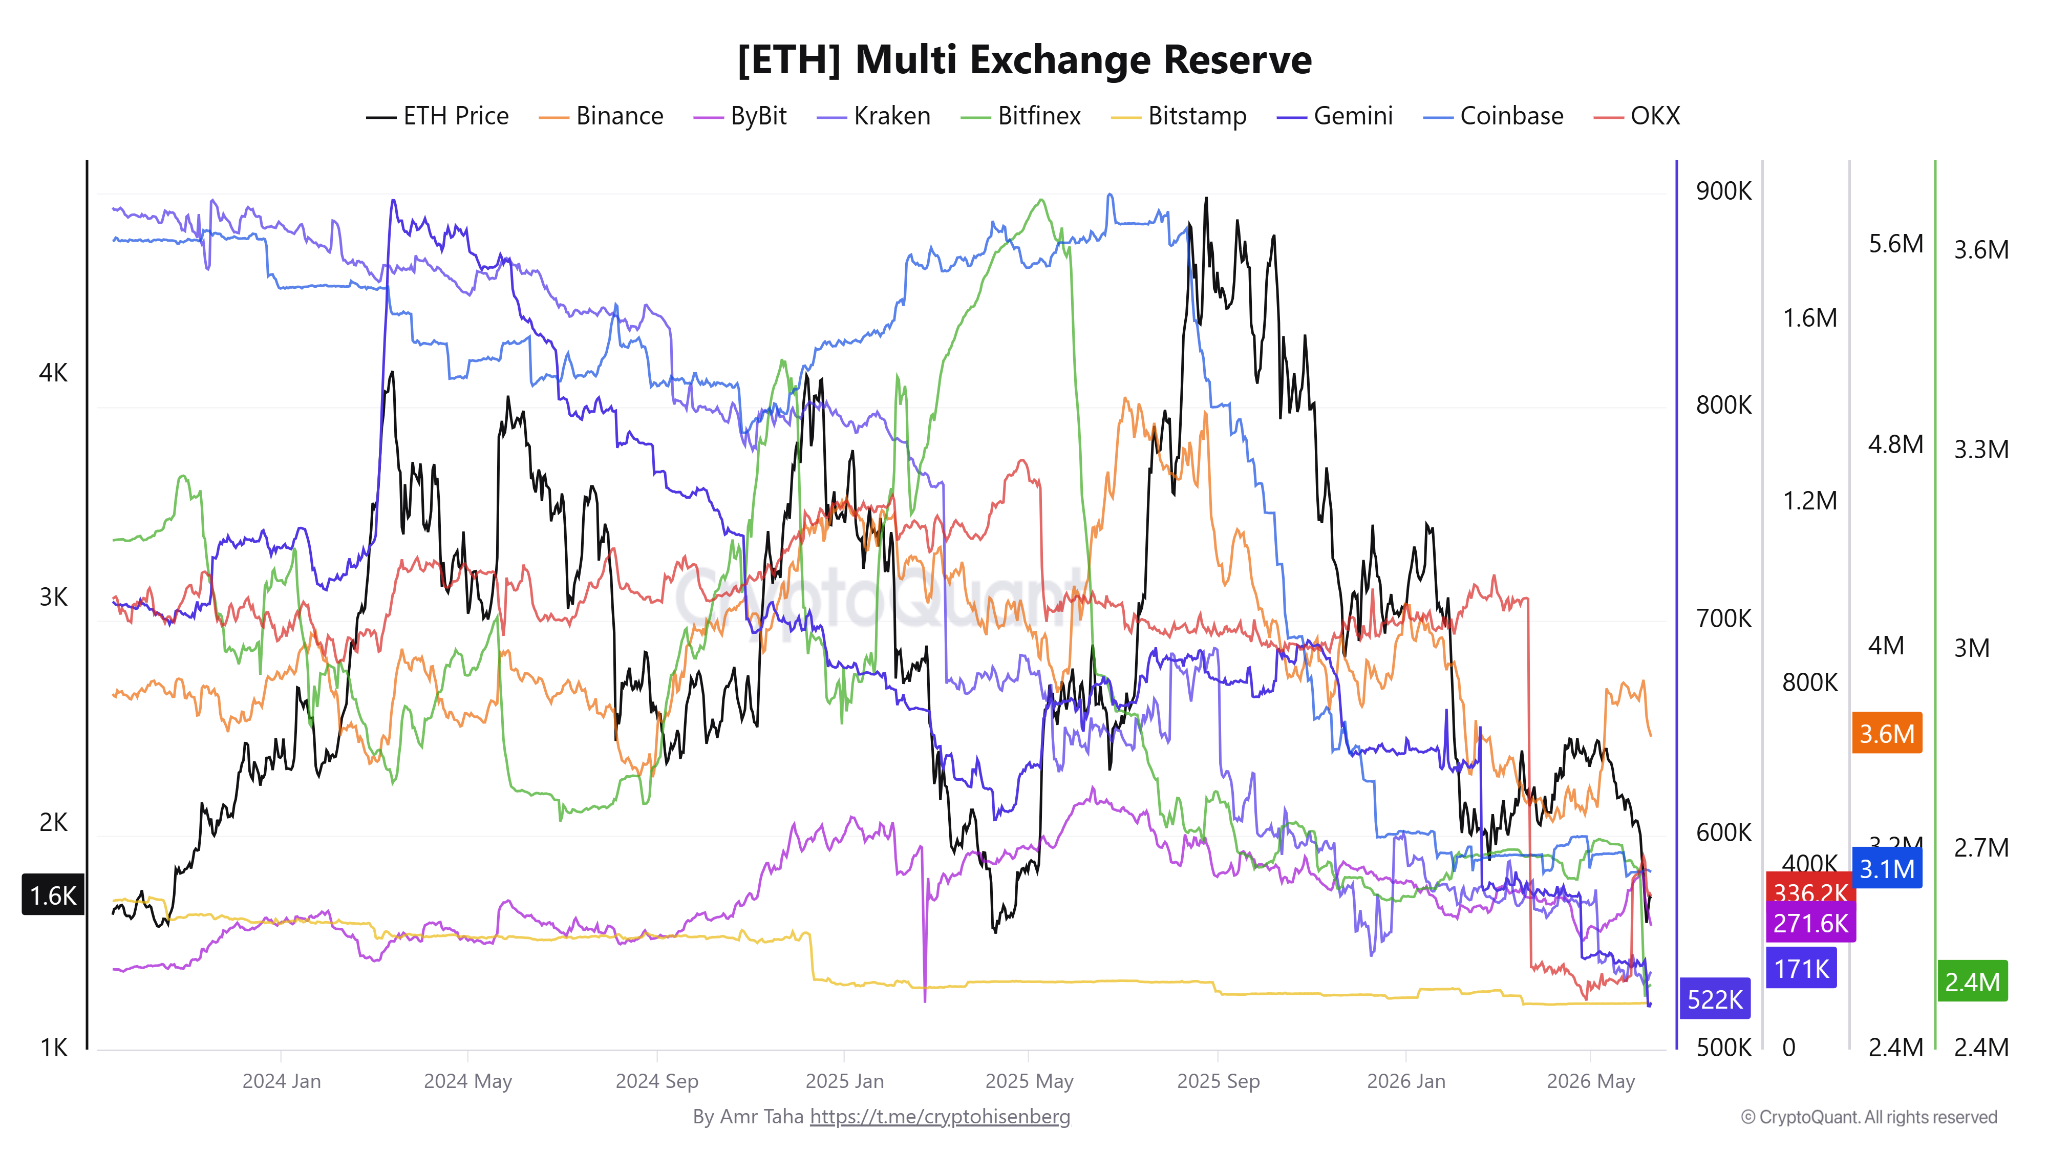
ETH multi-exchange reserve. Source: CryptoQuant
Binance reserves dropped to 3.65 million ETH on June 9 from 3.87 million ETH on June 4. Bitfinex holdings declined to 2.50 million ETH from 2.67 million ETH at the end of May. OKX recorded the sharpest percentage decline, with reserves falling from 424,000 ETH to about 336,000 ETH. Gemini balances also slipped to roughly 522,000 ETH.
Continued ETH outflows could reduce the amount of readily available supply on exchanges if buying demand starts to recover.
Onchain data shows many ETH holders are still far from large profits. According to market commentator Gonza Goth, only 11% of Ethereum’s supply is currently sitting at a 3x or greater gain, the lowest level since February 2017. However, Goth said,
“Historically, extreme pessimism has created the best opportunities.”
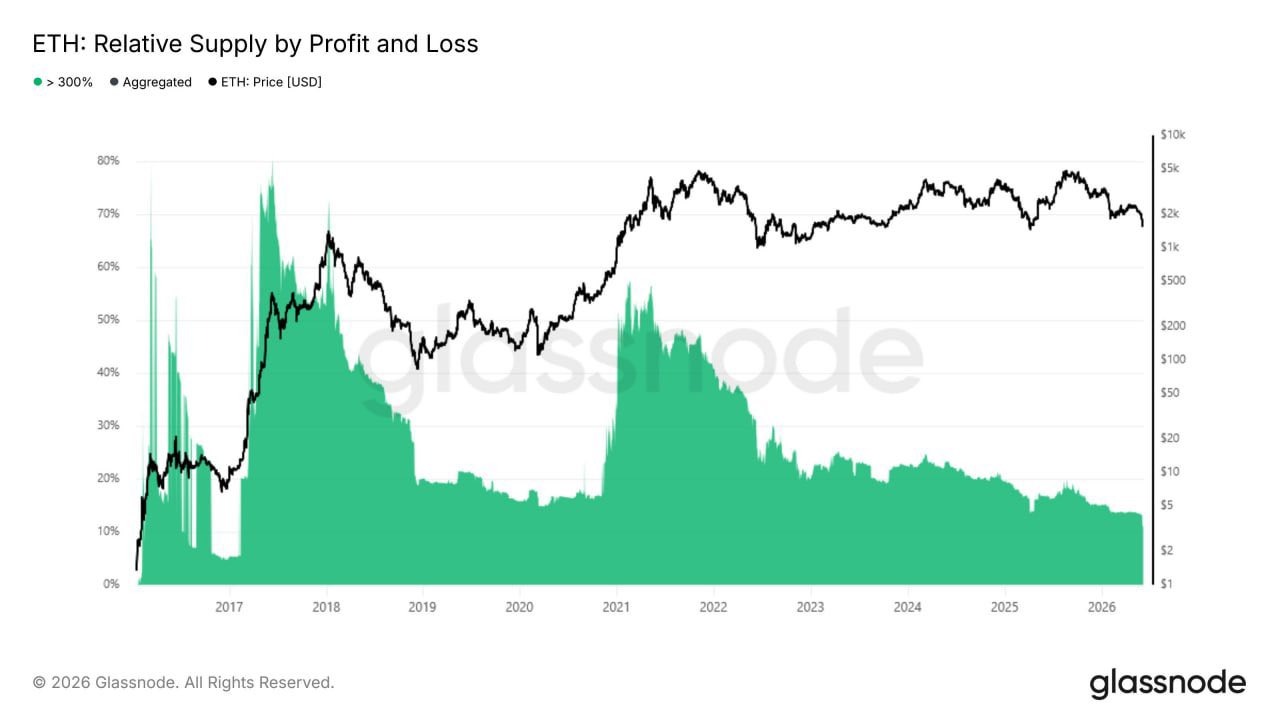
ETH: relative supply by profit and loss. Source: Glassnode
Meanwhile, traders are also watching the $1,500 level next. Investor Ash Crypto noted that Ether failed to hold every support level during the 2022 bear market, when the price eventually bottomed near $880.
The analyst said a weekly close above $1,500 would keep ETH above a historically important support zone, while a break below it would shift attention toward the next major support area near $1,000.
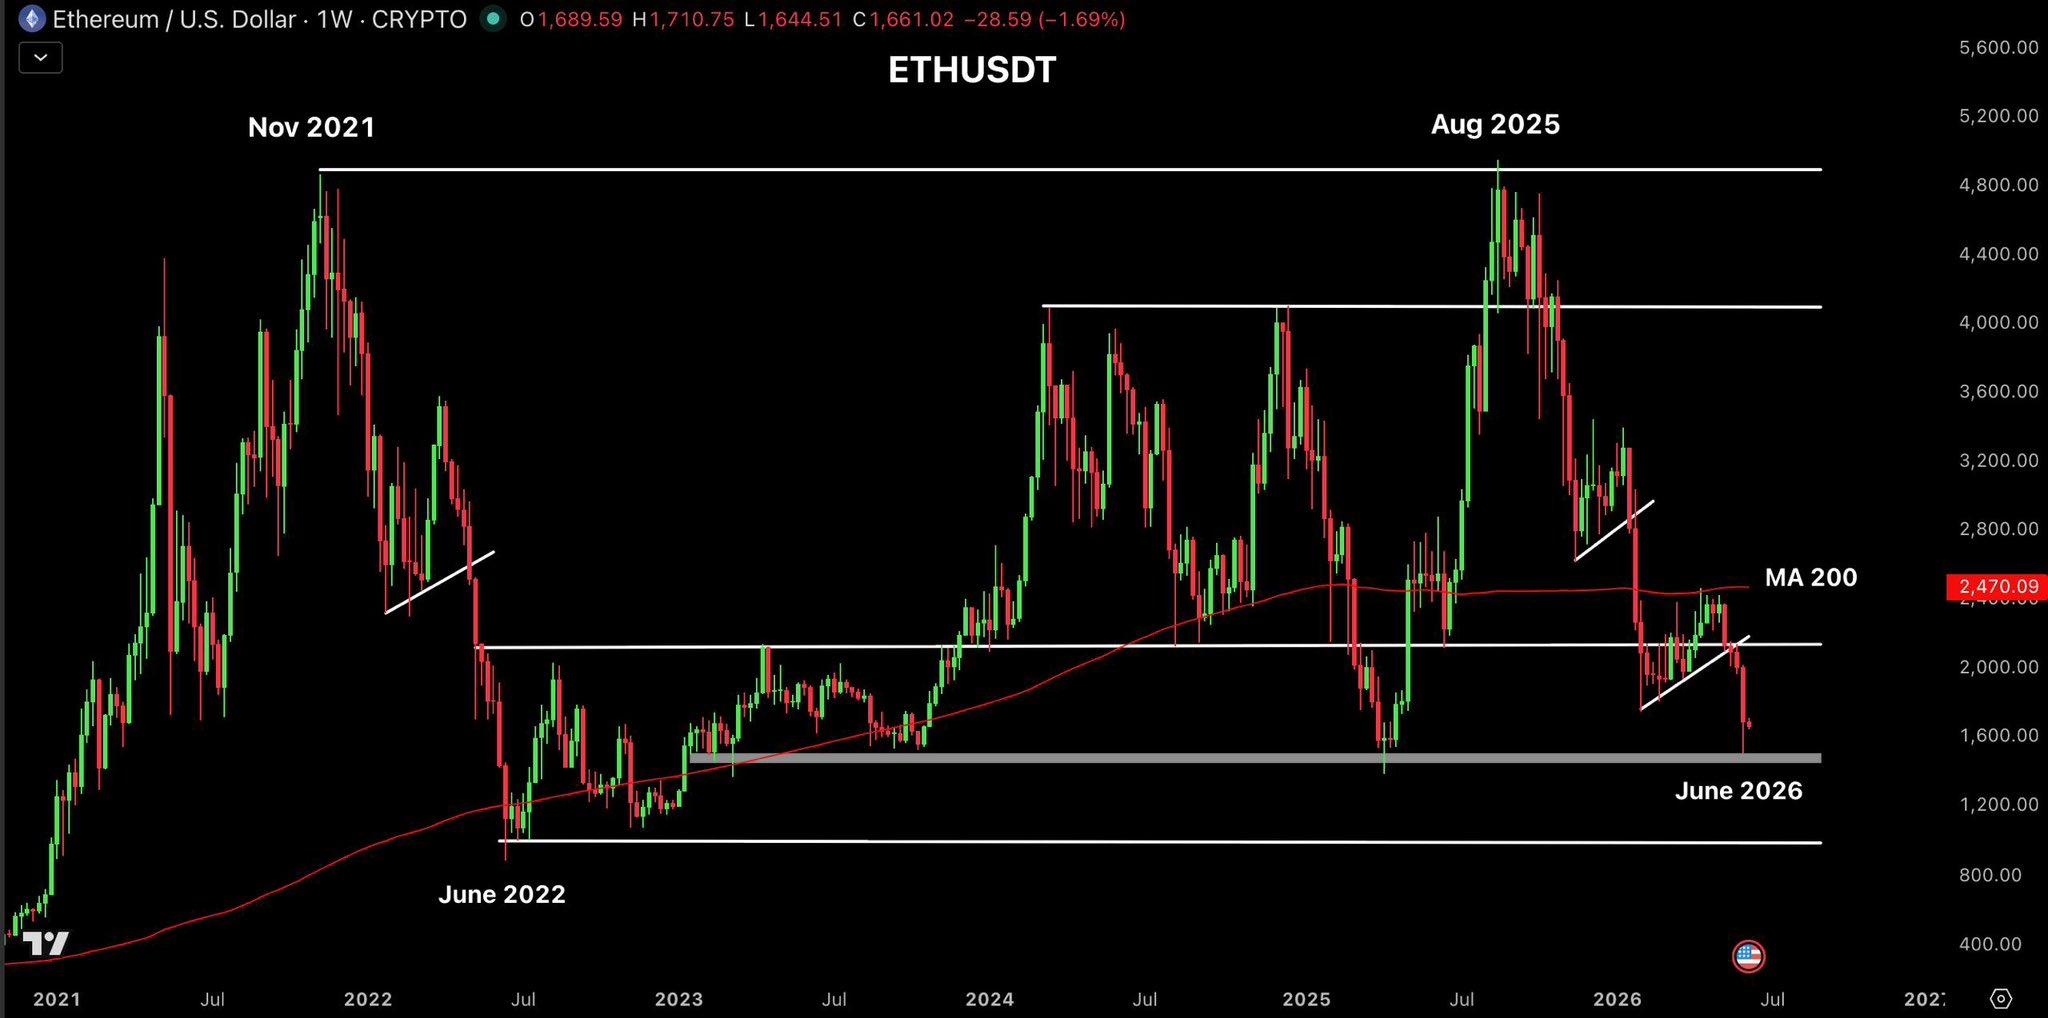
ETH/USD, one-week chart analysis by Ash. Source: X
Related: ETH falls to 13-month low on Zcash bug, Bitcoin below $60K: Is $1.4K next?

BTC Price Nears $62,000 as Bitcoin Bear Market Support Failures Continue
The 30 most disturbing serial killer movies of all time, ranked

MONEY EXPERT: How To Think Like The 1%


-

 Fashion4 days ago
Weekend Open Thread: Evereve – Corporette.com
-
 Crypto World4 days ago
Jensen Huang Approves Samsung, SK Hynix, and Micron for NVIDIA (NVDA) HBM4 Memory Supply
-

 Crypto World2 days ago
Anatomy of the June crypto crash: Fed, Iran, Saylor
-

 Business7 days ago
Trump Taps Housing Chief Bill Pulte as Acting Intelligence Director After Gabbard Exit
-
Crypto World3 days ago
Senator Cynthia Lummis Calls CLARITY Act the Most Consequential Financial Legislation of This Generation
-
 Business3 days ago
The Pain Points Taking a Fragile Tech Rally Down a Notch
-
 Entertainment3 days ago
The Best Mystery Series of All Time Is Surging on Streaming 30 Years After It Ended
-

 Tech5 days ago
Microsoft launches MXC, an OS-level sandbox for AI agents, with OpenAI and Nvidia already on board
-

 NewsBeat2 days ago
Alexander Zverev wins the French Open to finally earn a 1st Grand Slam title
-

 Tech2 days ago
Microsoft unveils seven homegrown AI models in new bid for ‘long term self-sufficiency’
-
Crypto World5 days ago
LBank Surpasses 25 Million Users Worldwide as AFA Partnership Continues to Drive Global Growth
-

 Business7 days ago
PagerDuty, Inc. (PD) Presents at Bank of America 2026 Global Technology Conference Transcript
-

 Tech4 days ago
Suspicious Polyfill login prompts pop up on Toshiba, Muji websites
-

 Crypto World2 days ago
Trump’s AI Ownership Plan Could Benefit Anthropic at OpenAI’s Expense
-
 Sports7 hours ago
Bangladesh beat Australia after 20 years in ODIs, register only their second win over six-time world champions | Cricket News
-

 Business5 days ago
(VIDEO) Justin Bieber Delivers Surprise Happy Birthday Serenade to Diners at Los Angeles Mexican Restaurant
-

 Tech4 days ago
RCS Messages Between iPhone and Android Get End-to-End Encryption With iOS 26.5
-

 Tech4 days ago
Meta steals a tactic from Tesla and builds data centers in tents
-
 Crypto World1 day ago
Eli Lilly (LLY) Stock Surges 4% Following Breakthrough Sleep Apnea Trial Results
-

 Tech4 days ago
Hackers now exploit SolarWinds Serv-U flaw to crash servers
You must be logged in to post a comment Login