
Crypto World
Alphabet Beats Expectations as AI Spending Risks Take Center Stage

Editor’s note: Alphabet has reported a strong fourth quarter, beating market expectations on both revenue and earnings, driven by continued resilience in advertising and a sharp acceleration in Google Cloud profitability. While headline growth remains solid, the results have refocused investor attention on the scale of Alphabet’s capital expenditure, particularly its aggressive push into artificial intelligence. With AI adoption expanding rapidly across platforms like Gemini, the key question is no longer demand, but whether and when that usage can be translated into sustainable revenue and returns for shareholders.
Key points
- Alphabet’s Q4 revenue rose 18% year on year, with earnings exceeding expectations.
- Google Cloud revenue jumped 48% to USD 17.7 billion, with operating income more than doubling.
- Advertising revenue remained resilient, growing 14% year on year.
- Capital expenditure reached USD 91.5 billion in the quarter, with 2026 guidance set at USD 175–185 billion.
- Gemini has surpassed 750 million monthly users, highlighting rapid AI adoption.
Why this matters
Alphabet’s results underline a broader shift across Big Tech, where profitability in core businesses is increasingly funding massive AI investment cycles. For investors, the tension lies between long-term strategic positioning and near-term pressure on free cash flow and margins. For the wider digital economy, Alphabet’s spending signals how central AI infrastructure has become to future competitiveness, influencing cloud markets, enterprise adoption, and the pace at which AI moves from experimentation to monetised products.
What to watch next
- How Alphabet manages capital expenditure discipline relative to revenue growth.
- Signals around AI monetisation beyond user growth metrics.
- Cloud margin trends as investment intensity remains elevated.
Disclosure: The content below is a press release provided by the company/PR representative. It is published for informational purposes.
Abu Dhabi, United Arab Emirates – February 05, 2026: Alphabet (NASDAQ: GOOG) reported a solid fourth quarter, with revenue rising 18% year on year and earnings surpassing market expectations, underpinned by resilient performance across its core businesses.
Google’s advertising segment continued to show strength, with advertising revenue up 14% year on year. Google Cloud was the standout performer, posting revenue growth of 48% to USD 17.7 billion and delivering operating income of USD 5.3 billion—more than double the figure recorded in the same period last year.

Commenting on the results, Zavier Wong, Market Analyst at eToro, said that while Alphabet’s headline numbers were encouraging, investor attention has shifted toward the scale and execution risk of the company’s capital expenditure plans.
During the quarter alone, Alphabet spent USD 91.5 billion and has guided for capital expenditures of USD 175–185 billion in 2026—well above market expectations. From a shareholder perspective, this level of spending materially reduces free cash flow in the near term, with returns on AI investments yet to be proven at scale.
Alphabet is effectively asking investors to be patient and trust that artificial intelligence will evolve into a significant revenue driver.
While the company has little choice but to invest heavily to remain competitive with rivals such as Microsoft, Amazon, and OpenAI, the timeline for meaningful AI monetisation remains uncertain.
AI adoption is clearly accelerating, with Alphabet’s Gemini platform surpassing 750 million monthly users.
However, the gap between usage and monetisation remains wide, and prolonged delays in converting AI engagement into revenue could weigh on margins and earnings.
Wong added that although AI spending has so far been viewed as necessary and largely justified, Alphabet’s latest guidance represents a material escalation. “This marks one of the most significant risks we’ve seen so far in the current AI investment cycle,” he noted.
Media Contact:
PR@etoro.com
About eToro
eToro is the trading and investing platform that empowers you to invest, share and learn. We were founded in 2007 with the vision of a world where everyone can trade and invest in a simple and transparent way. Today we have 40 million registered users from 75 countries. We believe there is power in shared knowledge and that we can become more successful by investing together. So we’ve created a collaborative investment community designed to provide you with the tools you need to grow your knowledge and wealth. On eToro, you can hold a range of traditional and innovative assets and choose how you invest: trade directly, invest in a portfolio, or copy other investors. You can visit our media centre here for our latest news.

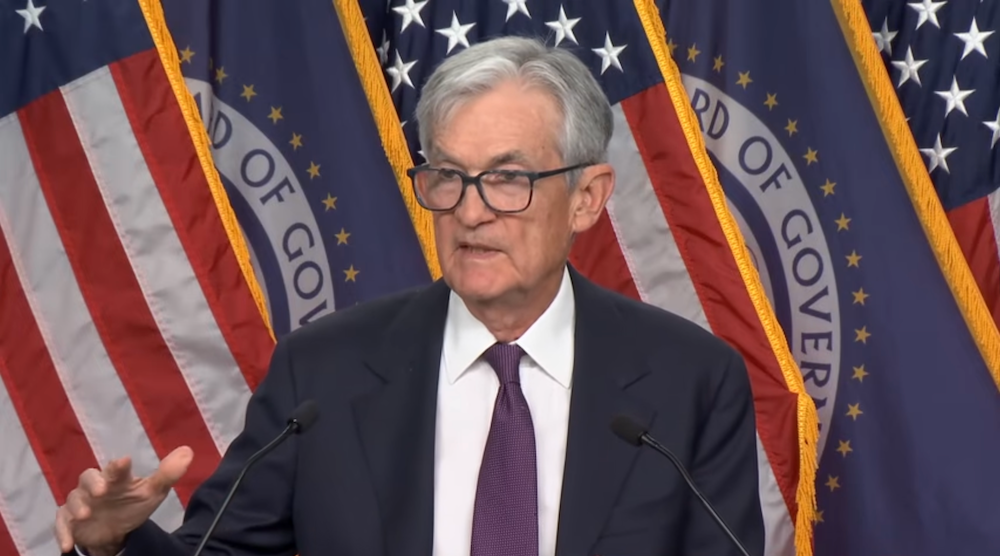
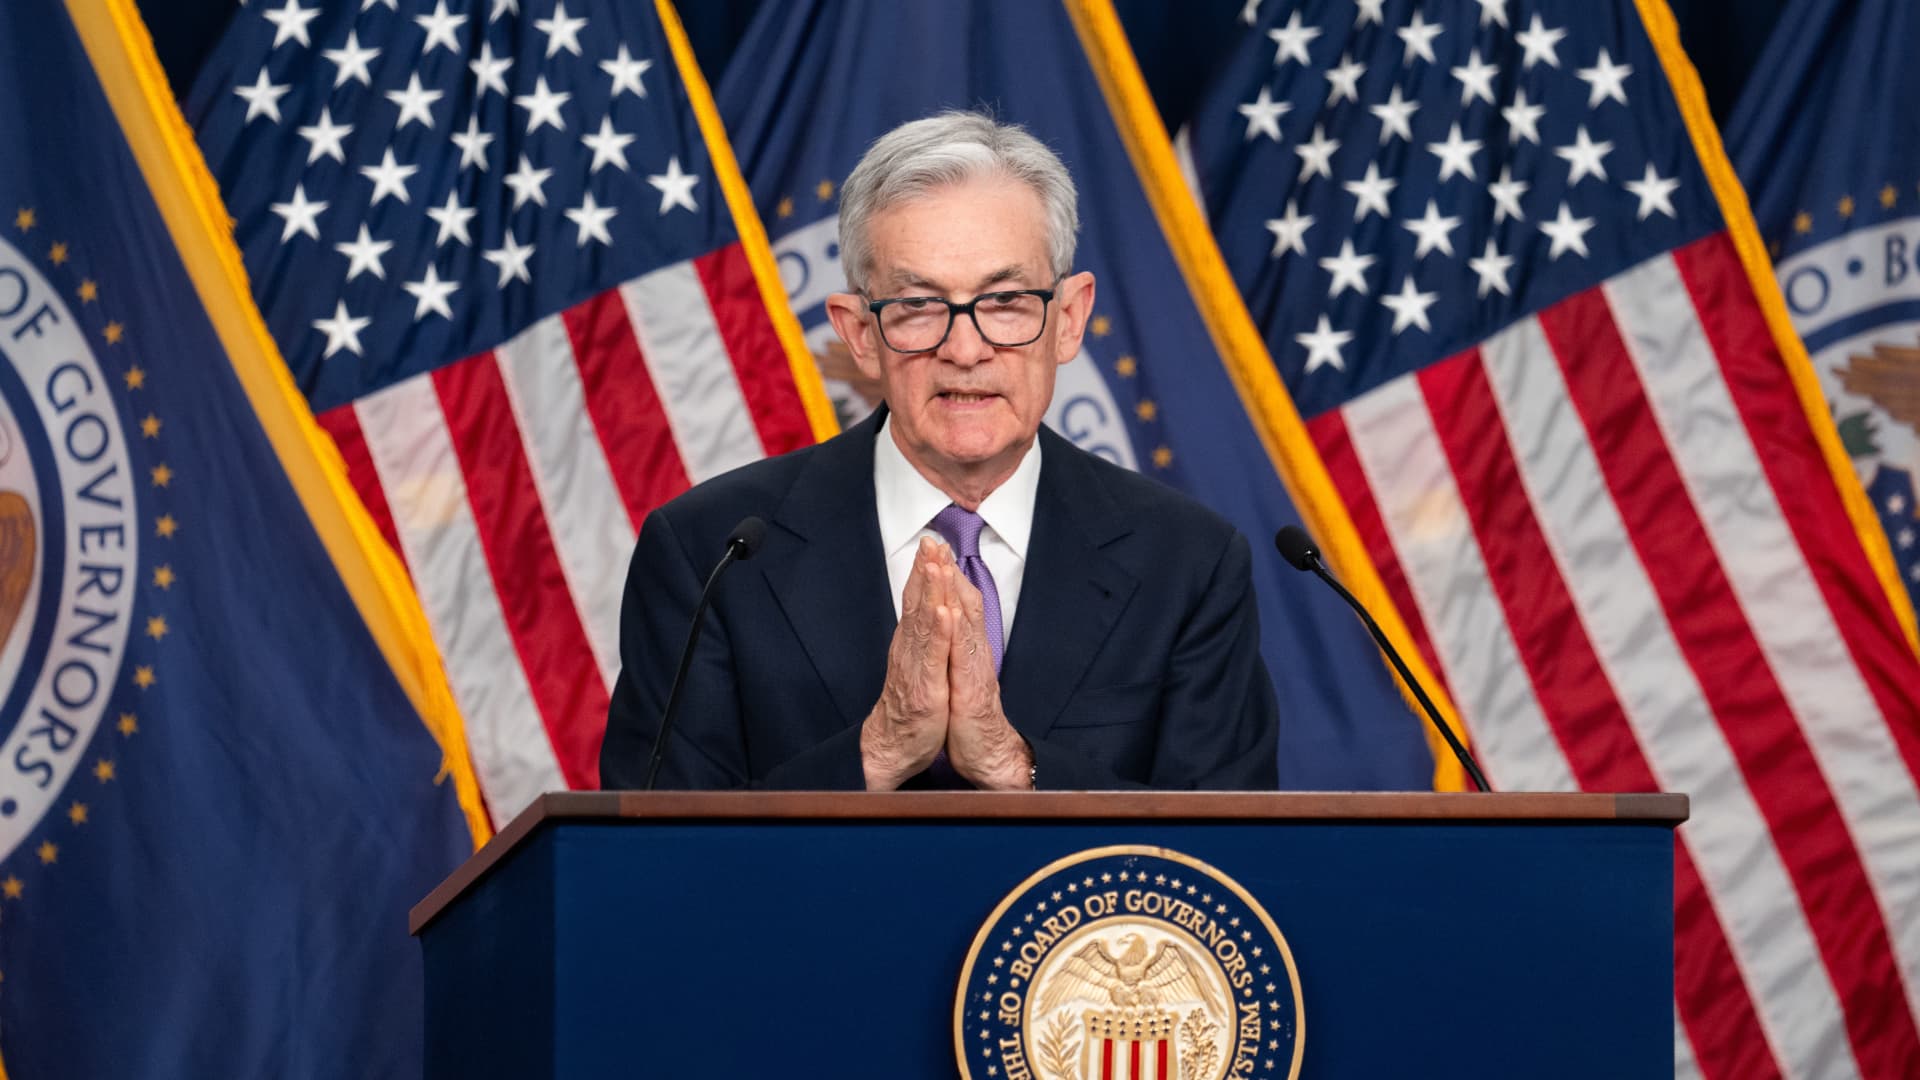
The Federal Reserve Open Market Committee (FOMC) announced on Wednesday that it would hold the Federal Funds rate steady at 3.5-3.75%, as it monitors macroeconomic impacts from the ongoing war in the Middle East.
Economic activity has expanded at a “solid pace,” Federal Reserve Chairman Jerome Powell said, adding that consumer spending remains “resilient,” while business investment continued to grow.
However, the housing sector remains weak, and the labor market shows signs of softening, Powell said, while inflation remains “somewhat elevated” above the Fed’s 2% target.

This higher inflation and weak labor market is creating a tension between the Federal Reserve’s dual mandate of maximizing employment and stabilizing prices, Powell Said. He added that the war in the Middle East has further clouded the economic outlook. He said:
“The implications of events in the Middle East for the US economy are uncertain in the near term. Higher energy prices will push up overall inflation, but it is too soon to know the scope and duration of the potential effects on the economy.”
Interest rate policy impacts risk asset markets like cryptocurrencies and equities, with lower rates stimulating asset prices and higher rates acting as a restrictive force on risk asset prices, as investment capital flows from riskier asset classes to government bonds.
Related: Fed holds rates amid higher inflation outlook: Bitcoin bounces to $72K
Traders see no chance of rate cuts, while analysts say liquidity will flow
97% of market participants forecast no change in interest rates at the April 2026 FOMC meeting. While 3% forecast a rate hike of 25 basis points (BPS), according to data from the Chicago Mercantile Exchange (CME).
A rate hike of 25 basis points would spike the Federal Funds Rate to a range between 3.75% and 4.00%.

Arthur Hayes, a market analyst and co-founder of the BitMEX crypto exchange, said he is waiting for the Fed to slash rates before he resumes buying Bitcoin (BTC).
Hayes also said that the ongoing war between the US and Iran would likely cause the Federal Reserve to ease monetary policy to finance the war.
Others, like macroeconomist Lyn Alden, say that the Federal Reserve has entered a “gradual print” phase in which new money is steadily being created, slowly raising up all asset prices.
Magazine: Is China hoarding gold so yuan becomes global reserve instead of USD?

The FTX Recovery Trust has disclosed a new creditor payout schedule, confirming a $2.2 billion distribution on March 31, 2026. This fourth round continues the exchange’s multi-year effort to reimburse creditors and former customers of the failed platform, following a sequence of disbursements that have totaled billions since 2025.
Eligible claimants will receive funds through their chosen distribution provider within one to three business days, according to the Trust’s announcement. The fourth distribution allocates 18% to Dotcom Customer claims, 5% to US Customer Entitlement Claims, and 15% to both General Unsecured Claims and Digital Asset Loan Claims. Convenience claims will receive a 120% reimbursement under the recovery plan.
Following this round, roughly $10 billion will have been paid out to creditors and former customers of FTX. The fifth round of payments is scheduled for May 29, 2026, according to the Trust.
The reimbursements could influence crypto prices in the near term if creditors and former customers of FTX deploy the recovery funds into digital assets.
The latest update comes as Sam Bankman-Fried, the convicted former CEO, pursues appeals in his criminal case, amid broader questions about how the recovery process will impact victims and the wider crypto market. Bankman-Fried has been the subject of ongoing legal proceedings and related coverage, with reports indicating relocation discussions and various court filings as part of his efforts to challenge the judgment against him.
Key takeaways
- FTX Recovery Trust sets a $2.2 billion fourth distribution for March 31, 2026, with specific allocations: 18% for Dotcom Customer claims, 5% for US Customer Entitlement Claims, and 15% for General Unsecured and Digital Asset Loan Claims; Convenience claims receive 120% reimbursement.
- Totals to date after this round approach about $10 billion paid to creditors and former customers of FTX; the fifth distribution is slated for May 29, 2026.
- Earlier payouts included approximately $1.2 billion (February 2025), $5 billion (May 2025), and $1.6 billion (September 2025), illustrating a pattern of sizable disbursements over 2025–2026.
- Market implications hinge on how recipients deploy funds; reinvestment into crypto could provide near-term price movements, though broader recovery remains uncertain.
- Ongoing legal actions surrounding Sam Bankman-Fried—appeals and related proceedings—continue to add a layer of regulatory and narrative risk to the recovery program.
Fourth distribution details and payout mechanics
The FTX Recovery Trust’s latest announcement confirms a $2.2 billion payout slated for March 31, 2026. Eligible creditors will see payments delivered through their selected distribution provider within one to three business days, marking the fourth installment in a plan designed to unwind the exchange’s collapsed operations. The distribution breakdown targets specific claim categories: 18% for Dotcom Customer claims, 5% for US Customer Entitlement Claims, and 15% for both General Unsecured Claims and Digital Asset Loan Claims, with Convenience claims receiving a 120% reimbursement under the framework.
The structure underscores a phased approach to restitution, balancing the need to advance recovery with the complexities of asset valuation and creditor eligibility. The Trust’s statement emphasizes that the payout will proceed in a timely manner, enabling creditors to access funds relatively quickly after the distribution date.
Progress of the FTX recovery program
The fourth distribution arrives after a year of active creditor payouts. The recovery process began disbursing funds in February 2025 with a $1.2 billion payment, followed by a $5 billion distribution in May 2025. The third round in September 2025 totalled $1.6 billion. With the March 2026 release, overall disbursements push toward $10 billion across all rounds, reflecting the scale and urgency of addressing creditor claims while acknowledging the recovery remains far from complete for many affected parties.
Several creditors and advocacy voices have argued that the recoveries are not fully satisfactory given the losses incurred when FTX collapsed in 2022. Still, the ongoing payouts represent a tangible step in returning value to those impacted, even as the total figure has been a point of contention among some claimants.
Market and regulatory implications
The prospect of creditors receiving cash and potentially choosing to reallocate those funds into crypto markets has drawn attention from market participants. Observers are watching whether the proceeds will be redeployed into Bitcoin, Ether, or other digital assets, potentially providing a short-term catalyst for price moves even as broader market dynamics remain nuanced and uncertain.
Beyond market effects, the recovery program continues to intersect with high-profile legal developments surrounding Sam Bankman-Fried. Appeals and ongoing court activity related to his case contribute to a broader narrative about accountability, investor protection, and the resilience of the crypto industry in the face of high-profile collapse events.
Ongoing oversight and what to watch next
As the fourth distribution lands, attention will turn to the fifth payout on May 29, 2026, and how subsequent rounds will adapt to evolving market conditions and creditor needs. Market watchers will also monitor updates on the total recovered amount, any changes to the distribution schedule, and new information emerging from legal proceedings that could influence the pace or structure of future disbursements.
Looking ahead, observers will assess whether further recoveries will translate into renewed demand for digital assets among creditors or whether the funds will be used for debt settlements, personal liquidity, or other non-crypto purposes. With another major distribution on the horizon, the FTX creditor storyline remains a focal point for investors seeking to understand the long tail of the exchange’s collapse and its implications for market resilience and creditor rights.
U.S. Federal Reserve Chair Jerome Powell holds a press conference following a two-day meeting of the Federal Open Market Committee (FOMC), at the Federal Reserve in Washington, D.C., U.S., March 18, 2026.
Kevin Lamarque | Reuters
1. Lots of uncertainty
While no one expected the Fed to cut — much less hike — at this meeting, the market always looks for clues about what’s next. Neither the post-meeting statement, the update on economic projections, nor Powell’s news conference provided much in that regard. The statement saw only minor tweaks, the “dot plot” saw a modest dovish shift, and Powell used some form of “uncertain” more than half a dozen times.
2. The war is a problem
Forecasting the future and modeling policy at a time when the U.S. is at war with Iran is nearly impossible, Powell said. He faced repeated questions about the oil shock, and mostly emphasized how much it has muddied the waters for the Fed. “The thing I really want to emphasize is that nobody knows,” he said. “The economic effects could be bigger, they could be smaller, they could be much smaller or much bigger. We just don’t know.”
3. Cuts coming, but timing is highly uncertain
The dot plot still pointed to one more cut this year and another next year. But the grid looked more like a maze than a consensus, underlining just how little underlying consensus exists on the Federal Open Market Committee. For instance: In 2027, one official sees a hike, three see no change from the current level, four expect another cut, six see two more cuts, three forecast three cuts, one official sees four cuts, and a final participant — presumably Governor Stephen Miran — is at five.
4. Powell leaves door open to staying
Each news conference, Powell is questioned on whether he will stay on as governor after his term as chair ends. He again said he hasn’t made up his mind, which, of course, doesn’t eliminate the possibility. But he also said he isn’t going anywhere as long as the investigation into him continues, adding that he’ll also stay on as sort of a “chair pro tem” until someone, presumably former Governor Kevin Warsh, is confirmed as his successor.
5. Powell rejects ‘stagflation’
Don’t use the term “stagflation” around Powell. The chair rejected the notion that the U.S. economy, with its solid growth and low unemployment rate, is heading toward a 1970s nightmare, despite an anemic hiring rate and inflation above the Fed’s target for going on five years. “It’s a very difficult situation, but it’s nothing like what they faced in the 1970s and [I would] reserve ‘stagflation’ for that,” Powell said. “Maybe that’s just me.”
They said it
“The Fed didn’t move today — but it didn’t need to. This is a central bank that’s comfortable waiting, watching, and staying flexible. One projected cut tells you everything: the Fed is not in a rush, and neither should investors be.” — Gina Bolvin, president of Bolvin Wealth Management Group.
“Although the move was widely expected, it underscores the difficult path ahead for the Fed, which now faces pressure on both sides of its dual mandate to keep employment high and inflation muted. Complicating matters further is the fact that Fed leaders are often basing hugely important decisions on weeks- or months-old data that may not fully capture the magnitude of rapid economic shifts, raising the risk that decisions may come too late or be based on outdated assumptions.” — Indeed economist Felix Aidala.
“I expect given the volatile situation that the committee would like to try and do as little as possible so as to not rock the boat ahead of the new Fed chair taking over.” — Stephen Coltman, head of macro at 21shares.
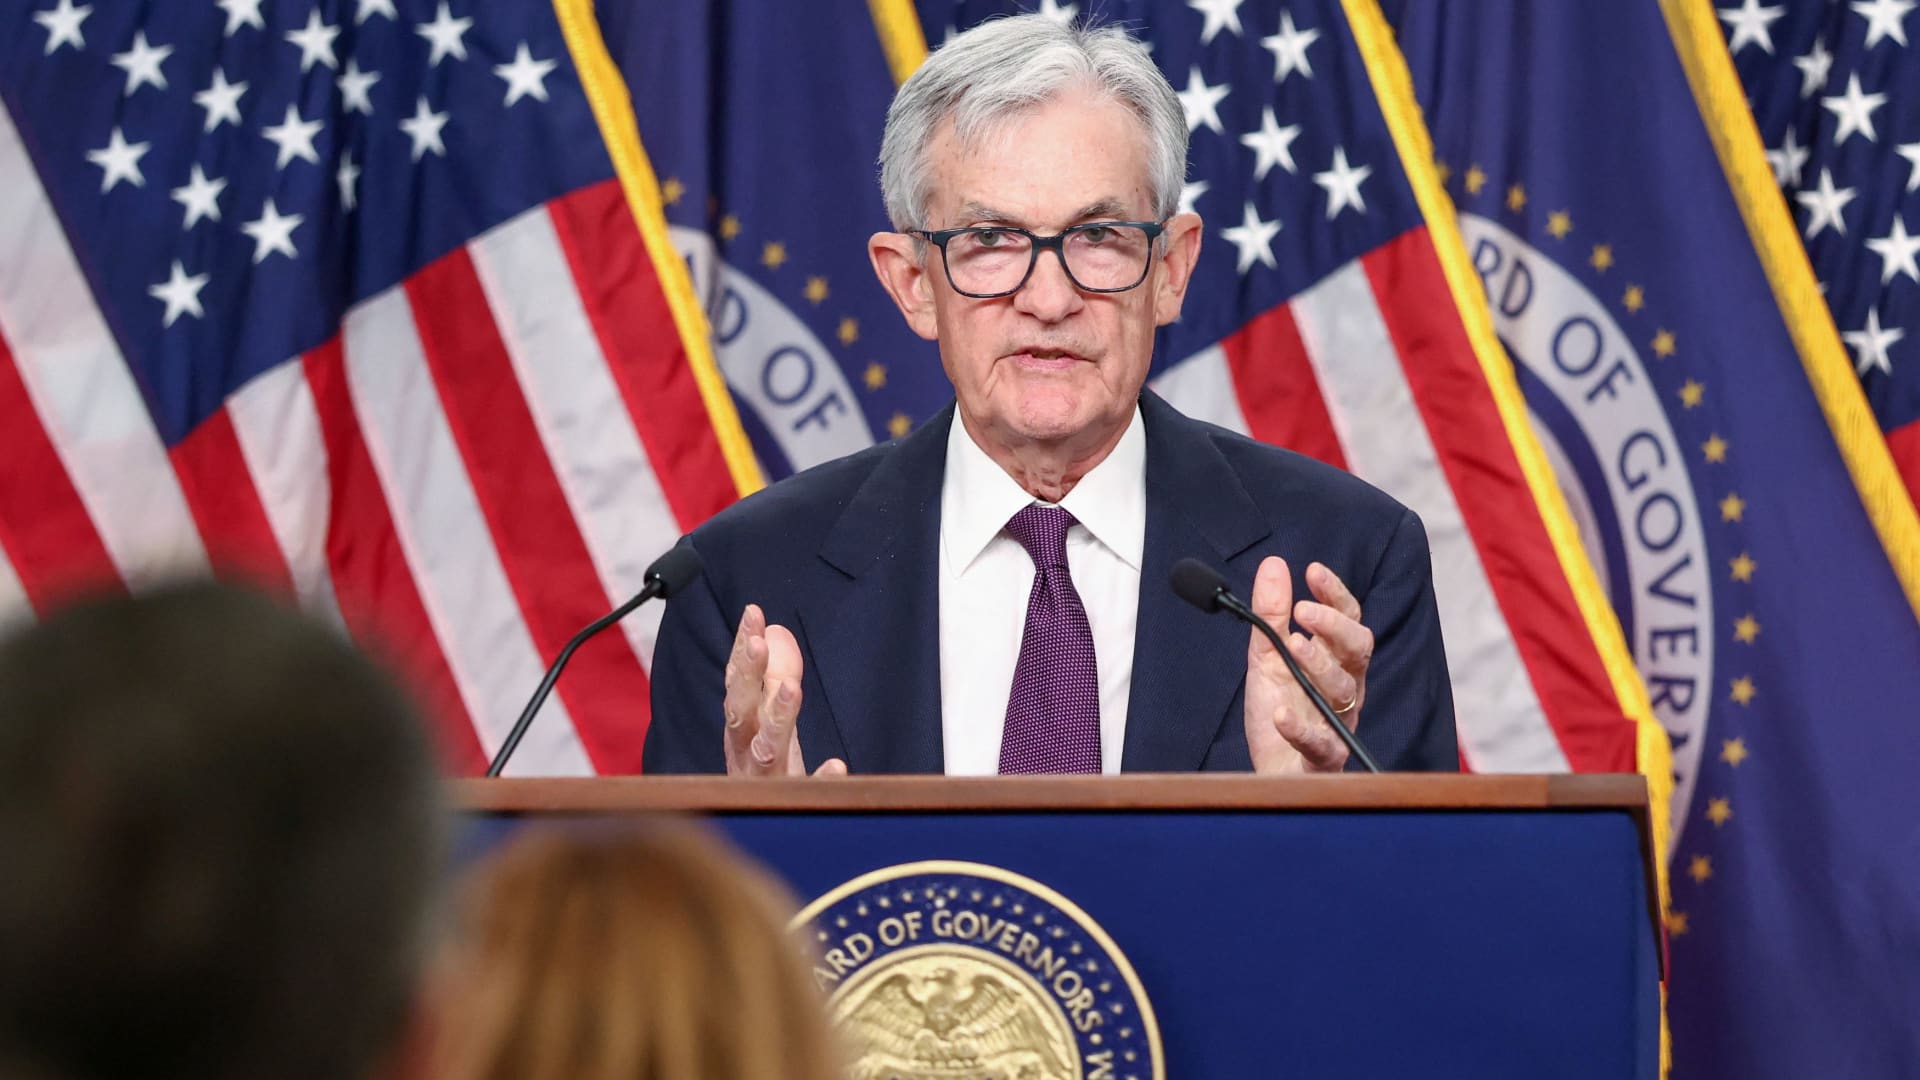
The deal gives non-U.S. investors around-the-clock leveraged exposure to the world’s most-tracked equity benchmark on Hyperliquid.
S&P Dow Jones Indices has licensed the S&P 500 to TradeXYZ, enabling the launch of the first officially sanctioned perpetual futures contract based on the index.
This marks the first time eligible non-U.S. investors can gain leveraged exposure to the S&P 500 through an officially licensed, digitally native instrument designed for 24/7 trading on a decentralized platform. Unlike traditional S&P 500 futures, the contract carries no fixed expiry, allowing traders to hold long or short positions without rolling.
The S&P 500 sits at the center of a global trading ecosystem generating over $1 trillion in daily volume across linked exposures in exchange-traded futures, options, ETFs, and structured products, the company noted in a press release. The new perp extends that ecosystem on-chain using official SPDJI index data, a distinction TradeXYZ frames as critical for institutional-grade liquidity.
“We believe digitally-native investors should demand the institutional-quality standards that define our indices, and we are thrilled to work with TradeXYZ to do so,” said Cameron Drinkwater, Chief Product & Operations Officer at S&P Dow Jones Indices.
TradeXYZ’s Rapid Rise
TradeXYZ is the perpetuals arm of Unit, the Hyperliquid tokenization layer. The protocol’s XYZ100 market was the first HIP-3 deployment, tracking Nasdaq futures. Launched in October, TradeXYZ began its breakout at the end of November after Hyperliquid rolled out its “growth mode” upgrade, which reduced fees on HIP-3 permissionless perpetuals markets by over 90%, triggering a sharp spike in volumes.
The platform has since crossed $1 billion in open interest and routinely processes more than $1 billion in daily volume, according to DeFiLlama.

Less than a month after deploying XYZ100, the platform added tokenized NVDA and TSLA markets and has continued adding pairs weekly.
The HYPE token rallied roughly 3% to $42 following the announcement, placing it among today’s top gainers amid a broad market selloff.

Crypto World
Crypto News Today: Kiyosaki Predicts $750K Bitcoin and Pepeto Keeps Raising While BlockDAG Crashes After Launch
Robert Kiyosaki just predicted Bitcoin at $750,000 in his latest post on X. The crypto news today is moving fast after the FOMC held rates at 3.50% to 3.75% and BTC pulled back from $76,000. But the real crypto news is in the presale market, where one early project keeps raising while another launched and crashed.
The Federal Reserve held rates unchanged on March 18, and the dot plot signaled limited cuts for 2026 according to CoinDesk.
BTC touched $76,000 before pulling back to $71,000 in the typical sell the news pattern that followed seven of eight FOMC meetings in 2025 according to CoinGecko. Strategy bought $1.57 billion worth of Bitcoin, its largest purchase of 2026. The crypto news today tells the same story it always tells after FOMC: retail panics, institutions load, and the recovery follows within weeks.
Crypto News Today and the Presale Projects That the Correction Is Separating From the Noise
Pepeto Is an Early Project Built for Trading, Risk Scoring, and Cross Chain Movement That Has Raised Over $8 Million
Pepeto is an early meme coin project that combines zero fee trading, cross chain transfers, and a risk scorer that flags dangerous tokens before your capital touches them. The project gives holders tools that remove friction from every trade and protect every transaction from the start. That matters during a correction like this one, when new investors panic and experienced wallets quietly load the projects that will define the next leg up.
PepetoSwap, the bridge, and the risk scorer are all built and audited by SolidProof. This is not a roadmap promise. This is working infrastructure, and that separates Pepeto from projects still selling ideas. BlockDAG raised $452 million and launched on March 5, but crashed 68% from its $0.17 ATH to $0.054 within ten days, proving that money without trust leads to exit selling.

Pepeto on the other hand has PepetoSwap charging zero on every trade, a bridge moving tokens across Ethereum, BNB Chain, and Solana for nothing, and the risk scorer running before a single listing has happened.
Priced at $0.000000186 and still in presale, Pepeto offers early holders access to the full ecosystem before the Binance listing arrives. The project has raised more than $8.1 million, built by the cofounder of the original Pepe coin with a former Binance expert on the dev team. A $2,000 position today buys over 10 billion tokens, and if Pepeto matches the $11 billion cap that Pepe reached with the same 420 trillion supply and zero products, that position becomes more than $300,000. That requires roughly 150x, a target Pepe surpassed within months. And Pepeto has three working products that Pepe never had, so the path to that target has a foundation underneath it.
IPO Genie Targets Private Markets at $0.0001310 With a Structured Listing Return
IPO Genie sits at $0.0001310 with a confirmed listing price of $0.0016, implying a structured 1,127% return from entry to listing.
The project targets the $3 trillion gap between institutional deal flow and retail access. But bridging private markets to blockchain requires regulatory approvals that take years.
Mutuum Finance Offers DeFi Lending but Enters a Crowded Field Without Clear Differentiation
Mutuum Finance targets decentralized lending with variable rate pools and collateral management. The concept has merit, but the DeFi lending space already has Aave and Compound dominating TVL.
Without a technical edge or strong community, Mutuum faces the adoption wall that stalled dozens of lending protocols before it.
The Crypto News Today Will Fade but the Presale Entry You Take During the Correction Will Not
The crypto news today shows Pepeto quietly outpacing every other presale while the market watches the FOMC dip play out. The working exchange, the cross chain bridge, and the approaching Binance listing are pulling capital into Pepeto while other presales stall or crash.
With the products built and the presale still open at $0.000000186, Pepeto is the early entry most likely to turn a small position into the kind of return that corrections are remembered for. Visit the Pepeto official website now, because six months from now the investors who acted during a Fear Index of 37 will be the ones the rest of the market wishes they had followed.
Click To Visit Pepeto Website To Enter The Presale

FAQs
What is the biggest crypto news today?
The Fed held rates at 3.50% to 3.75%, Kiyosaki predicted $750K Bitcoin, and BTC ETFs posted their longest inflow streak in five months.
Is the crypto correction a good time to buy early projects?
FOMC corrections have recovered within weeks historically. Pepeto is still in presale with a Binance listing approaching.
What is Pepeto and why is it in the crypto news?
Pepeto has a zero fee exchange, cross chain bridge, and risk scorer, all audited by SolidProof with $8.1 million raised. Visit the Pepeto official website.
The post Crypto News Today: Kiyosaki Predicts $750K Bitcoin and Pepeto Keeps Raising While BlockDAG Crashes After Launch appeared first on Blockonomi.


American Bitcoin (ABTC), a mining and treasury firm tied to the Trump family, now holds more bitcoin than Mike Novogratz’s Galaxy Digital (GLXY).
The company owns 6,899 BTC, worth about $491 million, edging past Galaxy’s 6,894 BTC to become the 16th largest public holder of the asset, according to data from BitcoinTreasuries.net.
The shift highlights how newer entrants continue to climb the rankings as firms compete to build large bitcoin reserves. At the top remains Michael Saylor’s Strategy (MSTR) with 761,068 BTC. It is followed by Marathon Digital (MARA) and Jack Mallers’ Twenty One Capital. Other major holders include Bullish (BLSH), CoinDesk’s parent company, Coinbase (COIN) and Tesla (TSLA).
American Bitcoin’s rise also underscores the growing role of Trump-affiliated entities in the market. Trump Media & Technology (DJT), the company linked to U.S. President Donald Trump, holds 9,542 BTC.
American Bitcoin, formed in March 2025 when Hut 8 (HUT) launched it as a majority-owned subsidiary focused on large-scale mining and holding bitcoin on its balance sheet. Hut 8 held an 80% stake at launch, with the remaining 20% owned by investors including Eric Trump and Donald Trump Jr.
Unlike some mining firms that have begun shifting resources toward artificial intelligence infrastructure, American Bitcoin has doubled down on mining. In March 2026, it bought 11,298 ASIC miners for its Drumheller, Alberta site. The machines are expected to lift its capacity by about 12% and add 3.05 exahashes per second, or roughly 0.3% of the global network’s computing power.
Bitcoin recently traded at $71,092, down 4% over the past day.
Crypto World
Fairshake’s $10 million Illinois misfire marks first big hitch in crypto political surge

Losing a race is unusual for the crypto industry’s political action committee, Fairshake, which has recorded a dominant record in the past two congressional elections. But the Illinois primaries this week saw its biggest-ever setback, likely to conclude with a new member of the Senate next year being somebody the PAC spent more than $10 million trying to defeat.
Illinois Lt. Gov. Juliana Stratton won her Democratic primary, and her state’s Democrat lean means she’s likely to be its next senator after the November general election. One of Fairshake’s affiliates had devoted millions to purchase opposition advertising in that race and to support two of her opponents — representing more than 5% of the funds it’s said it had on-hand this year to devote to the congressional contests.
Not only did that money fail to win the outcome the group aimed for, but Stratton may eventually be a member of the 100-member Senate in which a single lawmaker can have a very potent influence, and she’ll be well aware of the industry’s efforts to oppose her. Crypto advocacy group Stand With Crypto, which evaluates politicians and political candidates, graded Stratton with an “F” on digital assets issues, even though she doesn’t have a significant personal record on crypto policy apart from the state’s industry-opposed regulatory regime signed by her boss last year.
“If you support pro-crypto policies, we will show up big,” Fairshake spokesman Geoff Vetter said in a statement. “If you oppose crypto and American innovation, we will show up big. That message is now clear at both the state level and federal level.”
The industry had mixed results in Illinois, supporting three pro-crypto candidates who won their primaries, and one other who didn’t. A person familiar with the PAC’s strategies said that it saw the loss as a one-off and that it was unlikely that other candidates it opposes down the road will have similar campaign resources they can tap.
Starting with the 2024 elections, Fairshake — primarily backed by Coinbase, a16z and Ripple — has targeted multiple Senate races in which it spent more than $10 million trying to influence the outcome. In its biggest spend in the last cycle, it devoted a towering $40 million to oppose former Senator Sherrod Brown, the Ohio Democrat who as ex-chairman of the Senate Banking Committee stood in the way of crypto legislation. (Brown is trying for a comeback this year, though Fairshake hasn’t yet announced its plan for Brown’s challenge of Senator Jon Husted.)
La Shawn Ford, who won his Illinois 7th District congressional primary to potentially join the House of Representatives next year, was another of Fairshake’s targets in a race in which the PAC spent almost $2.5 million. He accused the PAC of pumping out misleading and defamatory accusations in its ads. While he may represent a future political opponent for the sector, Fairshake celebrated wins for Donna Miller, Melissa Bean and incumbent Representative Nikki Budzinski in other House races in that state.
In 2024, Fairshake and its affiliates supported 53 candidates who ended up in Congress, losing in just five races, though many of the favored candidates were clear frontrunners. The super PAC was widely seen as establishing an industry model for a campaign-finance strategy in which more than $100 million devoted to congressional races (often primaries in districts in which one party has a dominant position) can influence the outcomes for dozens of seats. Fairshake purposefully didn’t craft its political ads to reference its own main aim to foster crypto, but it instead made ads based on whatever was the biggest political vulnerability it saw in opponents or positive points it noted in allies.
Fairshake has been very public about the $193 million war chest it started the campaign season with. The funds aren’t just an election tool. Crypto lobbyists and insiders have acknowledged that it also acts as a caution to sitting lawmakers weighing crypto legislation now moving through Congress. Members know that their decisions on crypto bills could bring either millions of dollars in support or opposition in their campaigns, often far exceeding the amount of money that congressional campaigns can raise from direct donors.
Fairshake doesn’t expect to win everything, but it does expect to win most of the races they get involved with, the person said, and it’ll make the point that opposing crypto innovation will be expensive for politicians.
Some candidates that Fairshake opposed in the past did go on to support crypto initiatives, but Stratton criticized the “MAGA-backed crypto bros” that opposed her. Her crypto intentions in the Senate, if she gets there, remain to be seen.
Read More: Crypto campaign PAC Fairshake marks first wins in 2026 U.S. congressional primaries


The prediction markets co-founder said that the company would “abide by court decisions“ but signaled that the charges were based partly on political bias and media attention.
Tarek Mansour, co-founder and CEO of prediction markets platform Kalshi, has pushed back against criminal charges filed by Arizona authorities this week, claiming that they were a “total overstep” and “not about gambling.”
On Tuesday, Arizona Attorney General Kris Mayes announced charges against the companies behind Kalshi, alleging that the company operated an “illegal gambling business in Arizona without a license” and offered illegal election wagering. Mansour said in a Wednesday Bloomberg interview that Mayes was attempting to “subvert the judicial process” by filing charges without a court decision in Kalshi’s own lawsuit against Arizona authorities last week.
“We see this as a total overstep and we look forward to fighting it in court,” said Mansour.
While Kalshi faces several similar cases filed by gaming authorities in other US states over the platform allegedly offering sports gambling to residents without a license, Arizona was one of the first to file criminal charges. The state-level cases come as prediction markets like Polymarket are under scrutiny by lawmakers for offering bets on US military actions, citing concerns about insider information in the government.
Related: Prediction markets boom on Iran bets as Congress eyes ban
Are prediction markets entirely under the CFTC’s jurisdiction?
Kalshi has been arguing in court that the US Commodity Futures Trading Commission (CFTC) has exclusive jurisdiction to oversee the company, rather than state authorities — a position reiterated by US President Donald Trump’s Senate-confirmed CFTC Chair Michael Selig.
“This is a jurisdictional dispute and entirely inappropriate as a criminal prosecution,” said Selig in a Tuesday X post. “The CFTC is watching this closely and evaluating its options.”
An Ohio judge last week denied a preliminary junction based on Kalshi’s CFTC argument. A Tennessee court blocked state authorities from enforcing gambling laws against Kalshi in February.
Magazine: Big Questions: Can Bitcoin save you from the dreaded Cantillon Effect?
This is a comparison of Wednesday’s Federal Open Market Committee statement with the one issued after the Fed’s previous policymaking meeting in January.
Text removed from the January statement is in red with a horizontal line through the middle.
Text appearing for the first time in the new statement is in red and underlined.
Black text appears in both statements.
The perpetuals exchange is promoting WLFI’s stablecoin as a trading asset ahead of the Aster Chain Layer 1 launch.
Aster, the decentralized perpetuals exchange backed by YZi Labs, is expanding its collaboration with World Liberty Financial, the DeFi project affiliated with the Trump family, adding USD1-denominated perpetual contracts and an incentive program aimed at bootstrapping stablecoin liquidity ahead of the platform’s Layer 1 launch.
The exchange is starting with BTC, ETH, and SOL pairs, with more than 10 additional pairs planned in the coming weeks. USD1 is also supported as a core margin asset and collateral equivalent to USDT, and Aster is offering zero maker fees and a 0.5-bps taker fee on USD1 pairs, an approximately 87.5% reduction compared to its standard 4-bps USDT taker fee.
Up to 2.5 million WLFI tokens will be distributed monthly through the USD1 perpetual trading incentive program based on trading activity, with rewards distributed weekly.
Donald Trump Jr., co-founder of World Liberty Financial, promoted the launch on X, saying, “This is how you scale stablecoin utility beyond just payments.”
“Aster Chain’s success depends on the depth of its underlying liquidity,” said Leonard, CEO of Aster. “By bringing USD1 into our core trading engine during this phase, we’re building the trading foundation for the Aster Chain launch.”
ASTER is trading at around $0.70, down 10% in the past 24 hours to a market cap of approximately $1.7 billion, per CoinGecko. WLFI is down 3.5% over the same period.

Aster originally launched as ApolloX in 2021 and rebranded following a merger with Astherus in December 2024. The platform is incubated by YZi Labs, previously Binance’s venture arm, and received a high-profile boost when Binance co-founder CZ began promoting it on X, sending its token on a roughly 40x run.
Aster is currently the second-largest perp DEX by open interest after Hyperliquid, according to DeFiLlama, and recently launched the genesis phase of Aster Chain, a privacy-focused Layer 1 that uses ZK proofs to keep trades private by default.

FOMC Leaves Interest Rates Steady at March Meeting

Labour Should Pledge EU Reentry Says Sadiq Khan

The Countdown to Bitcoin’s Next Face Melting Rally Has Begun!


-
 Crypto World5 days ago
HYPE Token Enters Net Deflation as HyperCore Buybacks Outpace Staking Rewards
-

 Tech3 days ago
Your Legally Registered ‘Motorcycle’ Might Not Count Under Proposed US Law
-

 Fashion5 days ago
Weekend Open Thread: Addict Lip Glow
-
Sports4 days ago
Why Duke and Michigan Are Dead Even Entering Selection Sunday
-
 Tech1 day ago
Are Split Spacebars the Next Big Gaming Keyboard Trend?
-

 Business3 days ago
Search for Savannah Guthrie’s Mother Enters Seventh Week with No Arrests
-

 Business4 days ago
US Airports Launch Donation Drives for Unpaid TSA Workers as Partial Government Shutdown Enters Fifth Week
-
Crypto World4 days ago
Coinbase and Bybit in Investment Talks: Could Bybit Finally Enter the US Crypto Market?
-

 Business4 days ago
Country star Brantley Gilbert enters growing non-alcoholic beer market
-

 Business2 days ago
Australian shares drop as Iran war enters third week
-

 Crypto World2 days ago
Crypto Lender BlockFills Enters Chapter 11 with Up to $500M in Liabilities
-

 Sports5 days ago
College Basketball Best Bets: Conference Tournament Semifinal Picks
-

 Politics12 hours ago
The House | The new register to protect children from their abusers shows Parliament at its best
-

 Crypto World7 days ago
Three Binance Charts May Be Hinting at Bitcoin’s Next Move
-

 Business6 days ago
Trump demands Powell cut rates as Iran conflict raises energy prices
-

 Crypto World6 days ago
Senate Votes to Include CBDC Ban in Bipartisan Housing Bill
-

 Fashion2 days ago
25 Celebrities with Curly Hair That Are Naturally Beautiful
-

 News Videos5 hours ago
RBA board divided on rate cut, unusually buoyant share market | Finance Report | ABC NEWS
-

 NewsBeat6 days ago
Deane Road crash near Bolton colleges and university
-

 News Videos6 days ago
Tom Lee: The 100x Opportunity EVEN Bigger Than Bitcoin (New Ethereum Prediction 2026)


You must be logged in to post a comment Login